
Forecasts of the Compound Coastal Erosion Risks Based on Time-Variant Assessment: A Case Study on Yunlin Coast, Taiwan

Department of Harbor and River Engineering, National Taiwan Ocean University, Keelung 202, Taiwan
*
Author to whom correspondence should be addressed.
Sustainability 2022, 14(21), 14505; https://doi.org/10.3390/su142114505
Submission received: 12 September 2022
/
Revised: 25 October 2022
/
Accepted: 3 November 2022
/
Published: 4 November 2022
(This article belongs to the Special Issue Sustainable Coastal Management and Engineering)
Abstract
:A coastal erosion risk assessment was framed as the basis for the intervention of coastal adaptation strategies under time-variant scenarios. The framework was devised to assess the influence of coastal erosion on coastal defense, the coastal inundation induced by the erosion-induced malfunction of defense, and risks using a downscaling analysis and the mechanism of the compound hazard interaction, which are innovative and practical for the application of coastal management in Taiwan. In addition, the vulnerable socio-economy was also taken into consideration in risk assessment. The adaptive strategy is proposed in terms of the risk origins and time-variance of risk forecasts, and the risk origins were assessed based on the Fuzzy Delphi Method and the analytic hierarchy process instead of subjective consideration. Within the erosion-induced hazard and risk assessments, this study considered erosion rates, decreases in defense elevation due to land subsidence, and population development in time-variant scenario analyses to estimate risk forecasts. Furthermore, a case study of the Yunlin coastal area was undertaken to demonstrate the feasibility of the proposed method. The presented results are informative for coastal hazard reduction and the promotion of the sustainable development of coastal zones.
1. Introduction
Coastal zones are some of the most dynamic environments due to the interactions between different geospheres over a range of timescales that cause dynamic coastal rebuilding, which is referred to as coastal morph dynamics (Łabuz, 2015) [1]. The influential factors of interaction can generally be divided into two groups: Natural and anthropogenic. Anthropogenic factors have exerted significant effects on the coastal zone in Taiwan, which has a dense population but scarce land, since the 1970s when industry and commerce vigorously developed and abundant business activities ensued. During this period, many coastal defense facilities were constructed to protect the livelihood and properties of the populations against natural hazards. However, anthropogenic developments protruding from the coastline have been gradually disturbing and impeding the sediment supply, which has led to more serious coastal erosion and the decreasing capability of the buffer zone to dissipate waves. Relevant authorities have not yet taken responsibility and considered specific principles to compensate for several decades worth of erosion, which has led to the increased seriousness and complexity of the hazard.
1.1. The Background of the Coastal Management in Taiwan
Following the enactment of Agenda 21, which was proposed by the 1992 United Nations Conference on Environment and Development, and the adoption of the concept of integrated coastal zone management (ICZM) (United Nations, 1992), the Ministry of Interior has finally begun to enact policies and stipulations to meet the demand for coastal management in Taiwan [2]. The Coastal Management Act and the Integrated Coastal Zone Management Plan were enforced in 2015 and 2017, respectively (MOI, 2015 and 2017) [3,4]. These frameworks are intended to advocate for the prevention of coastal hazards and promote the application of coastal management. The Coastal Management Act designates coastal erosion, storm surge, flooding inundation, and land subsidence as the four statutory coastal hazards for which the Integrated Coastal Zone Management Plan (ICZMP) specifies the grading principles in terms of the physical impact of coastal hazards; it also designates first- and second-grade coastal protection zones based on the severity of hazards in coastal cells, though it does not consider the interaction between compound hazards. First-grade coastal protection zones are exposed to hazards, especially storm surges, coastal erosion, and land subsidence. The length of the coastal protections is zoned from approximately 11 to 75 km within this hazard grading, and the authority of each segment proposes corresponding reduction strategies (MOI, 2021) [5].
Although the coastal classification management system has been established, the coastal protection zones are of a large scale and the spatial distribution of hazard impacts cannot be precisely illustrated in diverse environments. Additionally, the deterioration of coastal defense due to erosion should also be considered in terms of buffer zones. In this sense, when the width of a buffer zone is decreased, increasing wave loads will affect the coastal defense, the foundations of which are consequently exposed and thus rendered unstable (Temmerman et al., 2013) [6]. That is to say when overtopping flow increases, the probability of a defense malfunction is significantly increased (Mehrabani and Chen, 2017) [7]. For example, many shorelines have suffered from coastal erosion, which led to defense malfunctions after the invasion of typhoon Fanapi in 2010. When the defense malfunctions, a storm surge can easily damage the property behind it. In other words, the impact of storm surge hazards generally does not directly damage property under the protection of a functional defense, but erosion-induced damage does lead to direct impacts and is difficult to prevent.
1.2. Risk Assessment of Coastal Area
Risk is the potential for consequences when something of value is at stake and the outcome is uncertain. Risk is often represented as the probability of the occurrence of hazardous events or trends multiplied by the impacts following the occurrence of these events or trends (IPCC, 2014b) [8]. Therefore, risk assessment is one of the primary quantification methods used to classify future severity under resource constraints. Coastal risk management is also used to aid protection countermeasures against hazards from the uncertainty of climate change (CPSL Third Report, 2010) [9]. Since the US Geological Survey (USGS) formulated a coastal vulnerability index (CVI) (Thieler and Hammar-Klose, 1990; Pendleton et al., 2004; Irham et al., 2021) [10,11,12], relevant calculations have been applied to evaluate worldwide vulnerability with equal weights. Boruff et al. (2005) [13] examined the vulnerability of US coastal counties in terms of maximum wave height, shoreline erosion rates, and landform susceptibility to inundation, as well as ten coastal social vulnerability indexes, to quantify vulnerability distribution. The hazard wheel employed by Appelquist and Balstrøm (2014) [14] considered geological layout, wave exposure, tidal range, flora/fauna, sediment balance, and storm climate, and it was used to assess multiple coastal hazards in the state of Djibouti. Wang (2014) [15] presented a comprehensive assessment strategy based on the risk matrix approach (RMA), including two aspects that were further composed of five second-class indicators: The first aspect, the probability phase, consisted of indicators of economic conditions, social development, and living standards; the second aspect, the severity phase, comprised geographic exposure and natural disasters. Moreover, this study weighted all of the indicators by applying the analytic hierarchy process (AHP) and Delphi Method to analyze the risk indices of 50 coastal cities in China. In addition, the shoreline change was an important element in the coastal risk assessment, facilitating the result of the risk prediction to be more meaningful for the ICZM (Park and Lee, 2020) [16]. In brief, although the risk assessment frameworks and factors are globally distinct, risk assessments are universally used to consider hazard potential and consequent vulnerability from local perspectives. Therefore, after risk assessment, corresponding countermeasures can be enacted.
The Sendai Framework for Disaster Risk Reduction 2015–2030 (United Nations, 2015) [17] proposed strategies under a people-centered approach and outlined four priorities for action: (1) Understand disaster risk, (2) strengthen disaster risk governance to manage disaster risk, (3) invest in disaster risk reduction for resilience, and (4) enhance disaster preparedness for effective response and “Build Back Better” for recovery, rehabilitation, and reconstruction. Since the SFDRR was initiated, the implementation of risk assessment has increased with an annual growth percentage of 15.9%, which implies an increase in research on SFDRR during 2015–2019 (Busayo et al., 2020) [18]. However, the level of coastal risk was predicted to increase if the trend of world climate change was not mitigated, and the distribution of hazardous hot spots and the damage probability of property would be increased in the region (Bruno et al., 2020) [19]. Therefore, risk assessment considering the relevant hazards and the vulnerability of human beings is a current cornerstone for quantifying threats and reducing disaster risk. Consequently, this type of assessment may be seen as a holistic control loop that consists of a number of interacting elements or tasks involving a comprehensive set of measures designed to either reduce or avoid vulnerability to coastal hazards (CPSL Third Report, 2010) [9]. In general, risks are expected to change over time due to deterioration processes (Mehrabani and Chen, 2017; Park and Lee, 2020; Bruno et al., 2020) [7,16,19]. Thus, this study aimed to comprehensively quantify the reduction principle of coastal erosion risk and discuss time-variant impacts.
1.3. Adaptive Strategy
The United Nations Framework Convention on Climate Change (United Nations, 1992) [20] proposed three categorized adaptive strategies for coastal areas: Protection, accommodation, and retreat. These strategies have been used in coastal mitigation measures and applied worldwide. In Taiwan, according to the ICZMP (MOI, 2021) [5], the protection strategies comprise preventive and contingency measures corresponding to the hazard potential under protection design criteria, including the maintenance of defense and the monitoring of coastal bathymetry changes. The accommodation strategy comprises disaster reduction and prevention for each coastal area, e.g., by improving the completeness of early warning systems and limiting land use, and it is constantly employed to reduce the risk of social vulnerability. However, if the protection and accommodation strategies cannot mitigate a hazard or enact a protective effect, the retreat strategy can be used to avoid damage. However, the rights and interests of relevant stakeholders should be seriously considered and the government must engage in multifaceted communication and coordination before enacting retreat management. In risk management, adaptive strategies are implemented following the orientation of the government and appropriate protection resources (Xian et al., 2018) [21]. Although adaptive strategies are specific to each area, relevant authorities must ultimately consider and study more resilient mitigation strategies against the overall challenge of global climate change. Ultimately, an adaptation strategy involves education, policy, and technology, among other aspects, and the promotion of these strategies must be appropriate for the considered risk, incorporated into project design, implemented, maintained and/or monitored, and arranged to work in the long term (Pathak et al., 2021; IPCC AR6, 2021) [22,23]. That is to say, adaptive management would require a long-lasting process based on social capacities, including resilient institutions, the multilevel governance system, and ecosystem services; in particular, it must be sure to take the local stakeholders’ perceptions into account in the implementation of coastal management (Jacob et al., 2021; Takyi et al., 2022; Frohlich et al., 2022; Lin et al.) [24,25,26,27].
In Taiwan, although the grading principles have been applied to erosion hazards, the mechanism of erosion-induced risk and the relevant adaptive strategies still need to be refined due to the extensive scope of the protection zone. The units of the coastal protection zone and hazard-prone zones are too large in scale to enable the precise allocation of conservation resources. Therefore, this study devised an assessment with a downscaling principle that considers the influence of coastal erosion on coastal defense, coastal inundation induced by erosion-induced defense malfunctions, and coastal erosion risk. For example, the erosional coast sector was often designated by the coastal cells, from river to river or river to headland. The erosion hazard prone was regarded with the same grading with a scale of kilometers without the management priority within the diverse environment. Therefore, this study assessed the erosion hazard, risk, and corresponding adaptive strategy within the sectors of coastal defenses to clarify the hazard hotspots and the hierarchical management. The erosional coast sector scale was defined as ranging from the coastal cell to the entire length of the coastal defense and the length scale was defined as kilometers to meters in order to quantify hazards and risks in more detail. Furthermore, this study not only assessed the impact of hazards on the vulnerable socio-economy of coastal villages in terms of humans but also assumed a time-variant risk scenario. Accordingly, such a time-variant scenario assessment can be used to aid resource allocation for coastal adaption in the long term to protect property and environmental resources and achieve the goal of sustainable development. In this study, a case study on the coastal areas of Yunlin County, Taiwan, was conducted, and time-variant risk under the adaptive strategy was estimated. Its comprehensive quantification enables the risk assessment to be of practical use in the long term for developing adaptive strategies for sustainable coastal management.
2. Materials and Methods
To estimate how a coastal erosion hazard will endanger a coastline and to quantify how the degrees of risks will be distributed, this study proposes a method to clarify the distribution of erosion and determine the functionality of coastal defenses in an erosional coast sector. Then, a scenario analysis of erosion-induced inundation can be implemented to analyze the inundation degree after the coastal defense is breached. This study then proposes the use of a risk assessment process for hazard and vulnerability (UNDRO, 1979) [28] to appropriately manage coastal zones.
2.1. Study Area
Yunlin County is located in midwestern Taiwan between the Zhuoshui River and the Beigang River. Due to its environmental resources, Yunlin County provides plenty of agricultural and fishery products to Taiwan. There are four townships in the coastal area (Mailiao, Taixi, Sihu, and Kouhu townships) and the shoreline is armed with fifteen coastal defenses. In the early stages of defense implementation, there were many sandbars along the Yunlin coast because the Zhuoshui River provided sufficient sediment sources. The buffer zone width was 3~4 km, which was a natural barrier to prevent the waves from attacking the coast. However, sediment transport has changed since the reclamation of the Yunlin Offshore Industrial Park (YOIP), which interrupts sediment transport due to its dominant direction from NE to SW; this has increased erosion impacts in the downstream area. Under the degradation of the buffer zone and the annual invasion of typhoons, the Santiaolun seawall (south section) has had the most broken records of coastal defenses during the typhoon season in the last few decades. The broken records of the Xinxing tidal seawall and the Taizi Vil seawall are fewer than those of the Santiaolun seawall (south section). According to the Integrated Coastal Zone Management Plan (MOI, 2017) [4], the Yunlin coastline has been designated as a first-grade coastal protection zone because of hazards including storm surges, coastal erosion, and ground subsidence, as shown in Figure 1a.
Especially in surge-prone areas, the Yunlin coastline was analyzed in terms of the elevation difference between shore lands and storm surges in the absence of coastal defenses, which designated it a maximum-risk area. The analysis of the surge-prone areas of coastal Yunlin demonstrated that the Yunlin coast has a wide inundation-prone scope and an inundation depth of more than 1 m. The surge-prone areas are shown in Figure 1b. Though the functionality of coastal defenses was found to be adequate against current wave and tidal levels (Water Resources Planning Institute (WRPI), 2014) [29], the decreased width of the buffer zones will inhibit the coastal defense and lead to breaches of areas under the threat of coastal erosion. In other words, storm surges will not affect the coastal area, which is protected by a fine defense mechanism, but the impacts of coastal erosion and land subsidence will lead to sophisticated hazards that will be followed by storm surges during typhoon invasions. The erosion-induced compound hazards will damage the coastal area and further increase the risk. Consequently, this study aimed to downscale the assessment with a focus on the erosional coast section with higher hazard or vulnerability levels for the promotion of risk management.
2.2. The Assessments of Coastal Erosion and the Mechanism of Erosion-Induced Hazard
In order to clarify the potential distribution of erosional coast sectors, this study applied a two-phase approach: Shoreline change analysis and volumetric analysis. Shoreline change analysis is a major approach used to classify erosional coast sectors into vertical control sections of the shoreline at an interval of 500 m. Change rates of 0 m isobaths at two different measurement times were calculated. Positive change rates mean the shorelines are undergoing trends of accretion and negative change rates mean that the shorelines are under threat of coastal erosion. Furthermore, if the change rates are close to zero and the 0 m isobaths are located near the coastal defenses, then the coastal sectors require further evaluation to quantify their underwater hazard potential because the buffer zone is insufficient such that erosion may have already harmed the foundation of the coastal defense. In this sense, to ensure that the change rates are close to zero regardless of the existence of erosional hazards, volumetric analysis can be employed to determine the potential of underwater bathymetric change by subtracting the bathymetries at two different measurement times. The volume change of each section can be estimated between high tidal levels and the closure depth (the most intensive bathymetric change area) with Houston’s formula (Houston, 1996) [30] to differentiate the change potential trends in terms of the total amount of each section unit.
Coastal erosion will increase the depth in front of coastal defenses and will scour the foundation of coastal defense, thus increasing the probability of hazardous damage. Therefore, to ascertain the safety of coastal zones, this study proposed a functionality assessment for erosional coast defense to assess the impacts and defense capability under the threat of coastal erosion. In Taiwan, the design life of coastal defenses is approximately fifty years. Thus, this study used the wave conditions in fifty-year recurrence periods as the boundary condition to review the functionality of coastal defenses in the erosional coast sector, which are designed to be cost-effective for their entire lifetime (Toimil et al., 2019) [31]. The functionality assessment of defense in the erosional coast sector includes wave run-up, overtopping flow, and stability evaluation of blocks in scenario analysis of the current state, as well as erosion estimation.
According to TAW (2002) [32], the parameters of the significant wave height and wave period can be calculated based on the numerical simulation results of nearshore wave fields in fifty-year recurrence periods. Considering the impact of erosion, to estimate whether wave conditions will exceed a protection standard, the maximum wave run-up and the discharge of overtopping flow can be used to interpret the defense capability under the current state (de Waal and van der Meer, 1994) [33]. Although the breaking wave height and discharge of overtopping flow will increase during coastal erosion, numerical simulations are unable to accurately infer the significant wave height and wave period due to the absence of erosional bathymetry data. Therefore, this study used a limited breaking wave formula (McCowan, 1894) [34] to calculate the breaking wave height via five-year bathymetric changes as the wave boundary condition in front of the coastal defense.
To estimate the discharge of overtopping flow in terms of erosional potential, the breaking wave height was input into the empirical formula of Van der Meer [33], which was used as one of the bases for evaluating the safety indicators of the coastal defense. Furthermore, the crest height of the coastal defense and the water depth in front of the coastal defense are changed by the impacts of land subsidence and coastal erosion, so they must be considered within time-variant scenario analyses. After estimating the height of wave run-up and the discharge of overtopping flow, it is essential to consider whether the discharge of overtopping flow is hazardous to the property and residents behind the defense. According to Goda (1992) [35], if the discharge of overtopping flow exceeds the threshold, the coastal defense may be breached or even destabilized. Thus, this study used overtopping flow discharge as the threshold for the functional inspection of coastal defense by Goda (1992) [35]. Under the increased effect of wave loads on the coastal defense due to coastal erosion, the stability of revetments significantly decreases. Generally, the stability evaluation of a revetment considers the required weight of the riprap or armor blocks. Following the work of PIANC (1992) [36], Hudson’s formulas were adopted in this study to determine the required weight of riprap or armor blocks. As a revetment tends to be destroyed by coastal erosion, the damage probability evaluation of a revetment can be used to propose a concrete protective strategy. Van der Meer and Pilarczyk (1985, 1987, 1988) [37,38,39] contended that the factors that affect the stability of revetments include the significant wave height, average period, and slope. A flowchart of the functionality assessment is shown in Figure 2.
2.3. Scenario Analysis of the Coastal Inundation Induced by Erosion-Induced Malfunction of Defense
In the extensively and homogeneously surge-prone Yunlin coastal area (shown in Figure 1), there are two aspects of coastal erosion that can lead to a higher probability of coastal defense malfunctions and can cause further coastal inundation: The absence of a buffer zone and the insufficient function of coastal defense. In these situations, human livelihoods and properties will be disastrously damaged following erosion-induced defense malfunctions. Therefore, this study proposed an analysis of inundation caused by erosion-induced defense malfunctions for two scenarios: One for the erosional coast sector, in which the 0 m isobaths are fixed by the coastal defense, and the other for the insufficient function of coastal defense regardless of the current state or erosion estimation. This study analyzed a scenario of coastal inundation induced by the malfunction of defense from coastal erosion in terms of the elevation difference between the heights of shoreland and 50-year tidal level recurrence periods, previously calculated as 2.64 m (Huang et al., 2018) [40], in order to analyze the significance of the inundation depth. For this analysis, the scope of coastal inundation was considered to be inherently compartmentalized by regional drainage due to the flood protection system.
2.4. The Coastal Erosion Risk Assessment
Under the influence of climate change, both routine hazard protection and future decision making must be based on risk information that is comprehensively quantified and understood. In 1979, the United Nations Disaster Relief Organization (UNDRO) conceptualized this kind of risk by assessing natural hazard impact and vulnerability. They defined natural hazard risk as the probability of the occurrence of natural phenomena and subsequent damage. The vulnerability was defined as the degree of loss of the studied elements or sets of such elements at risk of the occurrence of natural hazards. Both risk-affectedness/hazard and vulnerability are systemic and interconnected (Eckstein et al., 2021) [41]. The given magnitudes of hazard and vulnerability were set on a scale of 0 (no damage) to 1 (total loss) (UNDRO, 1979) [28]. However, a hazard may now be driven by not only natural factors but also more anthropogenic factors. Therefore, this study suggests that hazards be classified according to an integrated disaster index, regardless of whether the driven element originates from nature, humans, or both. In this study, vulnerability was regarded in terms of an index of the property or residents behind a defense in order to classify the extent to which susceptible areas will suffer and the resilience of their reactions.
Therefore, to quantify risk consciousness and distribution, this study proposed a risk assessment method for compound erosion-induced hazards, related social aspects, and resilience capability. Additionally, this study established a database of relevant hazard and vulnerability factors to improve the method’s applicability to local conditions. In terms of risk quantification, this study considered risk identification, risk classification, and risk evaluation to quantify the integrated hazard and vulnerability index. The levels of hazard and vulnerability were divided into five grades, as shown in the risk matrix presented in Figure 3. This study separated the hazard and vulnerability indexes into the three hierarchies shown in Figure 4. The Fuzzy Delphi Method (FDM) (Murray et al., 1985) [42] was employed to calculate the consensus value and the importance of each hazard and vulnerability factor to select the representative factors of the study area. In other words, the hazard and vulnerability factors (shown in Figure 4) would be converged according to their representative significance instead of the multiple and divergence factors. Within the anonymous questionnaire of the FDM, every factor was filled in the optimistic value and the conservative value, on a scale of 1 to 10. The triangular fuzzy numbers were built up from the lowest value, the geometric mean value, and the maximum value of the optimistic value and the conservative value, which were filtered using the value of two standard deviations. Triangular fuzzy numbers were adopted to assess whether the hazard and vulnerability factors come to a consensus value of representative significance (Jeng, 2009) [43]. According to the FDM, the consensus value of representative significance of 6 was taken as the threshold to adopt the representative factors.
Three commonly used classification methods were applied in the construction of the coastal hazard and vulnerability index: Qualitative analysis, quantitative analysis, and semi-quantitative analysis. Qualitative analysis, a narrative pattern, categorizes the severity and impact of words. Quantitative analysis is a type of classification used to obtain relevant data from statistical calculations. The semi-quantitative analysis combines qualitative and quantitative analyses to describe a risk degree through a practical number. Moreover, this study calculated the weight relationships between representative factors via the analytic hierarchy process (Saaty, 1971) [44]. The method was used to distinguish the weights of the most influential factors and facilitate the estimation of risk assessment. The AHP was used to organize the basic logic of the system by breaking down the problem into smaller constituent parts followed by simple pairwise comparisons to develop priorities in each hierarchy (Saaty, 1984) [45]. In the AHP, the representative factors in the same hierarchy were compared on a scale of 1 to 9 in the pairwise comparison matrix. Then, the conformity of the AHP questionnaire was quantified by the Consistency Index (C.I.) and the Consistency Ratio (C.R.). According to Saaty (Saaty, 2003) [46], the thresholds of the C.I. and C.R. were suggested to be less than or equal to 0.1 to identify the valid questionnaires for the weighting calculation. All in all, the risk is generated by the hazard and vulnerability indexes after the processes of identification, classification, and evaluation for risk management.
3. Results
3.1. The Assessment of Erosion Potential and the Functionality Assessment of Coastal Defense
The YOIP that protrudes from the coastline has consistently led to sand transport imbalances. The change rates in the north of the YOIP were found to be favorable, which means the coastline has accreted to the seaside. The change rates in the south were found to be negative due to the shortage of sediment supply caused by the groin effect. According to the shoreline change analysis, the shoreline change rates were from approximately 346 to 231 m/year in Yunlin, and the most drastic change rate was found between the Zhuoshui River and north of the defense of the YOIP due to the sediment supply from the estuary, as shown in Figure 5a. In conclusion, the potential shoreline change was divided by the YOIP. According to the shoreline change analysis, the shoreline change rates within the Xinxing tidal seawall were approximately −1.32–42.06 m/year, the shoreline change rates within the Taixi tidal seawall were approximately 0.11–6.34 m/year, and the shoreline change rates within the Xingang seawall were approximately −0.14–5.07 m/year. These three seawalls were confirmed to be erosional coast sectors. Additionally, the shoreline change rates of the Santiaolun seawall were found to be close to zero and the locations of the 0 m isobaths were shown to be near the coastal defense. The bathymetry erosion potential was further confirmed by the volumetric analysis, which revealed a bathymetric change indicating that the seabed still has erosional potential; therefore, the Santiaolun seawall (S50~S52) is under the threat of coastal erosion in the spaces between high tidal levels and the closure depth. The results of the volumetric analysis of the Santiaolun seawall are shown in Figure 5b.
The functionality assessment of defense was used to clarify the protection capacity from hazards. In the erosional coast sectors, the locations of the Xinxing tidal seawall and the Taixi tidal seawall were found to be in the shadow zone of the YOIP, so the wave energy was attenuated when waves diffracted to the front of the defenses during the fifty-year recurrence periods. Therefore, the incident wave heights were shown to be barely zero in the current state. Within the sectors of the Xingang seawall and the Santiaolun seawall, the incident wave heights were 1.27 m and 1.12 m, respectively, and the discharges of overtopping flows were below the allowable capacity of the fifty-year recurrence periods. Consequently, the erosional coast sectors of the Xinxing tidal seawall, Taixi tidal seawall, Xingang seawall, and Santiaolun seawall were confirmed to be functional in their current states. However, due to the impacts of coastal erosion, the more severe the change rates are, the greater the energy expended by waves on the defense without prior dissipation. Moreover, the elevations of coastal defense have simultaneously sunk due to land subsidence. Therefore, the crest height of the coastal defense and the depth in front of the defense were estimated in terms of the interaction between erosion potential and land subsidence. The crest heights of the coastal defenses sunk with the subsidence rates, which were estimated from the elevation change of the control points being set on the crest of the seawall (Huang et al., 2018) [40]. According to an analysis of the interaction between coastal erosion and land subsidence, the depths in front of the Xinxing tidal seawall, Taixi tidal seawall, Xingang seawall, and Santiaolun seawall sectors were estimated to reach −7.15 m, −4.15 m, −1.15 m, and −1.4 m, respectively, in the next five years. The incident wave heights within the sectors of the Xinxing tidal seawall and the Taixi tidal seawall will remain low due to the shielding effect, but the overtopping flow within the Santiaolun seawall and Xingang seawall sectors will increase in the five years. The discharges of overtopping flow within the Santiaolun seawall and Xingang seawall sectors were found to be 0.006 CMS/m and 0.003 CMS/m, respectively, which are permissible levels. The functionality assessment and stability evaluation results of the coastal defenses are shown in Table 1 and Table 2, respectively.
3.2. Scenario Analysis of the Coastal Inundation Induced by Erosion-Induced Malfunction of Defense
According to the functionality assessment and stability evaluation, the erosional coast sectors are safe in the current state but will evolve to be more hazardous in the future. In particular, in the erosional coast sectors where shorelines are located near the coastal defenses, the risk of erosion-induced hazard over the next five years is high and must be seriously considered. Therefore, this study conducted a scenario assessment for the erosional coast sectors in which the shorelines are located near the coastal defenses—the Santiaolun seawall and the Xingang seawall—in order to evaluate the potential of the worst-case scenario in which the coastal defenses are breached during a typhoon invasion and quantify how the coastal areas may suffer from coastal inundation. In contrast to the scenario shown in Figure 1b following the work of the ICZMP (MOI, 2017), this scenario assessment can aid in hierarchical management [4]. The length of the erosion-induced inundation coastline was converged to 4.2 km rather than the whole of Yunlin County; on the other hand, the protection priority of the coastal areas was obvious to be revealed.
This study analyzed erosion-induced inundation in terms of the elevation difference between shoreland and storm surges. The village district and the drainage system were found to partition the edge of the inundation, and the flood defense facilities were found to attenuate the impact of inundation. If the coastal defenses lose their function, the coastal areas behind the Santiaolun seawall and the Xingang seawall will be under more than 2 m of water due to the low elevations induced by land subsidence. In this sense, the Lunnan Village, Guanggou Village, and Gangxi Village areas must employ their pumping machinery, evacuation plans, etc., more cautiously. In conclusion, although the coastal defenses have been well-maintained, the coastal areas still need to systematically prevent the serious hazard scenarios induced by ongoing hazardous coastal erosion.
3.3. The Coastal Erosion Risk Assessment
According to the results of the anonymous FDM-based questionnaire, representative hazard factors include geophysical properties, wave energy, the shoreline change rate, front-defense facilities, and the width of the buffer zone. The factors of vulnerability include the facility type, elevation, population density, economic industry, land use, emergency shelter, and warning system. This study quantified the representative factors from approximately 0.0 to 1.0, with higher hazard/vulnerability factor numbers indicating more dangerous hazards or more damage-prone social aspects. However, if the factor concerns intervention, recovery, or resilience to the hazard, the quantified numbers are graded in the opposite direction.
Of the representative hazard factors, sediment particle size plays an important role in resisting the impacts of shoreline change under the effects of waves and tides. The geophysical property was classified into five levels according to sediment particle size. Wave energy was additionally shown to significantly impact the potential of shoreline change. In this study, the hazard levels of wave energy were categorized into three classes based on the long-term wave statistics by the Center Weather Bureau of Taiwan. The Qigu buoy, the nearest wave buoy to Yunlin County, was moderately graded. According to the ICZMP, the shoreline change rate can be divided into three levels to designate the grades of the coastal protection zones, and this classification principle of the shoreline change rate was also adopted in this study. Protection works dissipate the wave energy in front of the coastal defense and protect the foundation stability from hazards; therefore, each hazardous level is differentiated by the existence of protection work. The width of the buffer zone, which is the zone where a wave is shoaled and decreases in front of the coastal defense, comprises the sand bar and the intertidal zone. In this study, an interval of 25 m was used as a unit from the ICZMP to grade the hazard levels. The classifications of hazards are shown in Table 3. According to the AHP, the weights between the representative factors were calculated with the questionnaires after the verification of the consistency index and the consistency ratio. Among the weights of the hazard factors, the width of the buffer zone was found to dominate, and the shoreline change rate was found to be minor.
Among the representative factors of vulnerability, facility types and physical coastline compositions, e.g., concrete, ripraps, or natural materials, were shown to affect coastal protection. Among natural materials, windbreak forests were shown to be more sensitive to erosion and unable to firmly prevent land loss from erosion. Elevation was used to represent the inundation depth following the malfunction of coastal defenses during a typhoon invasion. The vulnerable levels of elevation were graded in intervals of 0.5 m to clarify the difficulty of humans escaping the area. The population density was used to contextualize casualties under hazardous conditions; if the population density of a village is high, more people will be injured by the hazard. Under hazardous conditions, high-capital economic industries usually undergo large-scale damage and require long recovery times, so the existence of the economic industry increases catastrophic probabilities. Land use was graded according to the frequency of human activity; thus, residential, commercial, and education areas were graded with the highest vulnerability levels. In addition to vulnerability risks, the emergency shelter and warning systems were found to be the factors able to reduce the risk of hazards. Therefore, their grading principles were distinct from those of other factors. Emergency shelters are usually accessible and safe. In Taiwan, school and administration activity centers are designated as priority emergency shelters. Therefore, whether emergency shelters are distributed or centered in villages was the basis of hazard resilience classification. Flood prevention volunteers and monitoring devices are the major instruments of warning systems, and a capable warning system can reduce damage and promote resilience. The classification of representative vulnerability factors is shown in Table 4. In the face of a compound hazard, elevation plays the most important role in the vulnerability index, followed by facility type.
3.4. The Integrated Compound Coastal Erosion Risk
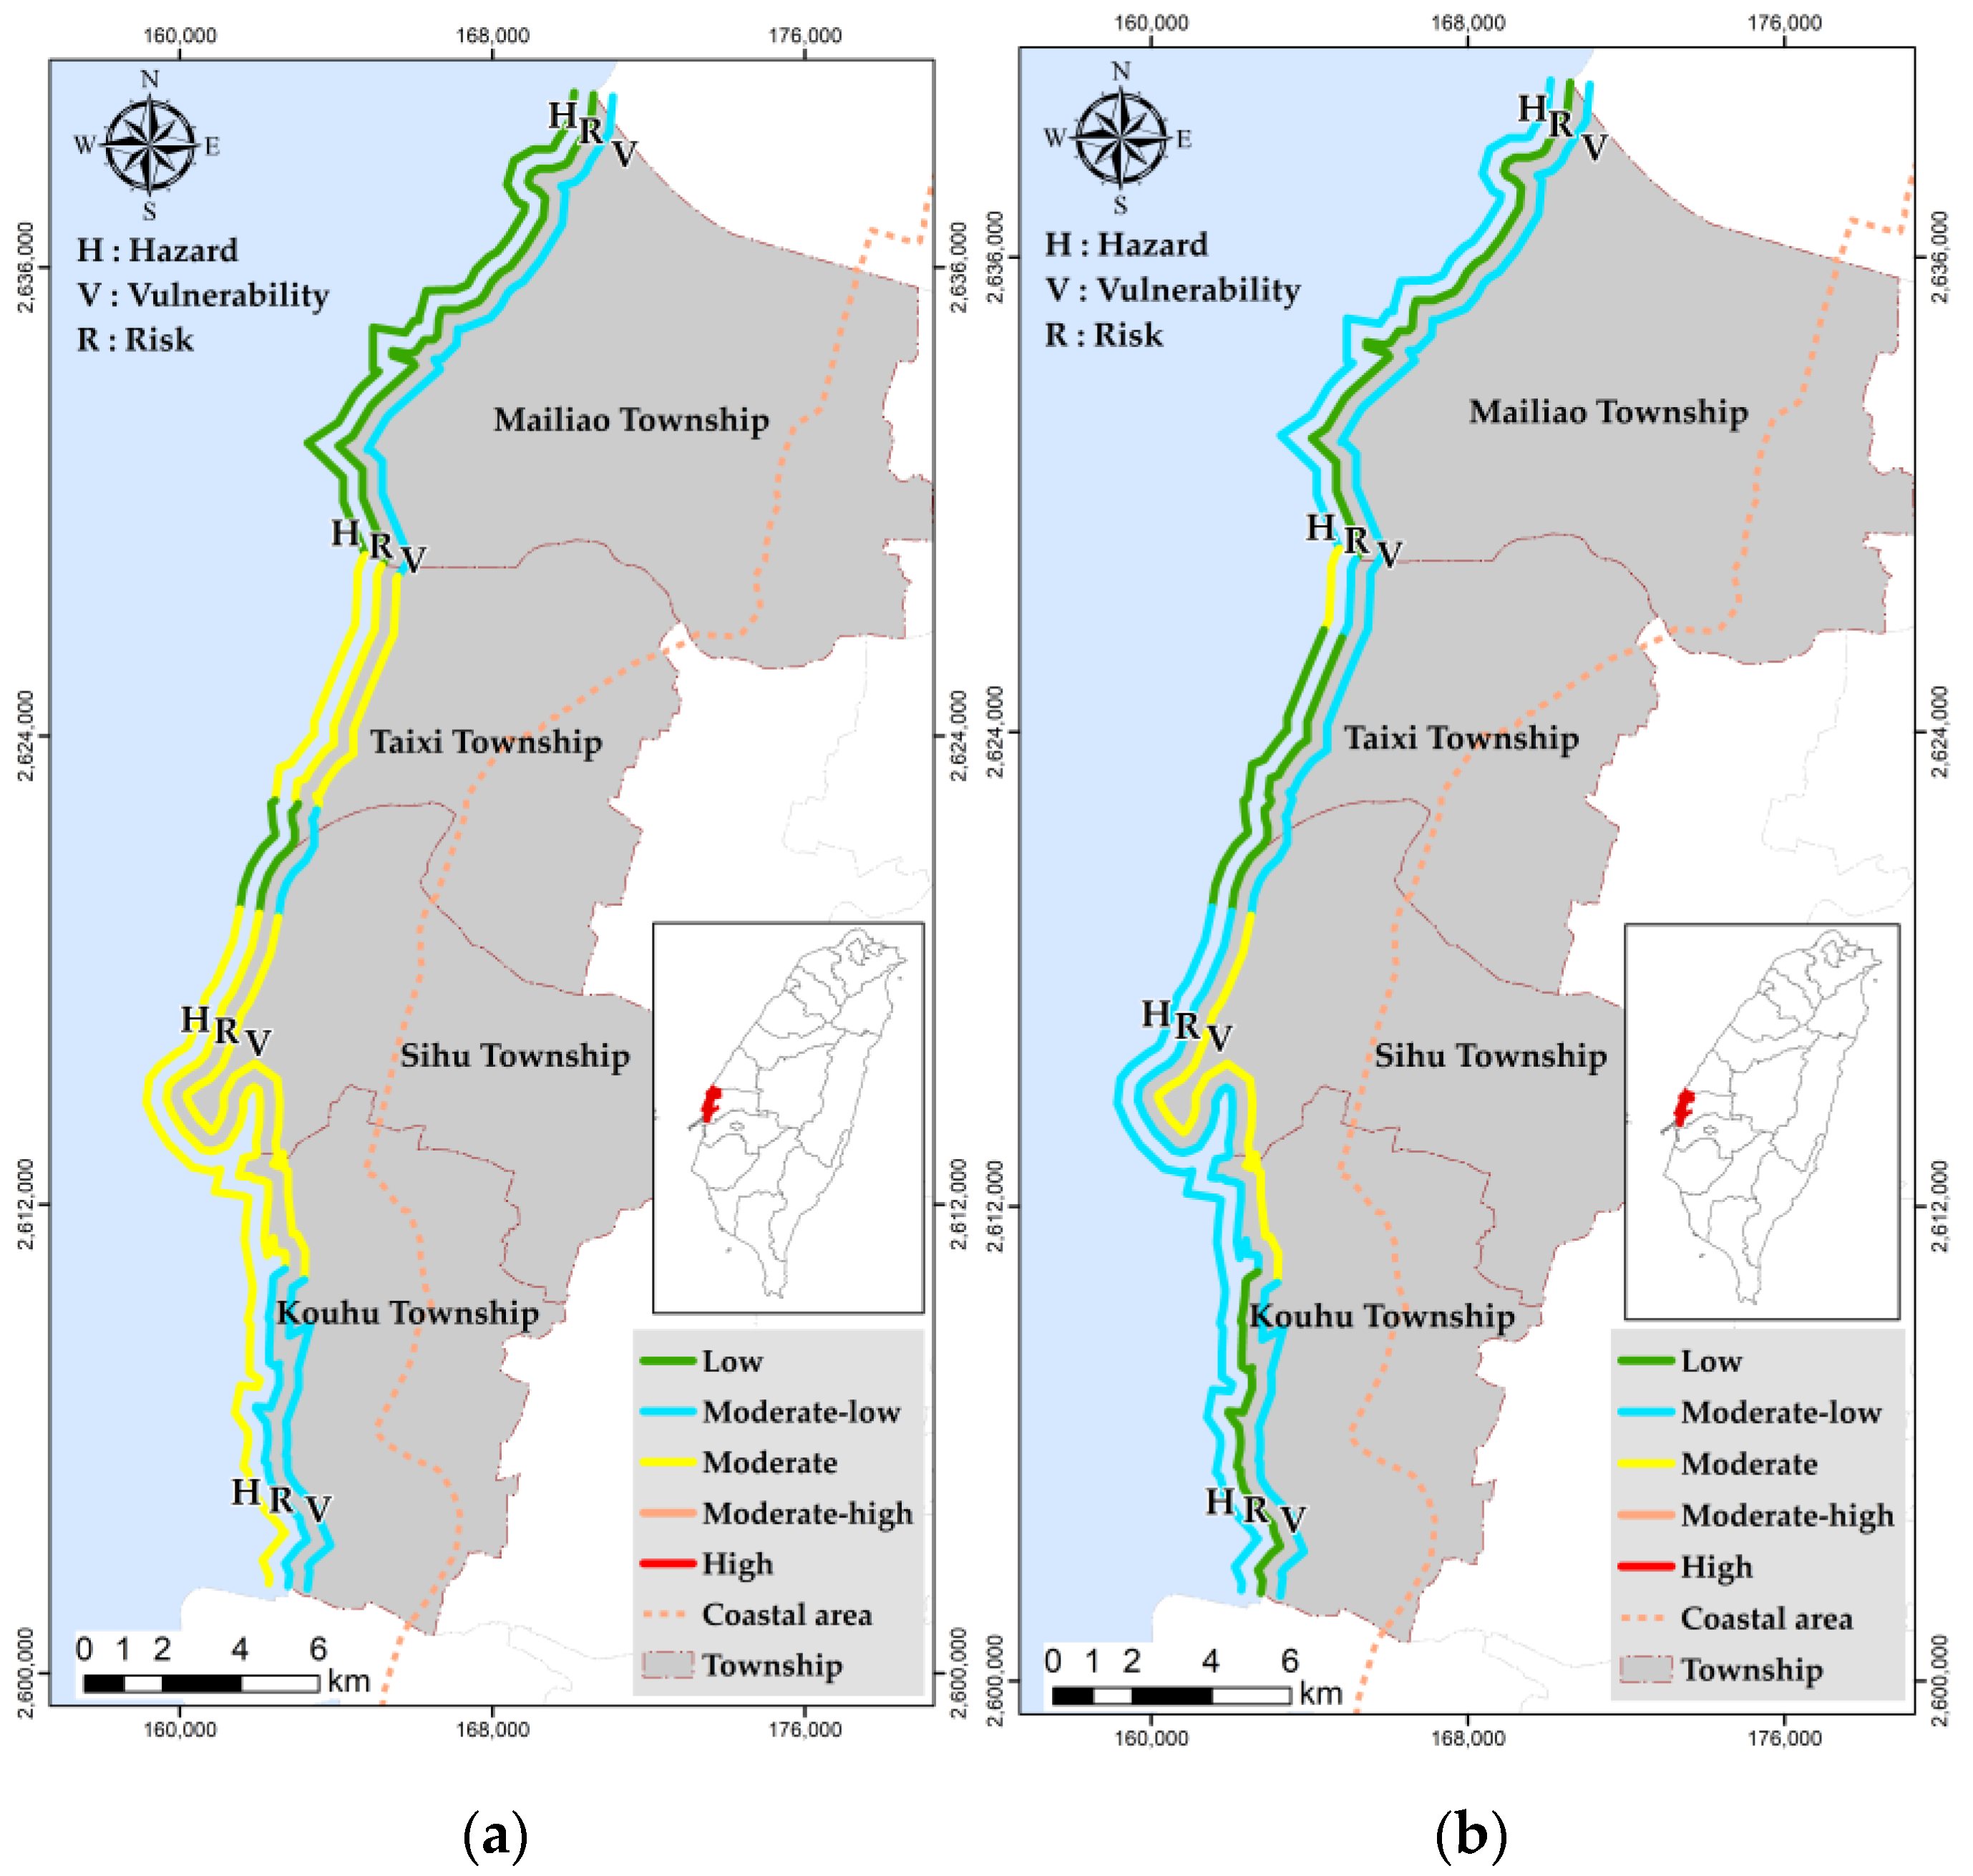
The score and weight of each factor were weighted as the integrated scores of the hazard and vulnerability indexes. The scores of the hazard and vulnerability indexes were divided into five degrees with an interval of 0.2. According to the hazard and vulnerability assessment, the hazard indices were of low-to-moderate grades in the study area and the vulnerability indices were of moderate–low-to-moderate grades. The compound coastal erosion risks were shown to be of low-to-moderate grades in the risk matrix. Due to the protrusions of the YOIP leading to an accretion trend, the northern sectors of Yunlin are safe. However, an insufficient sediment supply has caused more hazardous erosion in southern Yunlin, especially the coastal sector with a small buffer zone width. In other words, the hazard grades were found to primarily follow the mechanism of sediment transport. The Mailiao Township was assigned moderate-to-low grades in the vulnerability assessment because of its economic industry and land-use types, though its inundation elevation did not significantly impact its vulnerability. In the southern coastal town of Yunlin, the elevation, economic industry, and land use resulted in similar vulnerability grades, though its resilience factors also critically impacted its vulnerability index. Although emergency shelters are common in Yunlin, the area’s warning system is defective and its instant observation systems are not ubiquitous. Therefore, the southern coastal sectors of Yunlin are more vulnerable than the northern ones under erosion-induced malfunction scenarios. It was found that 73% of the Yunlin shoreline had a moderate hazard grade, 7% had a moderate-to-low grade, and 20% had a low grade. Furthermore, 66.7% of the study area was assigned a moderate vulnerability grade. The risk maps of Yunlin are shown in Figure 6.
In the erosional coast sectors, the Taixi tidal seawall was classified as moderate-to-low risk because of the moderate-to-low hazard grade and moderate vulnerability grade. The Xinxing tidal seawall and the Santiaolun seawall were classified as moderate risk due to the moderate hazard and vulnerability grades. The Xingang seawall was classified with a moderate-to-low risk grade because of its lower village population density, better warning systems, and emergency shelter capabilities, although it was assigned a moderate hazard grade. Additionally, the results of the hazard assessment were approximately correlated with sediment transport trends and broken records. In summation, the highest level of compound coastal erosion risk in the current state was of a moderate grade. However, considering spatial and temporal changes, not only the threat of erosion hazard but also the vulnerability variance must be considered indispensable issues in disaster reduction across the complete coastal risk management cycle.
3.5. The Adaptive Strategy of Erosion-Induced Risk
Previously, coastal protection resources were allocated according to hazard damage records and public petitions. However, under the proposed adaptive strategy, the representative factors and origins of risk in the erosional coast sectors of the study area are clarified and quantified, thus indicating new priorities for resource allocation. According to the erosion analysis and risk assessment, hazards are more severe in the southern coastal sectors compared with the northern sectors, and the hazard risks identically vary according to the mechanism of sediment transport. For Yunlin, the adaptive strategy aimed to reduce erosion potential, the primary origin of risk, and areas vulnerable to damage and increase resilience capacity. In sustainable development, the YOIP is responsible for returning the continuity of sediment transport, as designated by Article 14 of the Coastal Management Act. Therefore, the YOIP must transport the sand supply downstream from the sediment and establish an investigation database for routinely surveilling the shoreline change rate and volume under a protection strategy.
Additionally, the vulnerability assessment presented in this study demonstrated that the southern township has an insufficient resilience capacity. Therefore, villages behind the erosional coastal sectors must prioritize improving their warning systems and prevention facilities regardless of the impacts of erosion-induced risk or climate change, especially in the erosional coast sector with 0 m isobaths located near the coastal defenses. Furthermore, this study recommends maintaining the existing agricultural land use and avoiding urbanization in order to mitigate the vulnerability risk. The adaptive strategies proposed in this study must consider the risk origin in order to estimate residual risks. Most erosional coast sectors are exposed to insufficient sediment supplies and lack resilience capacity. Therefore, this study assumed that buffer zone widths are extended by sand supplies and warning systems, and emergency shelter equipment should be maintained and procured. As the risks of hazard and vulnerability decrease, the risk of erosional coast sectors decreases to moderate-to-low, low, moderate-to-low, and low. The corresponding adaptive strategies for erosion-induced risk in the erosional coast sector are described in Table 5.
4. Discussion
This study explored erosion-induced hazards and comprehensive risk assessments to propose an efficient management strategy using a reasonable and systematic process. The analysis of erosion-induced inundation revealed the extent of hazardous sectors in contrast to the already-established, unprioritized protection zones. Particularly, agricultural areas were shown to need precise resource allocations. Furthermore, risk assessment, rather than subjective consideration, was used to illustrate the origins of every sector. In this study, the hazard and vulnerability analysis revealed that the Mailiao Township (in the upstream coastal sector of sediment transport) has fewer erosion hazards but a high urbanization rate that may be risky in the future. On the other hand, the Taixi, Sihu, and Kouhu Townships (in the downdraft coastal sectors of sediment transport) were shown to have high hazard risks due to coastal erosion, though rural land use and low population densities decreased their vulnerability risk. However, due to the time-variant hazard impact and societal developments, the coastal erosion risk of these areas will change. Therefore, this study considered two scenarios, one with no adaptive strategy and one with an adaptive strategy, in terms of the integrated time-variant impact of coastal erosion and population development.
According to current population development trends of the National Spatial Planning of Yunlin County (Yunlin County Government, 2021) [47], the total population of the county will remain at 680,000 in the near future (A.D. 2036), but the population will significantly age. The population of Mailiao Township will increase by 0.72% due to the rising employment of the YOIP. The population of the other three seaside townships—Taixi, Sihu, and Kouhu Townships—will decrease by 0.35%, 0.27%, and 0.25%, respectively (Yunlin County Government, 2021) [47]. Nevertheless, the vulnerability risk grades will not dramatically fluctuate following the reordering of the population density in the Yunlin coastal area. The population densities of the coastal areas will remain relatively lower than those of the urban areas.
Generally, without the reduction strategy intervention, the grades of hazard risks will persistently worsen following increasing coastal erosion under the influence of exacerbated wave energy from the impact of climate change (Zhang et al., 2004; Ministry of Science and Technology, 2022) [48,49]. The hazard risks will be increased with decreasing buffer zone width under the impact of coastal erosion. In this scene, the hazard potential of the buffer zone was intensified in the future, with the assumption of a constant erosion rate. Therefore, in a scenario with no adaptive strategy, the hazard risk grades of the Xinxing tidal seawall and Taixi tidal seawall will be intensified due to the erosion-induced degradation of the buffer zone. The hazard risk grade within the Xinxing tidal seawall will be moderate and almost reach the moderate-to-high level. The hazard risk grade of the Taixi tidal seawall will increase to a moderate level. The hazard risk grades were comparatively steady within the sectors of the Santiaolun seawall and the Xingang seawall. The levels of vulnerability risks also remained at moderate to moderate-to-low in the scenario analysis of no adaptive strategy. Furthermore, the risk forecasts were based on the evaluation of the residual risk in the scenario analysis with an adaptive strategy. Owing to the adaptive strategy intervention, the trends of coastal erosion were mitigated by the sediment supply within the erosional coast sectors, and the levels of vulnerability risks were also reduced by the improvement of the warning systems. All in all, in the scenario analysis with an adaptive strategy, the levels of erosion risk would range from low to moderate-to-low, indicating that the adaptive strategy had a significant influence on coastal risk reduction. Risk maps under the aforementioned adaptive strategy scenarios are shown in Figure 7, and the risk forecasts of the hazard and vulnerability indexes in erosional coast sectors are shown in Table 6.
As a result, the erosion risk grades will decrease following the application of an adaptive strategy, and the protection and accommodation strategies have maintained the risk grades between low to moderate-to-low in time-variant development. Therefore, the use of an adaptive strategy will have vital benefits to comprehensive coastal zone management. Additionally, changes in the population structure will ensure that Yunlin County’s population will gradually age in the future. Consequently, relevant disaster education for inhabitants should consider the elderly, and information acquisition methods should be adopted to improve the effectiveness of the implemented strategies. Ultimately, according to the grades of Yunlin’s hazard and vulnerability risk, there is currently no need to plan for retreat management, but it is still necessary to review the changes in coastal risks and management measures. In summation, coastal risk management essentially comprises two types of activities: Taking prompt action in the face of an impending storm and long-term planning (Jager et al., 2017) [50]. Adaptive strategies are indispensable for risk management, which should be revised according to future spatial and temporal changes.
5. Conclusions
In this study, erosion risk assessments were used to evaluate the hazard and vulnerability conditions that affect the population and properties of the Yunlin shoreline. In other words, the subjectivity of stakeholders’ interpretation of hazards can be eliminated after systematically and scientifically quantifying hazards and vulnerability both currently and in time-variant risk forecasts. Nevertheless, erosion risk will change to a significant extent over time, so it is necessary to implement adaptive strategies and monitor coastal hazards and vulnerabilities in the future. Moreover, the overall resilience of communities can be improved to prevent coastal risk through post-disaster learning and re-examination.
Author Contributions
Conceptualization, W.-P.H. and C.-J.Y.; formal analysis, W.-P.H., C.-J.Y. and J.-C.H.; methodology, W.-P.H. and C.-J.Y.; resources, W.-P.H.; software, C.-J.Y. and J.-C.H.; supervision, W.-P.H.; visualization, W.-P.H. and C.-J.Y.; writing—original draft, W.-P.H. and C.-J.Y.; writing—review and editing, W.-P.H. and C.-J.Y. All authors have read and agreed to the published version of the manuscript.
Funding
The authors gratefully acknowledge the institutional support provided by the Water Resources Planning Institute, Taiwan, Contract No. 108-B-01070-001-001; and partly by the Ministry of Science and Technology, Taiwan, Project No. MOST 111-2625-M-019-003.
Institutional Review Board Statement
Not applicable.
Informed Consent Statement
Not applicable.
Data Availability Statement
Data are available within the article.
Conflicts of Interest
The authors declare no conflict of interest. The funders had no role in the design of the study; in the collection, analyses, or interpretation of data; in the writing of the manuscript; or in the decision to publish the results.
References
- Łabuz, T.A. Environmental Impacts—Coastal Erosion and Coastline Changes. In Second Assessment of Climate Change for the Baltic Sea Basin; Springer: Cham, Switzerland, 2015; pp. 381–396. [Google Scholar]
- United Nations Conference on Environment and Development. Agenda 21, Rio Declaration, Forest Principles; United Nations: New York, NY, USA, 1992. [Google Scholar]
- Ministry of the Interior. The Coastal Management Act; Ministry of the Interior: Taipei, Taiwan, 2015. [Google Scholar]
- Ministry of the Interior. The Integrated Coastal Zone Management Plan; Ministry of the Interior: Taipei, Taiwan, 2017. [Google Scholar]
- Ministry of the Interior. The Integrated Coastal Zone Management Plan—The First Overall Review; Ministry of the Interior: Taipei, Taiwan, 2021. [Google Scholar]
- Temmerman, S.; Meire, P.; Bouma, T.; Herman, P.; Ysebaert, N.T.; de Vriend, H. Ecosystem-based coastal defence in the face of global change. Nature 2013, 504, 79–83. [Google Scholar] [CrossRef] [PubMed]
- Mehrabani, B.M.; Chen, H.-P. Performance predictions of coastal defense using stochastic deteroration modelling. In Proceedings of the 1st International Conference on Uncertainty Quantification in Computational Sciences and Engineering, Rhodes Island, Greece, 15–17 June 2017; pp. 130–139. [Google Scholar]
- IPCC. Climate Change 2014: Impacts, Adaptation, and Vulnerability. Part B: Regional Aspects. In Contribution of Working Group II to the Fifth Assessment Report of the Intergovernmental Panel on Climate Change; Cambridge University Press: Cambridge, UK; New York, NY, USA, 2014; p. 688. [Google Scholar]
- CPSL. CPSL Third Report. The role of spatial planning and sediment in coastal risk management. In Wadden Sea Ecosystem No. 28. Common Wadden Sea Secretariat, Trilateral Working Group on Coastal Protection and Sea Level Rise (CPSL); CPSL: Wilhelmshaven, Germany, 2010. [Google Scholar]
- Thieler, E.R.; Hammar-Klose, E.S. National Assessment of Coastal Vulnerability to Sea-Level Rise: Preliminary Results for the U.S. Atlantic Coast. In U.S. Geological Survey Open-File Report; U.S. Geological Survey: Reston, VA, USA, 1990; pp. 99–593. [Google Scholar]
- Pendleton, E.; Thieler, E.; Williams, S.J.; Beavers, R. Coastal Vulnerability Assessment of Padre Island National Seashore (PAIS) to Sea-Level Rise. In U.S. Geological Survey Open-File Report; U.S. Geological Survey: Reston, VA, USA, 2004. [Google Scholar]
- Irham, M.; Rusydi, I.; Haridhi, H.A.; Setiawan, I.; Ilhamsyah, Y.; Deli, A.; Rusdi, M.; Siregar, A.M. Coastal Vulnerability of theWest Coast of Aceh Besar: A Coastal Morphology Assessment. J. Mar. Sci. Eng. 2021, 9, 815. [Google Scholar] [CrossRef]
- Boruff Bryan, J.; Christopher, E.; Cutter Susan, L. Erosion Hazard Vulnerability of US Coastal Counties. Coast. Res. 2005, 21, 932–942. [Google Scholar] [CrossRef] [Green Version]
- Appelquist, L.R.; Balstrøm, T. Application of the Coastal Hazard Wheel methodology for coastal multi-hazard assessment and management in the state of Djibouti. Clim. Risk Manag. 2014, 3, 79–95. [Google Scholar] [CrossRef] [Green Version]
- Wang, G.; Liu, Y.; Wang, H.; Wang, X. A comprehensive risk analysis of coastal zones in China, Estuarine. Coast. Shelf Sci. 2014, 140, 22–31. [Google Scholar] [CrossRef]
- Park, S.-J.; Lee, D.-K. Prediction of coastal flooding risk under climate change impacts in South Korea using machine learning algorithms. Environ. Res. Lett. 2020, 15, 094052. [Google Scholar] [CrossRef]
- The United Nation. Sendai Framework for Disaster Risk Reduction 2015–2030. In The Third United Nations World Conference on Disaster Risk Reduction; The United Nation: New York, NY, USA, 2015. [Google Scholar]
- Busayo, E.; Kalumba, A.; Mukalazi Afuye, G.; Ekundayo, O.; Orimoloye, I. Assessment of the Sendai framework for disaster risk reduction studies since 2015. Disaster Risk Reduct. 2020, 50, 101906. [Google Scholar] [CrossRef]
- Francesca, B.M.; Alessandra, S.; Gianluca, M.M.; Leonardo, D. The DPSIR Approach for Coastal Risk Assessment under Climate Change at Regional Scale: The Case of Apulian Coast (Italy). J. Mar. Sci. Eng. 2020, 8, 531. [Google Scholar]
- United Nations. United Nations Framework Convention on Climate Change. 1992. Available online: https://unfccc.int/resource/docs/convkp/conveng.pdf (accessed on 9 May 1992).
- Xian, S.; Yin, J.; Lin, N. Oppenheimer Micheal. Influence of risk factors and past events on flood resilience in coastal megacities: Comparative analysis of NYC and Shanghai. Sci. Total Environ. 2018, 610, 1251–1261. [Google Scholar] [CrossRef]
- Pathak, A.; van Beynen, P.E.; Akiwumi, F.A.; Lindeman, K.C. Impacts of climate change on the tourism sector of a Small Island Developing State: A case study for the Bahamas. Environ. Dev. 2021, 37, 100556. [Google Scholar] [CrossRef]
- IPCC. Summary for Policymakers. In Climate Change 2021: The Physical Science Basis. Contribution of Working Group I to the Sixth Assessment Report of the Intergovernmental Panel on Climate Change; Cambridge University Press: Cambridge, UK; New York, NY, USA, 2021; pp. 3–32. [Google Scholar]
- Céline, J.; Pascal, B.; Jérôme, D.; Mathieu, C. Not just an engineering problem: The role of knowledge and understanding of ecosystem services for adaptive management of coastal erosion. Ecosyst. Serv. 2021, 51, 101349. [Google Scholar]
- Richard, T.; El, M.B.; Ewusie, N.F.K.; Richard, A.; Mohamed, E.; John, E. Adaptive management of environmental challenges in West African coastal lagoons. Sci. Total Environ. 2022, 838, 156234. [Google Scholar]
- Frohlich, M.; Smith Timothy, F.; Fidelman, P.; Baldwin, C.; Jacobson, C.; Carter, R.B. Towards adaptive coastal management law: Lessons from Australia and Brazil. Ocean. Coast. Manag. 2022, 219, 106057. [Google Scholar] [CrossRef]
- Lin, L.-Y.; Lin, C.-T.; Chen, Y.-M.; Cheng, C.-T.; Li, H.-C.; Chen, W.-B. The Taiwan Climate Change Projection Information and Adaptation Knowledge Platform: A Decade of Climate Research. Water 2022, 14, 358. [Google Scholar] [CrossRef]
- The United Nation Disaster Relief Coordinator. Natural Disasters and Vulnerability Analysis: Report of Expert Group Meeting; UNDRO Books: Geneva, Switzerland, 1979. [Google Scholar]
- Water Resources Planning Institute. The Assessment on Coastal Protection of Sea Dikes, Water Resources Agency; Ministry of Economic Affairs: Taichung, Taiwan, 2014. (In Chinese) [Google Scholar]
- Houston, J.R. Closure of “Simplified Dean’s Method for Beach-Fill Design”. Waterw. Port Coast. Ocean Eng. ASCE 1996, 123, 302. [Google Scholar] [CrossRef]
- Toimil, A.; Losada, I.J.; Nicholls, R.J.; Dalrymple, R.A.; Stive, M.J.F. Addressing the challenges of climate change risks and adaptation in coastal areas: A review. Coast. Eng. 2019, 156, 103611. [Google Scholar] [CrossRef]
- TAW. The Technical Report Wave Run-Up and Wave Overtopping at Dikes Technical Advisory Committee on Flood Defence; TAW: Delft, The Netherlands, 2002. [Google Scholar]
- Van der Meer, J.W.; Janssen, J.P.F.M. Wave runup and overtopping at dike. In Wave Forces on Inclined and Vertical Wall Structures; Demirbilek, Z., Ed.; ASCE: Reston, VA, USA, 1994. [Google Scholar]
- McCowan, J. On the highest wave of permanent type. Lond. Edinb. Dublin Philos. Mag. Sci. 1894, 38, 351–358. [Google Scholar] [CrossRef] [Green Version]
- Goda, Y. The design of upright breakwaters. In Proceedings of the Short Course Attached to the 23rd Conference, Venice, Italy, 1 October 1992; pp. 547–568. [Google Scholar]
- PIANC. Analysis of Rubble Mound Breakwaters; Report of working Group 12 (PTC II); PIANC: Brussels, Belgium, 1992. [Google Scholar]
- Van der Meer, J.W. Stability of rubble mound revetments and breakwaters under random wave attack. In Developments in Breakwaters, Proceedings of the Conference on Breakwaters 85, London, UK, 2–4 October 1985; Telford: London, UK, 1985; pp. 141–154. [Google Scholar]
- Van der Meer, J.W.; Pilarczyk, K.W. Stability of breakwater armour layers deterministic and probabilistic design. Delft Hyd. Lab. Pub. 1987, 378, 34. [Google Scholar]
- Van der Meer, J.W.; Pilarczyk, K.W. Rock Slopes and Gravel Beaches under Wave Attack; Delft University of Technology: Delft, The Netherlands, 1988. [Google Scholar]
- Huang, W.P.; Hsu, J.C.; Chen, C.S.; Ye, C.J. The Study of the Coastal Management Criteria Based on Risk Assessment: A Case Study on Yunlin Coast, Taiwan. Water 2018, 10, 988. [Google Scholar] [CrossRef] [Green Version]
- David, E.; Vera, K.; Laura, S. Global Climate Risk Index 2021; Germanwatch: Bonn, Germany; Berlin, Germany, 2021; ISBN 978-3-943704-84-6. [Google Scholar]
- Murray, M.; Morrison, W.; Whitelaw, D. Host susceptibility to African trypanosomiasis: Trypanotolerance. Adv. Parasitol. 1982, 21, 1–68. [Google Scholar]
- Jeng, T.-B. Fuzzy Assessment Model for Maturity of Software Organization in Improving Its Staff’s Capability; Department of the Information Management, National Taiwan University of Science and Technology: Taipei, Taiwan, 2009. [Google Scholar]
- Saaty, T.L. How to make a decision: The analytic hierarchy process. Eur. J. Oper. Res. 1971, 40, 9–10. [Google Scholar]
- Saaty, T.L. The Analytic Hierarchy Process: Decision Making in Complex Environments; Springer: New York, NY, USA, 1984; pp. 285–308. [Google Scholar]
- Saaty, T.L. Decision-Making with the AHP: Why Is the Principal Eigenvector Necessary. Eur. J. Oper. Res. 2003, 145, 85–89. [Google Scholar] [CrossRef]
- Yunlin County Government. The National Spatial Planning of Yunlin County; Yunlin County Government: Yunlin, Taiwan, 2021. (In Chinese) [Google Scholar]
- Zhang, K.; Douglas, B.C.; Leatherman, S.P. Global Warming and Coastal Erosion. Clim. Change 2004, 64, 41. [Google Scholar] [CrossRef]
- Ministry of Science and Technology. The Updated Report of the Assessment on Climate Change Impact in Taiwan; Ministry of Science and Technology: Taipei, Taiwan, 2022. (In Chinese) [Google Scholar]
- Jager, W.S.; Christie, E.K.; Hanea, A.M.; Heijer, C.; Spencer, T. A Bayesian network approach for coastal risk analysis and decision making. Coast. Eng. 2017, 134, 48–61. [Google Scholar] [CrossRef]
Figure 1.
(a) The hazard-prone areas of Yunlin coast. (b) The surge-prone areas of Yunlin coast (in the 50-year recurrence period of absent defense).
Figure 1.
(a) The hazard-prone areas of Yunlin coast. (b) The surge-prone areas of Yunlin coast (in the 50-year recurrence period of absent defense).

Figure 2.
The flowchart of the functionality assessment of coastal defense.
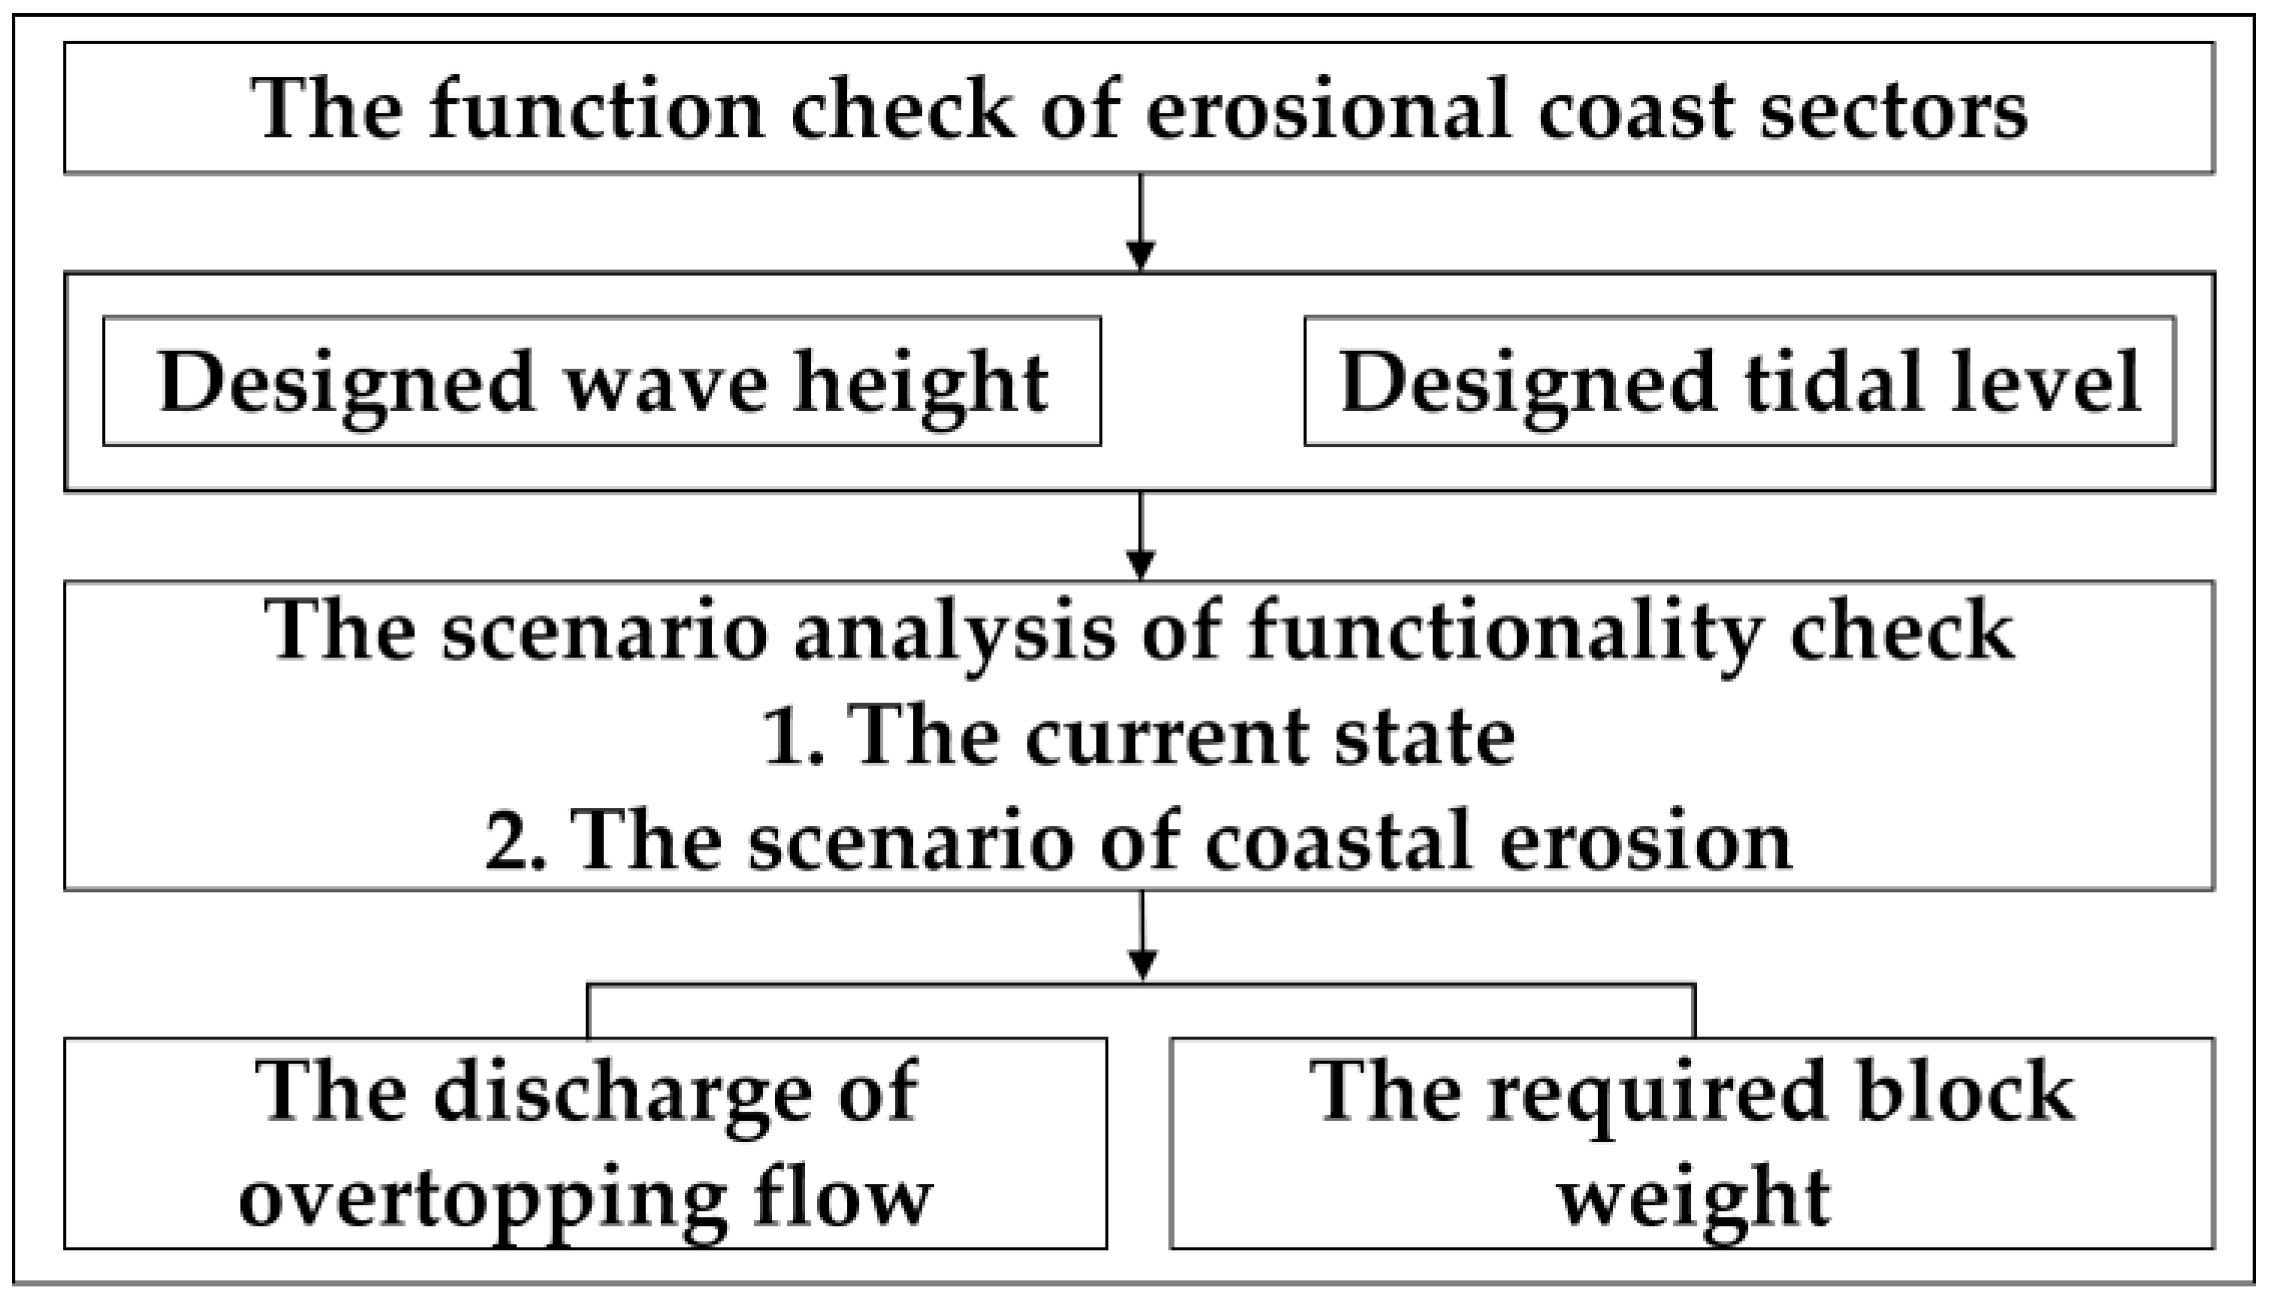
Figure 3.
The interactions of hazard and vulnerability on the risk matrix.
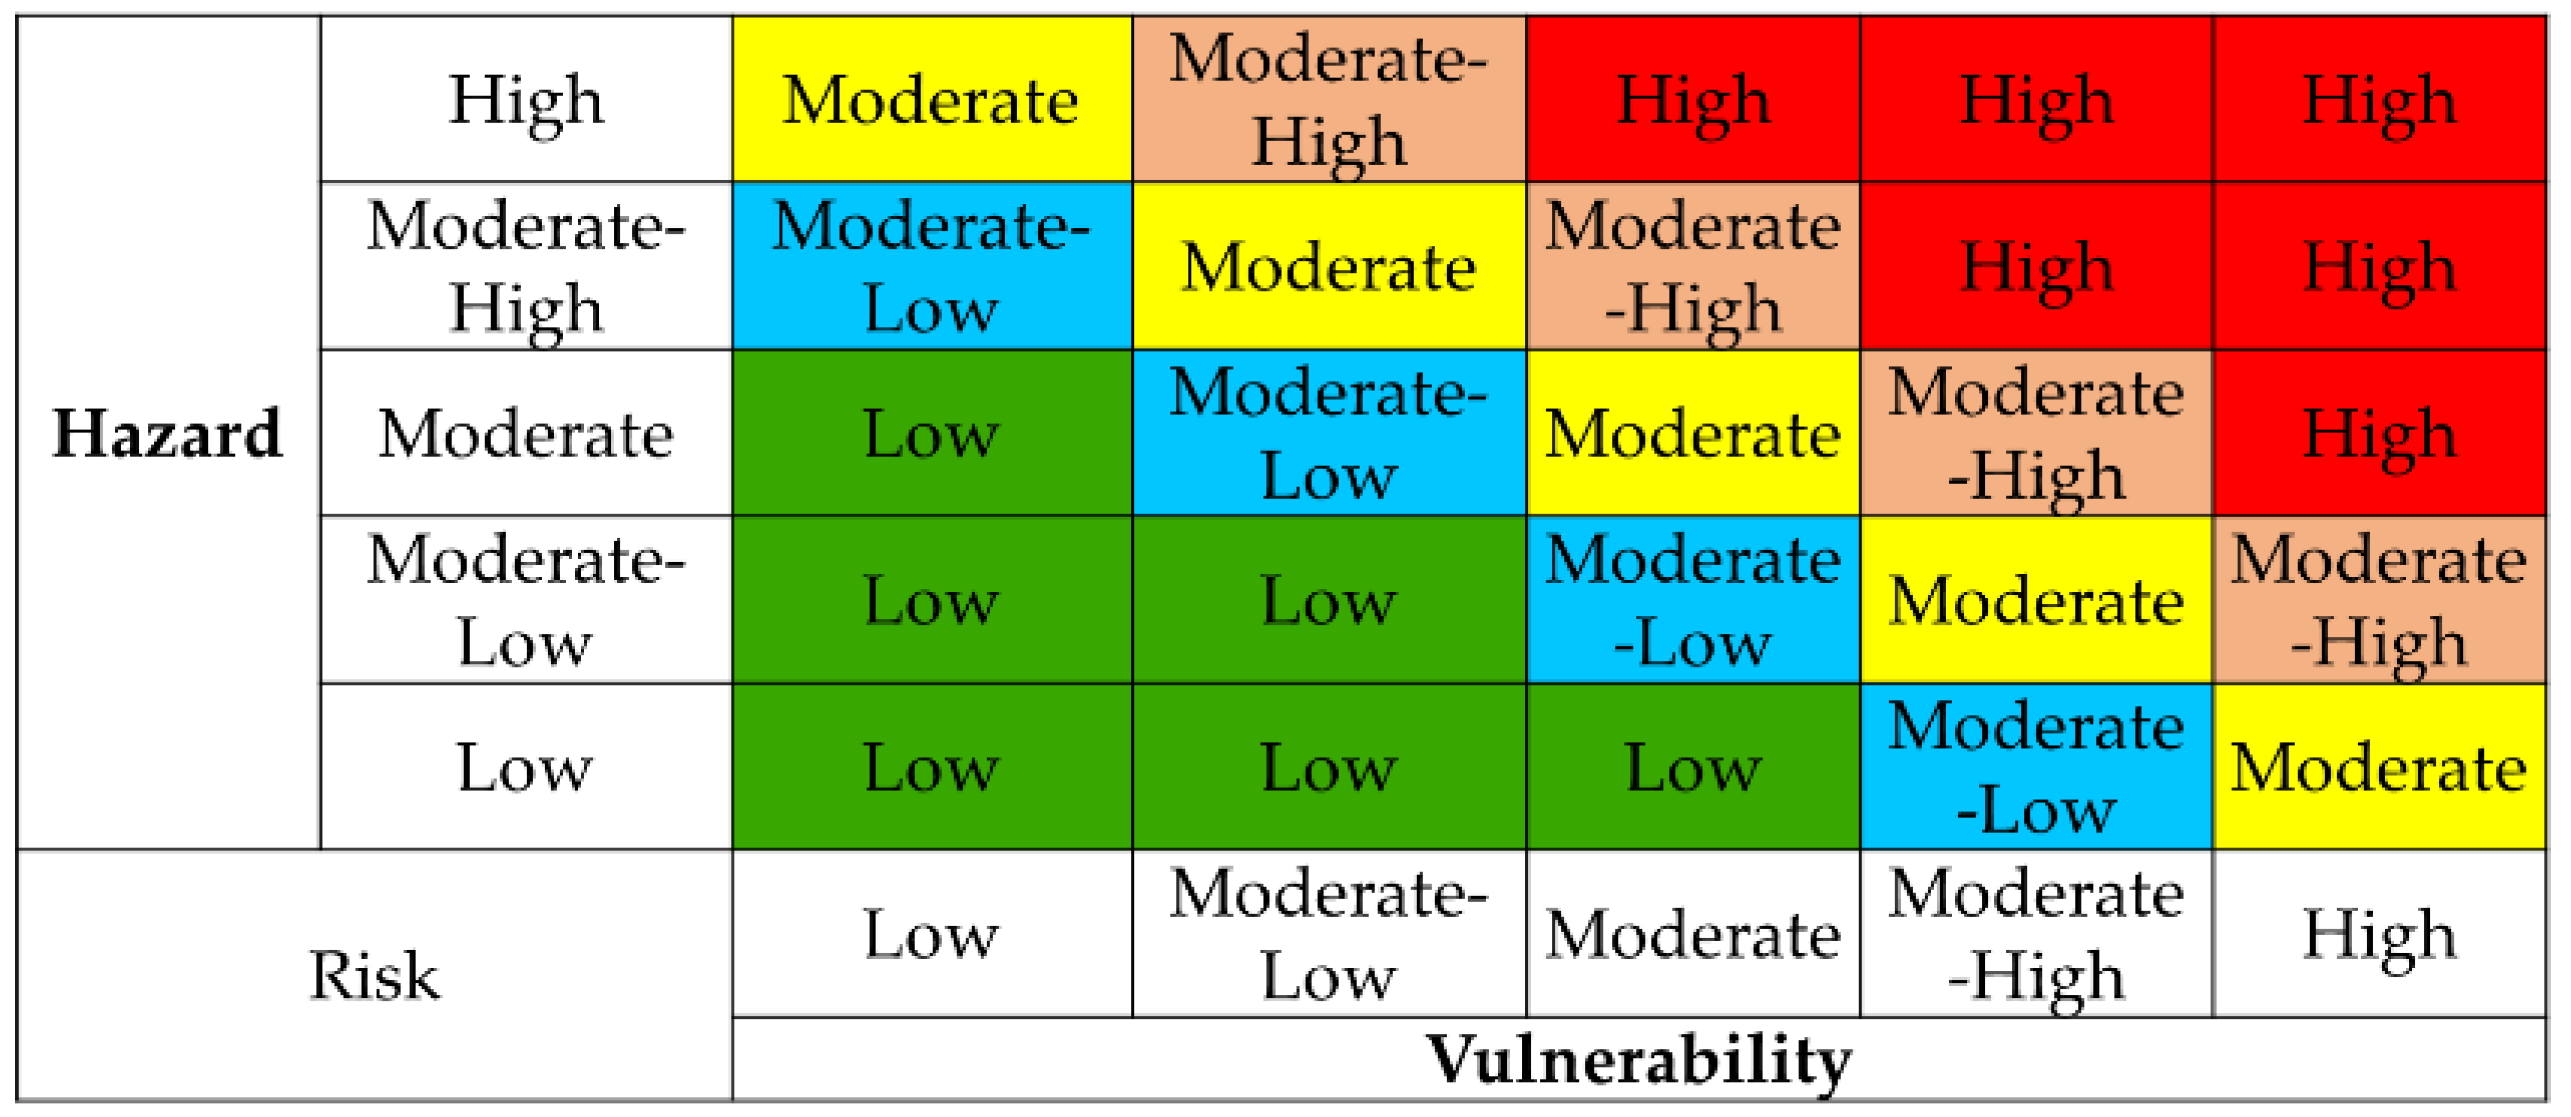
Figure 4.
(a) The hierarchies of hazard index. (b) The hierarchies of vulnerability index.

Figure 5.
(a) The change rates of 0 m isobaths in the study area. (b) The results of the volumetric analysis.
Figure 5.
(a) The change rates of 0 m isobaths in the study area. (b) The results of the volumetric analysis.
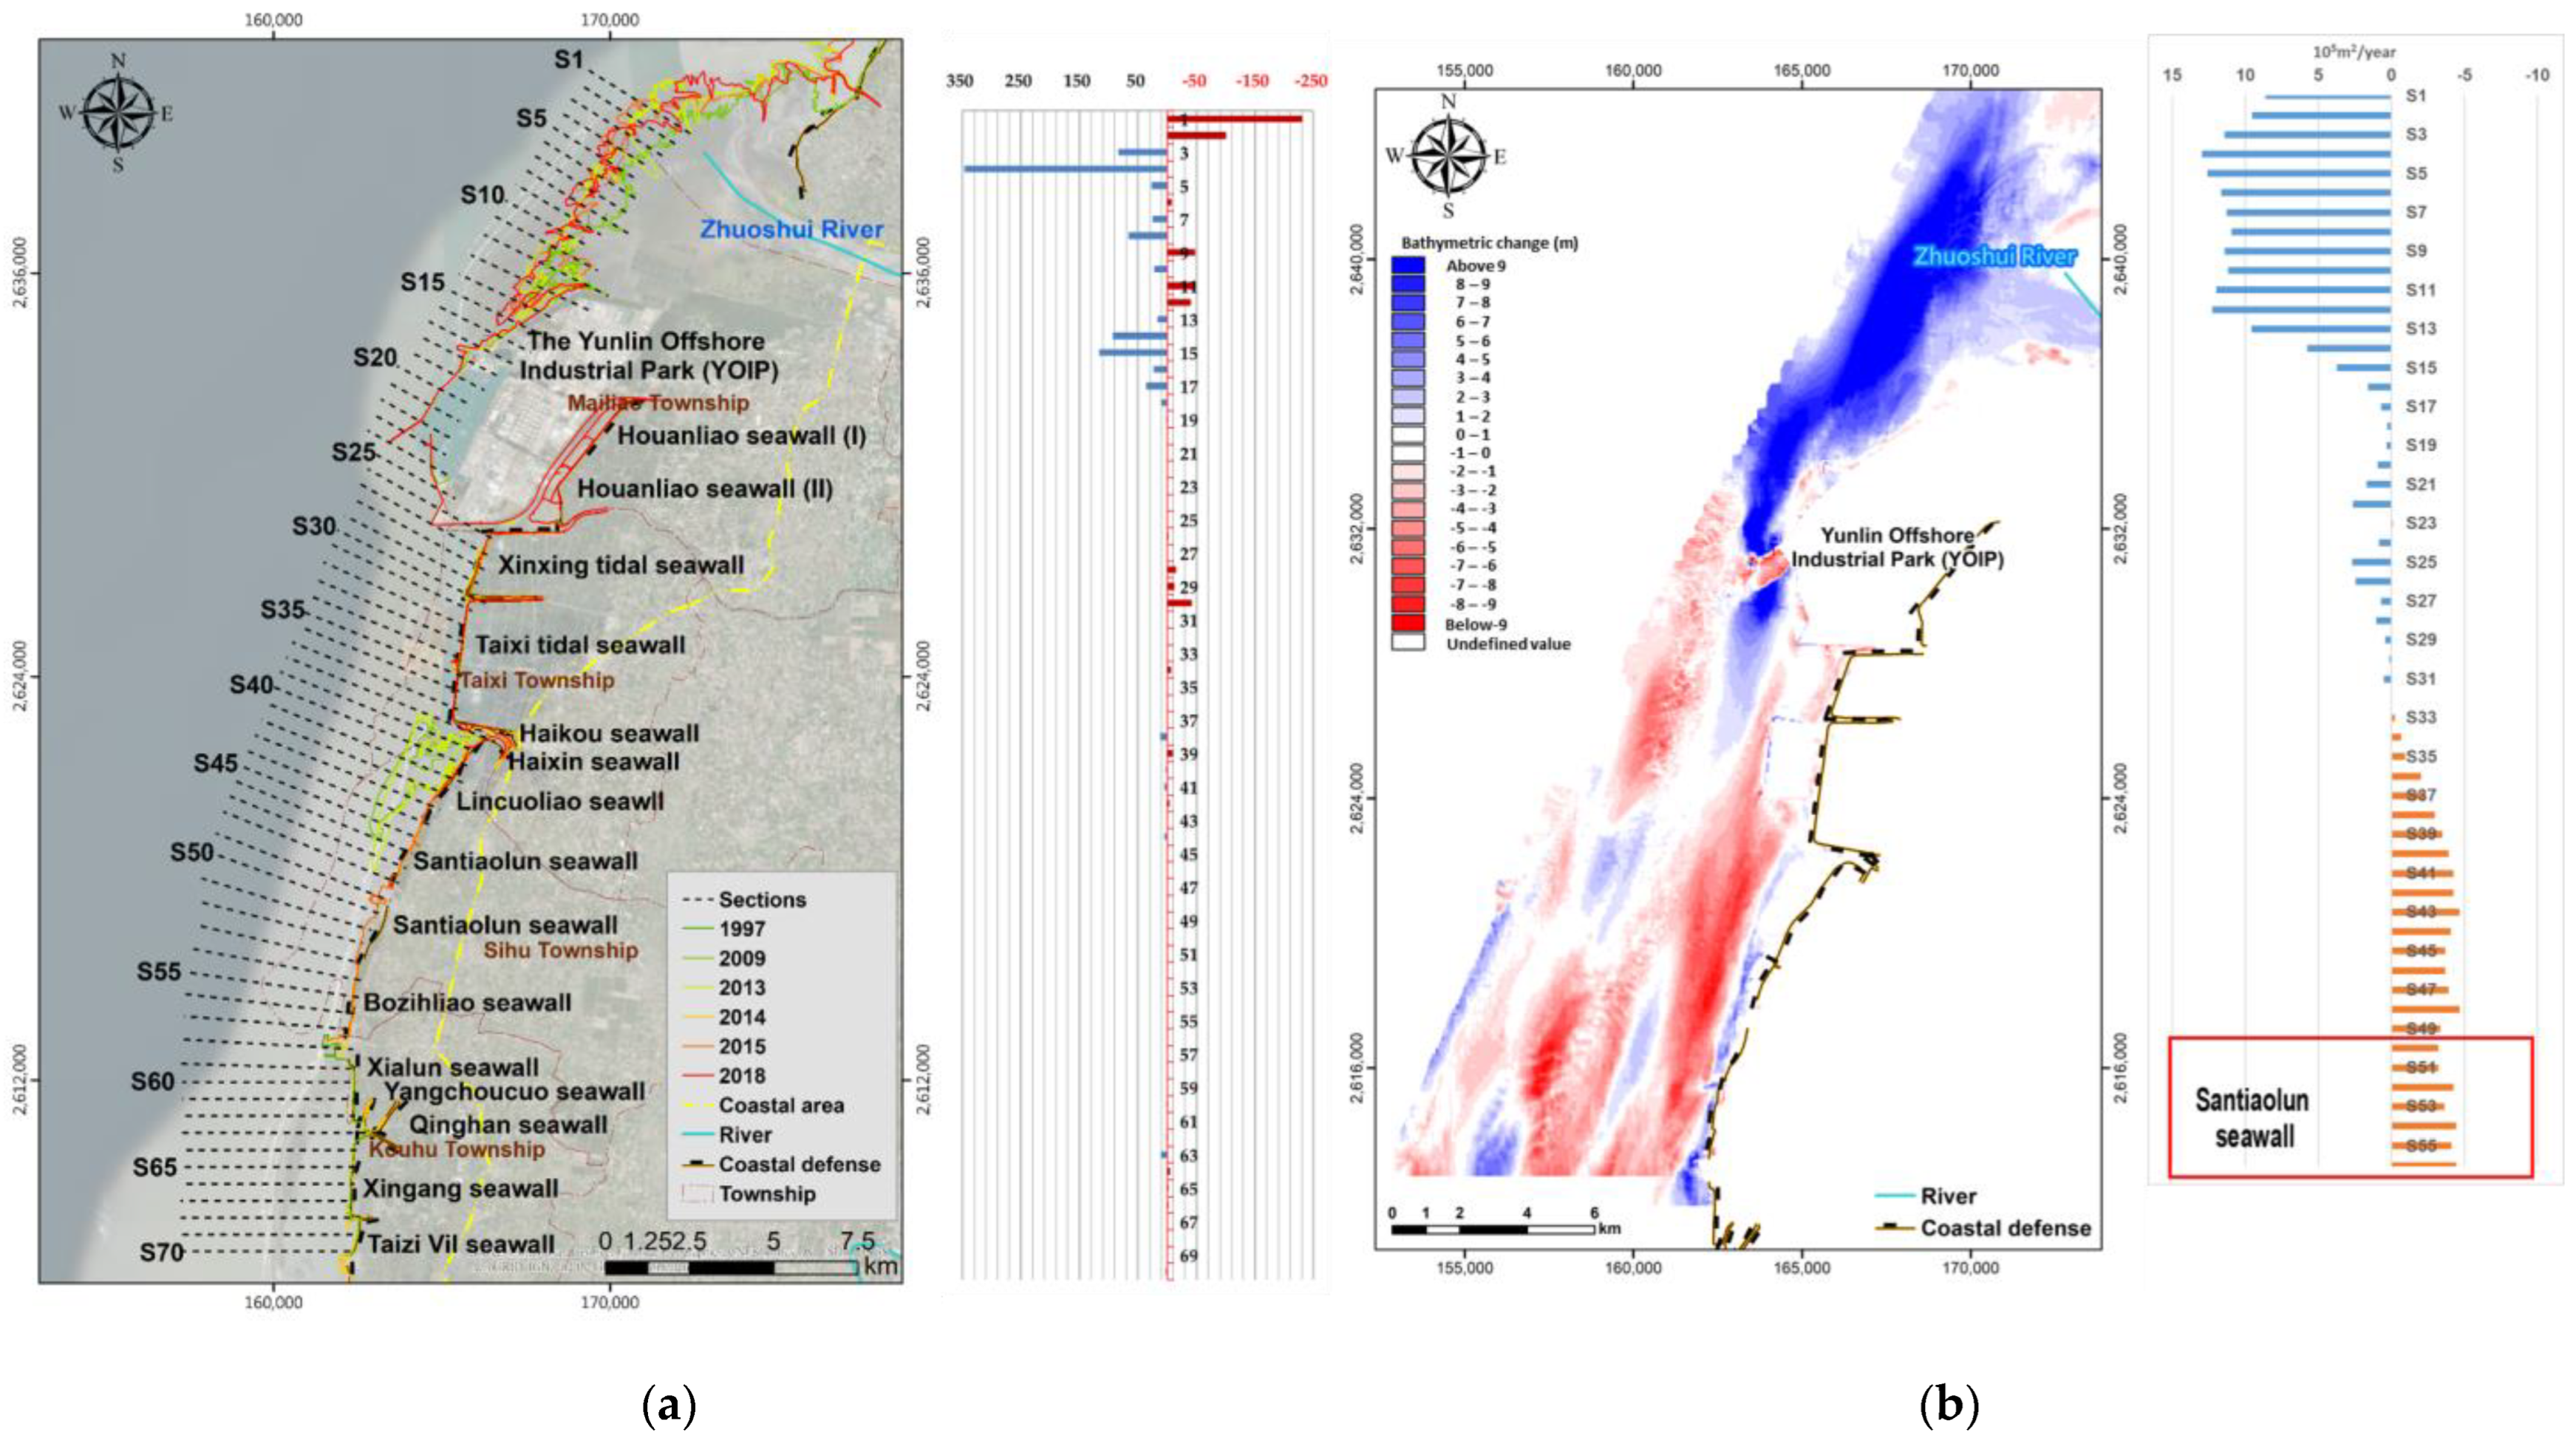
Figure 6.
Coastal erosion risk map of Yunlin.

Figure 7.
(a) Risk map of Yunlin—no adaptive strategy. (b) Risk map of Yunlin—adaptive strategy.

Table 1.
Functionality assessment results of coastal defenses in the erosional coast sectors during both current and future states.
Table 1.
Functionality assessment results of coastal defenses in the erosional coast sectors during both current and future states.
| Xinxing | Taixi | Santiaolun | Xingang | ||
|---|---|---|---|---|---|
| current state | Slope | 1:2 | |||
| Crest height of the coastal defense (m) | 6.18 | 4.0 | 5.3 | 6.09 | |
| The Elevation of foot toe (m) | 0.0 | −0.5 | −0.5 | −0.5 | |
| Incident wave height (m) | - | - | 1.27 | 1.12 | |
| Wave period (s) | - | - | 5.18 | 1.47 | |
| Run-up (m) | - | - | 4.87 | 2.41 | |
| Discharge of overtopping flow (CMS/m) | 0.0 | 0.0 | 0.0 | 0.0 | |
| future state 1 | Crest height of the coastal defense 2 (m) | 5.63 | 3.75 | 5.10 | 5.89 |
| Depth in front of defense 2 (m) | −7.15 | −4.15 | −1.15 | −1.4 | |
| Incident wave height (m) | - | - | 2.80 | 2.99 | |
| Wave period (s) | - | - | 7.70 | 7.95 | |
| Run-up (m) | - | - | 3.19 | 4.72 | |
| Discharge of overtopping flow (CMS/m) | 0.0 | 0.0 | 0.006 | 0.003 | |
| Functionality assessment | Safe | ||||
1 In the next five years. 2 The crest height of the coastal defense and the depth in front of defense were estimated in terms of the interaction of erosion potential and land subsidence (Huang et al., 2018) [40].
Table 2.
Stability evaluation results of revetments in the erosional coast sectors during the current and future states.
Table 2.
Stability evaluation results of revetments in the erosional coast sectors during the current and future states.
| Xinxing | Taixi | Santiaolun | Xingang | ||
|---|---|---|---|---|---|
| Weight of riprap or armor blocks (T) | 10 | ||||
| Current state | Wave height (m) | - | - | 1.24 | 1.12 |
| Required block weight (T) | - | - | 0.14 | 0.10 | |
| Future state 1 | Wave height (m) | - | - | 2.80 | 2.99 |
| Required block weight (T) | - | - | 1.60 | 1.94 | |
| Safe | |||||
1 In the next five years.
Table 3.
The classification of representative hazard factors.
| Geophysical Properties | Wave Energy | Shoreline Change Rate (m/year) | The Front Defense Facility | The Width of Buffer Zone (m) | |
|---|---|---|---|---|---|
| Weight | 0.16 | 0.14 | 0.24 | 0.13 | 0.33 |
| High | <62.5 µm | Hualien, Taitung, Longdong | >5 | No | <25 |
| Moderate–high | 2 mm > D > 62.5 µm | - | - | - | - |
| Moderate | 256 mm > D > 2 mm | Qigu, Su-ao, Eluanbi | 2 < R < 5 | - | 25 < W < 50 |
| Moderate–low | Coral reef | - | - | - | - |
| Low | Rock coast; >256 mm | Hsinchu, Mituo | <2 | Yes | >50 |
Table 4.
The classification of representative vulnerability factors.
| Facility Type | Elevation (m) | Population Density | Economic Industry | Land Use | Emergency Shelter | Warning System | |
|---|---|---|---|---|---|---|---|
| Weight | 0.24 | 0.26 | 0.14 | 0.07 | 0.07 | 0.07 | 0.15 |
| High | Nature | <1.5 | 0.7~1 | Yes | Residential, commercial, educational, and medical areas | No | No |
| Moderate–high | - | 1.5 < E < 2 | - | - | Industry and public facilities | - | - |
| Moderate | Riprap | 2 < E < 2.5 | 0.4~0.7 | - | Agriculture, fisheries and animal husbandry | - | - |
| Moderate–low | 2.5 < E < 3 | - | - | Non-production land | - | - | |
| Low | Concrete | >3 | 0~0.4 | No | Forest | Yes | Yes |
Table 5.
The corresponding adaptive strategies of erosion-induced risk in the erosional coast sectors.
Table 5.
The corresponding adaptive strategies of erosion-induced risk in the erosional coast sectors.
| Xinxing | Taixi | Santiaolun | Xingang | |
|---|---|---|---|---|
| Hazard | Moderate | Moderate–low | Moderate | Moderate |
| Vulnerability | Moderate | Moderate | Moderate | Moderate–low |
| Adaptive strategy |
|
|
|
|
| Residual risk | Moderate–low | Low | Moderate–low | Low |
Table 6.
The risk forecasts of the hazard and vulnerability indexes in the erosional coast sectors.
| Xinxing | Taixi | Santiaolun | Xingang | ||
|---|---|---|---|---|---|
| Current state | Hazard | Moderate | Moderate–low | Moderate | Moderate |
| Vulnerability | Moderate | Moderate | Moderate | Moderate–low | |
| No adaptive strategy | Hazard | Moderate | Moderate | Moderate | Moderate |
| Vulnerability 1 | Moderate | Moderate | Moderate | Moderate–low | |
| Adaptive strategy | Hazard | Moderate | Low | Moderate–low | Moderate–low |
| Vulnerability 1 | Moderate–low | Moderate–low | Moderate | Moderate–low |
1 In the time-variant assessment of population development.
Publisher’s Note: MDPI stays neutral with regard to jurisdictional claims in published maps and institutional affiliations. |
© 2022 by the authors. Licensee MDPI, Basel, Switzerland. This article is an open access article distributed under the terms and conditions of the Creative Commons Attribution (CC BY) license (https://creativecommons.org/licenses/by/4.0/).
Share and Cite
MDPI and ACS Style
Huang, W.-P.; Ye, C.-J.; Hsu, J.-C. Forecasts of the Compound Coastal Erosion Risks Based on Time-Variant Assessment: A Case Study on Yunlin Coast, Taiwan. Sustainability 2022, 14, 14505. https://doi.org/10.3390/su142114505
AMA Style
Huang W-P, Ye C-J, Hsu J-C. Forecasts of the Compound Coastal Erosion Risks Based on Time-Variant Assessment: A Case Study on Yunlin Coast, Taiwan. Sustainability. 2022; 14(21):14505. https://doi.org/10.3390/su142114505
Chicago/Turabian StyleHuang, Wei-Po, Chun-Jhen Ye, and Jui-Chan Hsu. 2022. "Forecasts of the Compound Coastal Erosion Risks Based on Time-Variant Assessment: A Case Study on Yunlin Coast, Taiwan" Sustainability 14, no. 21: 14505. https://doi.org/10.3390/su142114505
Note that from the first issue of 2016, this journal uses article numbers instead of page numbers. See further details here.