
Prediction of Bay-Shaped Shorelines between Detached Breakwaters with Various Gap Spacings

1
Department of Civil Engineering, National Chung Hsing University, Taichung 402, Taiwan
2
National Academy of Marine Research, Kaohsiung 806, Taiwan
*
Author to whom correspondence should be addressed.
Sustainability 2023, 15(7), 6218; https://doi.org/10.3390/su15076218
Submission received: 21 February 2023
/
Revised: 27 March 2023
/
Accepted: 31 March 2023
/
Published: 4 April 2023
(This article belongs to the Special Issue Sustainable Coastal Management and Engineering)
Abstract
:Detached breakwaters are widely used for shore protection. The planforms of tombolos or salients behind structures have also been used to provide a recreational and sustainable coastal environment. In this study, the comprehensive XBeach model was used to numerically simulate the evolution of wave transformation, nearshore current, and morphological changes in tombolo planforms behind detached breakwaters. Given various gap spacings between consecutive breakwaters, the numerical results indicated that both equilibrium bay-shaped shorelines and bottom profiles form in the lee of detached breakwaters after long-term persistent wave action. These equilibrium shorelines and bottom profiles were verified using well-known empirical formulas. Post-wave-action retreat displacement to the initial shoreline was analyzed, and an empirical relationship was proposed for predicting the equilibrium bay-shaped shoreline. By associating the empirical formula with a parabolic bay-shape equation, some actual beaches were evaluated to validate the predictions of equilibrium shorelines behind detached breakwaters. In conclusion, to appropriately plan the layouts of breakwaters, bay-shaped shorelines of tombolo planforms in the lee of detached breakwaters can be predicted at the design stage by using the proposed relationship.
1. Introduction
Coastal areas are intensely used for human settlement, industry, agriculture, tourism, recreation, harbor construction, etc. However, beach erosion caused by natural factors and human activities leads to problems for the population and infrastructure along the coast. Many artificial structures such as seawalls, groins, and detached breakwaters have been widely installed to mitigate shore erosion and coastal hazard. Among these coastal structures, detached breakwaters have been used extensively for coastal protection in Japan, the United States, and the Mediterranean for several decades. A detached breakwater is defined as a hard shore-parallel structure which reduces the intensity of incident waves in sheltered areas of water and promotes the sediment accretion behind the breakwaters. Numerous studies have described the hydrodynamic and morphodynamic characteristics of single and multiple detached breakwaters by employing field observations [1,2,3,4], laboratory tests [5,6], theoretical approaches [7,8], and numerical models [9,10,11,12,13]. Nevertheless, so far, the prediction of the equilibrium shoreline in the lee of the detached breakwater is not yet available at the design stage to appropriately plan the layouts of breakwaters. Therefore, this work proposes a method to predict the equilibrium shoreline of tombolo planform in the lee of detached breakwaters.
Generally, the formation of a tombolo or salient planform behind a detached breakwater is governed by wave transformation coupling with nearshore current and sediment transport. When incident waves propagate to a beach, wave diffraction occurs around the detached breakwaters, and the wave height decays in the sheltered area. The wave-induced current then transports littoral sediment to the sheltered area and creates a tombolo or salient planform behind the breakwaters. Mory and Hamm [14] indicated that the first experiments on detached breakwaters were carried out by Gourlay [15], these experiments explored the characteristics of wave height, set-up, and currents around a detached breakwater. Van Rijn [16] used Delft3D-model to compute the hydrodynamics and the coastline changes in the lee of detached breakwaters; the results showed a significant decrease in the wave height occurred in the lee of the breakwater and pronounced circulation zones generated in the lee of the breakwater due to variations of the set-up along the shore. Araújo et al. [17] applied one-line models of GENESIS [18] in a case study to assess the impact of detached breakwaters on shoreline evolution. Guimarães et al. [19] adopted LTC [20] to estimate the long-term shoreline changes due to detached breakwaters under oblique wave action. Recently, de Macêdo et al. [21] carried out the geometric parameters of salients and tombolos behind reefs and breakwaters in a tropical mesotidal environment along the Central Brazilian Coast based on the relationship proposed by Klein et al. [22].
Accreted sediment forms a tombolo or salient behind breakwaters which is dependent upon the arrangement of detached breakwaters. The types of planforms behind detached breakwaters can be determined using a simple combination of parameters, including the length of the breakwater Lb, initial distance from the shore of the breakwater Xi, and the clear gap between adjacent breakwaters Gb, as defined in Figure 1. According to Dally and Pope [23], a tombolo forms at Lb/Xi > 1 for a single detached breakwater and Lb/Xi > 1.5 for multiple detached breakwaters. Using laboratory and prototype data, Suh and Dalrymple [24] reported that a tombolo forms at Lb/Xi > 1 for a single detached breakwater and Lb/Xi > 2 Gb/Lb for multiple detached breakwaters. Bricio et al. [25] indicated that tombolos are present at Lb/Xi > 1.3 and salients at 0.5 < Lb/Xi < 1.3 based on aerial photographs of 27 detached breakwater projects along the northeast Catalonian coastline of Spain.
Hsu and Silvester [26] proposed a parabolic bay-shape equation (PBSE) [27] for evaluating the equilibrium shoreline of a salient planform behind a single detached breakwater. The parabolic bay shape equation (PBSE) was also successfully used to evaluate the equilibrium state of natural bay beaches and beach downcoast of harbor or coastal constructions, coastal management, and protection [28,29,30,31,32,33]. Using PBSE, Klein et al. [34] developed a software program called MEPBAY to analyze the equilibrium of bay beaches. Both PBSE and MEPBAY have been employed to effectively assess the equilibrium shorelines of bays by determining the up-coast control point (i.e., wave diffraction point) and down-coast control point (i.e., point tangent to the down-coast beach). PBSE and MEPBAY have also been used to verify the shorelines of salients or tombolo planforms that form behind detached breakwaters [32,33]. PBSE and MEPBAY are used in a retrospective manner to verify existing beach planforms [35]. However, during the predesign stage in the development of a system comprising multiple detached breakwaters, defining the point tangent to the bay is difficult. As shown in Figure 1, the initial shoreline retreats to Xe when the equilibrium bay-shaped shoreline forms. Consequently, determining the retreat displacement may aid in the planning of detached breakwater layouts with the help of PBSE and MEPBAY. To our knowledge, no empirical formula yet exists for calculating the retreat displacement. Therefore, an empirical formula for retreat displacement is aimed to propose for practical applications.
In this study, the morphological changes in tombolo planforms behind detached breakwaters with various gap spacings between consecutive breakwaters are first simulated using a process-based morphodynamic numerical model of XBeach. The empirical relationship between the retreat displacement and detached gap spacings was then accordingly proposed for predicting the equilibrium bay-shaped shoreline by associating with MEPBAY. This paper is organized as follows. Section 2 describes the numerical setup of the XBeach model, the initial bathymetry, and the arrangement of multiple breakwaters. Section 3 presents the numerical results of the spatial and temporal variations in wave transformation, nearshore current, and beach morphology. Section 4 discusses the equilibrium shorelines behind breakwaters with various clear gap spacings between detached breakwaters. An empirical formula for retreat displacement to the initial shoreline is proposed here and applied to predict equilibrium bay-shaped shorelines in the lee of breakwaters. Finally, the conclusions of this study are addressed.
2. Numerical Model
2.1. XBeach Model
XBeach is used in this study to simulate beach evolution behind detached breakwaters subjected to persistent incident waves. XBeach is an open-source, process-based morphodynamic numerical model for the nearshore and coast [36]. This comprehensive model was originally developed to simulate the hydrodynamic and morphological processes of storm waves on sandy island systems [37,38,39,40,41,42]. It is also used to simulate the interactions between moderate wave conditions and coastal constructions. The XBeach model has been successfully applied across a large number of sandy coasts [37].
XBeach solves coupled two-dimensional horizontal equations for wave propagation, flow, sediment transport, and bottom changes [36]. The stationary mode (keyword: instat = stat) in XBeach was selected in this work to resolve wave propagation, directional spreading, shoaling, refraction, bottom dissipation and wave breaking, and a roller model; these processes are usually dominant in nearshore areas of limited extent [37]. The time-dependent wave-action balance equation is introduced in the model for solving the wave-current interaction, in which the wave number is corrected by the Eikonal equations. The radiation stresses were obtained by the spatial distribution of the wave action and therefore wave energy for evaluating the wave set-down and set-up. Two alternative formulations are available for bed updating in XBeach: one where the bottom changes are computed based on the gradients of suspended and bed load transport, and one where the changes due to suspended transport are accounted for through the erosion and deposition terms. The implementation utilizes a rectilinear or curvilinear, staggered grid where depths, water levels, wave action, and sediment concentrations are given in the cell centers, and velocities and sediment fluxes at the cell interfaces. The wave energy is solved line by line from the seaward boundary landward. For each line, the automatic time step is computed, and the quasi-time-dependent balance is solved until convergence, after which the solver moves to the next line.
For more details, please refer to Roelvink et al. [36,37] and the XBeach user manual (online at https://xbeach.readthedocs.io/en/latest/xbeach_manual.html accessed on 13 November 2019).
2.2. Initial Bathymetry
Two detached breakwaters with various gap spacings were numerically simulated. Initial bathymetry revealed a straight planed beach with a slope s of 1/50 at elevations of z = −5 to −25 m and 1/40 at elevations greater than z = −5 m. The seabed material consisted of sand with a median grain size D50 of 0.2 mm. Two emerging impermeable detached breakwaters were located at 80 m from the initial shoreline (denoted Xi) and at a depth of 2 m. To prevent wave overtopping, the elevation of the top of the breakwaters was set to +2 m. Figure 2 shows the configuration of the detached breakwaters and the initial bottom conditions.
To determine the simulation conditions, 93 projects and 1144 detached breakwater cases presented in [25,43,44,45,46,47,48,49], were referred. The length of the detached breakwaters Lb was set to 150 m. To allow a tombolo to form behind the detached breakwaters, the initial offshore distance of the breakwaters Xi was set to 80 m, and the clear gap spacing Gb was set to 58–133 m (i.e., Xi/Gb = 0.6–1.4 and Gb/Lb = 0.39–0.89), as shown in Table 1. The incident wave height Hi in deep water and wave period T were set to 1.38 m and 5.52 s, respectively. Only normal incident waves were considered.
2.3. Model Settings
Figure 3 depicts computational meshes obtained after the numerical convergence tests. The computational domain was 1800 and 600 m in the cross-shore (y) and longshore (x) directions, respectively. The computational meshes were constructed using the RGFGRID grid generator module of the Delft3D software suite. RGFGRID generates a progressive grid, which is then refined toward the boundaries by specifying the ratio of the maximum grid size at the boundaries to the uniform grid size. In this study, the progressive grids were set to increase gradually from the offshore boundary toward the shore (as the green frame area in the figure), with the maximum grid size being ∆y = 10 m at the offshore boundary. To analyze the intricate interactions between the waves, currents, and morphological changes near the breakwaters, the refined uniform/minimum grid size in the y-direction was set to ∆y = 0.5 m at elevations of z = −5 to +1 m (as the red frame area in the figure). Then the progressive grids above z = +1 m was set to decrease gradually (as the yellow frame area in the figure). In addition, the uniform grid size in the x-direction was set to ∆x = 1 m.
An offshore boundary is treated as an open boundary to allow reflection waves to transmit freely through it. A Neumann boundary was used as a lateral boundary, in which zero gradient flux boundaries were set, and the coast was assumed to be uniform outside the model domain.
Several hydrodynamic and morphodynamic parameter values in XBeach have been defined [36,50]. In addition, numerical parameters have been calibrated by users to match the actual physical mechanism [51]. The values of these numerical parameters have been recalculated using laboratory and field measurement data from the Wettelijk Toets Instrumentarium (WTI) 2017 (WTI 2017) project [52]. In nearshore areas, the WTI setting parameters are predominantly related to flow, wave breaking, sediment transport, and bed level changes. These parameters have been validated and demonstrated to be positively correlated with experimental data [53]. In this study, the WTI parameter values were used to address wave transformations, nearshore currents, and morphological changes near detached breakwaters. To satisfy the Courant–Friedrichs–Lewy (CFL) condition, which is a necessary condition for numerical convergence, a time step of 6 s was used in flow computations. A morphological acceleration factor (also called morfac) of 15 was also used to expedite the morphological time scale in relation to hydrodynamics [54]. Generally, during simulations, adjusting the acceleration factor can increase the efficiency of the numerical calculations and reduce the accumulation of sensitive errors [55,56,57]. According to Roelvink [54], a morfac of 15 indicates that a simulation of 4 min is equivalent to 1 h. Thus, a 60-day simulation duration was equivalent to 30 months of morphological changes in situ. With this acceleration factor, an execution duration of only 3 days was required to account for 30 months.
3. Numerical Results
3.1. Validations
The experimental data performed in the large wave tanks (LWT) at the Central Research Institute of Electric Power Industry (CRIEPI) of Japan [58] were used to validate the numerical model. The data included the bar formation and the wave height variation. Initial bathymetry revealed a straight-planed beach with a slope s of 1/20. The water depth h is 4.5 m. The seabed material consisted of sand with a median grain size D50 of 0.47 mm. The incident wave height Hi in deep water and wave period T were 1.05 m and 9.0 s, respectively. The comparisons between the experimental data and the simulated results of temporal variation of wave height and the bottom profile are depicted in Figure 4, in which the wave heights are drawn by circles and the bottom profiles are plotted by lines. It can be seen that the wave shoaling and wave breaking occur during wave prorogating over the sloping seabed. The bar is grown as a wave of consecutive action over time and finally approaches a stable state. The comparisons prevail in good agreement between the numerical results and experimental data. The satisfactory comparisons also demonstrate that the setting of the gird configuration and numerical parameters in this study are suitable.
3.2. Hydrodynamic and Morphodynamic Processes
Figure 5 depicts the temporal and spatial variations in the wave transformation, bathymetry isobaths, current pattern, and sediment transport rate near breakwaters, with the numerical results of Xi/Gb = 1 shown as an example. In accordance with Van Rijn [59], the magnitude of sediment transport was calculated as the sum of suspended load and bed load sediment transport.
Under the wave being incidence normal to the shore, the incoming wave propagates through the gap between the breakwaters, and the wave heights clearly decay in the sheltered area behind the breakwaters as a result of wave diffraction. This wave height decay strongly affects the contours of the wave setup gradient (i.e., water level variation). Therefore, as a result of the distribution of the wave height and wave setup, a nearshore current is induced in the lee of the breakwaters. This current induces sediment transport, thereby resulting in morphological changes in the lee of the breakwaters.
According to the simulation results, the onshore directed flow through the gap zone first diverges at the shoreline to two opposite alongshore currents. The alongshore currents arriving from two adjacent gaps then meet and generate offshore currents toward the breakwaters. Consequently, two circulation cells form near the breakwaters. Although the strength of the nearshore currents and the sediment transport rate initially increases with time, they later gradually decline. In addition, the convergent currents result in shoreline accretion behind the breakwaters and finally create a tombolo planform. As shown in Figure 5, an equilibrium bay-shaped shoreline forms after long-term wave action, at which the nearshore current and sediment transport are minor. As shown in Figure 5, the wave breaker line is almost parallel to the equilibrium shoreline (dashed-dotted blue line).
Figure 6 depicts the temporal changes in the shorelines and the bottom profiles for Xi/Gb = 1. It also depicts the equilibrium shoreline evaluated using the PBSE proposed by Hsu and Evans [27] and the equilibrium bottom profile estimated using the EBP empirical formula proposed by Dean [60]. As shown in Figure 6a, after the formation of a double-peak salient, this salient progressively changes into a single-peak salient as a result of the convergent offshore currents, and a tombolo finally forms behind the breakwaters. As shown in Figure 6b, in terms of bottom profile changes at the gap centerline (x = 1000 m), the bottom gradually erodes over time as a result of the divergent onshore currents, and the profile approaches an equilibrium state. After a long-term duration, the simulated shoreline and bottom profile become almost identical to the predictions of the equilibrium state obtained using the empirical equations.
4. Discussion
4.1. Shorelines and Bottom Profiles for Various Gap Spacings
In this section, the equilibrium shorelines and bottom profiles for various gap spacings are discussed. The simulated equilibrium bay-shaped shorelines for various gap spacings of consecutive breakwaters are shown in Figure 7. Because of the aforementioned divergent onshore currents, it can be observed that the initial shoreline has retreated a displacement at x = 1000 m. As shown in the figure, a larger gap spacing (i.e., smaller Xi/Gb) results in a smaller retreat displacement and smaller curvature of the bay-shaped shoreline. Figure 8 depicts the temporal changes in the retreat displacement for various gap spacings. For all cases, the retreat displacement initially increases with time and approaches a constant after 25 months of wave action.
Figure 9 depicts the bottom profiles at the centerline (i.e., x = 1000 m) for various gap spacings. It shows that a smaller gap spacing results in a deeper and steeper bottom profile near the shore. As shown in Figure 10, the bottom profiles agreed well with the predictions made using the empirical formula for equilibrium bottom profiles [60]. It is noted that the deeper and steeper bottom profile caused by the smaller gap spacing might be a disadvantage in shore protection when storm waves impact after the aforementioned equilibrium state forms. It is recommended to investigate the influence of storm waves with higher water levels in a further study.
4.2. Regression Analysis of Shoreline Retreat Displacement
According to the aforementioned morphological evolution simulations, an equilibrium bay-shaped shoreline finally forms in the lee of the breakwaters from the initial straight shoreline after long-term persistent wave action. To predict the equilibrium shoreline by using PBSE and MEPBAY, the point tangent to the bay-shaped shoreline has to be determined. This means that the retreat displacement to the initial shoreline has to make an a priori estimation.
Based on the simulated results of the retreat displacements of various gap spacings Xe, it can be plotted against the distance of the initial shorelines Xi. As demonstrated in Figure 11, when they are made as dimensionless parameters by using the distance of the gap spacing Gb, it shows that Xe/Gb linearly varies with Xi/Gb, and can be expressed as:
This empirical formula, which was derived from regression analysis involving numerical results (red squares in Figure 11), correlates strongly with the field data (correlation coefficient R2 = 0.871). Notably, field records including the values of Xi and Xe are uncommon, therefore, the field data presented in Figure 11 were referred from Khuong [60].
4.3. Validation in Practical Scenarios
In combination with Equation (1), MEPBAY is a highly useful tool for predicting equilibrium bay-shaped shorelines given various offshore breakwater layouts. Evaluations of Xe based on Equation (1) can be used to determine the location of the downcoast control point (i.e., the point tangent to the bay) in MEPBAY, enabling the prediction of equilibrium bay-shaped shorelines in the lee of breakwaters during the planning stage of offshore breakwater layouts.
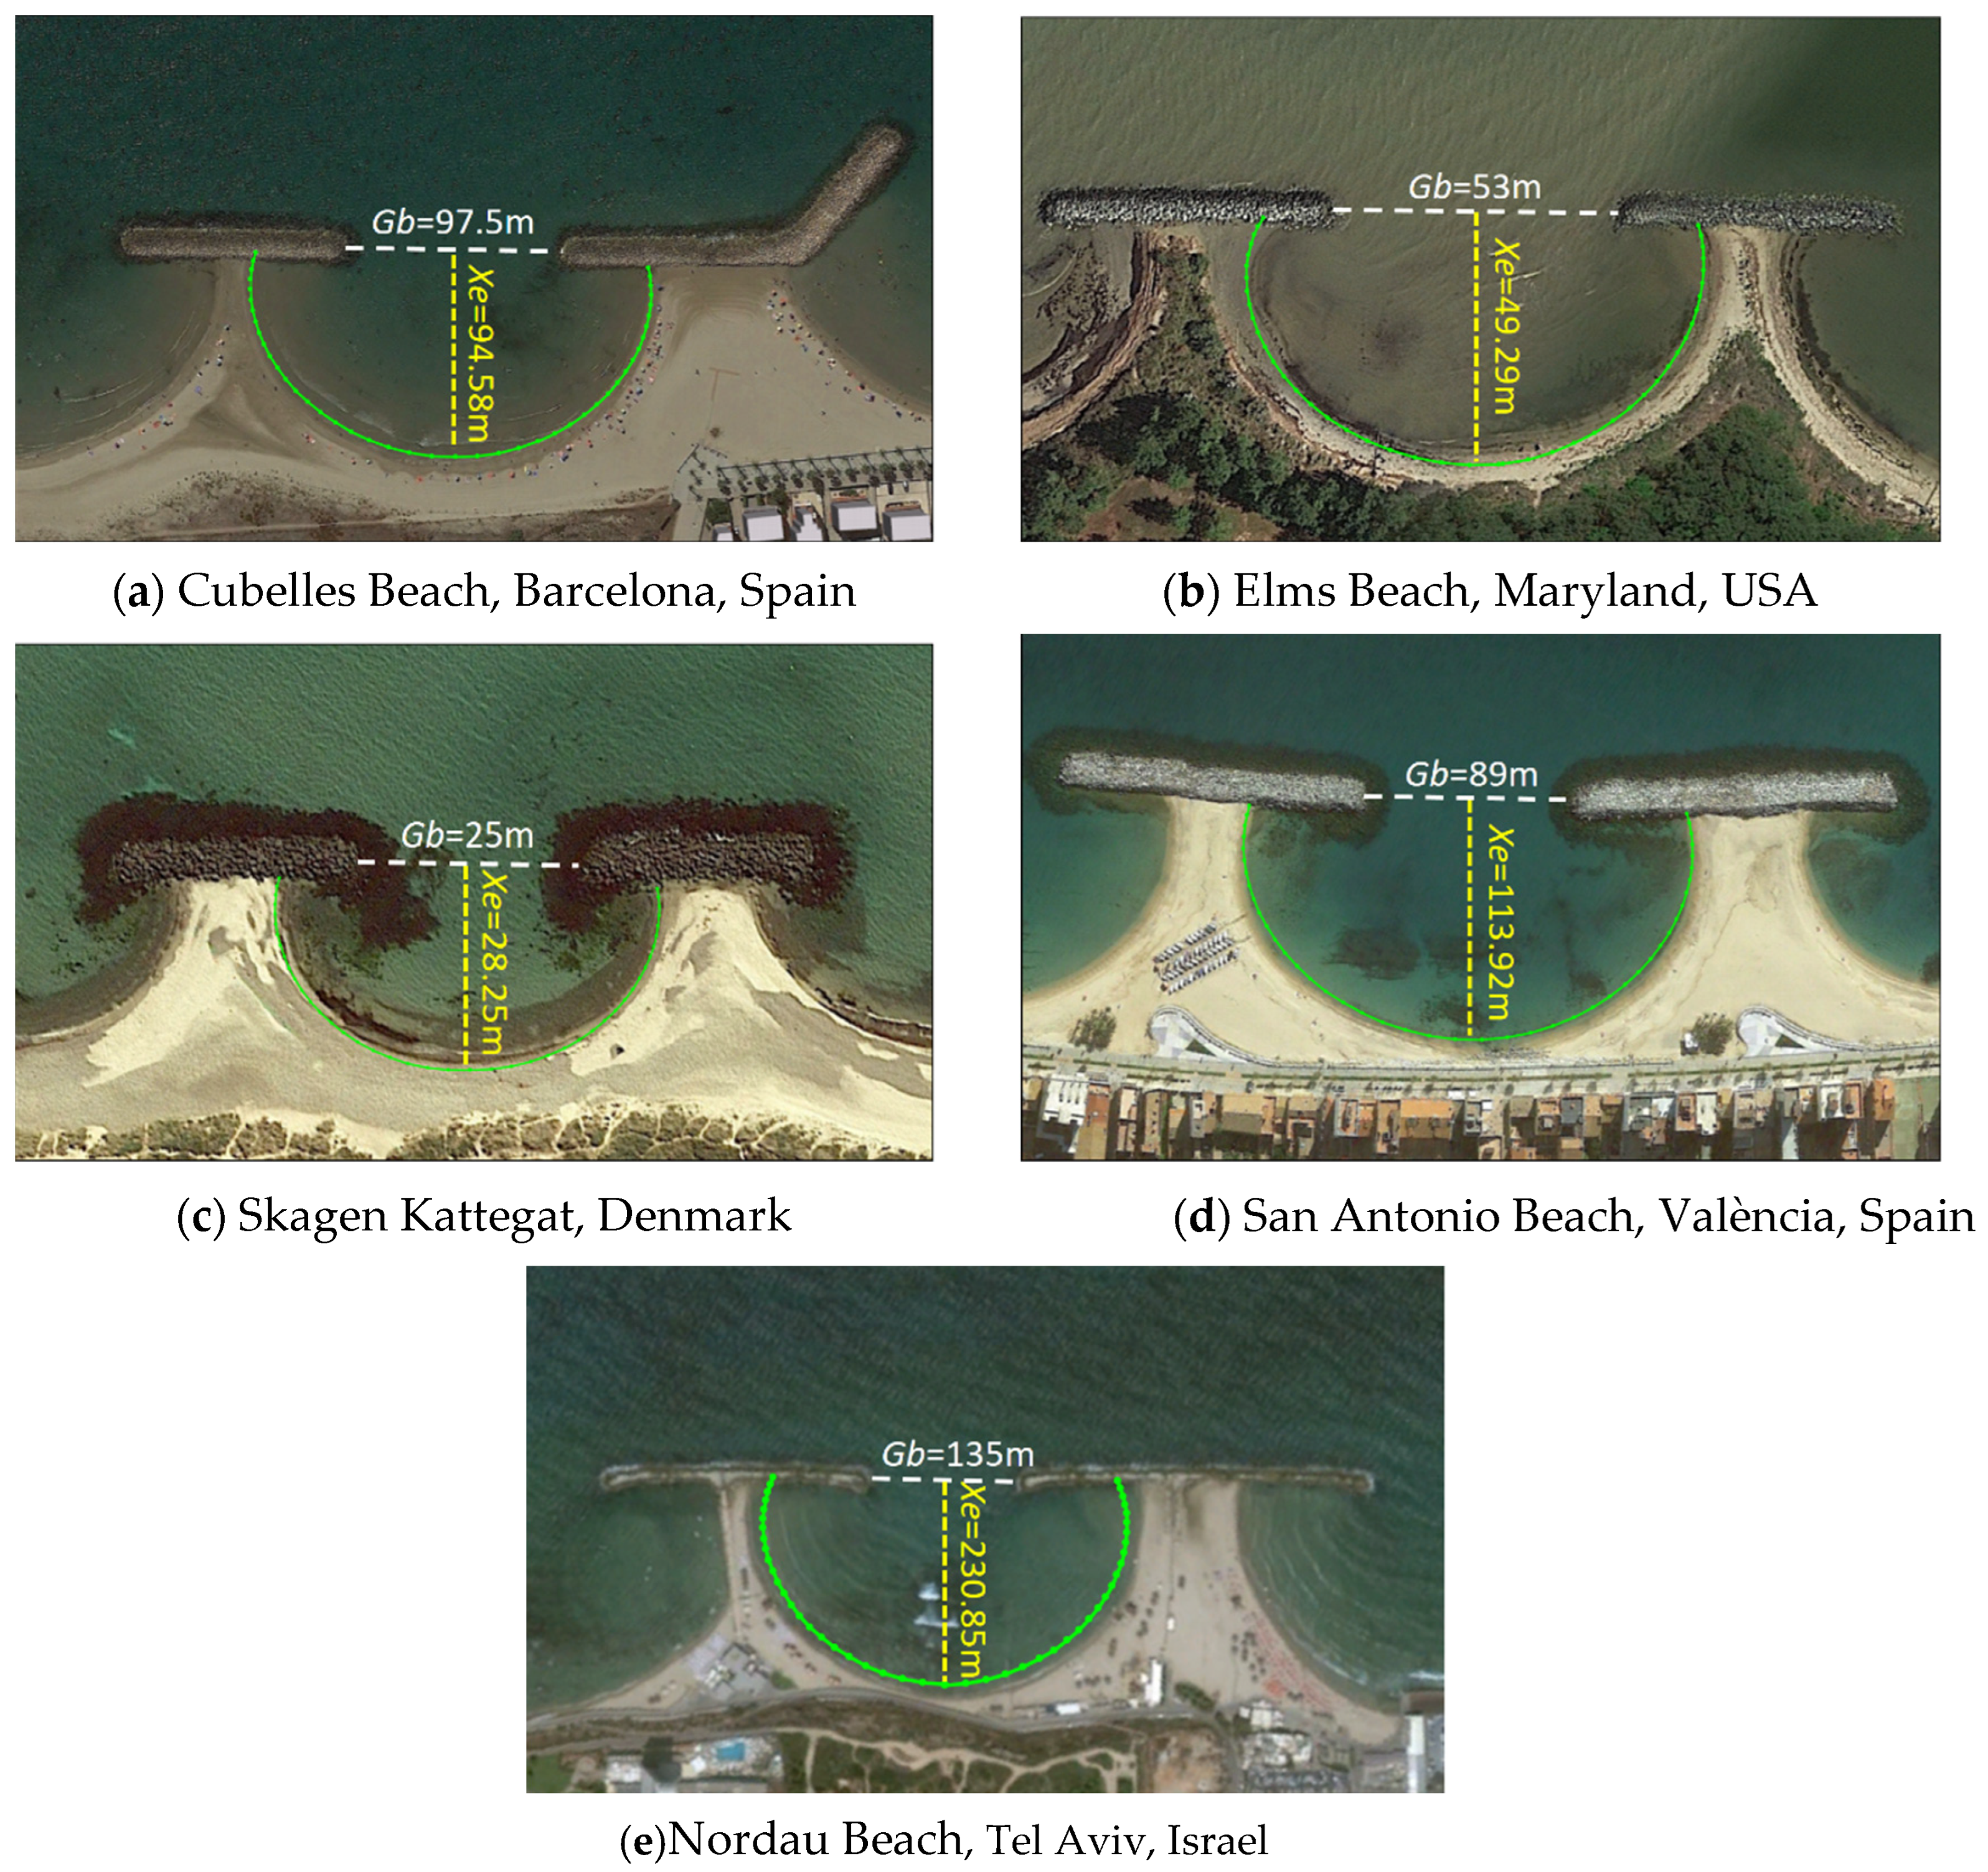
In this study, practical scenarios were validated using images courtesy of Google Earth (online at https://earth.google.com/ (accessed on 7 August 2021)). In general, to directly delineate bay-shaped shorelines in MEPBAY by using such images between 2018 and 2021, the images must be of high quality, must have few cloud effects, and must clearly depict the shoreline and its structure as well as the color and appearance of the water. In this study, five on-site beaches, namely four beaches with Xi/Gb = 0.6–1.4 and one beach with Xi/Gb > 1.4, were selected as illustrative examples. In these examples, the tombolo planforms were visible in the lee of the breakwaters, and the initial Xi values of the sites were known. Table 2 lists the values of the related parameters of the field cases together with the Xi values obtained from Khuong [49].
The process of using MEPBAY to evaluate bay-shaped shorelines between detached breakwaters is briefly outlined as follows:
- (1)
- Determine the diffraction point or up-coast control point (i.e., the heads of the adjacent offshore breakwaters).
- (2)
- Determine the point tangent to the bay (i.e., the distance Xe at the centerline between two adjacent offshore breakwaters) by using Equation (1).
- (3)
- Locate the wave crest direction tangent to the downcoast shoreline. In this study, because of the normally incident persistent wave direction, the crest wave line was parallel to the offshore breakwaters.
Figure 12 shows the bay-shaped shoreline predictions in the five field cases after the application of Equation (1) and MEPBAY (green lines). The results indicated that the predicted shorelines matched the actual shorelines favorably. The predictions of these on-site beaches are based on the PBSE so that these existing shoreline planforms can also be interpreted as being in a static equilibrium state. As shown by these illustrative examples, Equation (1) and MEPBAY can be used to predict the equilibrium bay-shaped shoreline in the lee of detached breakwaters during the planning stage of breakwater layouts.
5. Conclusions
Bay-shaped beaches form as a tombolo or salient planform in the lee of detached breakwaters when appropriate layouts are used. This study is purposed to make an a priori estimation of the equilibrium bay-shaped shoreline of tombolo behind breakwaters. This can be implemented at the breakwater design stage by the proposed empirical formula and MEPBAY [34] based on PBSE [27].
In this study, XBeach was used to simulate the morphological evolution of tombolo planforms in the lee of detached breakwaters for an initial straight beach. By using two consecutive detached breakwaters with various gap spacings, the temporal and spatial variations in the wave transformation, nearshore current, and topology near the breakwaters were simulated and discussed. Given long-term persistent wave action, this study found that the simulated equilibrium bay-shaped shorelines and bottom profiles in the lee of the detached breakwaters matched the predictions made using well-known empirical formulas. Accordingly, an empirical formula for retreat displacement, involving the distance of the initial shoreline and the gap spacing of the breakwaters as parameters, was proposed and verified against field data given in Khuong [49]. According to the validation results of on-site beaches, this formula can, with the help of MEPBAY, be used to predict equilibrium bay-shaped shorelines in the lee of detached breakwaters during the breakwater layout planning stage.
Author Contributions
C.-P.T. conceived and supervised this study, writing—original draft, review and editing; Y.-C.C. conducted numerical simulations, analyzed data, writing—original draft, review and editing; C.-H.K. took part in the simulation procedure and discussion. All authors have read and agreed to the published version of the manuscript.
Funding
The authors wish to thank the National Science and Technology Council of Taiwan for financial support under Grant No. MOST 106-2221-E-005-046-MY3.
Informed Consent Statement
Not applicable.
Data Availability Statement
Not applicable.
Conflicts of Interest
The authors declare no conflict of interest.
References
- Toyoshima, O. Design of a detached breakwater system. Coast. Eng. 1974, 14, 1419–1431. [Google Scholar] [CrossRef]
- Toyoshima, O. Variation of Foreshore due to detached breakwaters. Coast. Eng. Proc. 1982, 18, 1873–1892. [Google Scholar] [CrossRef]
- Noble, R.M. Coastal structures’ effects on shorelines. Coast. Eng. Proc. 1978, 16, 2069–2085. [Google Scholar] [CrossRef]
- Nir, Y. Offshore artificial structures and their influence on the Israel and Sinai Mediterranean beaches. Coast. Eng. Proc. 1982, 18, 1837–1856. [Google Scholar] [CrossRef] [Green Version]
- Noda, H. Depositional effects of offshore breakwater due to onshore–offshore sediment movement. Coast. Eng. Proc. 1984, 19, 2009–2025. [Google Scholar] [CrossRef] [Green Version]
- Harris, M.M.; Herbich, J.B. Effects of breakwater spacing on sand entrapment. J. Hydraul. Res. 1986, 24, 347–357. [Google Scholar] [CrossRef]
- Fairley, I.; Davidson, M.; Kingston, K.; Dolphin, T.; Phillips, R. Empirical orthogonal function analysis of shoreline changes behind two different designs of detached breakwaters. Coast. Eng. 2009, 56, 1097–1108. [Google Scholar] [CrossRef]
- Jaramillo, C.; Jara, M.S.; González, M.; Medina, R. A shoreline evolution model for embayed beaches based on cross-shore, planform and rotation equilibrium models. Coast. Eng. 2021, 169, 103983. [Google Scholar] [CrossRef]
- Lesser, G.R.; Roelvink, J.A.; van Kester, J.A.T.M.; Stelling, G.S. Development and validation of a three-dimensional morphological model. Coast. Eng. 2004, 51, 883–915. [Google Scholar] [CrossRef]
- Fernando, P.T.; Pan, S. Modelling wave of hydrodynamics around a scheme of detached leaky breakwaters. Coast. Eng. 2005, 4, 830–841. [Google Scholar] [CrossRef]
- Li, M.; Fernando, P.T.; Pan, S.; O’Connor, B.A.; Chen, D. Development of a quasi-3d numerical model for sediment transport prediction in the coastal region. J. Hydro-Environ. Res. 2007, 1, 143–156. [Google Scholar] [CrossRef]
- Wang, B.; Reeve, D. Probabilistic modelling of long-term beach evolution near segmented shore-parallel breakwaters. Coast. Eng. 2010, 57, 732–744. [Google Scholar] [CrossRef]
- Tang, J.; Lyu, Y.; Shen, Y.; Zhang, M. Numerical study on influences of breakwater layout on coastal waves, wave-induced currents, sediment transport and beach morphological evolution. Ocean. Eng. 2017, 141, 375–387. [Google Scholar] [CrossRef]
- Mory, M.; Ham, L. Wave height, setup and currents around a detached breakwater submitted to regular or random wave forcing. Coast. Eng. 1997, 31, 77–96. [Google Scholar] [CrossRef]
- Gourlay, M.R. Wave set-up and wave generated currents in the lee of a breakwater or headland. In Proceedings of the 14th International Conference on Coastal Engineering, Copenhagen, Denmark, 24–28 June 1974. [Google Scholar]
- Van Rijn, L.C. Detached Breakwaters. 2018. Available online: www.leovanrijn-sediment.com (accessed on 13 November 2019).
- Araújo, M.A.V.C.; Di Bona, S.; Trigo-Teixeira, A. Impact ofdetached breakwaters on shoreline evolution: A case study on the Portuguese west coast. J. Coast. Research. 2014, 70, 41–46. [Google Scholar] [CrossRef]
- Hanson, H. GENESIS—A Generalized Shoreline Change Numerical Model. J. Coast. Res. 1989, 5, 1–27. [Google Scholar]
- Guimarães, A.; Coelho, C.; Veloso-Gomes, F.; Silva, P. Modelling Shoreline Impacts of Detached Breakwaters: LTC and GENESIS Comparison. Coast. Struct. Conf. 2019, 782–790. [Google Scholar] [CrossRef]
- Coelho, C. Riscos de Exposição de Frentes Urbanas Para Diferentes Intervenções de Defesa Costeira. Ph.D. Thesis, Civil Engineering Department, University of Aveiro, Aveiro, Portugal, 2005; p. 404. [Google Scholar]
- de Macêdo, R.J.A.; Manso, V.D.A.V.; da Fontoura Klein, A.H. The geometric relationships of salients and tombolos alonga mesotidal tropical coast. Geomorphology 2022, 411, 108311. [Google Scholar] [CrossRef]
- Klein, A.H.F.; Junior, N.A.; Menezes, J.T. Shoreline salients and tombolos on the Santa Catarina coast (Brazil): Description and analysis of the morphological relationships. J. Coast. Res. 2002, SI 36, 425–440. [Google Scholar] [CrossRef]
- Dally, W.R.; Pope, J. Detached Breakwaters for Shore Protection; Department of the Army Waterways Experiment Station, Corps of Engineers: Vicksburg, MI, USA, 1986. [Google Scholar]
- Suh, K.; Dalrymple, R.A. Offshore Breakwaters in Laboratory and Field. J. Waterw. Port Coast. Ocean. Eng. 1987, 113, 2. [Google Scholar] [CrossRef]
- Bricio, L.; Negro, V.; Diez, J.J. Geometric detached breakwater indicators on the Spanish Northeast Coastline. J. Coast. Res. 2008, 24, 1289–1303. [Google Scholar] [CrossRef]
- Hsu, J.R.C.; Silvester, R. Accretion behind single offshore breakwaters. J. Waterw. Port Coast. Ocean. Eng. 1990, 116, 362–380. [Google Scholar] [CrossRef]
- Hsu, J.R.C.; Evans, C. Parabolic bay shapes and applications. Proc. Inst. Civ. Eng. 1989, 87, 557–570. [Google Scholar] [CrossRef]
- Hsu, J.R.C.; Uda, T.; Silvester, R. Beaches downcoast of harbours in bays. Coast. Eng. 1993, 19, 163–181. [Google Scholar] [CrossRef]
- Hsu, J.R.C.; Silvester, R. Stabilizing beaches downcoast of harbor extension. In Proceedings of the 25th International Conference on Coastal Engineering, Orlando, FL, USA, 2–6 September 1996; Volume 4, pp. 3986–3999. [Google Scholar] [CrossRef]
- Smith, G.G.; Dunkley, E.; Soltau, C. Shoreline response to harbour developments in Table Bay. In Proceedings of the 27th International Conference on Coastal Engineering, Sydney, Australia, 16–21 July 2000; Volume 3, pp. 2822–2835. [Google Scholar] [CrossRef]
- Benedet, L.; Klein, A.H.F.; Hsu, J.R.C. Practical insights and applicability of empirical bay shape equations. In Proceedings of the 29th International Conference on Coastal Engineering, Lisbon, Portugal, 19–24 September 2004; Volume 2, pp. 2181–2193. [Google Scholar] [CrossRef]
- Hsu, J.R.C.; Benedet, L.; Klein, A.H.F.; Raabe, A.L.A.; Tsai, C.P.; Hsu, T.W. Appreciation of Static Bay Beach Concept for Coastal Management and Protection. J. Coast. Res. 2008, 24, 198–215. [Google Scholar] [CrossRef]
- Hsu, J.R.C.; Lee, J.L.; Klein, A.H.F.; Mauricio, G.; Medina, R. Headland-bay Beaches: Static Equilibrium Concept for Shoreline Management. Adv. Ser. Ocean. Eng. 2012, 53, 812. [Google Scholar] [CrossRef]
- Klein, A.H.F.; Vargas, A.; Raabe, A.L.A.; Hsu, J.R.C. Visual assessment of bayed beach stability using computer software. Comput. Geosci. 2003, 29, 1249–1257. [Google Scholar] [CrossRef]
- Hsu, J.R.C.; Yu, M.M.J.; Lee, F.C.; Silvester, R. Headland-Bay Beaches for Recreation and Shore Protection. Handb. Coast. Ocean. Eng. 2009, 825–842. [Google Scholar] [CrossRef]
- Roelvink, D.; Reniers, A.; van Dongeren, A.; van Thiel de Vries, J.; McCall, R.; Lescinski, J. Modelling storm impacts on beaches, dunes and barrier islands. Coast. Eng. 2009, 56, 1133–1152. [Google Scholar] [CrossRef]
- Roelvink, D.; McCall, R.; Mehvar, S.; Nederhoff, K.; Dastgheib, A. Improving predictions of swash dynamics in XBeach: The role of groupiness and incident-band run up. Coast. Eng. 2018, 134, 103–123. [Google Scholar] [CrossRef]
- De Vet, P.L.M.; McCall, R.T.; Den Bieman, J.P.; van Ormondt, M.; Stive, M.J.F. Modelling dune erosion, overwash and breaching at fire island (NY) during hurricane sandy. In Proceedings of the Coastal Sediment, San Diego, CA, USA, 11–15 May 2015; pp. 1–10. [Google Scholar] [CrossRef] [Green Version]
- Nederhoff, C.M.; Lodder, Q.J.; Boers, M.; Den Bieman, J.P.; Miller, J.K. Modeling the effects of hard structures on dune erosion and overwash—A case study of the impact of Hurricane Sandy on the New Jersey coast. In Proceedings of the Coastal Sediments, San Diego, CA, USA, 11–15 May 2015. [Google Scholar] [CrossRef] [Green Version]
- Splinter, K.D.; Carley, J.T.; Golshani, A.; Tomlinson, R. A relationship to describe the cumulative impact of storm clusters on beach erosion. Coast. Eng. 2014, 83, 49–55. [Google Scholar] [CrossRef]
- de Winter, R.C.; Gongriep, F.; Ruessink, B.G. Observations and modeling of alongshore variability in dune erosion at Egmond aan Zee, The Netherlands. Coast. Eng. 2015, 99, 167–175. [Google Scholar] [CrossRef]
- Smallegan, S.M.; Irish, J.L.; van Dongeren, A.R. Developed barrier island adaptation strategies to hurricane forcing under rising sea levels. Clim. Change 2017, 143, 173–184. [Google Scholar] [CrossRef]
- Fried, I. Protection by means of offshore breakwaters. Coast. Eng. Proc. 1976, 15, 1407–1424. [Google Scholar] [CrossRef] [Green Version]
- Rosen, D.S.; Vajda, M. Sedimentological influences of detached breakwaters. In Proceedings of the 18th International Conference on Coastal Engineering, Cape Town, South Africa, 14–19 November 1982; Volume 18, pp. 1930–1948. [Google Scholar] [CrossRef]
- Nir, Y. Detached Breakwaters, Groynes and Artificial Structures on the Mediterranean Shore and Their Influence on the Structure of the Israeli Shore; Report No. 3, 76/2; Ministry of Industry and Commerce, Geological Institute, Marine Geology Section: Jerusalem, Israel, 1976. [Google Scholar]
- Berenguer, J.M.; Enriquez, J. Design of pocket beaches. The Spainish case. In Proceedings of the 21st International Conference on Coastal Engineering, Costa del Sol-Malaga, Spain, 20–25 June 1988; pp. 1411–1425. [Google Scholar] [CrossRef]
- Uda, T. Statistical analysis of detached breakwaters in Japan Coastal Engineering. Coast. Eng. Proc. 1988, 21, 2028–2042. [Google Scholar] [CrossRef] [Green Version]
- González, M.; Medina, R. On the application of static equilibrium bay formulations to natural and man-made beaches. Coast. Eng. 2001, 43, 209–225. [Google Scholar] [CrossRef]
- Khuong, T.C. Shoreline Response to Detached Breakwaters in Prototype. Doctoral Dissertation, Delft University of Technology, Delft, The Netherlands, 2016. [Google Scholar] [CrossRef]
- McCall, R.T.; Van Thiel de Vries, J.S.M.; Plant, N.G.; Van Dongeren, A.R.; Roelvink, J.A.; Thompson, D.M.; Reniers, A.J.H.M. Two-dimensional time dependent hurricane overwash and erosion modeling at Santa Rosa Island. Coast. Eng. 2010, 57, 668683. [Google Scholar] [CrossRef]
- Splinter, K.D.; Palmsten, M.L. Modeling dune response to an east coast low. Mar. Geol. 2012, 329–331, 46–57. [Google Scholar] [CrossRef]
- Van Geer, P.; den Bieman, J.; Hoonhout, B.; Boers, M. XBeach 1D—Probabilistic model: ADIS, Settings, Model uncertainty and Graphical User Interface. Tec. Rep. 2015, 1209436, 65. [Google Scholar]
- Do, K.; Shin, S.; Cox, D.; Yoo, J. Numerical Simulation and Large-Scale Physical Modelling of Coastal Sand Dune Erosion. J. Coast. Res. 2018, 85, 196–200. [Google Scholar] [CrossRef]
- Roelvink, J.A. Coastal morphodynamic evolution techniques. Coast. Eng. 2006, 53, 277–287. [Google Scholar] [CrossRef]
- Vousdoukas, M.I.; Almeida, L.P.; Ferreira, Ó. Modelling storm-induced beach morphological change in a meso-tidal, reflective beach using XBeach. J. Coast. Res. 2011, 64, 1916–1920. [Google Scholar] [CrossRef]
- Razak, M.S.; Nor, N.A.Z.M. XBeach process-based modelling of coastal morphological features near breakwater. MATEC Web Conf. 2018, 203, 1007. [Google Scholar] [CrossRef] [Green Version]
- Vieira, B.F.V.; Pinho, J.L.S.; Barros, J.A.O.; Carmo, J.S.A. Hydrodynamics and morphodynamics performance assessment of three coastal protection structures. J. Mar. Sci. Eng. 2020, 8, 175. [Google Scholar] [CrossRef] [Green Version]
- Shimizu, T.; Maruyama, K.; Kajima, R.; Saito, S. Characteristics of Field Type Measuring Equipments Tested in a Large Wave Flume Wave Gages, Current Meters, and Depthmeters; Civil Engineering Labrotary Report; CRIEPI: Tokyo, Japan, 1983. (In Japanese) [Google Scholar]
- Dean, R.G. Equilibrium Beach Profiles: U.S. Atlantic and Gulf Coasts; Technical Report No. 12; University of Delaware: Newark, Delaware, 1977. [Google Scholar]
- Van Rijn, L.C. Principles of Sediment Transport in Rivers, Estuaries and Coastal Seas. 1993. Available online: www.aquapublications.nl (accessed on 13 November 2019).
Figure 1.
Tombolo formation in the lee of detached breakwaters.

Figure 2.
Configuration of detached breakwaters for numerical simulations.
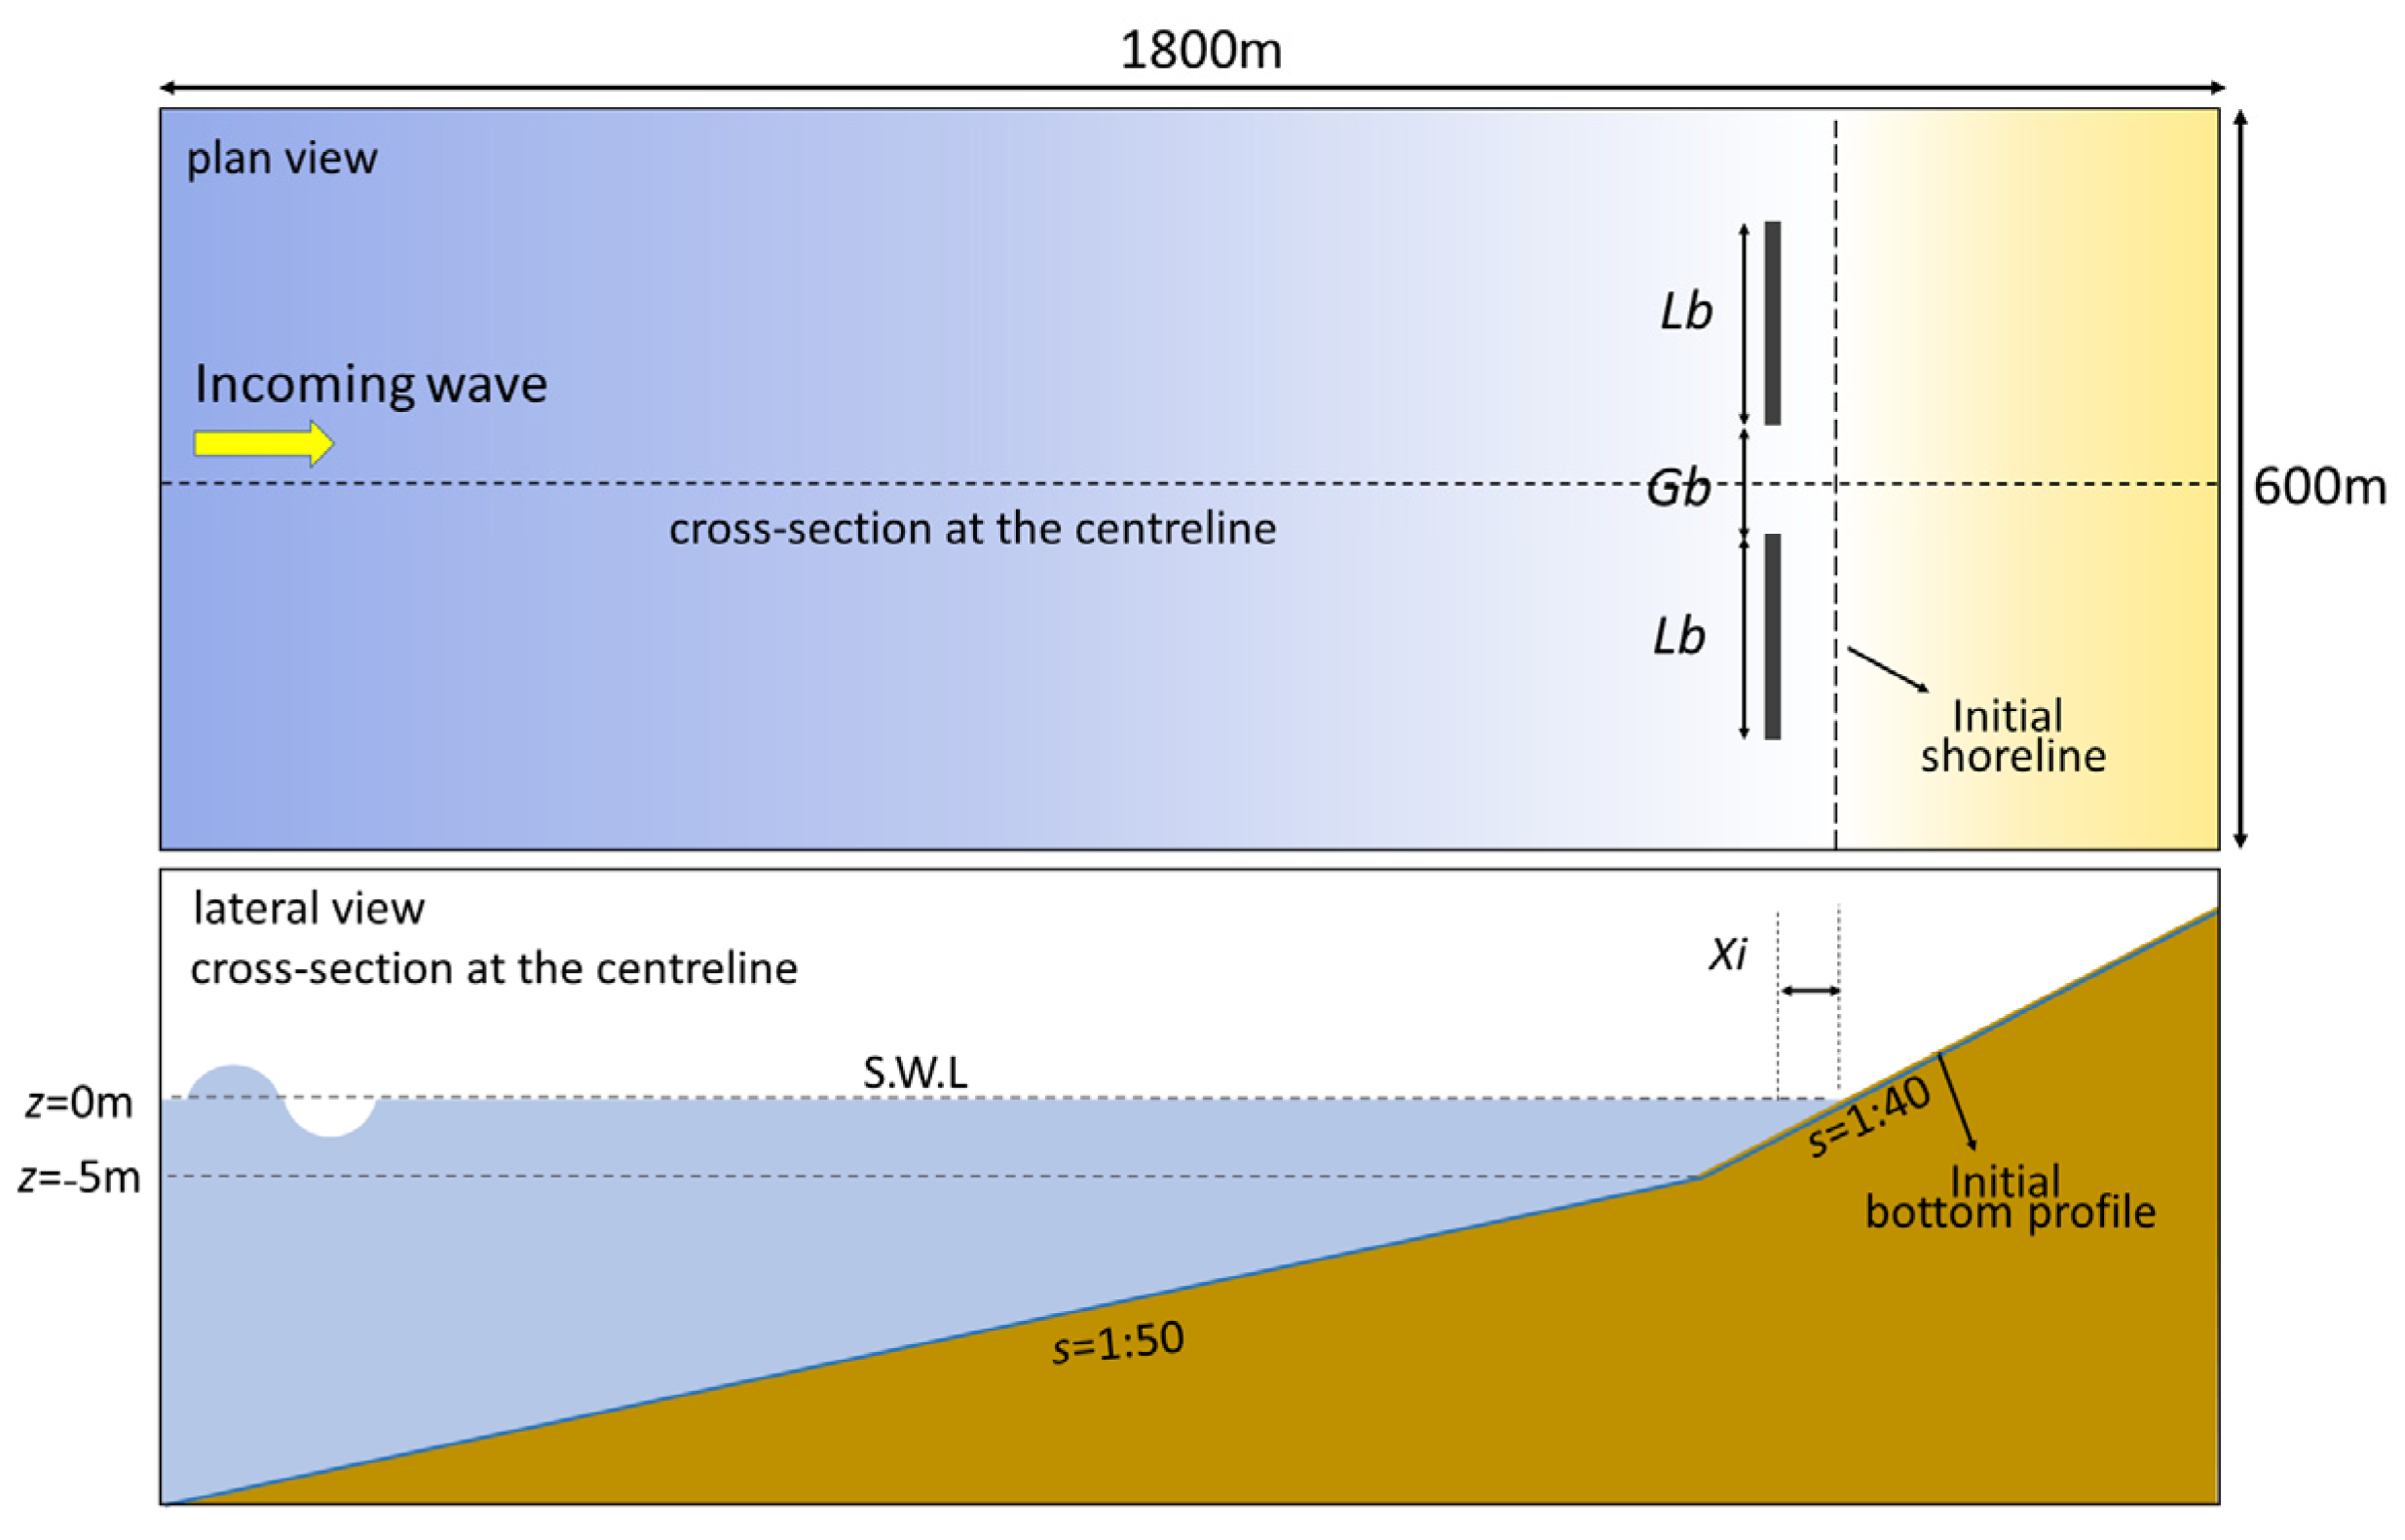
Figure 3.
Computational meshes for numerical simulations.
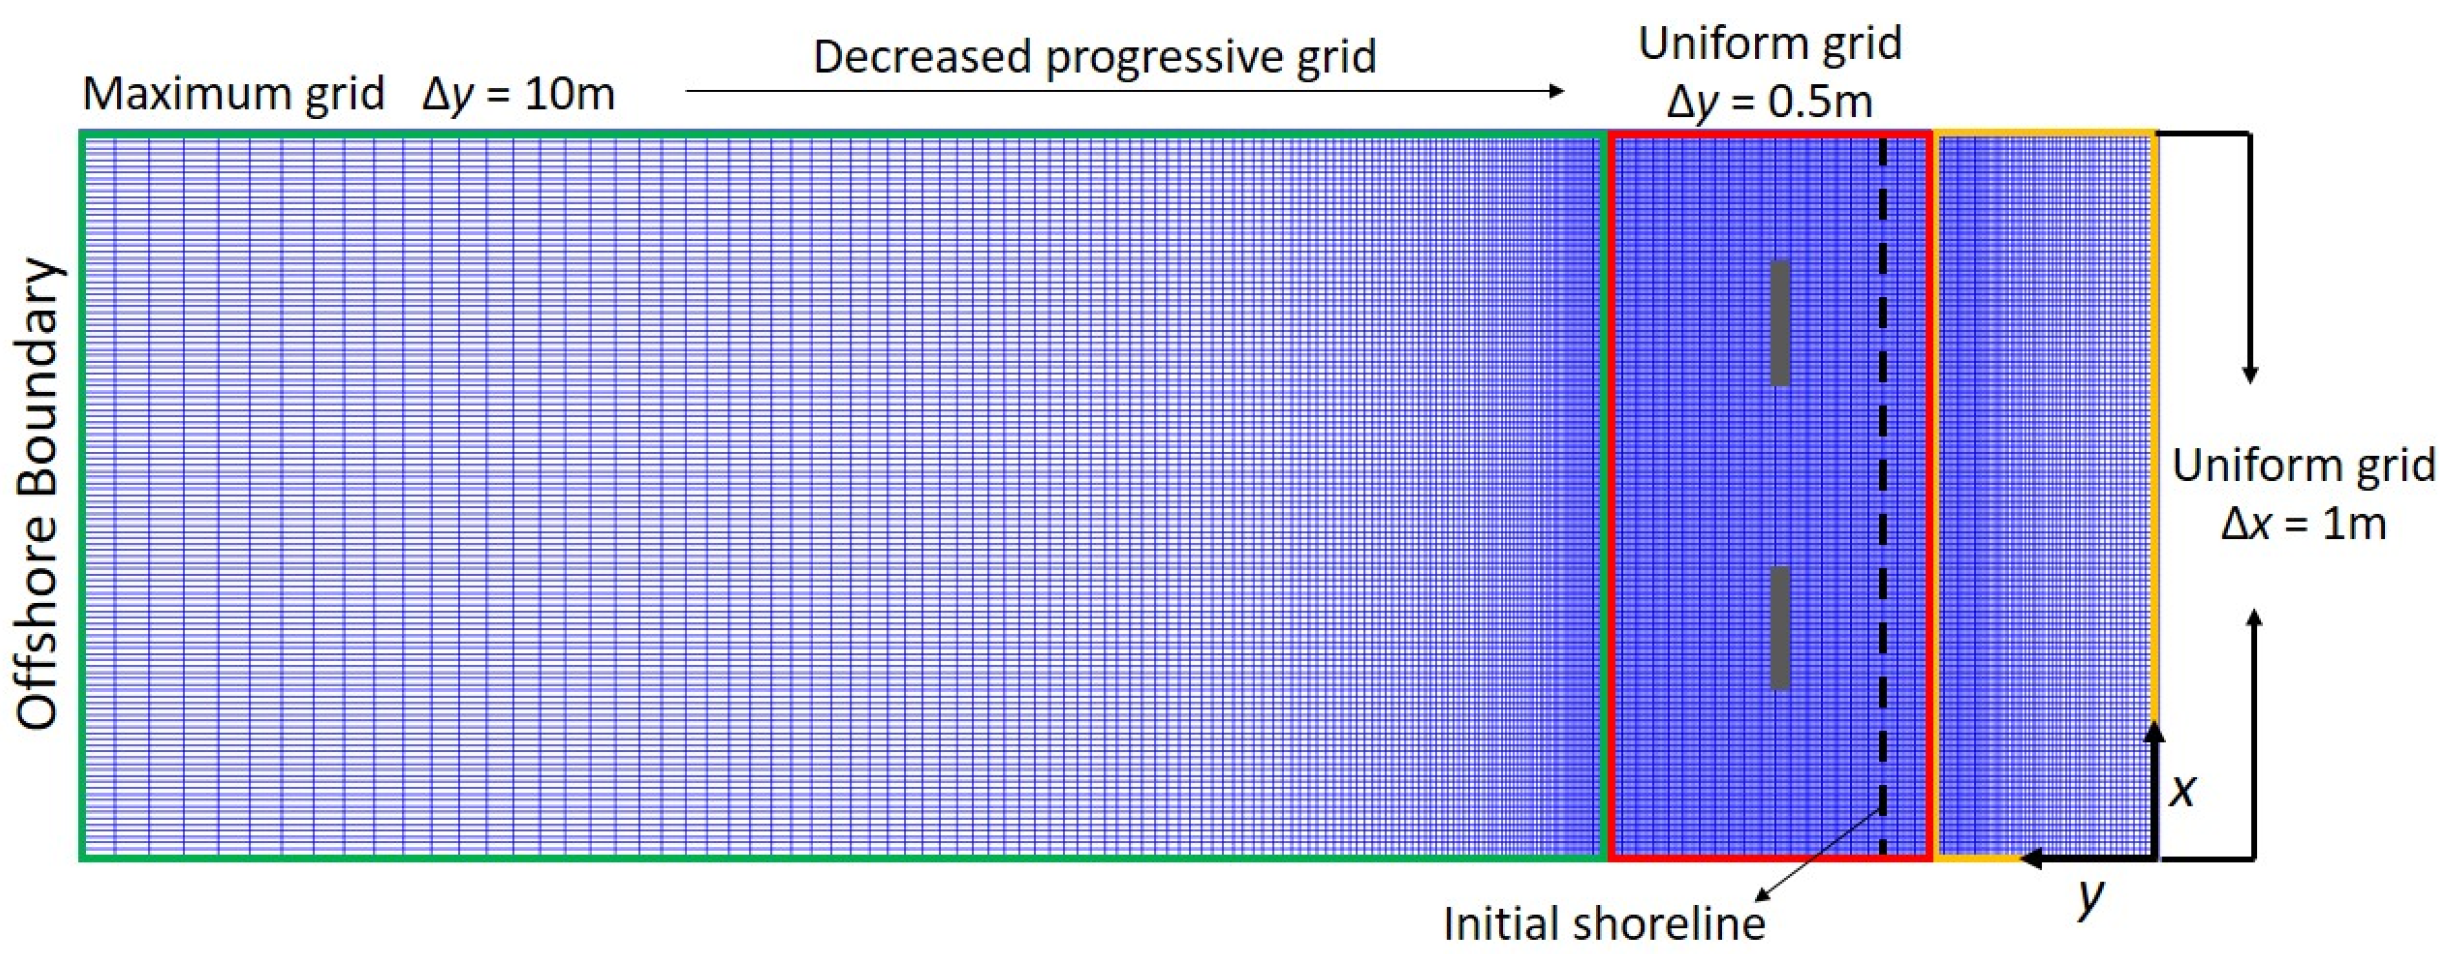
Figure 4.
The comparisons of the distribution of wave height and the bottom profile with the case1-3 of CRIEPI.
Figure 4.
The comparisons of the distribution of wave height and the bottom profile with the case1-3 of CRIEPI.
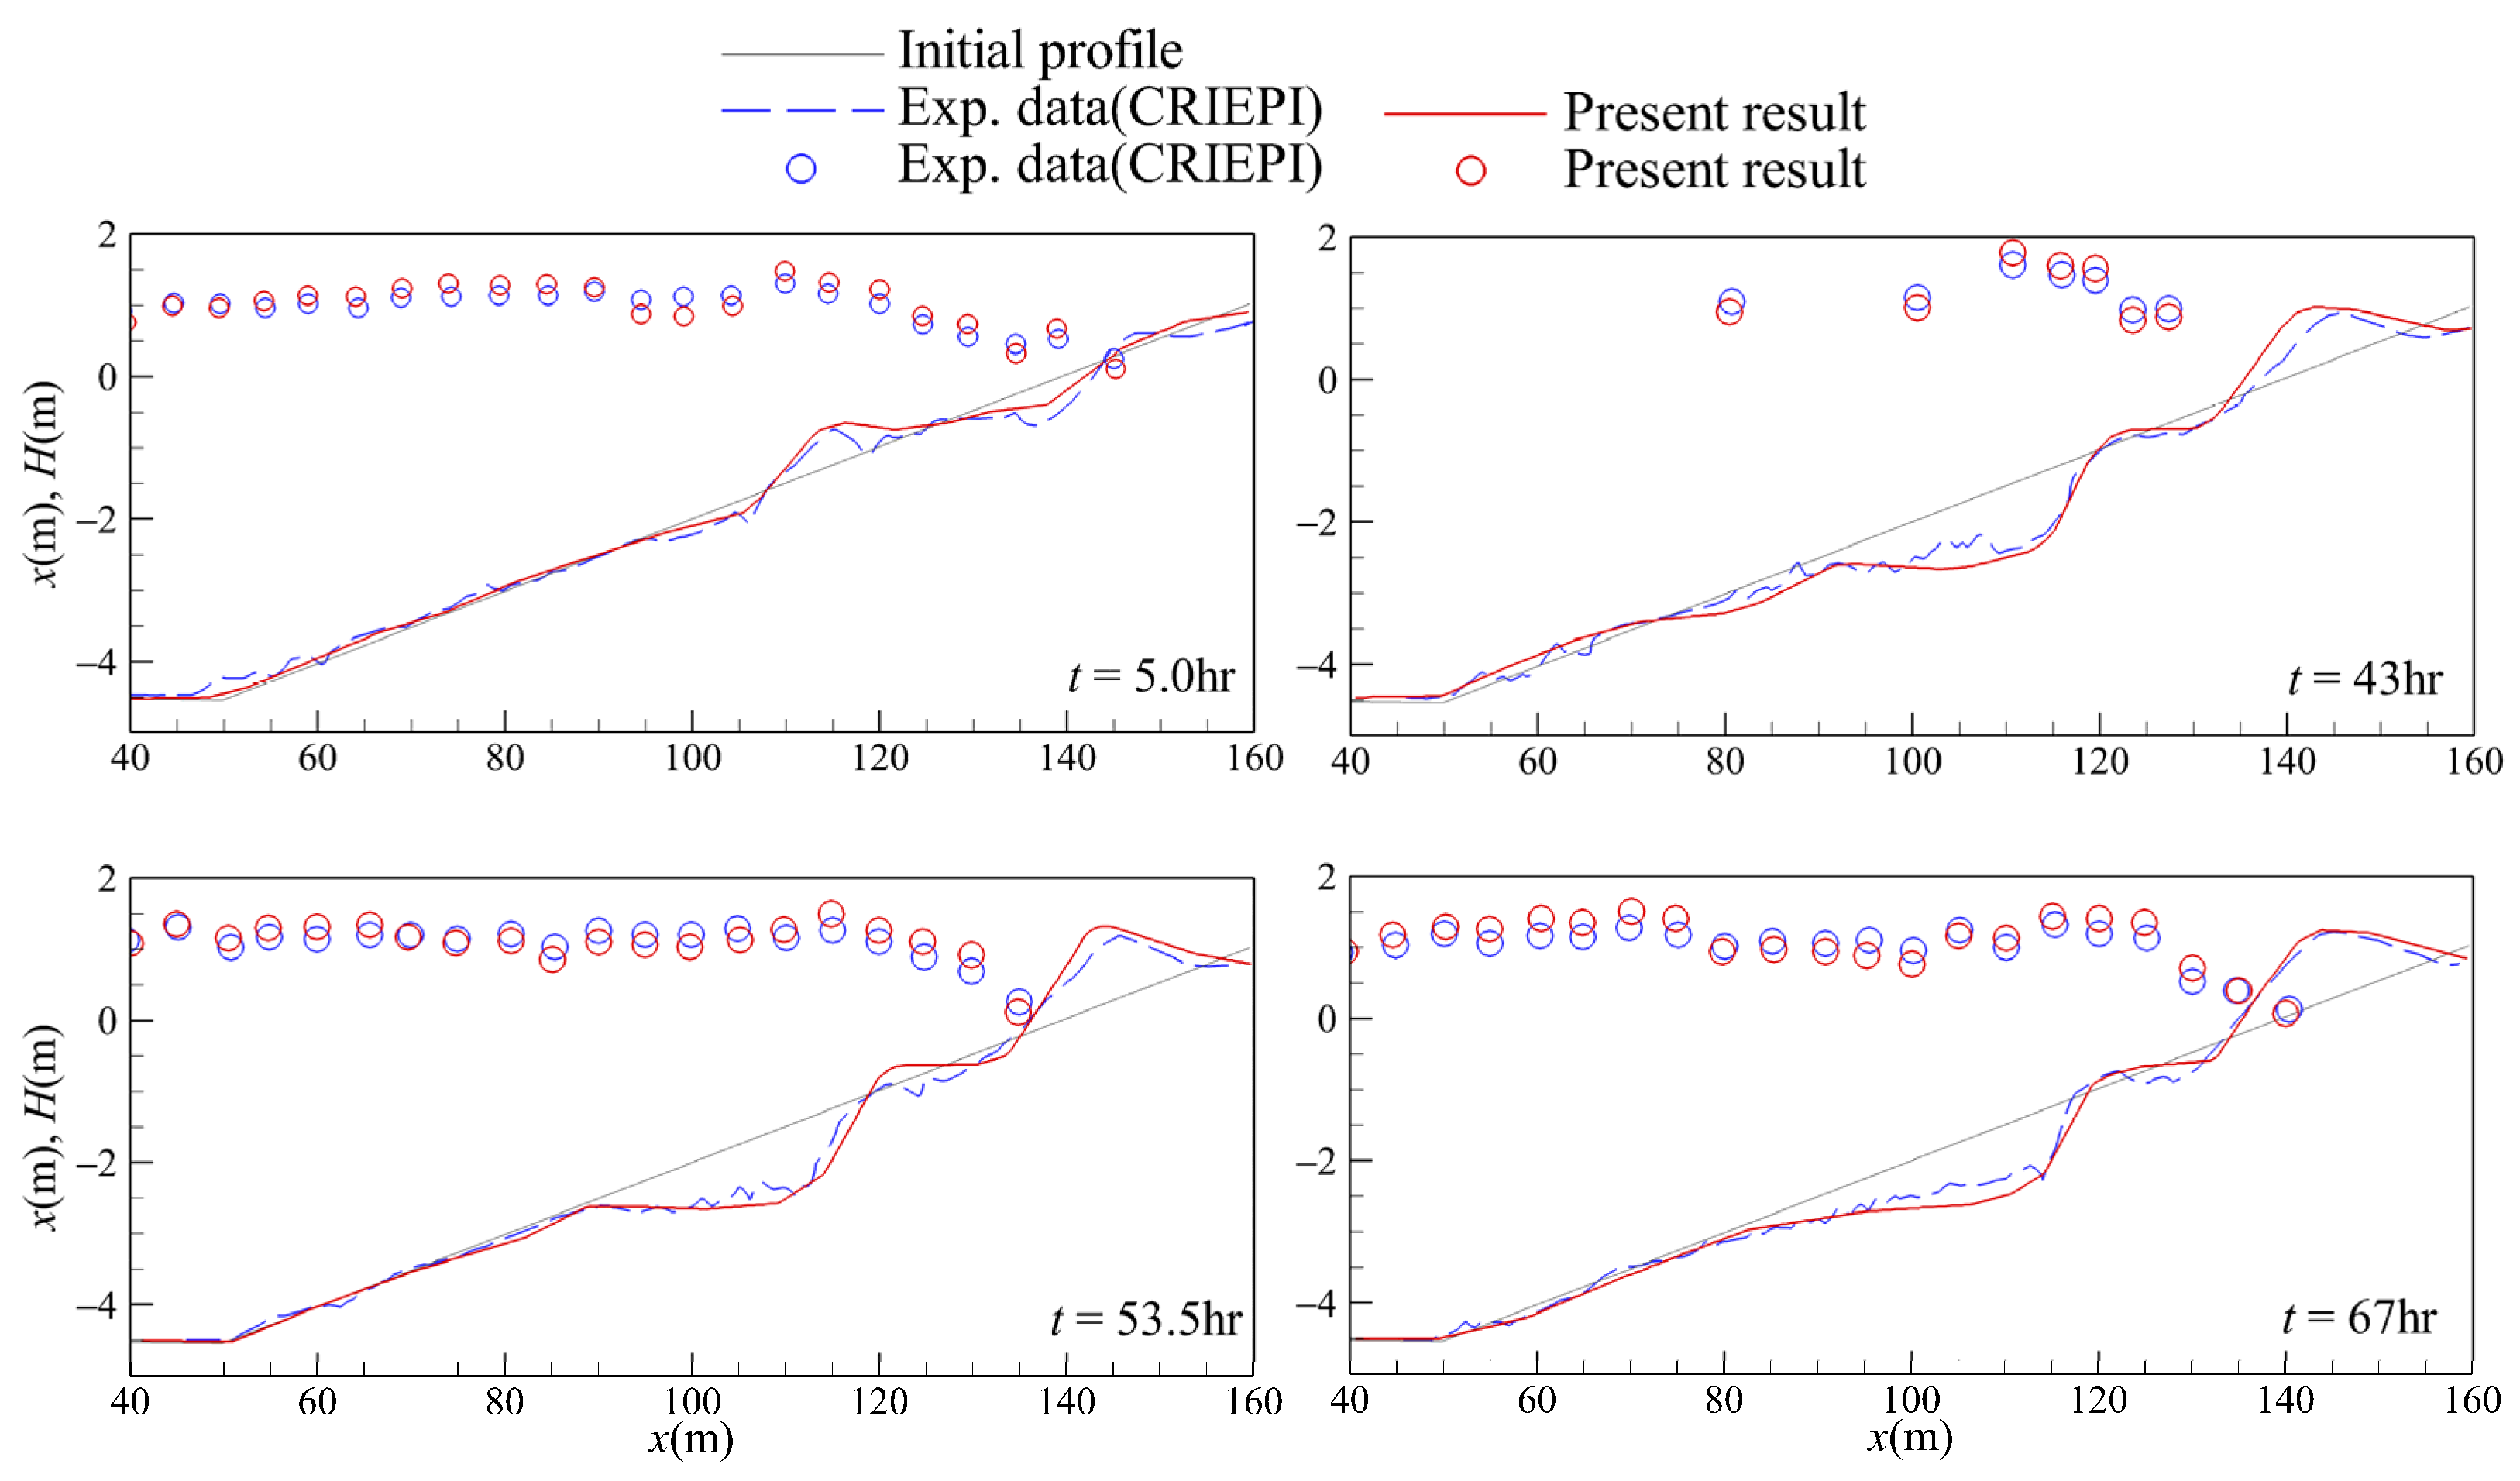
Figure 5.
Temporal and spatial variations in wave height, current pattern, and sediment transport rate for Xi/Gb = 1. Left: wave height and water level variations, Right: current (with arrow), sediment transport and bottom bathymetry variations. Red dash lines: shoreline variations.
Figure 5.
Temporal and spatial variations in wave height, current pattern, and sediment transport rate for Xi/Gb = 1. Left: wave height and water level variations, Right: current (with arrow), sediment transport and bottom bathymetry variations. Red dash lines: shoreline variations.

Figure 6.
Temporal and spatial evolution of shorelines and bottom profiles for Xi/Gb = 1.
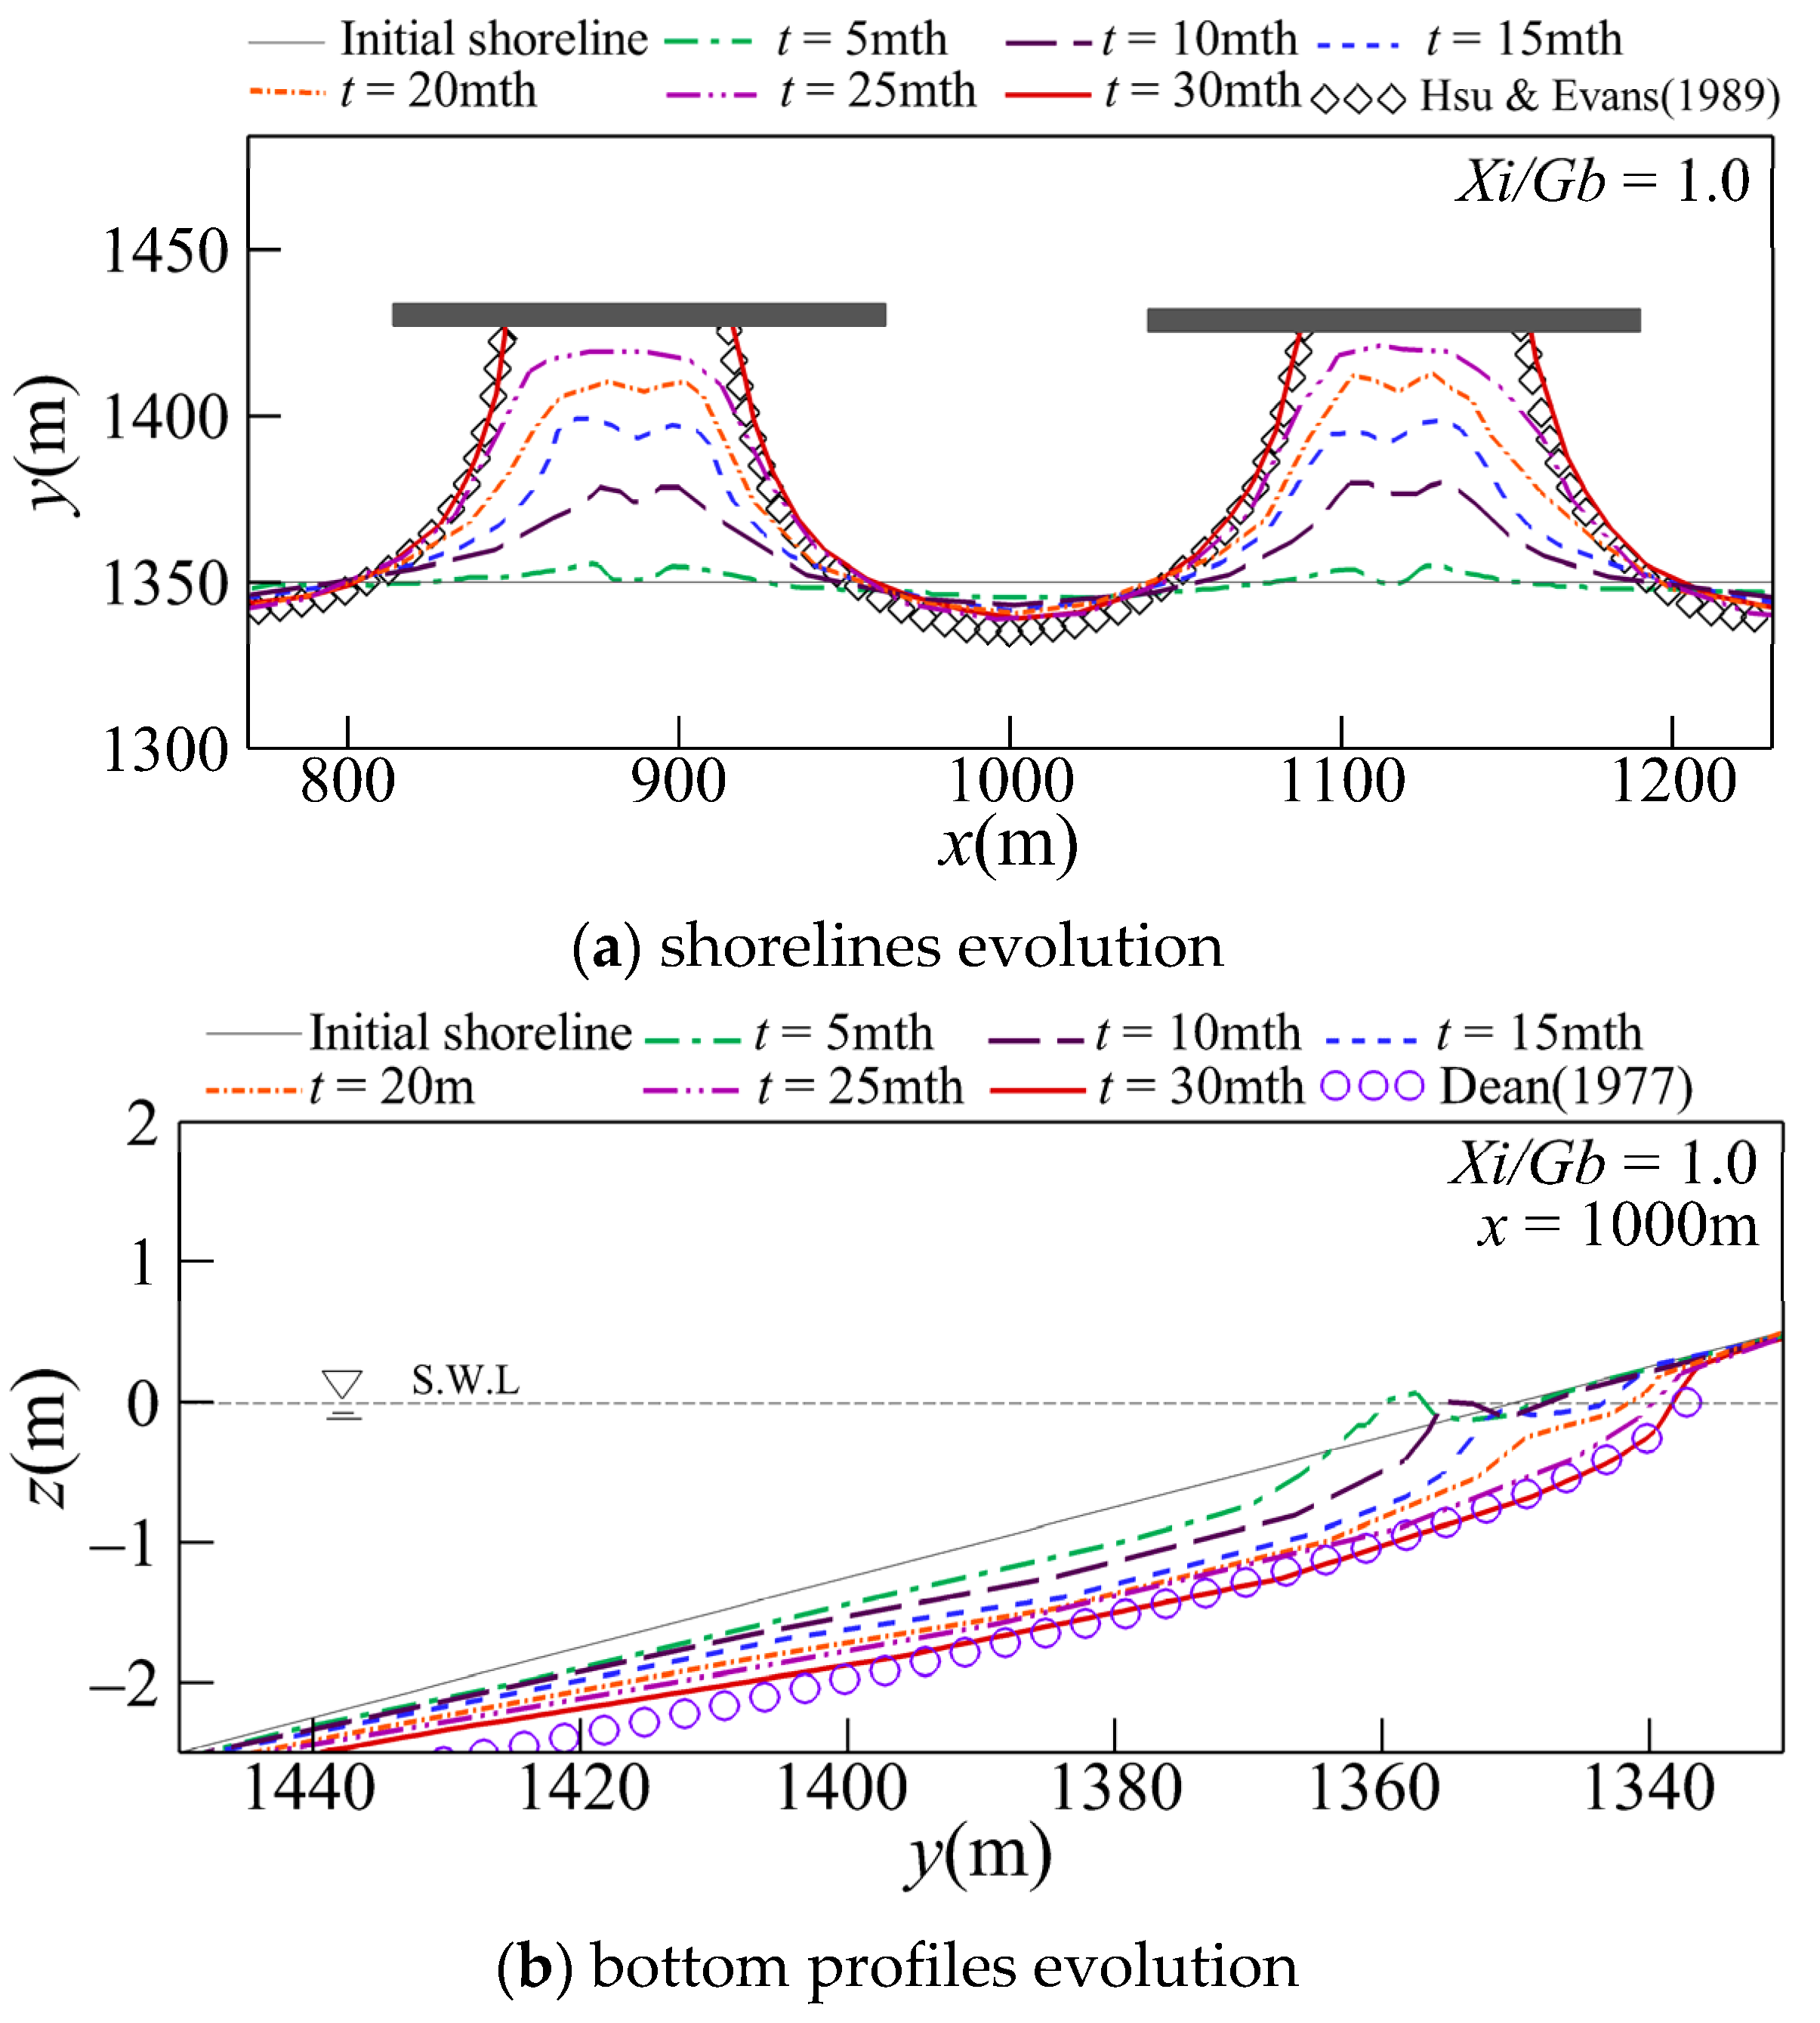
Figure 7.
Comparison of the simulated equilibrium shorelines for various gap spacings.
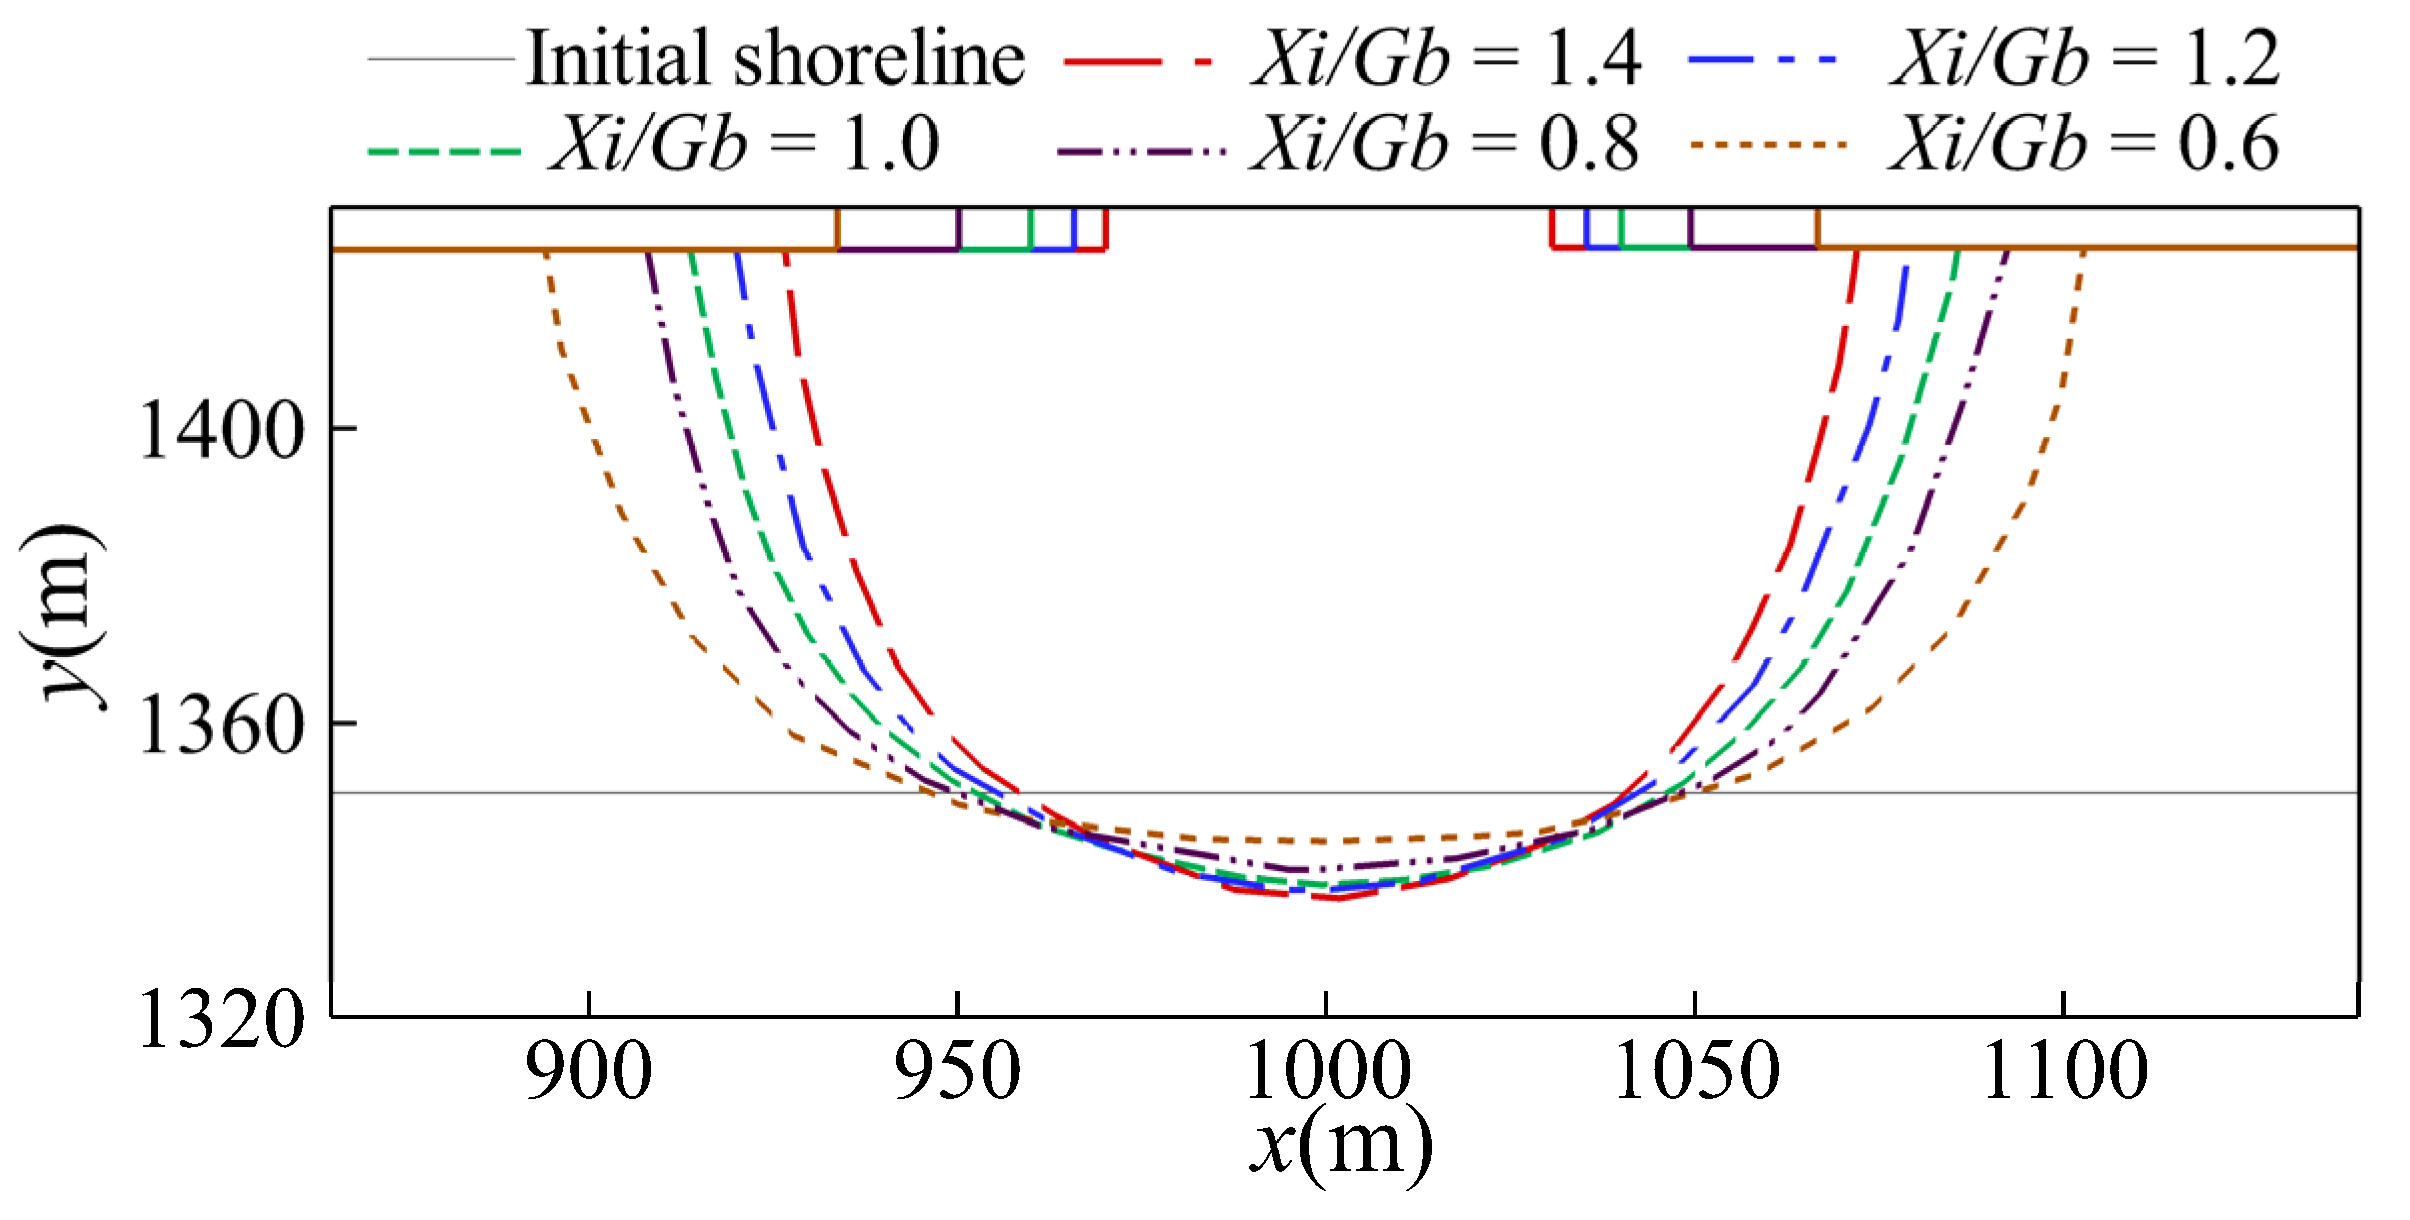
Figure 8.
Temporal changes in retreat displacement at x = 1000 m for various gap spacings.
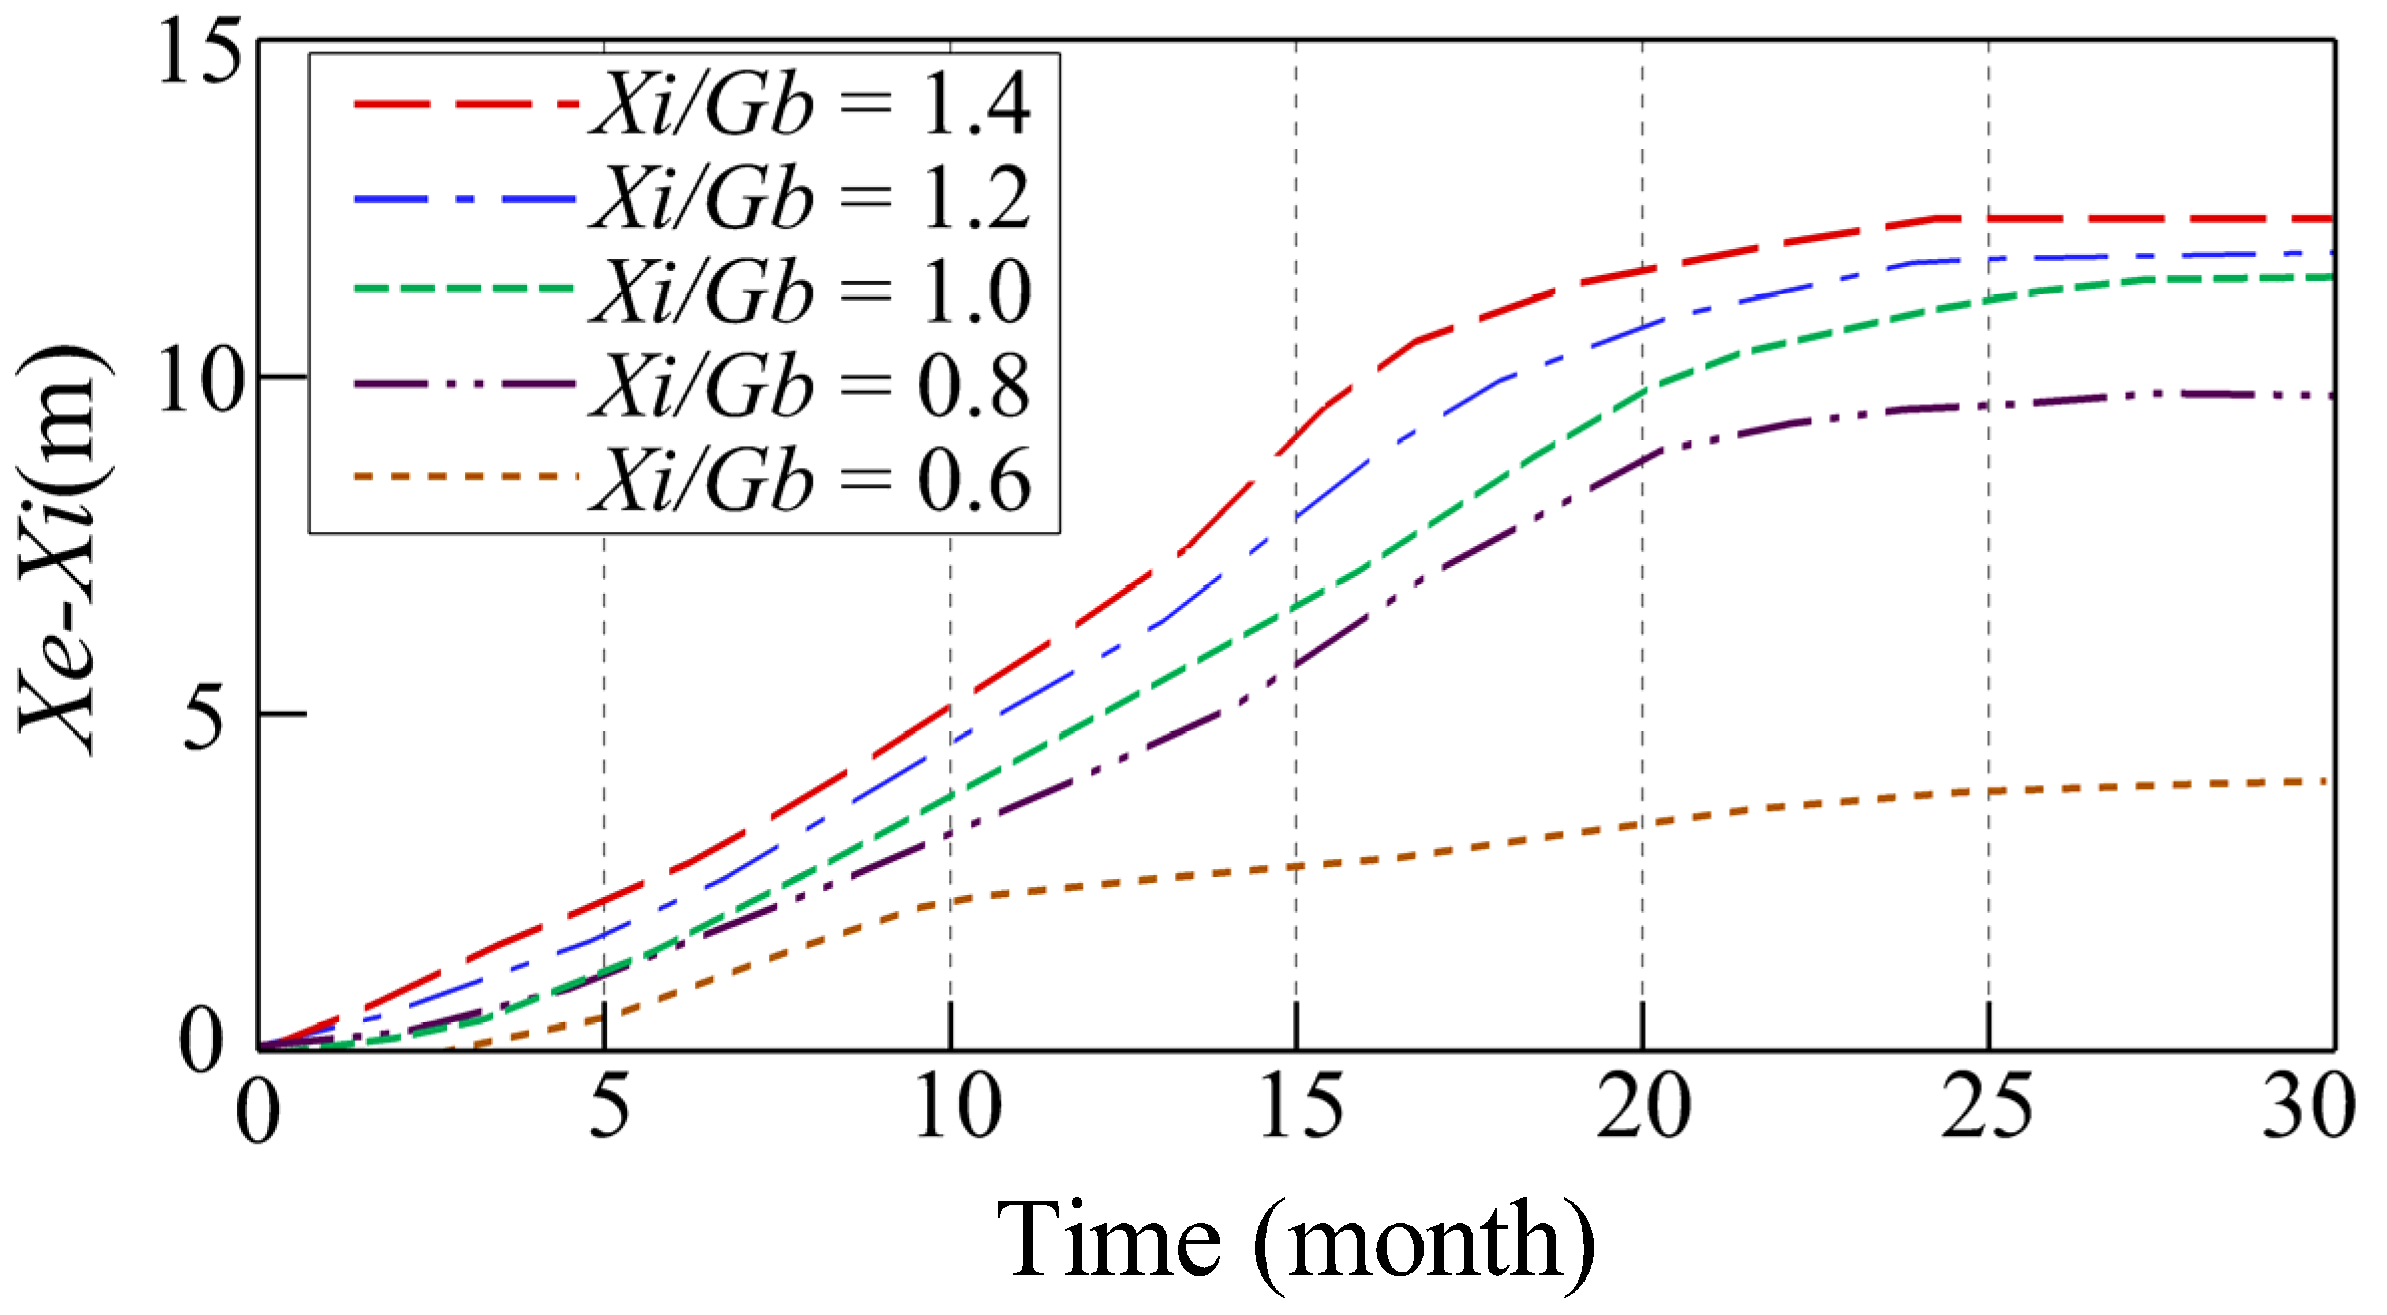
Figure 9.
Comparison of the simulated equilibrium bottom profiles at x = 1000 m for various gap spacings.
Figure 9.
Comparison of the simulated equilibrium bottom profiles at x = 1000 m for various gap spacings.

Figure 10.
Comparison of the simulated bottom profiles with the predictions [59].
Figure 10.
Comparison of the simulated bottom profiles with the predictions [59].

Figure 11.
Relationship between Xe/Gb and Xi/Gb.

Figure 12.
Predictions of equilibrium shorelines in the lee of breakwaters for example beaches. (Images courtesy of Google Earth).
Figure 12.
Predictions of equilibrium shorelines in the lee of breakwaters for example beaches. (Images courtesy of Google Earth).

Table 1.
Simulated conditions for detached breakwaters with various gap spacings.
| Gb (m) | Xi (m) | Lb (m) | Lb/Xi | Gb/Lb | Xi/Gb |
|---|---|---|---|---|---|
| 58 | 80 | 150 | 1.875 | 0.39 | 1.4 |
| 67 | 0.45 | 1.2 | |||
| 80 | 0.53 | 1 | |||
| 100 | 0.67 | 0.8 | |||
| 133 | 0.89 | 0.6 |
Table 2.
Parameters used in the validation of practical scenarios.
| Xi (m) | Gb (m) | Xi/Gb | Xe/Gb (Predicted) | Xe (m) (Predicted) | |
|---|---|---|---|---|---|
| Cubelles Beach, Barcelona, Spain | 83.4 | 97.5 | 0.86 | 0.97 | 94.58 |
| Elm’s Beach, Maryland, USA | 44 | 53 | 0.83 | 0.93 | 49.29 |
| Skagen Kattegat, Denmark | 25 | 25 | 1. | 1.13 | 28.25 |
| San Antonio beach, València, Spain | 100 | 89 | 1.12 | 1.28 | 113.92 |
| Nordau Beach, Tel Aviv, Israel | 200 | 135 | 1.48 | 1.71 | 230.85 |
Disclaimer/Publisher’s Note: The statements, opinions and data contained in all publications are solely those of the individual author(s) and contributor(s) and not of MDPI and/or the editor(s). MDPI and/or the editor(s) disclaim responsibility for any injury to people or property resulting from any ideas, methods, instructions or products referred to in the content. |
© 2023 by the authors. Licensee MDPI, Basel, Switzerland. This article is an open access article distributed under the terms and conditions of the Creative Commons Attribution (CC BY) license (https://creativecommons.org/licenses/by/4.0/).
Share and Cite
MDPI and ACS Style
Tsai, C.-P.; Chen, Y.-C.; Ko, C.-H. Prediction of Bay-Shaped Shorelines between Detached Breakwaters with Various Gap Spacings. Sustainability 2023, 15, 6218. https://doi.org/10.3390/su15076218
AMA Style
Tsai C-P, Chen Y-C, Ko C-H. Prediction of Bay-Shaped Shorelines between Detached Breakwaters with Various Gap Spacings. Sustainability. 2023; 15(7):6218. https://doi.org/10.3390/su15076218
Chicago/Turabian StyleTsai, Ching-Piao, Ying-Chi Chen, and Chun-Han Ko. 2023. "Prediction of Bay-Shaped Shorelines between Detached Breakwaters with Various Gap Spacings" Sustainability 15, no. 7: 6218. https://doi.org/10.3390/su15076218
Note that from the first issue of 2016, this journal uses article numbers instead of page numbers. See further details here.