Article

Exploring the Choice of Bicycling and Walking in Rajshahi, Bangladesh: An Application of Integrated Choice and Latent Variable (ICLV) Models

1
Department of Urban and Regional Planning, Rajshahi University of Engineering and Technology, Rajshahi 6204, Bangladesh
2
Institute of Transportation Studies, University of California Davis, Davis, CA 95616, USA
3
School of Earth, Environment & Society, McMaster University, Hamilton, ON L8S 4K1, Canada
4
Transportation Planner, Des Moines, IA 50315, USA
*
Author to whom correspondence should be addressed.
Sustainability 2022, 14(22), 14784; https://doi.org/10.3390/su142214784
Submission received: 18 September 2022 / Revised: 31 October 2022 / Accepted: 2 November 2022 / Published: 9 November 2022
(This article belongs to the Special Issue Multi-criteria Decision Making and Sustainable Transport)

Abstract

:
Bangladesh has emphasized active transportation in its transportation policies and has encouraged its population, especially the youth and students, towards bicycling. However, there is a scarcity of studies that have examined the factors important to the choice of active transportation that can be referenced to support the initiative. To address this research gap, in this study, we explore the influence of sociodemographics and latent perceptions of a built environment on the choice to walk and bicycle among students and nonstudents in Rajshahi, Bangladesh. In Rajshahi, we conducted a household survey between July and August, 2017. We used a modeling framework that integrated choice and latent variable (ICLV) models to effectively incorporate the latent perception variables in the choice model, addressing measurement error and endogeneity bias. Our models show that students are influenced by perceptions of safety from crime, while nonstudents are influenced by their perceptions of the walkability of a built environment when choosing a bicycle for commuting trips. For recreational bicycle trips, students are more concerned about the perceptions of road safety, whereas nonstudents are concerned about safety from crime. We find that road safety perception significantly and positively influences walking behavior among nonstudents. Structural equation models of the latent perception variables show that females are more likely to provide lower perceptions of neighborhood walkability, road safety, and safety from crime. Regarding active transportation decisions, overall, we find there is a difference between student and nonstudent groups and also within these groups. The findings of this study can assist in developing a sustainable active transportation system by addressing the needs of different segments of the population. In this study, we also provide recommendations regarding promoting active transportation in Rajshahi.

1. Introduction

Dependence on active transportation (AT), such as walking and bicycling, is an important characteristic of travel behavior in South Asian countries [1]. In contrast to developed countries, the majority of people in developing countries, such as South Asian countries, cannot afford a car [2], and therefore, have to depend on AT, public transport, or other forms of shared motorized transport. In the context of South Asia, the poor service quality of public transportation greatly encourages people to depend on AT to make trips [3,4,5,6]. AT also complements public transportion by enabling the first and last mile connection to a public transportation mode [7]. Despite the demand in the Global South, AT has largely been overlooked in urban planning and infrastructure development by policymakers who lack an understanding of the benefits of AT [8]. The myriad of benefits of AT that are not well recognized and promoted in the developing world include reduction in congestion, less air pollution, improved transportation safety, public health benefits such as reduction in obesity, and economical investment in infrastructure development [2].
Similar to many other South Asian countries, Bangladesh has long neglected AT in transportation policy and planning. However, the government of Bangladesh has recently started initiatives to encourage AT with the goal of achieving the Sustainable Development Goals (SDGs): SDG 3 on health (increased road safety), SDG 7 on energy, SDG 11 on sustainable cities, and SDG 12 on sustainable consumption and production (reducing subsidies for fossil fuel) [9]. To achieve these SDG goals for Bangladesh, an Integrated Multimodal Transport Policy was formulated to promote bicycling, walking, widening sidewalks, bringing essential services in peri-urban and rural areas within short walking distances, and creating separated bicycle lanes in urban areas [10]. Despite ongoing policy discussions, policymakers in Bangladesh and in other developing countries still have not grasped the influences of socioeconomic, environmental, and cultural factors on AT [8,11,12]. The lack of comprehension of the dynamics of the different factors influencing AT is responsible for the absence of AT in transportation planning and the unsuccessful implementation of AT policies [13]. Reluctance to use AT and the marginalization of AT by higher income people, particularly, bicycling as not smart or transportation of the poor or an outdated travel mode, are plausible reasons behind the absence of AT in policies of developing countries [14,15]. It is important to foster a deeper understanding of the key factors influencing AT for the development of appropriate policies in Bangladesh and in other developing countries.
To address the abovementioned knowledge gap, in this study, we explore the influence of latent perceptions on the choice of AT using Rajshahi, Bangladesh as a case study area. This study used behavioral models to understand the factors, such as travel behavior and latent perception towards the built environment along with sociodemographics that influence the decision to walk and bicycle among students and nonstudents. Rajshahi is an “educational hub” in Bangladesh with six major educational institutions. Unlike other cities, the Rajshahi City Corporation has been at the forefront of advancing AT in Bangladesh by building cycling lanes and widening sidewalks [16]. With these developments, bicycling in Rajshahi is a popular mode of transportation among students [17,18,19]. We performed two types of modeling: (1) use of bicycles (i.e., whether an individual used a bicycle or not) for commuting and recreational trips and (2) daily walking habit (i.e., daily average duration in minutes of an individual’s walk). We hypothesize that bicycling use for different trip purposes is influenced by sociodemographics and transportion access-related factors as well as by individuals’ perceptions regarding their surrounding built environment. We examined the differences in bicycling and walking between students and nonstudents and between students and nonstudents in terms of sociodemographics (i.e., gender), as previous studies have indicated a difference across behaviors and perceptions regarding AT decisions based on gender. Our findings show that factors that influence students’ decisions to bicycle are completely different from those of nonstudents.

2. Literature Review

Many studies have focused on the nexus of socioeconomic factors (age, gender, income, education, etc.), travel distance, and travel time with the selection of AT as travel modes in both developed and developing countries [20,21,22]. In addition, built environment characteristics such as density, land use, street connectivity, crime rate, and traffic volume in network propensity also influence individuals’ decisions regarding walking or biking [23,24,25,26]. Studies have also shown that the emergence of new micromobility services (e.g., electric bike-sharing) have had influences on individual level biking as well as attitudes toward biking [27,28,29]. Several studies have found that perceptions and attitudes such as predilections for flexible transportation mode travel habits, perceived environmental condition of the neighborhood, and perceived safety from traffic and crime are likely to influence the walking and bicycling behaviors of individuals in developed countries [30,31,32]. However, a few studies have explored the impact of latent attitude and perception variables on the choice of AT in developing countries [33].
Individual and socioeconomic factors, i.e., age, income, gender, and education, were noticed to be key correlates of AT-related behavior. However, due to the differences in geographical and sociocultural contexts, some variations in AT-related behaviors were found [34]. Buehler et al. (2011) found that, in Germany and in the United States, males were more likely to use AT than females [35]. McDonald (2012) found that, in the USA, the rate of bicycling to school was three times higher for male students than for female students [36]. Hatamzadeh et al. (2017) compared the walking behavior of different worker groups in Rasht, Iran, and concluded that males were less likely to walk for commuting than females [37], which contrasted with the results of Buehler et al. (2011) and McDonald (2012). Aslam et al. (2018) found that, in Lahore, Pakistan, the taboo against females using bicycles deterred them to travel by bicycle [38]. The study concluded that the biking rate among females was lower in the Indian subcontinent as compared with other Asian countries, such as China. Likewise, income also has a varying influence on selecting a bicycle as a travel mode. Mitra and Nash (2019) examined the gender gap in bicycling among university students in Ontario, Canada [39]. The study found that the presence of biking facilities and low-speed limits on nearby roads enhanced the likelihood of walking among females for commuting trips. Buehler et al. (2011) found that funding for installing biking facilities was low for low-income neighborhoods in the USA. Due to the absence of appropriate biking facilities, people in low-income neighborhoods are not interested in biking [35]. Gravenstine et al. (2022) revealed that support for infrastructure enhancements, enjoyment from riding, riding to spend time with friends and family, and the number of children in the household positively influenced intentions to travel by bicycle in New York, USA [40]. Fasan et al. (2021) found that secondary school students in Birmingham, UK, felt more inclined to bicycle when their peers also bicycled [41].
Several studies have explored the connection between trip impedance, accessibility, and AT. Hetamzadeh et al. (2017) concluded that bicycle trips were preferred in Pakistan when the trip duration was less than 15 min [37]. MacDonald (2007) and Jurak et al. (2021) found that, with an increase in travel distance to school, students’ propensity to use AT decreased in the USA and Slovenia [42,43]. Nash and Mitra (2018) found that students used AT as a primary mode of transportation, and they used AT mostly for shorter trips [44]. Wolek et al. (2022) studied the role of accessibility to the city center of Gdynia, Poland and found that better accessibility to the city center by walkways enhanced residents’ propensity to travel to the city center [45]. Czech, Ivan et al. (2019) found that better connectivity and accessibility of the road network to bus stops encouraged transit riders to walk to bus stops [46].
The characteristics of a built environment and perception of safety can also influence walking and biking. A study by Kweon (2021) found that the presence of a sidewalk, buffers, and street trees positively influenced the willingness to walk to school in the USA [47]. Meanwhile, Oliva et al. (2018) found a positive correlation between the length dedicated to the bicycle lanes and people’s willingness to bicycle in Chile [48]. Another study from Taiwan showed that good network connectivity was favorable for AT. Studies by Tuber and Sudeck (2021) and Higgins and Ahren (2021) showed that safety during walking or biking was an important factor influencing AT use in Germany and Ireland [49,50]. Tuber and Sudeck (2021) showed better security from neighborhood crimes enhanced the willingness of a student to walk to school. Higgins and Ahren (2021) showed if safety from crime and vandalism can be ensured, people will use their bicylces more often [50]. Tuber and Sudeck (2021) revealed that when students were safe from vehicular traffic, their frequency to bicycle to school increased [49]. Pogacar et al. (2020) studied the biking behavior of university students from Maribor, Slovenia, and found that the lack of biking infrastructure, bicycle theft fear, motivation for bicycling, and travel distance and time negatively influenced the frequency of biking [51]. In another study conducted in New York, USA, Barberan er al. (2017) showed that when people lived close to the city center, they had a higher propensity to bicycle [52].
Several studies have directly linked perceptions of road safety, walkability, and crime perception with AT. Moniruzzaman and Paez (2012) revealed that when people had a positive attitude towards walking infrastructures, they had a higher possibility to shift from other modes to walking when provisioned with walking infrastructures [53]. Knollerberg et al. (2009) and Pedroso et al. (2010) evaluated the relation between students’ perception of safety with their decision to travel to school using AT in the USA and found that they were more likely to walk if they perceived their neighborhood as friendly for walking and safe from crime [54,55]. Knollberg et al. (2009) also found that walkways and bicycle lanes with appropriate stop lights and reduced speeds on nearby vehicular ways made students feel safer using AT and more likely to use AT to go to school. A study by Cauwenberg et al. (2012), conducted in Belgium, showed that when females perceived a neighborhood as safe, they were likely to bicycle at a higher frequency [56]. Tuber and Sudeck (2021) found university students in Germany walked or bicycled more frequently when they had more land uses accessible within a short distance from their residence. Sun et al. (2015) aimed to understand the walking behavior of students at the Chinese University of Hong Kong using the theory of planned behavior and showed that students were more likely to walk when they perceived AT as physically and mentally beneficial [57].
Studies have shown that perceptions of the built environment also influenced individuals’ decisions regarding AT in developing countries. Oyeyemi et al. (2012) found that a higher level of perceived safety from traffic by pedestrians encouraged them to walk more in two cities with higher rates of traffic accidents, i.e., Maiduguri, Nigeria, and Bogota, Colombia [58]. Another study conducted in Barranquilla, Colombia by Arellana et al. (2020) revealed that having cycling infrastructure encouraged people to bicycle, however, it did not necessarily uphold their perception of safety from roadside traffic [59]. Parra et al. (2011) found that higher perceptions of accessibility to different facilities and pedestrian facilities worked as a positive catalyst for walking for leisure in a study conducted in Curitiba, Brazil [60]. A study conducted by Adhalka et al. (2018) and Gul et al. (2018) found different relations between perceived safety from crime and walking in India and Pakistan. Adlakha et al. (2018) found an inverse relationship between walking for commuting and perceived safety from crime [26], while Gul et al. (2018) found an impartial relationship between these two parameters [33]. Table 1 provides a summarize of most of the previously mentioned studies.
The abovementioned literature reveals that there are mixed findings regarding the influence of relevant factors on AT in developing countries. Adlakha et al. (2018) emphasized the generation of regional and local-specific evidence and cautioned policymakers and researchers when integrating findings from developed countries within a given context. To develop a better understanding of AT-related behavior for cities in developing countries, Larrañaga et al. (2016) urged considering the differences among vehicle ownership, modal share, preferences, and people’s perception regarding transportation mode choice, as well as socio-cultural context [34].

3. Method

3.1. Data Collection

This study was based on primary data collected through a questionnaire survey of randomly selected households in Rajshahi. Students from the urban planning school of Rajshahi were recruited and trained to visit households and to conduct the survey with the full consent of the surveyed participant. A total of 402 households were surveyed. The surveyed participants were given full liberty to stop participating in the survey if they found sharing any information against their privacy or any offensive information. The participation was voluntary and surveyed persons were not paid remuneration for their participation.
The questionnaire was divided into three sections: sociodemographic profiles, trip patterns, and respondents’ perceptions of the built environment on active transportation. We collected data on respondents’ sociodemographic profiles such as age, gender, occupation, income, and the number of household members. Regarding trip-related parameters, questions included daily route activities (trip purpose), mode, travel time and distance, the number of bicycles owned, and car ownership. Respondents were asked to evaluate the role of built environment characteristics on their use of active transportation based on their perception of the built environment. Respondents were asked about their perception regarding safety from crime and the amount of local traffic while walking and cycling on local and main roads. Respondents were requested to rate their surroundings’ influence with respect to walking and cycling comfort on a Likert type scale to capture their perceptions of the built environment on active transport. A Likert-type scale from 1 to 5 was used with 1, 2, 3, 4, and 5 representing very poor, poor, moderate, good, and very good, respectively. For additional information on the survey, see Jamal and Mohiuddin (2020) [18].
Table 2 describes the summary statistics of the survey participants. More than two-fifth of the surveyed participants were students. Land uses of the individuals’ residences were mostly residential. More than 65% of the respondents owned one bicycle and more than 35% of commuting trips were made by bicycle. Daily walking time was more than two times the duration of cycling trips.

3.2. Dependent Variables

The transportation mode choices for commuting and recreational trips of students and nonstudents were used as dependent variable separate choice models. In the commuting and recreational trip models, the dependent variable was binary, whether the person bicycled or not. An ordered logit model was developed for daily walking habits, with the dependent variable being the daily walking duration of an individual. The duration of daily walking was categorized into four ordered categories: less than 30 min, from 31 min to 60 min, from 61 min to 120 min, and more than 120 min. The following section describes the methodology of the choice models.
Table 3 shows that there are considerable differences between students and nonstudents. Students tend to own bicycles more and, on average, walk and cycle less; however, a higher percentage of students walk for commuting than nonstudents, have shorter commuting times, and tend to live more in educational land uses (probably on-campus residences or near the campus). Students who limited walking and cycling times indicated they had less need for travel as compared with nonstudents.

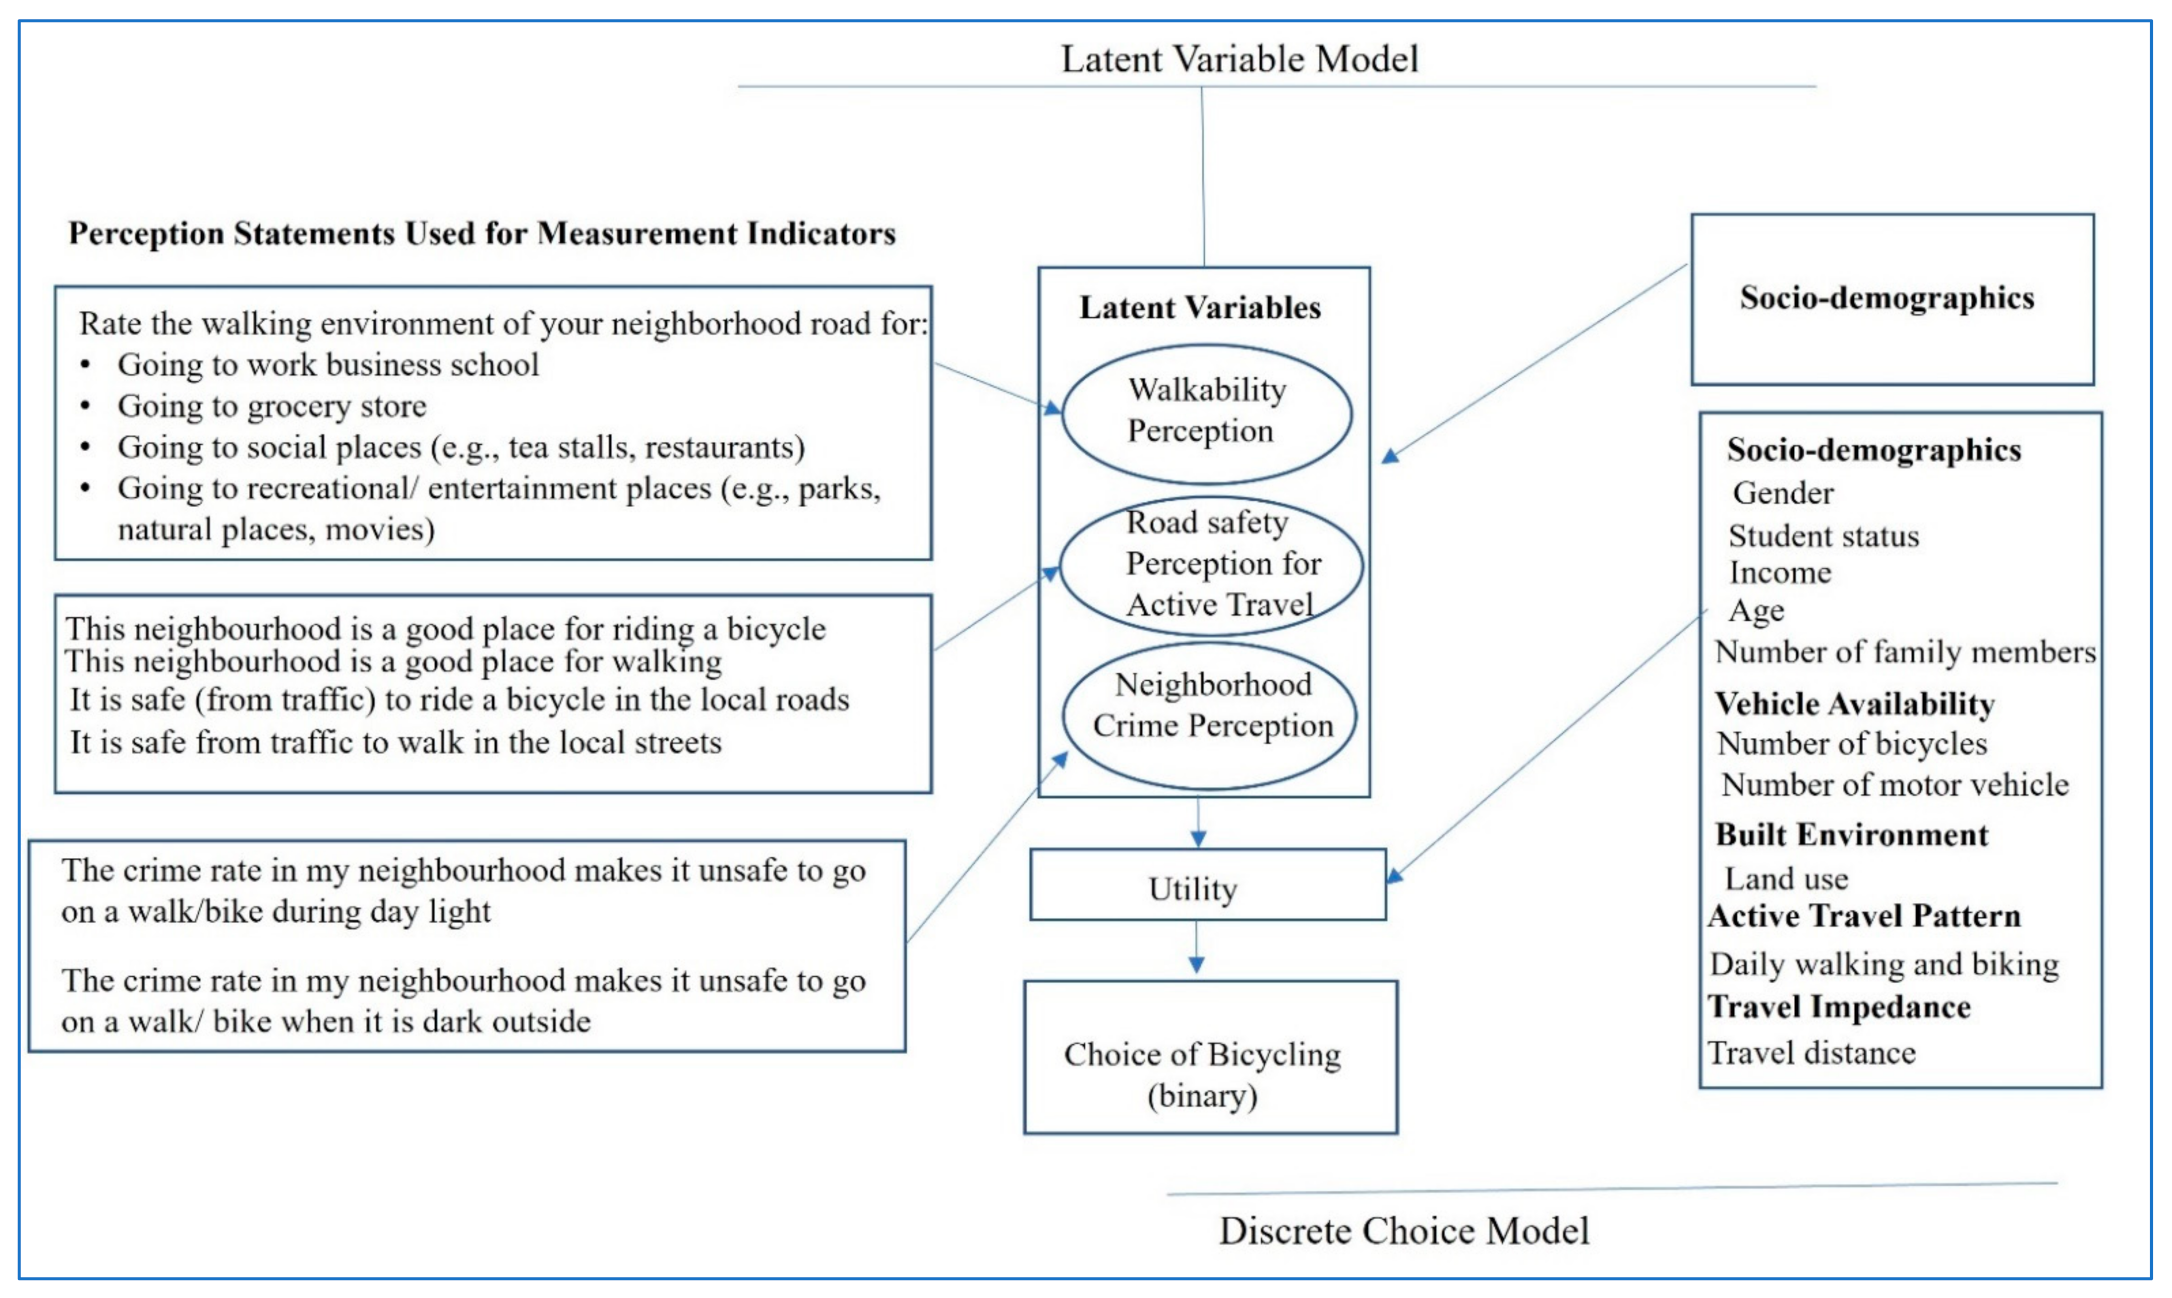
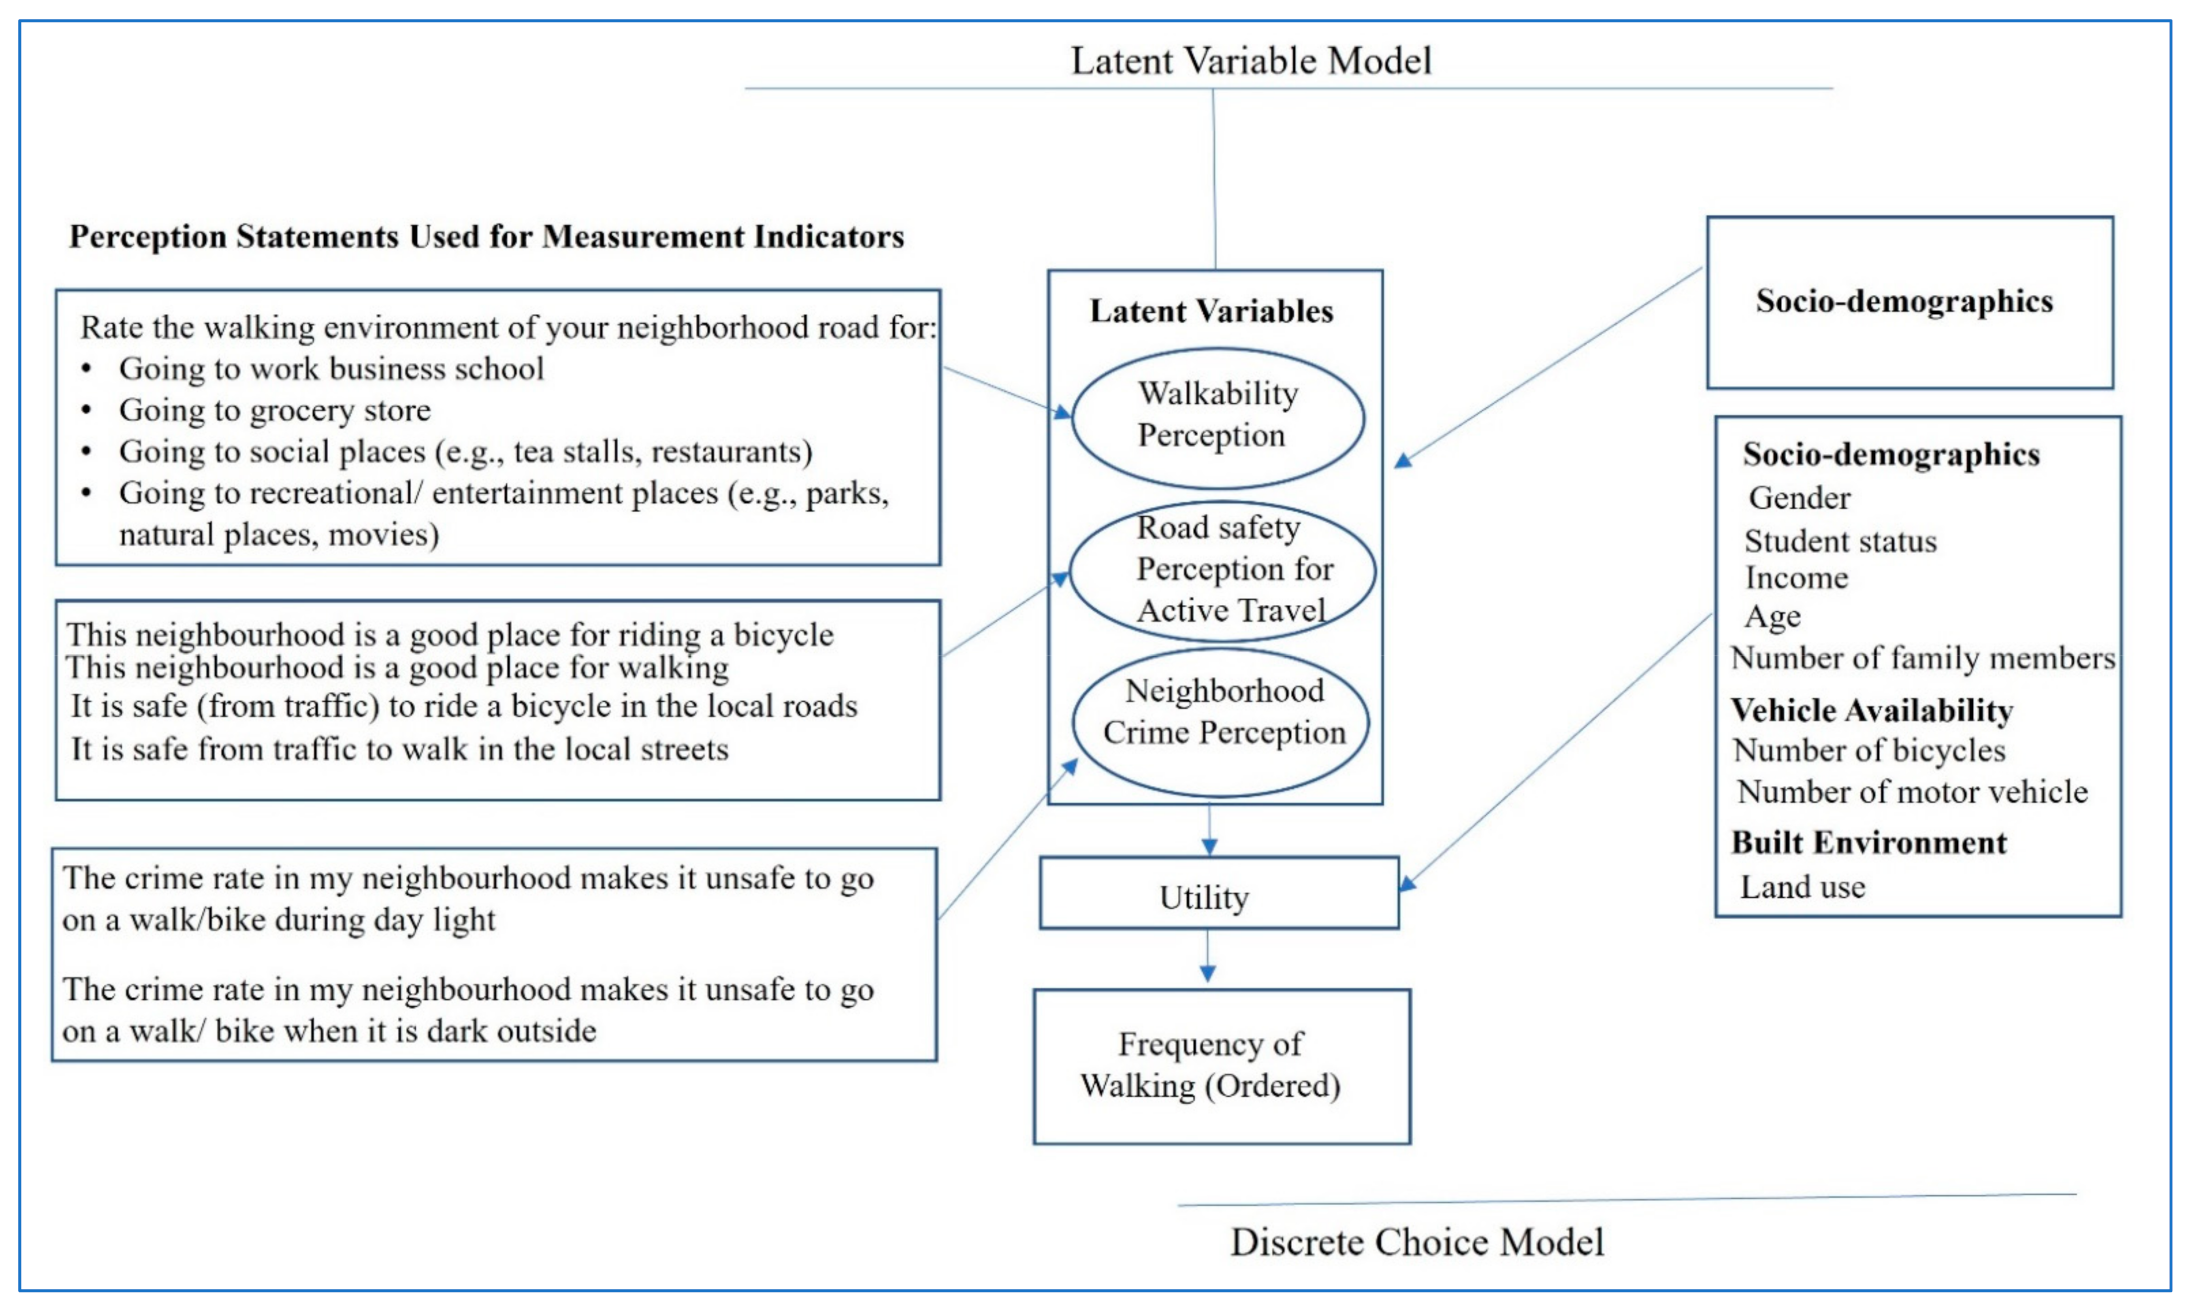
3.3. Modeling Approach

Our bicycle mode choice model incorporated perceptions of the built environment latent variables. The statements described in Figure 1 were used to capture three different perceptions of the built environment: walkability, road safety from traffic, and safety from crimes. Table 4 presents the respondents’ perception response data regarding walkability and safety. The majority of respondents reported the walkability of their neighborhood as good and conducive to walking to the workplace, grocery store, and social gathering. However, the majority of respondents rated the walkability of their environment for recreation as moderate. More than 40% of respondents reported that the safety of local roads was good for walking and biking. While most of the respondents considered main roads with good safety for walking, local roads were considered only at a moderate level of safety for biking. Almost half of the respondents perceived poor safety from crime at night to use active transportation modes.
These three aspects can be treated as latent variables which cannot be directly observed such as visible characteristics (i.e., sociodemographics and travel behavior) of an individual rather extracted from a survey of well-designed statements. These types of attitudes and perception-related statements can be included in the choice model using several approaches. One of the common approaches is adding factor scores using the attitude statements directly into the utility of the choice models. This approach can have issues such as measurement error as well as endogeneity biases [61,62,63].
A better framework for this approach is to integrate choice and latent variable (ICLV) models. The ICLV modeling framework includes a discrete choice model and latent variable model(s). In the ICLV framework, exogenous variables influence latent variables (LVs). The structural equation model (SEM) of the LVs incorporates another model (i.e., the measurement model) that utilizes the LVs as predictors to estimate the survey responses of the individuals regarding the attitude and perception statements [62,64]. In our case, the measurement model connected LVs to the statements collected from the survey on built environment perception. The entire framework is shown in Figure 1 and Figure 2. Based on the frameworks presented in Figure 1 and Figure 2, we developed the ICLV model equations. We used a similar framework for both the student and nonstudent models.
Equation (1) represents the utility for biking for work/commute and the recreational trips model for nonstudents. This includes the sociodemographic variables that are directly observable and vectors of latent perception variable predictors that are not directly observable but rather estimated using the responses of the built environment perception statements. Equations (5a)–(5c) characterize the SEMs for LVs. Equation (6) denotes the general measurement model of the ten perception statements (explained in Figure 1) of different features of the built environment collected from the survey [65]. Equation (1) Is:
u n =   ASC   + β 1 Age n + β 2 Gender n + β 3 Income n + β 4 Landuse n + β 5 Distance n + β 6 Number   of   Bikes n + β 7 Household   Members n + β 8 Number   of   Motor   vehicles n + β 9 Walktime n + β 10 Biketime n + Γ 1 Walkability   perception n + Γ 2 Road   Safety   Perception n + Γ 3 Neighborhood   Crime   perception n + ϵ n
ϵ n is the disturbance term. LVs included in Equation (1) represented by Γ 1 , Γ 2 , and Γ 3 denote the influence of latent perception on the utility of choice of bicycle. In the utility equation of students, we dropped the variables for income, age, and number of family members. Since students are rarely likely to have large personal income, income was removed from the student model as its inclusion could mislead the conclusion. In addition, age was not considered in the student model as their ages only varied within a small range (between 14 and 29). Meanwhile, students generally live in dorms and/or outside the university campus in housing with other students. Thus, we did not include the number of family members variable in the student model. The students’ utility function is as follows:
u n =   ASC   + β 2 Gender n + β 4 Landuse n + β 5 Distance n + β 6 Number   of   Bikes n + β 8 Number   of   Motor   vehicles n + β 9 Walktime n + β 10 Biketime n + Γ 1 Walkability   perception n + Γ 2 Road   Safety   Perception n + Γ 3 Neighborhood   Crime   perception n + ϵ n
We also modeled the daily walking habits for students and for nonstudents. The theoretical framework of the ordered model is shown in Figure 2.
If we consider all the daily walking categories as ordered, the ordinal response is assumed to originate from the categorization of a latent continuous variable. In the following Equation (3), Y n , t is the observed value for the dependent variable for the tth observation for individual n. Y n , t can take S possible values (s = 1, …, S) (in our case 4 possible values for four use levels from 1 to 4) [66]. In an ordered logit model, the probability of observing value s is given by:
P Y n , t = s = e τ s V n , t 1 + e τ s V n , t e τ s 1 V n , t 1 + e τ s 1 V n , t
where, for Tau (τ), the value is set to τ s = + and τ 0 = for normalization, so that the probability of Y n , t = 1 is given by e τ 1 V n , t 1 + e τ 1 V n , t , while the probability of Y n , t = S is given by 1− e τ s V n , t 1 + e τ s 1 V n , t [66]. Here, V n , t is the utility specification within the ordered logit model which is a function of the individual [66]. Therefore, the utility equation of the ordered ICLV model becomes:
V n = τ s + β 1 Age n + β 2 Gender n + β 3 Income n + β 4 Landuse n + β 5 Number   of   Bikes n + β 6 Household   Members n + β 7 Number   of   Motor   vehicles n + Γ 1 Walkability   perception n + Γ 2 Road   Safety   Perception n + Γ 3 Neighborhood   Crime   perception n + ϵ n
Similar to the utility equation for students, we dropped the variables for income, age, and number of family members.
The structural equation models are the same for both modeling frameworks (i.e., binary and ordered) as shown in Equations (5a)–(5c). We developed the structural model using only the gender variable, a common sociodemographic variable in both the student and nonstudent models. It is expected that the influence of gender on the LVs would be different as different genders may perceive the surrounding environment differently. Since the gender variable was included in both the main utility equation and in the structural equation models, we can interpret the former effect of gender as the direct effect on the utility of the choice of bicycling and frequency of walking, and the latter as the indirect effect of gender through the LVs on the choice of bicycling and frequency of walking. In this framework, SEMs of the LVs become:
                  W a l k a b i l i t y   p e r c e p t i o n n = A 1 G e n d e r n + v n
R o a d   S a f e t y   P e r c e p t i o n   f o r   A c t i v e   T r a v e l n = A 1 G e n d e r n + v n
N e i g h b o r h o o d   C r i m e   p e r c e p t i o n n = A 1 G e n d e r n + v n
Here, A indicates the effect of gender on LVs and v n is the unobserved disturbance term [65].

3.4. Measurement Equation Models

The measurement model connects the responses of the perception statements (collected using 5-point Likert-type scales) with the LVs. The generalized measurement model is shown in Equation (6). Here, D indicates a vector of parameters that represents the sensitivities of the responses of a statement to the respective LV in matrix form x n * (see Figure 1 and Figure 2 to understand how the perception statements are linked with the LVs). Here, i k indicates the kth perception statements and η n is the stochastic component of the equation. The stochastic component is assumed to be normally distributed and statistically independent. Equation (6) is as follows:
i k , n = D x n * + η n    
Figure 1 and Figure 2 illustrate the statements used in conjunction with the three LVs. Each perception statement is associated with one measurement equation. The choice model, structural equation models, and the measurement models are combined to integrate choice and latent variable models [65,67] We used the Apollo package version 0.2.4 in the R platform for model estimations [68]. The modeling process needed integration over multiple disturbance terms, and we performed 100 interindividual Halton draws as we had one observation per individual for the term η n [68,69].

3.5. Limitations

This study was mainly limited by budget, and therefore, only 402 households were surveyed. The responses to the surveys were biased towards males, i.e., the heads of the households and the main respondents for household surveys in Bangladesh. Because this study attempted to explore factors associated with the outcome, our study falls into the category of exploratory research. For such types of exploratory research, sample representation is less critical [70]. Even if our sample was not fully representative of the sociodemographics, our model still provided valid insights into the relationships among factors and outcome, at least within the range of sociodemographics represented within the sample.
This project was funded by the Bangladesh Institute of Planners (BIP). We conducted the survey as per agreement with BIP in 2017 and we did not receive any additional funding for conducting the survey. We acknowledge the possibility of change in travel and active transportation behaviors among people after 5 years in 2022. Therefore, the outcomes of the study should be used with caution.

4. Results and Discussion

The outcomes of the ICLV models for choosing to bicycle for commuting trips for students and nonstudents are illustrated in Table 5. The ICLV modeling framework has many models (i.e., choice model, structural equation models for the latent perception variables, and measurement equation models for the perception statements). In Table 5, we report the results of the choice model and the structural equation models for the latent perception variables. We did not report the measurement models for the selected ten statements in Table 5 due to space constraints. The results of our measurement models are aligned with the model assumptions. All respective statements were significantly associated with their respective latent perception variables. As multiple models are reported in Table 5, we have not reported any log-likelihood there. We followed a similar approach for Table 6 and Table 7.

4.1. Factors Influencing the Choice of Bicycling for Commuting

4.1.1. Influence of Gender

Gender (being female) is not significant in either the student or the nonstudent models.

4.1.2. Influence of Travel Distance

The lengths of commutes are positively associated with bicycling for the nonstudent model. However, the effect of commuting distance is not significant in the student model. Distance may be less of an issue for bicycling, as students may bicycle for shorter [44] and longer distances. For the nonstudent model, there could be two possible underlying reasons for the association. Firstly, Rajshahi has a high density of mixed-use developments which reduces commutes between residential and commercial land uses (mean commuting distance of 1.25 km), and therefore, walking and biking are likely to be very convenient options for travel. Secondly, low income and low motorized vehicle ownership may also lead an individual to bicycle more [71].

4.1.3. Influence of Bicycle Ownership and Land Use

For nonstudents, bicycle ownership is significantly positively associated with bicycle use, which was expected. Access to motor vehicles negatively influence bicycling for commuting in the nonstudent model. However, this variable is not significant in the student model.
Respondents living in the residential areas are less likely to commute by bicycle in the student model than in the nonstudent model. As a large portion of the students may live in educational land uses (e.g., student halls), students living within educational land uses are more likely to bicycle for their daily commuting trips, as campuses often have less motorized traffic and more scenic environments conducive to AT.

4.1.4. Influence of Latent Perception Variables

The perception of walkability affects biking decisions for nonstudents. However, this latent variable is not significant in the student model, indicating that positive perceptions of walkability may not influence bicycling among students. Rather, the modeling results indicate that neighborhood crime perception is significantly associated with students’ biking decisions. Thus, safety from crime is more important to students than walkability and road safety when determining whether to bicycle for their commutes.

4.1.5. Influence of Active Travel Habit

A regular habit of biking is positively associated with commuting by bicycle for both the student and nonstudent models. This is expected and important from a behavioral perspective. However, daily walking duration has a significant and positive influence on bicycling only in the nonstudent model.

4.1.6. Influence of Gender on Latent Perception Variables

Gender influences perceptions and consequently transportation mode choices. Females rated the walkability of their built environment surroundings lower than males, which is probably due to the fact that much of the urban environment in Bangladesh has been planned by males without much consideration for their female counterparts.
Our student model shows that neighborhoods perceived as relatively safe from crime positively influence biking, and the structural equation model shows that females are less likely to give a higher rating than males regarding safety from crime. These findings align with previous studies [72,73].
In the ICLV modeling framework, the influence of gender on the structural equation model of latent perception variables can be described as the indirect effect of gender on the utility of biking [65]. Although being a female student does not directly affect the choice of biking for commuting trips, gender does indirectly influence commuting by bicycle for students through the latent perception variables. For nonstudents, being a female also implicitly affects the choice of biking for commuting trips through the walkability perception LV. These results align with research that shows that the bicycling behavior of females is influenced by environmental and social factors and also by perceptions of safety [74].

4.2. Modeling Bicycle Use for Recreational Trips

We modeled the choice of bicycling for recreational trips for students and nonstudents and the outcomes of the models are shown in Table 6.
Table 6. The outputs of the ICLV models of choice of biking for recreational trips.
Student Model
(n = 167)
Nonstudent Model
(n = 233)
EstimateRobust
t-Ratio
EstimateRobust
t-Ratio
ASC−4.959−2.543−3.102−0.709
Age 0.0530.595
Income −0.00002−0.546
Number of household members −0.770−1.337
Gender (base = male)−1.901−1.359−11.422−9.856
Travel distance (in kilometers)0.4032.6510.3162.709
Bicycle ownership dummy1.3481.5370.8640.894
Land use (base = nonresidential)−4.739−2.641−0.869−0.727
Regular walk time (min)0.0140.804−0.014−1.394
Regular bicycle time (min)0.0323.232−0.010−0.889
Vehicle ownership−4.237−3.8730.5111.187
Latent Perception Variables
Walkability perception0.7881.3170.9301.280
Road safety perception for AT1.9773.0051.1081.277
Neighborhood crime perception1.1260.9451.6591.655
Walkability Perception Latent Variable Model is shown in Equation (5a)
Female−0.157−1.110−0.435−1.826
Road Safety Perception for AT Latent Variable Model is shown in Equation (5b)
Female−0.492−4.537−0.249−1.278
Neighborhood Crime Perception Latent Variable Model is shown in Equation (5c)
Female−1.013−4.5500.1060.377

4.2.1. Influence of Gender

Gender is not significant in the student model; however, it has a significant and negative effect in the nonstudent model. In the nonstudent model, the variable has a negative coefficient with a high magnitude. This indicates that females are less likely to bicycle for recreational trips. This is in line with previous research [75].

4.2.2. Influence of Travel Distance

Recreational trip distance influences bicycle mode choice in both the student and the nonstudent models. This indicates that individuals, regardless of student status, are more likely to use bicycles when the length of their recreational trip increases.

4.2.3. Influence of Bicycle Ownership and Land Use

Bicycle ownership influences the choice of bicycling for nonstudents. This was expected. Motor vehicle ownership significantly and negatively influences the choice of bicycling for students. The influence of motor vehicle ownership is not significant in the nonstudent model. Respondents living in the residential areas are less likely to bicycle for recreational trips in the student model and more likely to bicycle in the nonstudent model.

4.2.4. Influence of Latent Perception Variables

In the case of the choice of bicycles for recreational trips, we observe a different finding as compared with the use of bicycles for commuting trips. The walkability perception is not significant in both the student and the nonstudent models. On the one hand, in the student model, road safety perception influences the decision to use a bicycle, indicating that students care about the perception of street safety (i.e., both local and major streets) for walking and biking while deciding on using bicycles for recreational trips. On the other hand, in the nonstudent model, road safety perception is not significant; however, safety from crime perception is significant. This indicates that nonstudents are more likely to bicycle for recreational trips when they perceive their neighborhood is safe from crimes.

4.2.5. Influence of Active TravelHabit

Biking habits significantly influence bicycling in the student model. This association was expected. However, both of the active travel habit variables (i.e., bicycling and walking) are not significant in the nonstudent model. This indicates that daily active travel habit of a nonstudent population does not influence their choice of bicycles for recreational trips.

4.2.6. Influence of Gender on Latent Perception Variables

The structural equation model shows that more females than males are more likely to report lower perception ratings of neighborhood walkability, road safety, and safety from crime. This result was expected. The underlying reason for this result has already been described in the previous section. As previously described, this can be characterized as the implicit influence of gender on the choice of bicycling for recreational trips for students through the latent perception variables (although the direct effect of gender is not significant).

4.3. Modeling Daily Walking Habit

After modeling the use of a bicycle for commuting and recreational trips, a model of the daily walking habit of both the student and the nonstudent populations was performed to understand what influences individual level walking habits. The outcomes of the models are shown in Table 7.
Table 7. The outcomes of the ICLV models of walking habit.
Student Model
(n = 166)
Nonstudent Model
(n = 231)
EstimateRobust
t-Ratio
EstimateRobust
t-Ratio
Number of observations166231
Age 0.0221.745
Income −0.00004−4.432
Number of household member 0.3383.255
Gender (base = male)0.0820.1540.1020.298
Bicycle ownership dummy−0.446−1.4960.0470.221
Land use (base = nonresidential)1.1072.7730.3421.029
Vehicle ownership0.2830.7410.0350.384
Tau of walk
(less than 30 min|from 31 min to 60 min) *
0.2890.7290.7851.162
Tau of walk
(from 31 min to 60 min|from 61 min to 120 min) *
2.2075.1702.5583.633
Tau of walk
(from 61 min to 120 min|more than 120 min) *
4.0457.6863.3214.552
Latent Perception Variables
Walkability perception−0.014−0.052−0.166−0.916
Road safety perception for AT−0.134−0.3740.3782.242
Neighborhood crime perception0.0530.149−0.070−0.457
Walkability Perception Latent Variable Model is shown in Equation (5a)
Female−0.188−1.056−0.424−2.340
Road Safety Perception for AT Latent Variable Model is shown in Equation (5b)
Female−0.467−3.114−0.165−1.273
Neighborhood Crime Perception Latent Variable Model is shown in Equation (5c)
Female−1.092−4.7760.0690.294
* Based on Equation (4).

4.3.1. Influence of Gender

Gender (being a female) is not significant in both the student and nonstudent models.

4.3.2. Influence of Vehicle Ownership and Land Use

Bicycle ownership and motor vehicle ownership are both not significant in the student and nonstudent models for daily walking behavior. Students residing in residential areas are more likely to walk regularly; however, the effect of living in a residential neighborhood is not significant in the nonstudent model. This finding is different from the findings from the previous section that show students residing in residential areas are less likely to bicycle for commuting and recreational trips. This indicates that the residential neighborhood environment may nudge students towards more walking as there is abundant walking infrastructure in Rajshahi; however, they may be skeptical towards bicycling as their surroundings may not have safe road infrastructures mostly free of road traffic, as found in educational campuses.

4.3.3. Influence of Other Variables

Nonstudent individuals’ daily walking tends to decrease with an increase in their income. However, nonstudent individuals tend to walk more when they have more members in their household.

4.3.4. Influence of Latent Perception Variables

None of the latent perception variables are significant in the student model. However, a nonstudent individual is more likely to walk in neighborhoods that are perceived as safe for active transportation. This latent perception variable may have also captured the built environment (i.e., residential land use) influence on daily walking for nonstudents. Overall, this result indicates that built environment perception does not significantly influence the walking behaviors of students but does influence the walking behaviors of nonstudents.

4.3.5. Influence of Gender on Latent Perception Variables

As discussed previously, the structural equation component of the student model shows that females are more likely to provide low perception ratings of road safety and safety from crime of their surrounding travel environment. For nonstudents, the structural equation model shows that females are more likely to give a low rating for the walkability of their surrounding travel environment. This result was expected and has already been discussed previously. These effects can be characterized as the implicit influence of gender on the frequency of walking for students and nonstudents through the latent perception variables (although the direct effect of gender is not significant).

5. Conclusions and Recommendations

This study used an ICLV modeling framework to examine how sociodemographics and perceptions of a built environment influence bicycle mode choice and daily walking duration among students and nonstudents in Rajshahi, Bangladesh. Many of our findings are aligned with previous studies [72,73,74,75]. However, we recommend additional investigations using other cities and contexts to deeply understand the factors influencing active transportation choice.
Gender was found as a significant predictor of bicycling choice for recreational trips for nonstudents. Along with that, gender indirectly influences bicycling through the latent perception variable. For bicycling, students are more likely to bicycle for commuting and recreational trips when they live in nonresidential areas as compared with those who live in residential areas. However, the place of residence was not a significant predictor of bicycle choice for commuting and recreational trips for nonstudents. For walking, students walked more often when they lived in residential areas and their walking behaviors were not influenced by the selected built environment perceptions; nonstudents walked more in neighborhoods and on roads where they perceived it safe for active transportation. Our results also show that travel distance is positively associated with bicycling for recreational trips for both students and nonstudents, however, bicycling for work trips is not affected by travel distance for students.
Our study finds that latent perception variables significantly influence individuals’ choices to bicycle for commuting and recreational trips. For commuting trips, students are influenced by perceptions of safety from crime, and nonstudents are influenced by perceptions of walkability. For recreational bicycling trips, students focus more on perceptions of road safety than on safety from crime. We also found that road safety perception for AT significantly positively influenced walking behaviors among nonstudents; however, none of the latent perception variables were significant in the student model. The ICLV modeling framework also shows that females are more likely to provide lower ratings for the walkability of the built environment and perceptions of road safety and safety from crime.
Considering that the share of the bicycle mode for commuting trips is 36.8%, it is important to promote cycling in Rajshahi. The large population of students in Rajshahi are dependent on affordable active transportion modes such as walking and bicycling for regular commuting. Hence, it is important for transportation equity and sustainability in Rajshahi to include and advance active transportation. Based on the findings of this study, we suggest possible areas of improvements to both the built environment as well as perceptions of the built environment to promote AT. Specifically, improvements that incorporate gender considerations and safety would positively influence decisions to use active transportation modes. Since almost half of the survey respondents are concerned about poor safety at night, initiatives are required to ensure safety at night for pedestrians and bicyclers. Since students are commuting by bicycle more in nonresidential areas (59%), nonresidential areas should be prioritized in bicycle safety initiatives. To enhance the walkability of neighborhoods and the safety of pedestrians and bicyclers, buffer strips can be used to delineate walkways and vehicular ways. As shorter travel distances are congenial for recreational trips made by active transportation modes, features such as food courts or kiosks can be established at regular intervals across the city as pull factors and a place for rest and refreshment for active transportation users.
Future studies should be conducted to further explore the relationships of neighborhood walkability, road safety, and crime rates to AT adoption and use. The relationship of walkability parameters, such as footpath width, presence of landscaping features along the footpath, and pedestrian volume, with AT, should also be explored in future studies. Future studies should also compare the travel behaviors of bicycle and motorcycle users. Although not within the scope of this study, future studies should compare and analyze use costs of AT and non-AT travel.

Author Contributions

Conceptualization, H.M., M.M.R.B., S.J. and Z.C.; Data curation, H.M. and S.J.; Formal analysis, H.M., M.M.R.B., S.J. and Z.C.; Funding acquisition, H.M. and S.J.; Investigation, H.M. and S.J.; Methodology, H.M., M.M.R.B. and Z.C.; Project administration, H.M. and S.J.; Supervision, S.J.; Writing—original draft, H.M., M.M.R.B., S.J. and Z.C.; Writing—review & editing, H.M., M.M.R.B., S.J. and Z.C. All authors have read and agreed to the published version of the manuscript.

Funding

This research received partial funding from the Small Grant Research program of Bangladesh Institute of Planners.

Informed Consent Statement

Informed consent was obtained.

Acknowledgments

Bangladesh Institute of Planners through the Small Research Grant program mostly funded the initial data collection for this project. Sincere gratitude to Abdulla-Al-Kafy, Lamia Ferdous, Md. Sazib Ali, Rafi Mahmud Tumon, Nusrat Binte Nazir, Nazmul Ahsan Tonoy, and Romit Wasikul of the Rajshahi University of Engineering and Technology for collecting data for this project.

Conflicts of Interest

The authors declare no conflict of interest.

References

  1. UN Habitat. Promoting Non-Motorized Transport in Asian Cities: Policymakers’ Toolbox; UN Habitat: Geneva, Switzerland, 2013.
  2. Cervero, R. Linking Urban Transport and Land Use in Developing Countries. J. Transp. Land Use 2013, 6, 7–24. [Google Scholar] [CrossRef] [Green Version]
  3. Sinha, S.; Shivanand Swamy, H.M.; Modi, K. User Perceptions of Public Transport Service Quality. Transp. Res. Procedia 2020, 48, 3310–3323. [Google Scholar] [CrossRef]
  4. Urban Land Institute. Urban Mobility: 10 Cities Leading the Way in Asia-Pacific; Urban Land Institute: Washington, DC, USA, 2017. [Google Scholar]
  5. Aslam, M.; Batool, Z. Evaluation of Urban Bus Transport Failure in Gujranwala City of Pakistan. Mehran Univ. Res. J. Eng. Technol. 2017, 36, 469–478. [Google Scholar] [CrossRef]
  6. Quddus, M.; Rahman, F.; Monsuur, F.; de Ona, J.; Enoch, M. Analyzing Bus Passengers’ Satisfaction in Dhaka Using Discrete Choice Models. Transp. Res. Rec. 2019, 2673, 758–768. [Google Scholar] [CrossRef]
  7. Mohiuddin, H. Planning for the First and Last Mile: A Review of Practices at Selected Transit Agencies in the United States. Sustainability 2021, 13, 2222. [Google Scholar] [CrossRef]
  8. Rahul, T.M.; Verma, A. Economic Impact of Non-Motorized Transportation in Indian Cities. Res. Transp. Econ. 2013, 38, 22–34. [Google Scholar] [CrossRef]
  9. United Nations. Sustainable Transport at the Heart of the Sustainable Development Goals (SDGs). Available online: https://sustainabledevelopment.un.org/index.php?page=view&type=20000&nr=802&menu=2993 (accessed on 27 August 2022).
  10. Government of Bangladesh. The National Integrated Multimodal Transport Policy (NIMTP); Government of Bangladesh: Dhaka, Bangladesh, 2013.
  11. Bhuiya, M.M.R.; Mohiuddin, H.; Patwary, M.S.H.; Tasneem, A. Evaluation of Pedestrian Level of Service of Selected Footpath Segments of Dhaka City Using Multi-Criteria Decision Making Approach. Glob. J. Hum.-Soc. Sci. B Geogr. Geo-Sci. Environ. Sci. Disaster Manag. 2020, 20, 1–8. [Google Scholar]
  12. Zhao, P.; Li, S. Restraining Transport Inequality in Growing Cities: Can Spatial Planning Play a Role? Int. J. Sustain. Transp. 2016, 10, 947–959. [Google Scholar] [CrossRef]
  13. Te Brömmelstroet, M.; Bertolini, L. Integrating Land Use and Transport Knowledge in Strategy-Making. Transportation 2010, 37, 85–104. [Google Scholar] [CrossRef] [Green Version]
  14. Sfm, C.; Van Cauwenberg, J.; Maenhout, L.; Cardon, G.; Lambert, E.V.; Van Dyck, D. Inequality in Physical Activity, Global Trends by Income Inequality and Gender in Adults. Int. J. Behav. Nutr. Phys. Act. 2020, 17, 1–8. [Google Scholar] [CrossRef]
  15. Koglin, T.; Rye, T. The Marginalisation of Bicycling in Modernist Urban Transport Planning. J. Transp. Health 2014, 1, 214–222. [Google Scholar] [CrossRef]
  16. Haque, A. Transport Situation in Rajshahi. Prep. United Nations Econ. Soc. Comm. Asia Pacific (UN ESCAP). 2014. Available online: https://www.unescap.org/sites/default/files/2a.3_TransportSituation_Rajshahi_AshrafulHaque.pdf (accessed on 18 September 2022).
  17. Jamal, S.; Mohiuddin, H.; Paez, A. How Do the Perceptions of Neighborhood Conditions Impact Active Transportation? A Study in Rajshahi, Bangladesh. Transp. Res. Part D Transp. Environ. 2020, 87, 102525. [Google Scholar] [CrossRef]
  18. Jamal, S.; Mohiuddin, H. Active Transportation Indicators and Establishing Baseline in a Developing Country Context: A Study of Rajshahi, Bangladesh. Growth Chang. 2020, 51, 1894–1920. [Google Scholar] [CrossRef]
  19. Mohiuddin, H.; Jamal, S.; Rahman Bhuiya, M.M. To Bike or Not to Bike: Exploring Cycling for Commuting and Non-Commuting in Bangladesh. Transp. Res. Interdiscip. Perspect. 2022, 14, 100614. [Google Scholar] [CrossRef]
  20. Garrard, J. Young People and Walking; Victoria Walks: Melbourne, Australia, 2017. [Google Scholar]
  21. Pollard, T.M.; Wagnild, J.M. Gender Differences in Walking (for Leisure, Transport and in Total) across Adult Life: A Systematic Review. BMC Public Health 2017, 17, 1–11. [Google Scholar] [CrossRef] [Green Version]
  22. Paydar, M.; Fard, A.K. The Contribution of Socio-Demographic Factors to Walking Behavior Considering Destination Types; Case Study: Temuco, Chile. Soc. Sci. 2021, 10, 479. [Google Scholar] [CrossRef]
  23. Rodríguez, D.A.; Evenson, K.R.; Diez Roux, A.V.; Brines, S.J. Land Use, Residential Density, and Walking. The Multi-Ethnic Study of Atherosclerosis. Am. J. Prev. Med. 2009, 37, 397–404. [Google Scholar] [CrossRef] [Green Version]
  24. Molaei, P.; Tang, L.; Hardie, M. Measuring Walkability with Street Connectivity and Physical Activity: A Case Study in Iran. World 2021, 2, 49–61. [Google Scholar] [CrossRef]
  25. Tanishita, M.; van Wee, B. Impact of Regional Population Density on Walking Behavior. Transp. Plan. Technol. 2017, 40, 661–678. [Google Scholar] [CrossRef] [Green Version]
  26. Adlakha, D.; Hipp, J.A.; Sallis, J.F.; Brownson, R.C. Exploring Neighborhood Environments and Active Commuting in Chennai, India. Int. J. Environ. Res. Public Health 2018, 15, 1840. [Google Scholar] [CrossRef]
  27. Fitch, D.T.; Mohiuddin, H.; Handy, S.L. Examining the Effects of the Sacramento Dockless E-Bike Share on Bicycling and Driving. Sustainability 2021, 13, 368. [Google Scholar] [CrossRef]
  28. Mohiuddin, H.; Fitch, D.; Handy, S. Examining Market Segmentation to Increase Bike-Share Use: The Case of the Greater Sacramento Region. Natl. Cent. Sustain. Transp. 2022. [Google Scholar] [CrossRef]
  29. Fitch, D.; Mohiuddin, H.; Handy, S. Investigating the Influence of Dockless Electric Bike-Share on Travel Behavior, Attitudes, Health, and Equity; Institute of Transportation Studies, University of California, Davis: Davis, CA, USA, 2020. [Google Scholar] [CrossRef]
  30. Kepper, M.M.; Myers, C.A.; Denstel, K.D.; Hunter, R.F.; Guan, W.; Broyles, S.T. The Neighborhood Social Environment and Physical Activity: A Systematic Scoping Review. Int. J. Behav. Nutr. Phys. Act. 2019, 16, 1–14. [Google Scholar] [CrossRef]
  31. Herbolsheimer, F.; Mahmood, A.; Ungar, N.; Michael, Y.L.; Oswald, F.; Chaudhury, H. Perceptions of the Neighborhood Built Environment for Walking Behavior in Older Adults Living in Close Proximity. J. Appl. Gerontol. 2021, 40, 1697–1705. [Google Scholar] [CrossRef]
  32. Aliyas, Z. Why Some Walk and Others Don’t: Neighborhood Safety and the Sociodemographic Variation Effect on Walking for Leisure and Transportation. J. Public Health Manag. Pract. 2020, 26, 24–32. [Google Scholar] [CrossRef] [PubMed]
  33. Gul, Y.; Sultan, Z.; Jokhio, G.A. The Association between the Perception of Crime and Walking in Gated and Non-Gated Neighbourhoods of Asian Developing Countries. Heliyon 2018, 4, e00715. [Google Scholar] [CrossRef] [Green Version]
  34. Larrañaga, A.M.; Rizzi, L.I.; Arellana, J.; Strambi, O.; Cybis, H.B.B. The Influence of Built Environment and Travel Attitudes on Walking: A Case Study of Porto Alegre, Brazil. Int. J. Sustain. Transp. 2014, 10, 332–342. [Google Scholar] [CrossRef]
  35. Buehler, R.; Pucher, J.; Merom, D.; Bauman, A. Active Travel in Germany and the U.S. Contributions of Daily Walking and Cycling to Physical Activity. Am. J. Prev. Med. 2011, 41, 241–250. [Google Scholar] [CrossRef]
  36. McDonald, N.C. Is There a Gender Gap in School Travel? An Examination of US Children and Adolescents. J. Transp. Geogr. 2012, 20, 80–86. [Google Scholar] [CrossRef]
  37. Hatamzadeh, Y.; Habibian, M.; Khodaii, A. Walking and Jobs: A Comparative Analysis to Explore Factors Influencing Flexible and Fixed Schedule Workers, a Case Study of Rasht, Iran. Sustain. Cities Soc. 2017, 31, 74–82. [Google Scholar] [CrossRef]
  38. Aslam, S.A.B.; Masoumi, H.; Asim, M.; Anwer, I. Cyclability in Lahore, Pakistan: Looking into Potential for Greener Urban Traveling. Available online: https://www.researchgate.net/publication/330184987_Cyclability_in_Lahore_Pakistan_Looking_into_Potential_for_Greener_Urban_Traveling (accessed on 27 August 2022).
  39. Nash, S.; Mitra, R. University Students’ Transportation Patterns, and the Role of Neighbourhood Types and Attitudes. J. Transp. Geogr. 2019, 76, 200–211. [Google Scholar] [CrossRef]
  40. Gravenstine, V.; Kuehn, D.M.; Dayer, A.A. Factors Influencing Intended Bicycling Behavior. J. Park Recreat. Admi. 2022, 40, 104–122. [Google Scholar] [CrossRef]
  41. Fasan, E.; Tight, M.; Evdorides, H. Factors Influencing Cycling among Secondary School Adolescents in an Ethnically Diverse City: The Perspective of Birmingham Transport Stakeholders. Sustainability 2021, 13, 12400. [Google Scholar] [CrossRef]
  42. McDonald, N.C. Active Transportation to School: Trends among U.S. Schoolchildren, 1969-2001. Am. J. Prev. Med. 2007, 32, 509–516. [Google Scholar] [CrossRef] [PubMed]
  43. Jurak, G.; Sorić, M.; Ocvirk, T.; Potočnik, Ž.L.; Meh, K.; Ðurić, S.; Sember, V.; Starc, G. Barriers and Determinants of Active Commuting to School in Slovenia. Sustainability 2021, 13, 13808. [Google Scholar] [CrossRef]
  44. Mitra, R.; Nash, S. Can the Built Environment Explain Gender Gap in Cycling? An Exploration of University Students’ Travel Behavior in Toronto, Canada. Int. J. Sustain. Transp. 2018, 13, 138–147. [Google Scholar] [CrossRef]
  45. Wolek, M.; Suchanek, M.; Czuba, T. Factors Influencing Walking Trips. Evidence from Gdynia, Poland. PLoS ONE 2021, 16, e0254949. [Google Scholar] [CrossRef]
  46. Ivan, I.; Horák, J.; Zajíčková, L.; Burian, J.; Fojtík, D. Factors Influencing Walking Distance to the Preferred Public Transport Stop in Selected Urban Centres of Czechia. GeoScape 2019, 13, 16–30. [Google Scholar] [CrossRef] [Green Version]
  47. Kweon, B.S.; Rosenblatt-Naderi, J.; Ellis, C.D.; Shin, W.H.; Danies, B.H. The Effects of Pedestrian Environments on Walking Behaviors and Perception of Pedestrian Safety. Sustainability 2021, 13, 8728. [Google Scholar] [CrossRef]
  48. Oliva, I.; Galilea, P.; Hurtubia, R. Identifying Cycling-Inducing Neighborhoods: A Latent Class Approach. Int. J. Sustain. Transp. 2018, 12, 701–713. [Google Scholar] [CrossRef]
  49. Teuber, M.; Sudeck, G. Why Do Students Walk or Cycle for Transportation? Perceived Study Environment and Psychological Determinants as Predictors of Active Transportation by University Students. Int. J. Environ. Res. Public Health 2021, 18, 1390. [Google Scholar] [CrossRef]
  50. Higgins, R.; Ahern, A. Students’ and Parents’ Perceptions of Barriers to Cycling to School—An Analysis by Gender. Sustainability 2021, 13, 13213. [Google Scholar] [CrossRef]
  51. Pogačar, K.; Dežan, L.; Lamot, M.; Renčelj, M. Determinants of Bicycle Use among Student Population: Exploratory Research of Social and Infrastructure Factors. Appl. Syst. Innov. 2020, 3, 6. [Google Scholar] [CrossRef] [Green Version]
  52. Barberan, A.; De Abreu E Silva, J.; Monzon, A. Factors Influencing Bicycle Use: A Binary Choice Model with Panel Data. Transp. Res. Procedia 2017, 27, 253–260. [Google Scholar] [CrossRef]
  53. Moniruzzaman, M.; Páez, A. A Model-Based Approach to Select Case Sites for Walkability Audits. Health Place 2012, 18, 1323–1334. [Google Scholar] [CrossRef]
  54. Knollenberg, W.; Latkova, P.; Vogt, C.; Rodriguez, A. Active Transportation among Elementary-Aged Students: Walking or Biking to and from School. In Proceedings of the 2008 Northeastern Recreation Research Symposium, Bolton Landing, NY, USA, 30 March–1 April 2008. [Google Scholar]
  55. Safe Routes Partnerships Getting Students Active through Safe Routes to School. 2010, pp. 1–81. Available online: https://www.saferoutespartnership.org/sites/default/files/pdf/EducatorsGuide_0.pdf (accessed on 18 September 2022).
  56. Van Cauwenberg, J.; Van Holle, V.; Simons, D.; Deridder, R.; Clarys, P.; Goubert, L.; Nasar, J.; Salmon, J.; De Bourdeaudhuij, I.; Deforche, B. Environmental Factors Influencing Older Adults’ Walking for Transportation: A Study Using Walk-along Interviews. Int. J. Behav. Nutr. Phys. Act. 2012, 9, 85. [Google Scholar] [CrossRef] [Green Version]
  57. Sun, G.; Acheampong, R.A.; Lin, H.; Pun, V.C. Understanding Walking Behavior among University Students Using Theory of Planned Behavior. Int. J. Environ. Res. Public Health 2015, 12, 13794–13806. [Google Scholar] [CrossRef] [Green Version]
  58. Oyeyemi, A.L.; Adegoke, B.O.; Sallis, J.F.; Oyeyemi, A.Y.; De Bourdeaudhuij, I. Perceived Crime and Traffic Safety Is Related to Physical Activity among Adults in Nigeria. BMC Public Health 2012, 12, 294. [Google Scholar] [CrossRef] [Green Version]
  59. Arellana, J.; Saltarín, M.; Larrañaga, A.M.; Alvarez, V.; Henao, C.A. Urban Walkability Considering Pedestrians’ Perceptions of the Built Environment: A 10-Year Review and a Case Study in a Medium-Sized City in Latin America. Transp. Rev. 2020, 40, 183–203. [Google Scholar] [CrossRef]
  60. Parra, D.C.; Hoehner, C.M.; Hallal, P.C.; Ribeiro, I.C.; Reis, R.; Brownson, R.C.; Pratt, M.; Simoes, E.J. Perceived Environmental Correlates of Physical Activity for Leisure and Transportation in Curitiba, Brazil. Prev. Med. 2011, 52, 234–238. [Google Scholar] [CrossRef]
  61. Ben-Akiva, M.; Walker, J.; Bernardino, A.T.; Gopinath, D.A.; Morikawa, T.; Polydoropoulou, A. Integration of Choice and Latent Variable Models. In Perpetual Motion; Massachusetts Institute of Technology: Cambridge, MA, USA, 2002; pp. 431–470. [Google Scholar] [CrossRef]
  62. Daly, A.; Hess, S.; Patruni, B.; Potoglou, D.; Rohr, C. Using Ordered Attitudinal Indicators in a Latent Variable Choice Model: A Study of the Impact of Security on Rail Travel Behaviour. Transportation 2011, 39, 267–297. [Google Scholar] [CrossRef]
  63. Ashok, K.; Dillon, W.R.; Yuan, S. Extending Discrete Choice Models to Incorporate Attitudinal and Other Latent Variables. J. Mark. Res. 2018, 39, 31–46. [Google Scholar] [CrossRef]
  64. Potoglou, D.; Palacios, J.F.; Feijóo, C. An Integrated Latent Variable and Choice Model to Explore the Role of Privacy Concern on Stated Behavioural Intentions in E-Commerce. J. Choice Model. 2015, 17, 10–27. [Google Scholar] [CrossRef] [Green Version]
  65. Hess, S.; Palma, D. Apollo: A Exible, Powerful and Customisable Freeware Package for Choice Model Estimation and Application Version 0.1.0 User Manua. 2020. Available online: http://www.apollochoicemodelling.com/files/manual/Apollo_v_010.pdf (accessed on 18 September 2022).
  66. Malik, J.; Bunch, D.S.; Handy, S.; Circella, G. A Deeper Investigation into the Effect of the Built Environment on the Use of Ridehailing for Non-Work Travel. J. Transp. Geogr. 2021, 91, 102952. [Google Scholar] [CrossRef]
  67. Vij, A.; Walker, J.L. How, When and Why Integrated Choice and Latent Variable Models Are Latently Useful. Transp. Res. Part B Methodol. 2016, 90, 192–217. [Google Scholar] [CrossRef]
  68. Hess, S.; Palma, D. Apollo: A Flexible, Powerful and Customisable Freeware Package for Choice Model Estimation and Application. J. Choice Model. 2019, 32, 100170. [Google Scholar] [CrossRef]
  69. Halton, J.H. On the Efficiency of Certain Quasi-Random Sequences of Points in Evaluating Multi-Dimensional Integrals. Numer. Math. 1960, 2, 84–90. [Google Scholar] [CrossRef]
  70. Babbie, E.R. The Practice of Social Research, 14th ed.; Cengage Learning US: Boston, MA, USA, 2015; ISBN 9781305445567. [Google Scholar]
  71. Mitra, S.K. Land Use, Land Value, and Transportation: Essays on Accessibility, Carless Households, and Long-Distance Travel; University of California, Irvine: Irvine, CA, USA, 2016. [Google Scholar]
  72. Sethi, S.; Velez-Duque, J. Walk with Women: Gendered Perceptions of Safety in Urban Spaces; Leading Cities: Boston, MA, USA, 2021. [Google Scholar]
  73. Hidayati, I.; Tan, W.; Yamu, C. How Gender Differences and Perceptions of Safety Shape Urban Mobility in Southeast Asia. Transp. Res. Part F Traffic Psychol. Behav. 2020, 73, 155–173. [Google Scholar] [CrossRef]
  74. Emond, C.R.; Tang, W.; Handy, S.L. Explaining Gender Difference in Bicycling Behavior. Transp. Res. Rec. J. Transp. Res. Board 2009, 2125, 16–25. [Google Scholar] [CrossRef]
  75. Kuranami, C.; Winston, B.P. Transportation Research Record No. 1441, Nonmotorized Transportation Around the World. Available online: https://onlinepubs.trb.org/Onlinepubs/trr/1994/1441/1441-008.pdf (accessed on 18 September 2022).
Figure 1. Modeling framework for choice of bicycle for commuting trips.
Sustainability 14 14784 g001
Figure 2. Modeling framework for the walking frequency model.
Sustainability 14 14784 g002
Table 1. Studies on factors influencing use of active transportation.
LiteratureStudy AreaActive
Transportation
Target GroupFactors
Buehler et al., 2011 [35]Germany, USABicycling, walkingNot specificGender, trip distance
McDonald, 2012 [36]USABicyclingSchool going childrenGender
Hatamzadeh et al., 2017 [37]Rasht, IranWalkingWorking groupGender
Aslam et al., 2018 [38]Lahore, PakistanWalkingWorking groupTaboo
Mitra and Nash, 2019 [39]Ontario, CanadaBicyclingUniversity studentBiking facilities, low speed on roads, travel distance, gender
Gravenstine et al., 2022 [40]Central New York, USABicyclingNot specificEnjoyment from riding, riding to spend time with friends and family, and number of children in the household
Fasan et al., 2021 [41]Birmingham, UKBicyclingSecondary school studentPeer groups inclination to bicycle
McDonald, 2007 [42]USABicycling, walkingSchool going childrenTravel distance
Jurak et al., 2021 [43]SloveniaBicycling, walkingSchool going childrenTravel distance
Wolek et al., 2022 [45]Gdynia, PolandWalkingPeople visiting city centerAccessibility of footpaths
Ival et al., 2019 [46]CzechWalkingPeople walking to bus stopAccessibility of footpaths
Kweon et al., 2021 [47]USAWalkingSchool going childrenPresence of a sidewalk, buffer strip, and street trees
Olivia et al., 2018 [48]ChileBicyclingNot specificPresence of dedicated bicycle lane, willingness to bicycle
Tuber and Sudeck, 2021 [49]GermanyBicycling, walkingNot specificSafety from crime and vandalism, Distance to land uses
Higgins and Ahren, 2021 [50]IrelandBicycling, walkingStudentSafety from vehicular traffic
Pogacar et al., 2018 [51]Maribor, SloveniaBicyclingUniversity studentLack of biking infrastructure, fear of bicycle theft, lack of desire or motivation
Barberan 2017 [52]Vitoria-Gasteiz, SpainBicyclingNot specificTravel distance
Moniruzzaman and Paez, 2012 [53]Hamilton, CanadaWalkingNot specificAttitudes towards walking infrastructure
Knollberg et al., 2009 [54]USAWalkingSchool going childrenPerception about safety
Pedrosos et al., 2010 [55]USAWalkingSchool going childrenPerception about safety
Cauwenberg et al., 2012 [56]BelgiumBikingNot specificGender and perception about safety
Sun et al., 2015 [57]Hong KongBicycling, walkingUniversity studentsPerceived health and mental benefit of active transportation
Oyeyemi et al., 2012 [58]Maiduguri, Nigeria, and Bogota, ColombiaWalkingNot specificPerceived safety from roadway traffic
Arrallena et al., 2020 [59]Barranquilla, ColombiaBicyclingNot specificPerceived safety from roadway traffic
Parra et al., 2011 [60]Curitiba, BrazilWalkingNot specificPerception towards pedestrian facilities
Adlakha et al., 2018 [26]Chennai, IndiaWalkingNot specificSafety from crime
Table 2. Summary statistics of the data used for modeling (sample size = 402 households).
VariableSummary
Sociodemographics
Age (mean)29.26
Gender
 Female15.42%
 Male84.58%
Household size (Mean)4.70 persons
Student status41.50%
Monthly household income (mean)35,162 Taka (approx. 360 USD)
Land Use of Home Residence
Residential65.67%
Nonresidential34.33%
Travel
Bicycle ownership024.63%
155.97%
218.91%
30.50%
Motor vehicle ownership059.7%
135.57%
23.48%
3+1.25%
Daily walking time (mean) 64.68 min
Daily cycling time (mean) 31.10 min
Commuting distance (mean) 1.25 km
Mode Choice
Commute mode Bicycle36.80%
Non-commute mode (recreation) Bicycle11.6%
Non-commute mode (going for tea)Bicycle6.20%
Non-commute mode (grocery)Bicycle17.40%
Table 3. Comparison of students and nonstudents regarding AT travel habits.
VariableStudent (Sample Size = 167)Nonstudent (Sample Size = 235)
Sociodemographics
Age *20.3735.86
Gender (female)17.0%14.0%
Travel Behaviors
Daily walking duration (minutes) *47.776.8
Daily biking duration (minutes) *25.934.8
Daily commuting duration (minutes) *13.925.4
Daily commuting distance (in kilometers) *3.015.24
Mode Ownership
Motor vehicle ownership *0.600.40
Bicycle ownership *1.050.88
Home Location Land Use
Educational59.0%0.40%
Residential37.0%85.0%
Primary Mode Choice for Commuting
Auto5.9%12.7%
Bicycle34.1%38.7%
Rickshaw11.9%12.3%
Walk35.3%15.7%
* Reporting the mean values.
Table 4. Responses to selected perception statements.
IndicatorVery Poor
(%)
Poor
(%)
Moderate
(%)
Good
(%)
Very Good (%)
Walkability rating of the road from respondents home for going to the following places:
  • Work/business/school
1.002.4918.4153.7324.38
  • Grocery store
2.491.7428.3643.5323.88
  • Social gathering places (e.g., tea stalls and restaurants)
0.002.9922.8951.2422.89
  • Recreational/ entertainment places (e.g., parks, natural places, and movies)
0.2515.1743.0328.8612.69
Safety rating from traffic while using ATs for the followings:
  • To walk in the local streets
1.007.7138.5643.539.20
  • To walk in the main roads in this neighborhood
0.002.9920.962.6913.43
  • To ride a bicycle in the local roads
0.754.9839.5544.5310.2
  • To ride a bicycle in the main roads
2.2416.4253.7320.656.97
Perceived unsafety rating to use ATs due to criminal activities (mugging, robbing) in the neighorhood during the following times:
  • During day light
1.9910.241.5436.579.70
  • During night
4.4848.0122.1416.428.96
Table 5. The output of the ICLV models for choosing to bicycle for work/commuting trips.
Student Model
(n = 166 *)
Nonstudent Model
(n = 231 *)
Explanatory VariablesEstimatesRobust
t-Ratio
EstimatesRobust
t-Ratio
ASC−2.508−3.618−2.609−1.991
Age 0.0511.803
Income −0.00004−2.036
Number of household members −0.685−3.061
Gender (base = male)0.9151.136−0.362−0.555
Travel distance (in kilometers)0.0160.2980.2744.115
Bicycle ownership dummy0.5330.8781.6633.331
Land use (base = nonresidential)−4.294−3.2370.7391.361
Regular walk time (min)0.0020.2920.0112.653
Regular bicycle time (min)0.0601.7610.0101.771
Vehicle ownership0.7931.448−1.638−3.372
Latent Perception Variables
Walkability perception−0.237−0.6501.1292.736
Road safety perception for AT−0.525−1.2920.3401.079
Neighborhood crime perception1.1072.219−0.391−1.259
Walkability Perception Latent Variable Model is shown in Equation (5a)
Female−0.186−1.104−0.420−2.234
Road Safety Perception for AT Latent Variable Model is shown in Equation (5b)
Female−0.481−3.276−0.166−1.288
Neighborhood Crime Perception Latent Variable Model is shown in Equation (5c)
Female−1.094−4.9390.0590.247
* For missing values, the sample size is reduced.
Publisher’s Note: MDPI stays neutral with regard to jurisdictional claims in published maps and institutional affiliations.

