
A Sustainable Transport System—The MMQUAL Model of Shared Micromobility Service Quality Assessment


Department of International Management, Cracow University of Economics, ul. Rakowicka 27, 31-570 Cracow, Poland
*
Authors to whom correspondence should be addressed.
Sustainability 2022, 14(7), 4168; https://doi.org/10.3390/su14074168
Submission received: 8 March 2022
/
Revised: 25 March 2022
/
Accepted: 29 March 2022
/
Published: 31 March 2022
(This article belongs to the Special Issue Multi-criteria Decision Making and Sustainable Transport)
Abstract
:Shared micromobility is a new phenomenon being observed in urban transport. It is a response to the problems associated with congestion and environmental pollution. Small electric vehicles such as e-scooters are highly suitable for crowded city centres, often providing an alternative to private motor vehicles or public transport, and serve as a good first- and last-mile transport option. While they have become a feature of sustainable transport systems in cities, their impact on the environment often depends on the services offered by operators of this mode of personal transport. There are many tools available to measure the quality of transport, e-services and shared mobility services. However, no specific mechanism has been designed for vehicles in the field of shared e-scooters (research gap). The aim of the article is to verify whether the three dimensions identified by the authors: mobile application functions, device features, and customer service are valid for examining the quality of shared e-micromobility factors on the example of e-scooters. Based on the obtained results, the authors created the MMQUAL (MicroMobility QUALity) model, which accurately describes the quality of the studied phenomenon. The results of the study can serve as a platform for researchers interested in further exploring the issue and improving the proposed model. They may also be of commercial value to operators, who could use this tool to boost the competitiveness of their services by enhancing those features that have the greatest impact on their quality.
1. Introduction
Contemporary cities face many problems. Among the most frequently mentioned logistical problems are congestion, air pollution from car exhaust [1,2], an insufficient number of parking spaces, poor road safety standards, and high noise levels [2,3,4]. All of these factors contribute to a poorer quality of life for urban inhabitants [5]. While transport is an integral part of the economic activity and social life of city dwellers [6], it is also one of the largest sources of air pollution in urban areas [7,8], which in turn has adverse effects on human health, the climate, and ecosystems [9]. Internal combustion vehicles are responsible for the emission of particulate matter (PM2.5 and PM10), soot (BC), particles (UFP), nitrogen oxide (NO2), and carbon monoxide (CO), which are harmful to the body [10,11]. The undesirable effects of an increase in the number of cars in urban areas could be eliminated, inter alia, by implementing smart mobility solutions, i.e., integrated transport and logistics systems that make use of clean energy [4]. Smart Mobility [12] (p. 543) aims to improve mobility while reducing the environmental and social impact of transport, managing congestion, reducing independent travel, encouraging a modal shift, reducing journey distances, and increasing the efficiency of the transport system.
To achieve maximum effects when implementing individual smart mobility solutions, a sustainable approach that combines innovative technologies and the needs of city residents is necessary. Intelligent mobility systems include both collective transport and individual mobility systems, including ridesharing, bikesharing, carsharing, scootersharing, and on-demand ride services [4]. These forms of mobility are to some extent a response to environmental problems. They also ensure mobile independence for their users without requiring them to own a car [13].
The implementation of smart mobility solutions is also considered a key area of sustainable development due to the social and economic benefits it brings. Hence, the issue of sustainable development is very topical from a transport point of view due to a greater focus nowadays on the needs of present and future generations [14]. In the literature, sustainable transport is defined as transport that aims to maintain the right balance, both now and in the future, between maintaining the natural environment [15], economically rational transport activities, and the needs and aspirations of society [16]. However, it should be remembered that assumptions regarding sustainable transport are adopted both at the EU and national levels, including the local level [14].
The objective of sustainable transport is to raise the standard of living and safety levels, prioritise public transport [17], focus more on the needs of pedestrians and promote the role of civil society. According to these goals, transport should not pose a threat to human health and the ecosystem [18,19]. One sustainable transport solution, which at the same time also offers an alternative to public transport, involves creating and developing a system of shared services in transport. These include both car rental companies, i.e., “car-sharing” [20], as well as city bike and electric scooter rentals [21].
Alternative means of transport, such as bicycles or electric scooters, are often a more advantageous option as they enable users to avoid both downtime in traffic jams and exposure to exhaust emissions [22,23]. The development of bicycle paths, intersections with dedicated bicycle lights, as well as the possibility of renting bicycles and scooters, may help popularize these modes of urban mobility [4,24].
However, micromobility devices are not completely indifferent to human safety and health [19]. Users of e-scooters are exposed to increased vibrations while driving, caused by changes in speed, device structure, road surface [25,26,27]. Constrained riding environments are also conducive to accidents involving e-scooters [28]. Therefore, micromobility devices should be properly and rationally used in order to fulfil their function.
There are many tools available to measure the quality of transport, e-services, and shared mobility services, which are presented in Table 1. However, no specific mechanism has been designed for vehicles in the field of shared e-scooters. The literature only includes examples of customer satisfaction and loyalty surveys, or studies of limited detail and complexity. The research conducted by the authors fills this gap. The aim of the article is to verify whether the three dimensions identified by the authors—mobile application functions, device features, and customer service—are valid for examining the quality of shared e-micromobility factors in the example of e-scooters. Confirmatory factor analysis was used to verify the proposed model. The method of model verification consisted of two stages. First, it was checked whether the identified dimensions were correctly described by observable variables. In the second step, it was verified, by introducing a second-order factor, whether the dimensions correctly described the quality of the service provided. Based on the obtained results, the authors created the MMQUAL (MicroMobility QUALity) model, which accurately described the quality of the studied phenomenon. The advantage of the MMQual model is the adaptation of the proposed quality assessment system, based on three dimensions, to the e-scooter sharing service. The results of the study can serve as a platform for researchers interested in further exploring the issue and improving the proposed model. They may also be of commercial value to operators, who could use this tool to boost the competitiveness of their services by enhancing those features that have the greatest impact on their quality.
2. Electric Scooters as an Element of a Sustainable Smart Mobility System
One sustainable form of individual transport is the electric scooter, which is used in dense urban environments, such as in small and narrow streets, and also helps reduce parking problems in cities [29]. They include such features as GPS and smartphone technology [30,31]. Vehicles of this type can be unblocked using a special application, and on completion of a journey can be left anywhere in the area designated by the operator [32]. E-scooters are small, one-person electric vehicles that fall within the category of micromobility [32,33], which also includes various light, individual vehicles such as e-bikes, skateboards and unicycles [34,35], segways, and the aforementioned e-scooters [32].
E-scooters are a flexible form of urban transport that are especially suitable for short-distance travel. Their light structure and their ability to manoeuvre around different spaces are a great advantage and make them a viable solution to a number of problems connected with travel in towns and cities [24]. They also have great potential for reducing congestion in urban areas [20]. They are used primarily over short distances [36].
While e-scooters have been around for many years, the possibility of renting them is a new trend. The first electric scooter rentals were launched by Bird in Santa Monica, USA in 2017 [33]. Since then, companies such as Bird, Lime, Bolt, and Lyft have been operating in many cities around the world [2,5,37]. At the end of 2019, e-scooter sharing was available in almost three hundred urban centres [24], including in such major European cities as Paris [38], Madrid, Vienna [39], Brussels [40], Berlin, and Stockholm [5], as well as in New Zealand [41] and Australia [42]. Nowadays, most cities in Poland also include electric scooter rental systems [4]. Every year, electric scooters are becoming more and more popular [41,43]. The use of shared scooters has emerged as a popular means of transport, especially among young people [39]. The popularity of the concept of shared mobility may be a consequence of both changes in consumer behaviour—a departure from the ownership model—and increased availability of this mode of transport in urban space [44].
Electrically powered scooters have conquered cities around the world as an alternative to cars, with the potential to reduce urban traffic [37,45,46], noise, and environmental pollution [37,47].
In the literature on the subject, micro-vehicles, including e-scooters, are often described as a new sustainable way of travelling, characterized by low costs and a low negative environmental impact [24].
Electric scooters have undoubtedly taken off in urban areas as a form of individual mobility, and compete in this respect with other modes of transport. However, their impact on the environment has not yet received much attention in the literature, especially in terms of academic research. While some studies support e-scooters as an environmentally friendly solution for congested cities, [48] others report conflicting findings and highlight safety concerns. More and more studies have revealed that, contrary to initial expectations, the sharing of electric scooters may have adverse effects on the environment [24,38,40,49].
Two analytical approaches have been applied in this area. The former compares the environmental impact of shared e-scooters with other modes of transport. The latter approach assesses which aspects of the e-scooter life cycle are most harmful to the environment and identifies potential areas for improvement. Considering the first aspect, e-scooter sharing is often recommended as an ecological form of transport. In comparison with other modes of transport E-scooter rentals often advertise e-scooters as an eco-friendly mode of transportation. As electric vehicles, electric scooters do not emit exhaust fumes, unlike modes of transport powered by combustion engines. However, considering only the exhaust emissions may be wrong. The entire life cycle and its effects must be taken into account when making such an environmental impact assessment. For such an assessment, the literature mainly uses the LCA life cycle assessment method to calculate the environmental performance of shared scooters “from the cradle to the grave”. A number of impacts were assessed, including acidification, eutrophication, the scarcity of constituent materials, and the effect on global warming. This type of analysis provided the basis for estimating the carbon footprint of a passenger in the form of CO2 emissions for a particular distance travelled [24].
American scientists from North Carolina State University were among the first to notice that shared e-scooters emit more greenhouse gases per mile than traveling by bus, bicycle, moped, or foot [49]. Similar research in Europe has confirmed that currently shared e-scooters have a higher carbon footprint than most alternative means of transport [24,38,40].
In turn, research in Paris showed that shared e-scooters emit significantly lower greenhouse gas emissions than private cars and taxis, and slightly less than private mopeds and public buses. However, they have higher emissions than shared bicycles or shared mopeds, trams, local high-speed trains, and metro trains [38]. The impact of shared e-scooters on emissions is largely dependent on the type of trips made with them.
Another interesting observation of researchers is the influence that an e-scooter’s properties have on its life cycle and emissivity. Private e-scooters have a longer lifespan and hence a lower negative impact on the environment than shared e-scooters. According to these researchers, private machines are treated better and are less exposed to vandalism. On the other hand, shared electric scooters generate significant additional effects resulting from the collection and distribution of such vehicles [40].
Another positive environmental benefit is the fact that some owners of private electric scooters decide to buy their own equipment after using shared e-scooters [24,38,40].
The issue of shared electric mobility in the subject literature has been analysed in many respects and from many different perspectives [50]. Besides the environmental aspects noted above, the most frequently discussed issues are costs [51], safety [52,53], parking [53], the fleet, types of power supply, and the systems with which such vehicles are equipped [8,54], as well as infrastructure and patterns of use [51]. However, no studies have been conducted aimed at assessing the quality of e-scooter sharing services. The subject literature includes surveys of user satisfaction and loyalty, as well as analyses of quality in a general sense, as one of a number of different factors. If e-scooters are to become a widely used mode of transport and permanently replace existing means of transport, users must be satisfied, loyal, and benefit from a high quality service [55]. As a consequence, the authors noticed a research gap, the filling of which would enable researchers to identify one of the key determinants of shared e-scooter use.
3. Service Quality Measurement
3.1. Generic Models of Service Quality
One of the first models for assessing service quality was developed by Gronroos [56], who defined quality management as reducing the distance between the experienced quality and the expected quality with the aim of increasing customer satisfaction. Based on this disconfirmatory model, Parasuraman, Zeithaml & Berry [57] proposed one of the most widely used SERVQUAL quality assessment models, encompassing 5 dimensions and 22 measurable variables. A slightly different approach was adopted by Cronin and Taylor [58], who, using only experienced quality as their guide, proposed the SERVPERF (service performance) model. They criticized the SERVQUAL model for measuring satisfaction and attitudes rather than the actual quality of service, albeit while continuing themselves to use the measurable variables and dimensions of the criticized model. Although the disconfirmatory models and the SERVPERF model were widely applied, researchers quickly observed that the design of the models did not suit some service sectors, and began to look for more universal models [59]. It was thus that hierarchical models first came to be developed, the first of which was proposed by Dabholkar [60], while the most widely recognized and empirically confirmed model was that devised by Brady and Cronin [61], which constituted a combination of many previous models and made it possible to adjust the variables to the specificity of the industry.
3.2. Industry-Specific Models of Service Quality
Despite the development of the abovementioned generic models, some researchers still claimed that they could not be applied in certain industries. As a consequence, they embraced the idea of developing industry-specific models [62]. Over the last two decades, a large number of these models have been created, examples of which can be found in Ghotbabadi et al. [59], while in this publication the authors quote models formulated for those sectors making up shared micromobility services:
- Public transport services as a core service;
- E-services as a platform for pre- and post-purchase phases;
- Service quality in a sharing economy measured as a specific combination of traditional and electronic services;
- Shared transport services as a specific dimension of sharing economy services.
The dependencies between the above-mentioned applications are illustrated in Figure 1.
One of the first studies of quality assessment in transport was undertaken by Wen C.H. et al. [63], who, wanting to examine the determinants of customer loyalty in bus services, focused largely on modelling quality assessments of this type of service in Taiwan. Similar research regarding bus transportation services was carried out by Hu and Jen [64], who proposed and tested their own quality assessment scale, as well as by Perez et al. [65], who adapted the dimensions of the “SERVPERF” model and constructed their own “QUALBUS” scale, and Z Memić et al. [66], who used the SERVQUAL method. In 2010, Prasad and Shekha [67] developed a service quality assessment model for the rail industry called Railqual, which was based on SERVQUAL’s dimensions but extended to include three additional dimensions. Randheer et al. [68] suggested a model for assessing the quality of urban transport, while Bakti & Sumaedi [69] offered a model for paratransit services. Sénquiz-Díaz, C. investigated the importance of transport infrastructure and logistic performance using POLS [70] and SEM [71] methods
Shared micromobility services are handled in the pre- and post-purchase phases [72] by means of mobile applications. It is therefore reasonable to look at evaluation models for this type of service. E-services can be defined as the electronic provision of services to customers [73], services delivered via a website [74], as well as operations involving partially or fully mediated interaction between a service provider and a customer [75]. Since the beginning of the 21st century, many models have been developed for this type of service, more extensively by Ladhari [72]. The first models for assessing the quality of this type of service were proposed by Yoo and Donthu [76] regarding a shopping site. In the following years, many models were devised, especially in the area of e-retail, e.g. [77], and website quality, e.g., [78]. More profiled quality models were developed by Huang et al. [79] for mobile services, Lin & Hseih [80] for self-service technologies (SST), and Ho & Lee [81] for e-travel services. All of these studies relied on exploratory or confirmatory factor analysis methods, and what is interesting is that none of them incorporated the SERVQUAL/SERVPERF dimensions.
Sharing economy services use cloud-based technology to match customers with providers of such services as short-term apartment rentals, car rides, and household tasks [82]. During the last decade, many studies assessing the quality of services of this type have been published, as has been described by Akhmedova et al. [83]. However, in the present article the authors focus mainly on the quality of sharing economy services in transport.
Despite the fact that the phenomenon of sharing transport is not new [84], and that many studies have already been conducted on this topic, quality assessment models designed strictly for this mode of transport only appeared relatively recently. One of the first attempts to construct a dedicated quality assessment model for such services was undertaken by Csonka & Csiszár [85], who came up with their own quality assessment model based on the compensated multicriteria method. With the rising popularity of ride-sharing services known as app-taxis, some efforts were undertaken to develop quality assessment models for the industry, primarily in Asia. These efforts were based entirely on SERVQUAL dimensions, such as the models prepared by Ghosh [86] and Hamenda [87], or partially so, as in the case of Banerjee et al. [88] and Dey et al. [89]. As an exception to models based on SERVQUAL dimensions, a number of studies were based on their authors’ own original dimensions, such as Silalahi et al. [90] and Shah [91]. Another sector for which relatively numerous models of service quality assessment have been developed is bike-sharing. As in the previous case, these include models were based on the original dimensions of SERVQUAL, such as was the case in Ma et al. [92] or incorporated modified (renamed) dimensions, such as those developed by Shao, Z et al. [93]. There are also examples based on original dimensions, such as Maioli et al. [94] and Zhou & Zhang [95]. As regards other forms of shared mobility, one noteworthy study is that of He & Csiszár (2018), in which they modelled the phenomenon of mobility as a service on the example of autonomous vehicles [96], which 2 years later they tested on a group of 72 students and 12 experts from Budapest University of Technology and Economics [97]. On the other hand, Nagy & Csiszár [98] conducted a review of the literature and proposed dimensions that correspond to broadly understood passenger urban transport systems. It is also worth mentioning the model developed by Abdullah et al. [99] for app-based demand-responsive transit.
To date, no dedicated quality of service assessment model has been constructed for e-scooter-sharing. The literature only includes examples of customer satisfaction and loyalty surveys, or studies of limited detail and complexity. Hamerska et al. [100] investigated sharing e-scooter service quality and satisfaction using a compilation of SERVQUAL and Kano methods. They identified the most scarce dimensions in terms of service quality, and assessed the impact of 19 measurement variables on user satisfaction. Aman et al. [101] analysed the ratings and comments that users of these devices posted in the mobile application. The authors considered 12 variables and assessed their impact using logistic regression analysis. Ratan et al. [102] assessed, using multiple regression, how certain service features translate into intension of use, thereby making an indirect quality assessment. Popov & Ravi [55] conducted a broader analysis of the relationship between quality, satisfaction, loyalty, and several other factors. However, the complexity of this model did not allow for an in-depth assessment of quality, as this was only measured with 5 variables taken mainly from the above-described models for bike-sharing services. Finally Cheng et al. [103] examined satisfaction and dissatisfaction factors using the KANO model. The above-described models are summarized in Table 1.

Table 1.
Sharing economy service quality models.
| Authors | Country | Scope of Application | Dimensions |
|---|---|---|---|
| Csonka & Csiszár [85] | Hungary | Car-sharing | Flexibility, availability, reliability, comfort, vehicle parameters |
| Silalahi, Handayani & Munajat [90] | Indonesia | Ride-sharing | Service quality, information quality, system quality |
| Ghosh [86] | Bangladesh | Ride-sharing | Assurance, empathy, reliability, responsiveness, tangibility |
| Hamenda [87] | Indonesia | Ride-sharing | Assurance, empathy, reliability, responsiveness, tangibility |
| He & Csiszár [96] | Hungary | Autonomous vehicle | Speciality, availability, accessibility, information, time, user care, comfort |
| Ma, Shi, Yuen, Sun, & Guo [92] | China | Bike-sharing | Assurance, empathy, reliability, responsiveness, tangibility |
| Maioli, de Carvalho & de Medeiros [94] | Brazil | Bike-sharing | Tangibles, system availability, efficiency, security/privacy |
| Zhou & Zhang [95] | China | Bike-sharing | Platform, bicycle entity, value |
| He & Csiszár [97] | Hungary | Mobility as a service | Integration, information, connectivity, comfort |
| Nagy & Csiszár [98] | Hungary | Smart mobility | Environmental sustainability, safety, accessibility, reliability and consistency, integration of micro-mobility, integration of ICT |
| Banerjee, Saha & Jain [88] | India | Ride-sharing | Assurance, empathy, reliability, responsiveness |
| Shah [91] | India | Ride-sharing | Comfort, internal environment, safety and personnel, mobile convenience and reliability, mobile system efficiency and availability, mobile customer service and billing, mobile security and privacy |
| Shao, Li, Guo & Zhang [93] | China | Bike-sharing | Location reliability, prompt response, transaction assurance, customization, vivid appearance |
| Abdullah, Ali, Shah, Javid & Campisi [99] | Pakistan | Demand-responsive transit | Not defined |
| Dey, Salam & Saha [89] | Bangladesh | Ride-sharing | Assurance, empathy |
| Hamerska, Ziółko & Stawiarski [100] | Poland | E-scooter-sharing | Tangibles, reliability, responsiveness, assurance, empathy |
| Aman, Smith-Colin, & Zhang [101] | USA | E-scooter-sharing | Not applicable |
| Ratan, Earle, Rosenthal, Chen, Gambino, Goggin & Lee [102] | USA | E-scooter-sharing | Ease of use of app, scooter ease of use, scooter usefulness |
| Popov & Ravi [55] | International | E-scooter-sharing | Not applicable |
| Cheng, Wu & Xi [103] | China | E-scooter-sharing | Not applicable |
4. Materials and Methods
This study aimed to validate a quality assessment model called MMQUAL (MicroMobilityQUALITY) for an electric-scooter-sharing service in Poland. The overall study design consisted of the 9 steps presented in Figure 2.
A literature review allowed us to identify a research gap and define the quality dimensions that affect the quality of e-scooter-sharing services:
- Mobile application functions;
- Device features;
- Customer service.
The analysed model includes 3 latent and 17 observable variables, which are presented in Table 2.
The respondents were asked about the quality of the service provided according to their own experiences based on the characteristics listed in Table 2 and using a scale from 1—“I strongly disagree” to 5—“I definitely agree”.
The data was collected using the CAWI questionnaire shared to micromobility users forums and university students. The analysis included data that comes from a survey conducted among 584 users of e-scooter-sharing in Poland. The distribution of the basic demographic characteristics of the respondents is shown in Table 3.
The last stage of the analysis involved validating the model for assessing the quality of the e-scooter-sharing service in Poland. All the calculations were made using the R programme.
5. Research Results
Confirmatory factor analysis has been recognised as an important analytical tool in the social and behavioural sciences for many years now. It is one of a number of structural equation modelling techniques used to investigate causal relations between latent and observed variables in a priori-specified, theory-derived models [104]. To achieve their research objective, the authors performed first-order confirmatory factor analysis and second-order confirmatory factor analysis. For the purposes of the first-order confirmatory factor analysis, the authors established a measurement model for assessing the quality of the services provided. This was a first-level model composed of a specific number of different factors. Using second-order confirmatory factor analysis, a model was created in which one higher-order factor expressed users’ assessments of overall quality, which had an impact on the lower-order factors. The analysis was performed according to the following steps:
- First-order confirmatory factor analysis.
- ●
- Model specification;
- ●
- Model estimation;
- ●
- Model evaluation;
- ●
- Model modification.
- Second-order confirmatory factor analysis.
- ●
- Model specification;
- ●
- Model estimation;
- ●
- Model evaluation.
The research procedure is presented on Figure 3.
Confirmatory factor analysis was used to verify the following research hypotheses:
Hypothesis (H1).
The customer service dimension has a significant impact on the quality assessment of a scooter-sharing service.
H2.
The device features dimension has a significant impact on the quality assessment of a scooter-sharing service.
H3.
The mobile application functions assessment has a significant impact on the quality assessment of a scooter-sharing service.
H4.
The quality of a service can be defined as a second-order factor.
The form of the MMQUAL model implemented in a lavaan R package was as follows:
Model<-‘
# Measurement part of the model
MAF = ~AP1 + AP2 + AP3 + AP4 + AP5
DF = ~DF1 + DF2 + DF3 + DF4 + DF5 + DF6
CS = ~CS1 + CS2 + CS3 + CS4 + CS5 + CS6’
For the constructed measurement model, the reliability of the theoretical constructs was first checked. For this purpose, Cronbach’s alpha was used, which was implemented in the semTools package (reliability function). The results was as follows:
- Mobile application functions (MAF)—0.688;
- Device features (DF)—0.813;
- Customer service (CS)—0.794.
The next step in the analysis was the model estimation. The data used in the analysis was on the ordinal scale (Likert Scale). Therefore, the DWLS (the diagonally weighted least squares) estimator was used to estimate the model, which is based on the polychoric correlation matrix [105]. The laavan package (cfa function) implemented in the R program was used to perform the calculation.
All the parameters of the first-order confirmatory factor MMQUAL model were significant at the level of p = 0.05. Figure 4 presents the MMQUAL measurement model.
The estimated model was assessed by means of the fit indices. The following measures were used for this purpose [106,107]:
- The comparative fit index (CFI)—cut off value > 0.9;
- The Tucker–Lewis index (TLI)—cut off value > 0.9;
- The root mean square error of approximation (RMSEA)—cut off value ≤ 0.08;
- The standardized root mean square residual (SRMR)—cut off value ≤ 0.07.
- The fit indices for the MMQUAL model reached the following values:
- Robust comparative fit index (CFI)—0.992;
- Robust Tucker–Lewis index (TLI)—0.991;
- Robust root mean square error of approximation—0.092;
- Standardized root mean square residual—0.077.
The standardized root mean square residual (SRMR) value was found to be higher than the cut-off value. That is why the model needed a modification. The modindices function from the lavaan package was used. As a result of the modification, a correlation between two observable variables was introduced into the model: helpful and patient staff (CS3) and staff with expert knowledge (CS4). The rationale for such a modification is the fact that the indicated observable variables were related to each other, which was not captured in the latent variable. It should be highlighted that the indicated observable variables were characterized by variance close to zero (CS3—0.034 and CS4—0.013). The final structure of the model was as follows:
Model<-
‘ # Measurement part of the model
MAF = ~AP1 + AP2 + AP3 + AP4 + AP5
DF = ~DF1 + DF2 + DF3 + DF4 + DF5 + DF6
CS = ~CS1 + CS2 + CS3 + CS4 + CS5 + CS6
CS3 ~~ CS4’ #Cov(CS3, CS4) to be estimated
In the next step, it was checked whether the introduced modification improved the model fit values. According to the results, all of the fit statistics indicated an acceptable level:
- Robust comparative fit index (CFI)—0.995;
- Robust Tucker–Lewis index (TLI)—0.994;
- Robust root mean square error of approximation—0.076;
- Standardized root mean square residual—0.067.
Therefore, the model was considered to have a good fit with the data. The measurement model was presented in Figure 5.
The MMQUAL model featured relatively strong and statistically significant relationships between the latent and observable variables. The most important of the mobile application functions (MAF) from a descriptive point of view were the: intuitive application interface (AP1)—0.671 and fees charged in accordance with the tariff and time (AP5)—0.659. However, the least significant variable in describing this construct was the possibility of registering an opinion about an e-scooter used (AP2)—0.380. In the case of the device features (DF) latent variable, the greatest importance was assigned to the following observable variables: security (DF5)—0.814 and ease and convenience of use (DF2)—0.809; and the least importance was assigned to speed minimum 25 km per hour (DF6)—0.442. In the case of customer service (CS), the most important variable in terms of its description was access to a hotline (CS2)—0.777. Another two observable variables had similar loadings and were also important variables for describing a customer service latent variable. They were: helpful and patient staff (CS3)—0.751 and staff with expert knowledge (CS4)—0.759. The least significant observable variable for customer service was loyalty programmes (CS5)—0.363.
According to the inventions presented in Figure 3, the correlations between the three latent variables in the first degree model were high and fell within the range of 0.62 to 0.82. The strongest correlation was between the MAF variable and DF and amounted to 0.82, which means that approximately 67% of the variance of both scales may be regarded as common. The weakest correlation occurred between the CS and DF variables (0.62), which means that approximately 38.5% of the variance on both scales may be considered as common. On the other hand, the correlation between MAF and CS was 0.74, which means that approximately 55% of the two scales may be regarded as common variance. As was assumed, all the correlations were positive, which indicates a specific pattern of associations. The magnitude and direction of the correlation of the first-order factors suggest the presence of one common (second-order) factor that would explain this situation [108,109].
In connection with the above, the hypothesis was formed that the quality of a service, in this case the scooter-sharing, can be defined as a second-order factor. This made it possible to assess whether the quality of the service provided was properly reflected by three components: mobile application functions (MAF), device features (DF), and customer service (CS). Therefore, a model was constructed for further analysis, which took into account the second-order factor. The model was as follows:
Model_SQ<-
‘ # Measurement part of the model
MAF = ~AP1 + AP2 + AP3 + AP4 + AP5
DF = ~DF1 + DF2 + DF3 + DF4 + DF5 + DF6
CS = ~CS1 + CS2 + CS3 + CS4 + CS5 + CS6
CS3 ~~ CS4 #Cov(CS3, CS4) to be estimated
SQ = ~MAF + DF + CS #second-order factor’
Figure 6 shows the model estimated by second-order confirmatory factor analysis.
The structural weights from the second-order service quality assessment factor to the first-order factors (mobile application functions, device features, and customer service) were greater than 0.74, which confirms the structural accuracy of the second-order service quality assessment factor. The most significant path in the model SQ in terms of the assessment of the quality of the services provided was mobile application functions (MAF)—0.99, followed by device features (DF)—0.83, and customer service (CS)—0.75.
In the last stage of the research, the hypotheses presented in the paper were verified as follows:
H1.
The dimension of customer service has a significant impact on the quality assessment of the scooter-sharing service—confirmed.
H2.
The dimension of device features has a significant impact on the quality assessment of the scooter-sharing service—confirmed.
H3.
The dimension of mobile application functions has a significant impact on the quality assessment of the scooter-sharing service—confirmed.
H4.
The quality of the service can be defined as a second-order factor—confirmed.
6. Discussion
The MMQUAL model provided a good description of the studied phenomenon and proved to be an accurate tool for gauging users’ assessments of the quality of shared mobility. It consists of three dimensions that ensure a comprehensive picture of the areas that influenced users’ assessments of service quality. The dimension which contributed most to users’ quality assessments was the functionality of the mobile application, which confirmed the need to treat this area as distinct from customer service and device features.
Direct customer service had the least impact on the quality ratings given in this survey. This may be due to the limited need for direct contact due to the specifics of this service, or because a significant part of the customer service can be provided using the application. The research conducted in this study may provide a platform for increasingly more extensive research on both the quality of shared mobility and e-transport services. The model created for this study could thus serve as a solid basis for the development of evaluation theory in relation to the quality of e-micromobility services. The research made it possible, to some extent, to fill the research gap in a relatively new branch of transport from the point of view of sustainable development, i.e., micromobility sharing services. The proposed model is the first attempt at a theoretical approach to evaluating the quality of e-scooter-sharing services. Replication of this research would help confirm the proposed model and further develop it. The defined dimensions shaping the quality of the examined service actually describe the measurement variables that can serve as a tool for assessing quality.
The proposed model was largely determined by the structure of the study population, which mainly comprised young people. This may explain why, according to the research results, the one factor that most determined service quality was the mobile application.
When repeating the research, particular attention should be paid to ensure greater diversification of the research sample. The same method should also be used to study other means of shared micromobility, e.g., electric bicycles, moped scooters, segways, onewheels. This would make the proposed model more universal.
Another limitation is the selection of measurement variables. Nevertheless, as the model explains the e-scooter sharing services issue well, the inclusion or replacement of some measurement variables may improve the proposed model.
Another interesting approach would be to select individual service providers from the sample and compare the quality of the services they offer. This would allow the quality of services offered by individual operators to be assessed and the differences between them identified. On the other hand, considering the device type may allow researchers to determine the influence of this factor on comfort and driving stability.
Finally, it is worthwhile to investigate whether the application of the model translates into higher user loyalty and therefore the economic result of the sharing services operators.
7. Conclusions
The proposed model, including the construction of its latent variables, can be applied as a tool for assessing the quality of services for e-micromobility operators.
Using this tool could enable researchers to identify and assess the factors that have the greatest impact on the quality of a tested service, which in turn could allow operators to better shape their services, adapting them to the requirements and preferences of customers
The model’s application by sharing e-scooters operators could help them gain a competitive advantage by more quickly reaching service maturity within the product lifecycle concept. It should be taken into consideration that consumer preferences may differ due to geographic, demographic, and cultural aspects. The proposed model could be applied to examine these issues and may allow operators to effectively diversify their services depending on market characteristics. It should be noted that the abovementioned aspects may change over time; therefore, operators should conduct periodic quality assessment using the MMQUAL model, which would indirectly evaluate the model.
Author Contributions
Writing—original draft preparation, review, and editing M.H., M.Z. and P.S. All authors have read and agreed to the published version of the manuscript.
Funding
The publication was financed by grants awarded to the Cracow University of Economics.
Institutional Review Board Statement
Not applicable.
Informed Consent Statement
Not applicable.
Data Availability Statement
The data presented in this study are available on request from the corresponding author.
Conflicts of Interest
The authors declare no conflict of interest.
References
- Shaheen, S.; Cohen, A. Shared Micromoblity Policy Toolkit: Docked and Dockless Bike and Scooter Sharing. 2019. Available online: https://escholarship.org/content/qt00k897b5/qt00k897b5.pdf (accessed on 2 February 2022).
- Gössling, S. Integrating e-scooters in urban transportation: Problems, policies, and the prospect of system change. Transp. Res. Part D 2020, 79, 102230. [Google Scholar] [CrossRef]
- Jovicic, G. E-Scooters in Inner City Vienna-Deployment Prospects and Environmental Impact. Doctoral Dissertation, Universität Wien, Wien, Austria, 2020. [Google Scholar]
- Boichuk, N. Smart Mobility Jako Podstawowy Element Koncepcji Inteligentnego Miasta; Wydawnictwo Naukowe Uniwersytetu Śląskiego: Katowice, Poland, 2021. [Google Scholar]
- Moralioğlu, B.; Cenani, Ş.; Çağdaş, G. A Decision Support System for Placing Shared E-Scooters: A Case Study for Istanbul. J. Comput. Des. 2021, 2, 127–148. [Google Scholar] [CrossRef]
- Koźlak, A. Ekonomika Transportu: Teoria i Praktyka Gospodarcza; Wydawnictwo Uniwersytetu Gdańskiego: Gdańsk, Poland, 2007; p. 16. [Google Scholar]
- Fazio, M.; Giuffrida, N.; Le Pira, M.; Inturri, G.; Ignaccolo, M. Planning Suitable Transport Networks for E-Scooters to Foster Micromobility Spreading. Sustainability 2021, 13, 11422. [Google Scholar] [CrossRef]
- Chen, Y.-W.; Cheng, C.-Y.; Li, S.-F.; Yu, C.-H. Location optimization for multiple types of charging stations for electric scooters. Appl. Soft Comput. 2018, 67, 519–528. [Google Scholar] [CrossRef]
- Apostolou, G.; Reinders, A.; Geurs, K. An Overview of Existing Experiences with Solar-Powered E-Bikes. Energies 2018, 11, 2129. [Google Scholar] [CrossRef] [Green Version]
- Businge, C.N.; Viani, S.; Pepe, N.; Borgarello, M.; Caruso, C.; Tripodi, G.; Soresinetti, S. Energy Efficiency Solutions for Sustainable Urban Mobility: Case Study of the Milan Metropolitan Area. Urban Transp. 2019, 182, 151–163. [Google Scholar] [CrossRef]
- European Commission. Annual Activity Report 2020 Directorate-General for Mobility and Transport. 2020, p. 55. Available online: https://ec.europa.eu/info/sites/default/files/annual-activity-report-2020-mobility-and-transport_en.pdf (accessed on 2 February 2022).
- Papa, E.; Lauwers, D. Smart mobility: Opportunity of threat to innovate places and cities? In Proceedings of the 20th International Conference on Urban Planning, Regional Development and Information Society, Ghent, Belgium, 5–7 May 2015. [Google Scholar]
- Brezovec, P.; Hampl, N. Electric Vehicles Ready for Breakthrough in MaaS? Consumer Adoption of E-Car Sharing and E-Scooter Sharing as a Part of Mobility-As-A-Service (MaaS). Energies 2021, 14, 1088. [Google Scholar] [CrossRef]
- Mielczarek-Mikołajów, J. Zrównoważony transport w kontekście koncepcji smart administration. Zesz. Nauk. Uniw. Wrocławskiego 2021, 179, 175–176. [Google Scholar]
- Oeschger, G.; Carroll, P.; Caulfield, B. Micromobility and public transport integration: The current state of knowledge. Transp. Res. Part D Transp. Environ. 2020, 89, 102628. [Google Scholar] [CrossRef]
- Zacharias, J.; Sheng, Q. Why Cycling in 2007 Was Faster than Being Driven in 2017 in Tianjin. J. Traffic Transp. Eng. 2019, 7, 1–12. [Google Scholar] [CrossRef] [Green Version]
- Imani, A.F.; Anowar, S.; Miller, E.J.; Eluru, N. Hail a cab or ride a bike? A travel time comparison of taxi and bicycle-sharing systems in New York City. Transp. Res. Part A Policy Pract. 2017, 101, 11–21. [Google Scholar] [CrossRef]
- OECD. Assessment & decision making for sustainable transport. In Proceedings of the European Conference of Ministers of Transport, Paris, France, 21 April 2004. [Google Scholar]
- Ignaccolo, M.; Inturri, G.; Cocuzza, E.; Giuffrida, N.; Le Pira, M.; Torrisi, V. Developing micromobility in urban areas: Network planning criteria for e-scooters and electric micromobility devices. Transp. Res. Procedia 2022, 60, 448–455. [Google Scholar] [CrossRef]
- Anderton, E.; Clydesdale, G.; Collins, H.; Ferguson, D.; Hatton, G.; McRae, E.; Perry, G.; Pohe, S.; Poulter, E.; Press, H.; et al. E-Scooters within Dunedin City: A sustainable outreach project. Scope Contemp. Res. Top. (Learn. Teach. 8) 2019, 8, 58. [Google Scholar] [CrossRef]
- Creutzig, F. An Integrated Data Platform to Leverage the Benefits of Smart Mobility. 2020. Available online: https://www.researchgate.net/profile/Felix-Creutzig/publication/339002024_An_integrated_data_platform_to_leverage_the_benefits_of_smart_mobility/links/5e384ad492851c7f7f1a301d/An-integrated-data-platform-to-leverage-the-benefits-of-smart-mobility.pdf (accessed on 7 March 2022).
- Ejaz, W.; Anpalagan, A. Internet of things enabled electric vehicles in smart cities. In Internet of Things for Smart Cities; Springer: Cham, Switzerland, 2019; pp. 39–46. ISBN 978-3-319-95036-5. [Google Scholar] [CrossRef]
- Aymen, F.; Mahmoudi, C. A Novel Energy Optimization Approach for Electrical Vehicles in a Smart City. Energies 2019, 12, 929. [Google Scholar] [CrossRef] [Green Version]
- Bozzi, A.; Aguilera, A. Shared E-Scooters: A Review of Uses, Health and Environmental Impacts, and Policy Implications of a New Micro-Mobility Service. Sustainability 2021, 13, 8676. [Google Scholar] [CrossRef]
- Cano-Moreno, J.D.; Islán, M.E.; Blaya, F.; D’Amato, R.; Juanes, J.A.; Soriano, E. E-scooter Vibration Impact on Driver Comfort and Health. J. Vib. Eng. Technol. 2021, 9, 1023–1037. [Google Scholar] [CrossRef]
- Cano-Moreno, J.D.; Marcos, M.I.; Haro, F.B.; D’Amato, R.; Juanes, J.A.; Heras, E.S. Methodology for the study of the influence of e-scooter vibrations on human health and comfort. In Proceedings of the Seventh International Conference on Technological Ecosystems for Enhancing Multiculturality, León, Spain, 16–18 October 2019. [Google Scholar]
- Ma, Q.; Yang, H.; Mayhue, A.; Sun, Y.; Huang, Z.; Ma, Y. E-Scooter safety: The riding risk analysis based on mobile sensing data. Accid. Anal. Prev. 2020, 151, 105954. [Google Scholar] [CrossRef]
- Trefzger, M.; Titov, W.; Schlegel, T. Analysis and comparison of the gaze behavior of e-scooter drivers and cyclists. Informatik 2020, 2021, 1163. [Google Scholar] [CrossRef]
- Hardt, C.; Bogenberger, K. Usage of e-Scooters in Urban Environments. Transp. Res. Procedia 2019, 37, 155–162. [Google Scholar] [CrossRef]
- Hosseinzadeh, A.; Algomaiah, M.; Kluger, R.; Li, Z. E-scooters and sustainability: Investigating the relationship between the density of E-scooter trips and characteristics of sustainable urban development. Sustain. Cities Soc. 2020, 66, 102624. [Google Scholar] [CrossRef]
- Creutzig, F. Making Smart Mobility Sustainable; Israel Policy Public Institute: Tel Aviv, Israel, 2021. [Google Scholar]
- Clewlow, R.R. The Micro-Mobility Revolution: The Introduction and Adoption of Electric Scooters in the United States. In Proceedings of the Transportation Research Board 98th Annual Meeting, Washington, DC, USA, 13−17 January 2019. [Google Scholar]
- Tuncer, S.; Brown, B. E-scooters on the ground: Lessons for redesigning urban micro-mobility. In Proceedings of the 2020 CHI Conference on Human Factors in Computing Systems. ACM, Honolulu, HI, USA, 21 April 2020; pp. 1–14. [Google Scholar]
- Liu, M.; Seeder, S.; Li, H. Analysis of e-scooter trips and their temporal usage patterns. Inst. Transp. Eng. ITE J. 2019, 89, 44–49. [Google Scholar]
- Chan, N.D.; Shaheen, S.A. Ridesharing in North America: Past, present, and future. Transp. Rev. 2012, 32, 93–112. [Google Scholar] [CrossRef]
- Ma, Q.; Yang, H.; Ma, Y.; Yang, D.; Hu, X.; Xie, K. Examining municipal guidelines for users of shared E-Scooters in the United States. Transp. Res. Part D Transp. Environ. 2021, 92, 102710. [Google Scholar] [CrossRef]
- Degele, J.; Gorr, A.; Haas, K.; Kormann, D.; Krauss, S.; Lipinski, P.; Tenbih, M.; Koppenhoefer, C.; Fauser, J.; Hertweck, D. Identifying e-scooter sharing customer segments using clustering. In Proceedings of the 2018 IEEE International Conference on Engineering, Technology and Innovation (ICE/ITMC), Stuttgard, Germany, 17–20 June 2018; pp. 1–8. [Google Scholar] [CrossRef]
- De Bortoli, A.; Christoforou, Z. Consequential LCA for territorial and multimodal transportation policies: Method and application to the free-floating e-scooter disruption in Paris. J. Clean. Prod. 2020, 273, 122898. [Google Scholar] [CrossRef]
- Laa, B.; Leth, U. Survey of E-scooter users in Vienna: Who they are and how they ride. J. Transp. Geogr. 2020, 89, 102874. [Google Scholar] [CrossRef]
- Moreau, H.; de Jamblinne de Meux, L.; Zeller, V.; D’Ans, P.; Ruwet, C.; Achten, W.M. Dockless E-Scooter: A Green Solution for Mobility?Comparative Case Study between Dockless E-Scooters, Displaced Transport, and Personal E-Scooters. Sustainability 2020, 12, 1803. [Google Scholar] [CrossRef] [Green Version]
- Fitt, H.; Curl, A. The early days of shared micromobility: A social practices approach. J. Transp. Geogr. 2020, 86, 102779. [Google Scholar] [CrossRef]
- Mitchell, G.; Tsao, H.; Randell, T.; Marks, J.; Mackay, P. Impact of electric scooters to a tertiary emergency department: 8-week review after implementation of a scooter share scheme. Emerg. Med. Australas. 2019, 31, 930–934. [Google Scholar] [CrossRef]
- Feng, Y.; Zhong, D.; Sun, P.; Zheng, W.; Cao, Q.; Luo, X.; Lu, Z. Micromobility in smart cities: A closer look at shared dockless e-scooters via big social data. In Proceedings of the IEEE International Conference on Communications, Montreal, QC, Canada, 14–23 June 2021; pp. 1–6. [Google Scholar] [CrossRef]
- PricewaterhouseCoopers Report. The Sharing Economy: How is it Affecting You and Your Business? Report PricewaterhouseCoopers. August 2014. Available online: https://pwc.blogs.com/files/sharing-economy-final_0814.pdf (accessed on 20 March 2022).
- Allem, J.-P.; Majmundar, A. Are electric scooters promoted on social media with safety in mind? A case study on Bird’s Instagram. Prev. Med. Rep. 2018, 13, 62–63. [Google Scholar] [CrossRef]
- Ahmed, T.; Hyland, M.; Sarma, N.J.; Mitra, S.; Ghaffar, A. Quantifying the employment accessibility benefits of shared automated vehicle mobility services: Consumer welfare approach using logsums. Transp. Res. Part A Policy Pract. 2020, 141, 221–247. [Google Scholar] [CrossRef]
- Che, M.; Lum, K.M.; Wong, Y.D. Users’ attitudes on electric scooter riding speed on shared footpath: A virtual reality study. Int. J. Sustain. Transp. 2020, 15, 152–161. [Google Scholar] [CrossRef]
- Rahimuddin, M. Innovation Adoption of New E-Scooters Service in Finland on Consumer Perspective; TSE, University of Turku: Turku, Finland, 2020. [Google Scholar]
- Hollingsworth, J.; Copeland, B.; Johnson, J.X. Are e-scooters polluters? The environmental impacts of shared dockless electric scooters. Environ. Res. Lett. 2019, 14, 084031. [Google Scholar] [CrossRef]
- Turoń, K.; Kubik, A.; Chen, F. Electric Shared Mobility Services during the Pandemic: Modeling Aspects of Transportation. Energies 2021, 14, 2622. [Google Scholar] [CrossRef]
- Lee, M.; Chow, J.; Yoon, G.; He, B.Y. Forecasting e-Scooter Competition with Direct and Access Trips by Mode and Distance in New York City. arXiv 2021, arXiv:1908.08127. [Google Scholar]
- Pérez, V. Simulation of a Public E-Bike Sharing System; Universitat Politechnica Di Catalugna: Barcelona, Spain, 2016. [Google Scholar]
- Wu, L.; Gu, W.; Fan, W.; Cassidy, M.J. Optimal design of transit networks fed by shared bikes. Transp. Res. Part B Methodol. 2019, 131, 63–83. [Google Scholar] [CrossRef]
- Younes, H.; Zou, Z.; Wu, J.; Baiocchi, G. Comparing the Temporal Determinants of Dockless Scooter-share and Station-based Bike-share in Washington, D.C. Transp. Res. Part A Policy Pract. 2020, 134, 308–320. [Google Scholar] [CrossRef]
- Popov, A.I.; Ravi, Y. Conceptualization of Service Loyalty in Access-Based Services; Linköping University: Linköping, Sweden, 2020. [Google Scholar]
- Grönroos, C. A Service Quality Model and its Marketing Implications. Eur. J. Mark. 1984, 18, 36–44. [Google Scholar] [CrossRef]
- Parasuraman, A.; Zeithaml, V.; Berry, L. SERVQUAL: A multiple-item scale for measuring consumer perceptions of service quality. J. Retail. 1988, 64, 12–37. [Google Scholar]
- Cronin, J.J., Jr.; Taylor, S.A. Measuring service quality: A reexamination and extension. J. Mark. 1992, 3, 55–68. [Google Scholar] [CrossRef]
- Ghotbabadi, A.R.; Feiz, S.; Baharun, R. Service quality measurements: A review. Int. J. Acad. Res. Bus. Soc. Sci. 2015, 2, 267. [Google Scholar] [CrossRef]
- Dabholkar, P.A.; Thorpe, D.I.; Rentz, J.O. A Measure of Service Quality for Retail Stores: Scale Development and Validation. J. Acad. Mark. Sci. 1996, 1, 3–16. [Google Scholar] [CrossRef]
- Brady, M.K.; Cronin, J.J. Customer Orientation: Effects on Customer Service Perceptions and Outcome Behaviors. J. Serv. Res. 2001, 3, 241–251. [Google Scholar] [CrossRef]
- Seth, N.; Deshmukh, S.G.; Vrat, P. Service quality models: A review. Int. J. Qual. Reliab. Manag. 2005, 9, 913–949. [Google Scholar] [CrossRef] [Green Version]
- Wen, C.H.; Lan, L.W.; Cheng, H.L. Structural equation modeling to determine passenger loyalty toward intercity bus services. Transp. Res. Rec. 2005, 1, 249–255. [Google Scholar] [CrossRef]
- Hu, K.; Jen, W. Passengers’ Perceived Service Quality of City Buses in Taipei: Scale Development and Measurement. Transp. Rev. 2006, 26, 645–662. [Google Scholar] [CrossRef]
- Pérez, M.S.; Abad, J.C.G.; Carrillo, G.M.M.; Fernández, R.S. Effects of service quality dimensions on behavioural purchase intentions: A study in public-sector transport. Manag. Serv. Qual. Int. J. 2007, 2, 134–151. [Google Scholar] [CrossRef]
- Memic, Z.; Vasiljevic, M.; Stevic, Ž.; Tanackov, I. Measuring the quality of logistics services in the transport company using the SERVQUAL MODEL. In Proceedings of the 2nd International Conference on Management, Engineering and Environment, Belgrade, Serbia, 3–4 October 2018. [Google Scholar]
- Devi Prasad, M.; Shekhar, B.R. Development of railqual: A service quality scale for measuring Indian railway passenger. Manag. Sci. Eng. 2010, 3, 87–94. [Google Scholar]
- Randheer, K.; Al-Motawa, A.A.; Vijay, P.J. Measuring Commuters’ Perception on Service Quality Using SERVQUAL in Public Transportation. Int. J. Mark. Stud. 2011, 3, 21–34. [Google Scholar] [CrossRef] [Green Version]
- Bakti, I.G.M.Y.; Sumaedi, S. P-TRANSQUAL: A service quality model of public land transport services. Int. J. Qual. Reliab. Manag. 2015, 32, 534–558. [Google Scholar] [CrossRef]
- Sénquiz-Díaz, C. Transport infrastructure quality and logistics performance in exports. Economics 2021, 1, 107–124. [Google Scholar] [CrossRef]
- Sénquiz-Díaz, C. The Effect of Transport and Logistics on Trade Facilitation and Trade: A PLS-SEM Approach. Economics 2021, 9, 11–24. [Google Scholar] [CrossRef]
- Ladhari, R. Developing e-service quality scales: A literature review. J. Retail. Consum. Serv. 2010, 17, 464–477. [Google Scholar] [CrossRef]
- Saanen, A.V.; Saanen, Y.; Verbraeck, A.; Sol, H.G. Snapshot of e-commerce’s opportunities and threats. Electron. Mark. 1999, 9, 181–189. [Google Scholar] [CrossRef]
- Reynolds, J. The Complete E-commerce Book: Design, Build and Maintains Successful Web-Based Business; CMP-Books: New York, NY, USA, 2000. [Google Scholar]
- Surjadjaja, H.; Ghosh, S.; Antony, J. Determining and assessing the determinants of e-service operations. Manag. Serv. Qual. Int. J. 2003, 13, 39–53. [Google Scholar] [CrossRef]
- Yoo, B.; Donthu, N. Developing a scale to measure the perceived quality of an Internet shopping site (SITEQUAL). Q. J. Electron. Commer. 2001, 1, 31–45. [Google Scholar]
- Parasuraman, A.; Zeithaml, V.A.; Malhotra, A. ES-QUAL: A multiple-item scale for assessing electronic service quality. J. Serv. Res. 2005, 3, 213–233. [Google Scholar] [CrossRef]
- Zeithaml, V.A.; Parasuraman, A.; Malhotra, A. Service Quality Delivery through Web Sites: A Critical Review of Extant Knowledge. J. Acad. Mark. Sci. 2002, 30, 362–375. [Google Scholar] [CrossRef] [Green Version]
- Huang, E.Y.; Lin, S.W.; Fan, Y.C. MS-QUAL: Mobile service quality measurement. Electron. Commer. Res. Appl. 2015, 2, 126–142. [Google Scholar] [CrossRef]
- Lin, J.-S.C.; Hsieh, P.-L. Assessing the Self-service Technology Encounters: Development and Validation of SSTQUAL Scale. J. Retail. 2011, 87, 194–206. [Google Scholar] [CrossRef]
- Ho, C.-I.; Lee, Y.-L. The development of an e-travel service quality scale. Tour. Manag. 2007, 28, 1434–1449. [Google Scholar] [CrossRef]
- Apte, U.M.; Davis, M.M. Sharing Economy Services: Business Model Generation. Calif. Manag. Rev. 2019, 61, 104–131. [Google Scholar] [CrossRef]
- Akhmedova, A.; Manresa, A.; Rivera, D.E.; Bikfalvi, A. Service quality in the sharing economy: A review and research agenda. Int. J. Consum. Stud. 2021, 45, 889–910. [Google Scholar] [CrossRef]
- Young, R. Experiment in car-sharing. The Times, 19 July 1977; p. 2. [Google Scholar]
- Csonka, B.; Csiszár, C. Service Quality Analysis and Assessment Method for European Carsharing Systems. Period. Polytech. Transp. Eng. 2016, 44, 80–88. [Google Scholar] [CrossRef] [Green Version]
- Ghosh, M. Customers’ Expectations Meet Perceptions or Not: App-Based Ride-Sharing Services by Uber and Pathao in Dhaka City. ASA Univ. Rev. 2018, 2, 12. [Google Scholar]
- Hamenda, A. An integrated model of service quality, price fairness, ethical practice and customer perceived values for customer satisfaction of sharing economy platform. Int. J. Bus. Soc. 2018, 3, 19. [Google Scholar]
- Banerjee, P.S.; Saha, S.; Jain, D. Measuring Service Quality of On-Demand Ride Services. Int. J. Manag. 2020, 10, 11. [Google Scholar]
- Dey, T.; Salam, M.A.; Saha, T. Evaluation and analysis of user satisfaction of ride-sharing service: An assurance and empathy in Bangladesh perspective. Can. J. Bus. Inf. Stud. 2021, 2, 22–28. [Google Scholar]
- Silalahi, S.L.B.; Handayani, P.W.; Munajat, Q. Service Quality Analysis for Online Transportation Services: Case Study of GO-JEK. Procedia Comput. Sci. 2017, 124, 487–495. [Google Scholar] [CrossRef]
- Shah, T.R. Service quality dimensions of ride-sourcing services in Indian context. Benchmarking Int. J. 2020, 28, 249–266. [Google Scholar] [CrossRef]
- Ma, F.; Shi, W.; Yuen, K.F.; Sun, Q.; Guo, Y. Multi-stakeholders’ assessment of bike sharing service quality based on DEMATEL–VIKOR method. Int. J. Logist. Res. Appl. 2019, 5, 449–472. [Google Scholar] [CrossRef]
- Shao, Z.; Li, X.; Guo, Y.; Zhang, L. Influence of service quality in sharing economy: Understanding customers’ continuance intention of bicycle sharing. Electron. Commer. Res. Appl. 2020, 40, 100944. [Google Scholar] [CrossRef]
- Maioli, H.C.; de Carvalho, R.C.; de Medeiros, D.D. SERVBIKE: Riding customer satisfaction of bicycle sharing service. Sustain. Cities Soc. 2019, 50, 101680. [Google Scholar] [CrossRef]
- Zhou, Z.; Zhang, Z. Customer satisfaction of bicycle sharing: Studying perceived service quality with SEM model. Int. J. Logist. Res. Appl. 2018, 22, 437–448. [Google Scholar] [CrossRef]
- He, Y.; Csiszár, C. Quality assessment method for mobility-as-a-service based on autonomous vehicles. In Proceedings of the International Conference on Traffic and Transport Engineering, Belgrade, Serbia, 27–28 September 2018. [Google Scholar]
- He, Y.; Csiszár, C. Quality Assessment Method for Mobility as a Service. Promet-Traffic Transp. 2020, 32, 611–624. [Google Scholar] [CrossRef]
- Nagy, S.; Csiszár, C. The quality of smart mobility: A systematic review. Sci. J. Silesian Univ. Technol. Ser. Transp. 2020, 109, 117–127. [Google Scholar] [CrossRef]
- Abdullah, M.; Ali, N.; Shah, S.; Javid, M.; Campisi, T. Service Quality Assessment of App-Based Demand-Responsive Public Transit Services in Lahore, Pakistan. Appl. Sci. 2021, 11, 1911. [Google Scholar] [CrossRef]
- Hamerska, M.; Ziółko, M.; Stawiarski, P. Assessment of The Quality Of Shared Micromobility Services On The Example Of The Electric Scooter Market In Poland. Int. J. Qual. Res. 2022, 1, 19–34. [Google Scholar] [CrossRef]
- Aman, J.J.; Smith-Colin, J.; Zhang, W. Listen to E-scooter riders: Mining rider satisfaction factors from app store reviews. Transp. Res. Part D Transp. Environ. 2021, 95, 102856. [Google Scholar] [CrossRef]
- Ratan, R.; Earle, K.; Rosenthal, S.; Chen, V.H.H.; Gambino, A.; Goggin, G.; Stevens, H.; Li, B.; Lee, K.M. The (digital) medium of mobility is the message: Examining the influence of e-scooter mobile app perceptions on e-scooter use intent. Comput. Hum. Behav. Rep. 2021, 3, 100076. [Google Scholar] [CrossRef]
- Cheng, J.; Wu, Y.; Xi, L. Discuss attractive factor of e-scooter with miryoku engineering and fuzzy kano model. In International Conference on HCI in Business, Government, and Organizations; Springer: Cham, Switzerland, 2017; pp. 27–36. [Google Scholar] [CrossRef]
- Mueller, R.; Hancock, G. Factor analysis and latent structure, confirmatory. In International Encyclopedia of the Social & Behavioral Sciences; Elsevier: Oxford, UK, 2001; pp. 5239–5244. [Google Scholar]
- Savalei, V.; Rhemtulla, M. The performance of robust test statistics with categorical data. Br. J. Math. Stat. Psychol. 2012, 66, 201–223. [Google Scholar] [CrossRef]
- Byrne, B. Structural Equation Modelling with AMOS: Basic Concepts Application, and Programming; Rouledge Taylor & Francis Group: New York, NY, USA, 2010. [Google Scholar]
- Hu, L.T.; Bentler, P.M. Cutoff criteria for fit indexes in covariance structure analysis: Conventional criteria versus new alternatives. Struct. Equ. Model. Multidiscip. J. 1999, 6, 1–55. [Google Scholar] [CrossRef]
- Dąbrowski, D. Second-order factor model of market information quality. Manag. Sci. 2015, 3, 58–68. [Google Scholar] [CrossRef] [Green Version]
- Brown, T. Confirmatory Factor Analysis for Applied Research; The Guilford Press: New York, NY, USA, 2015. [Google Scholar]
Figure 1.
Shared micromobility in services—a typology.
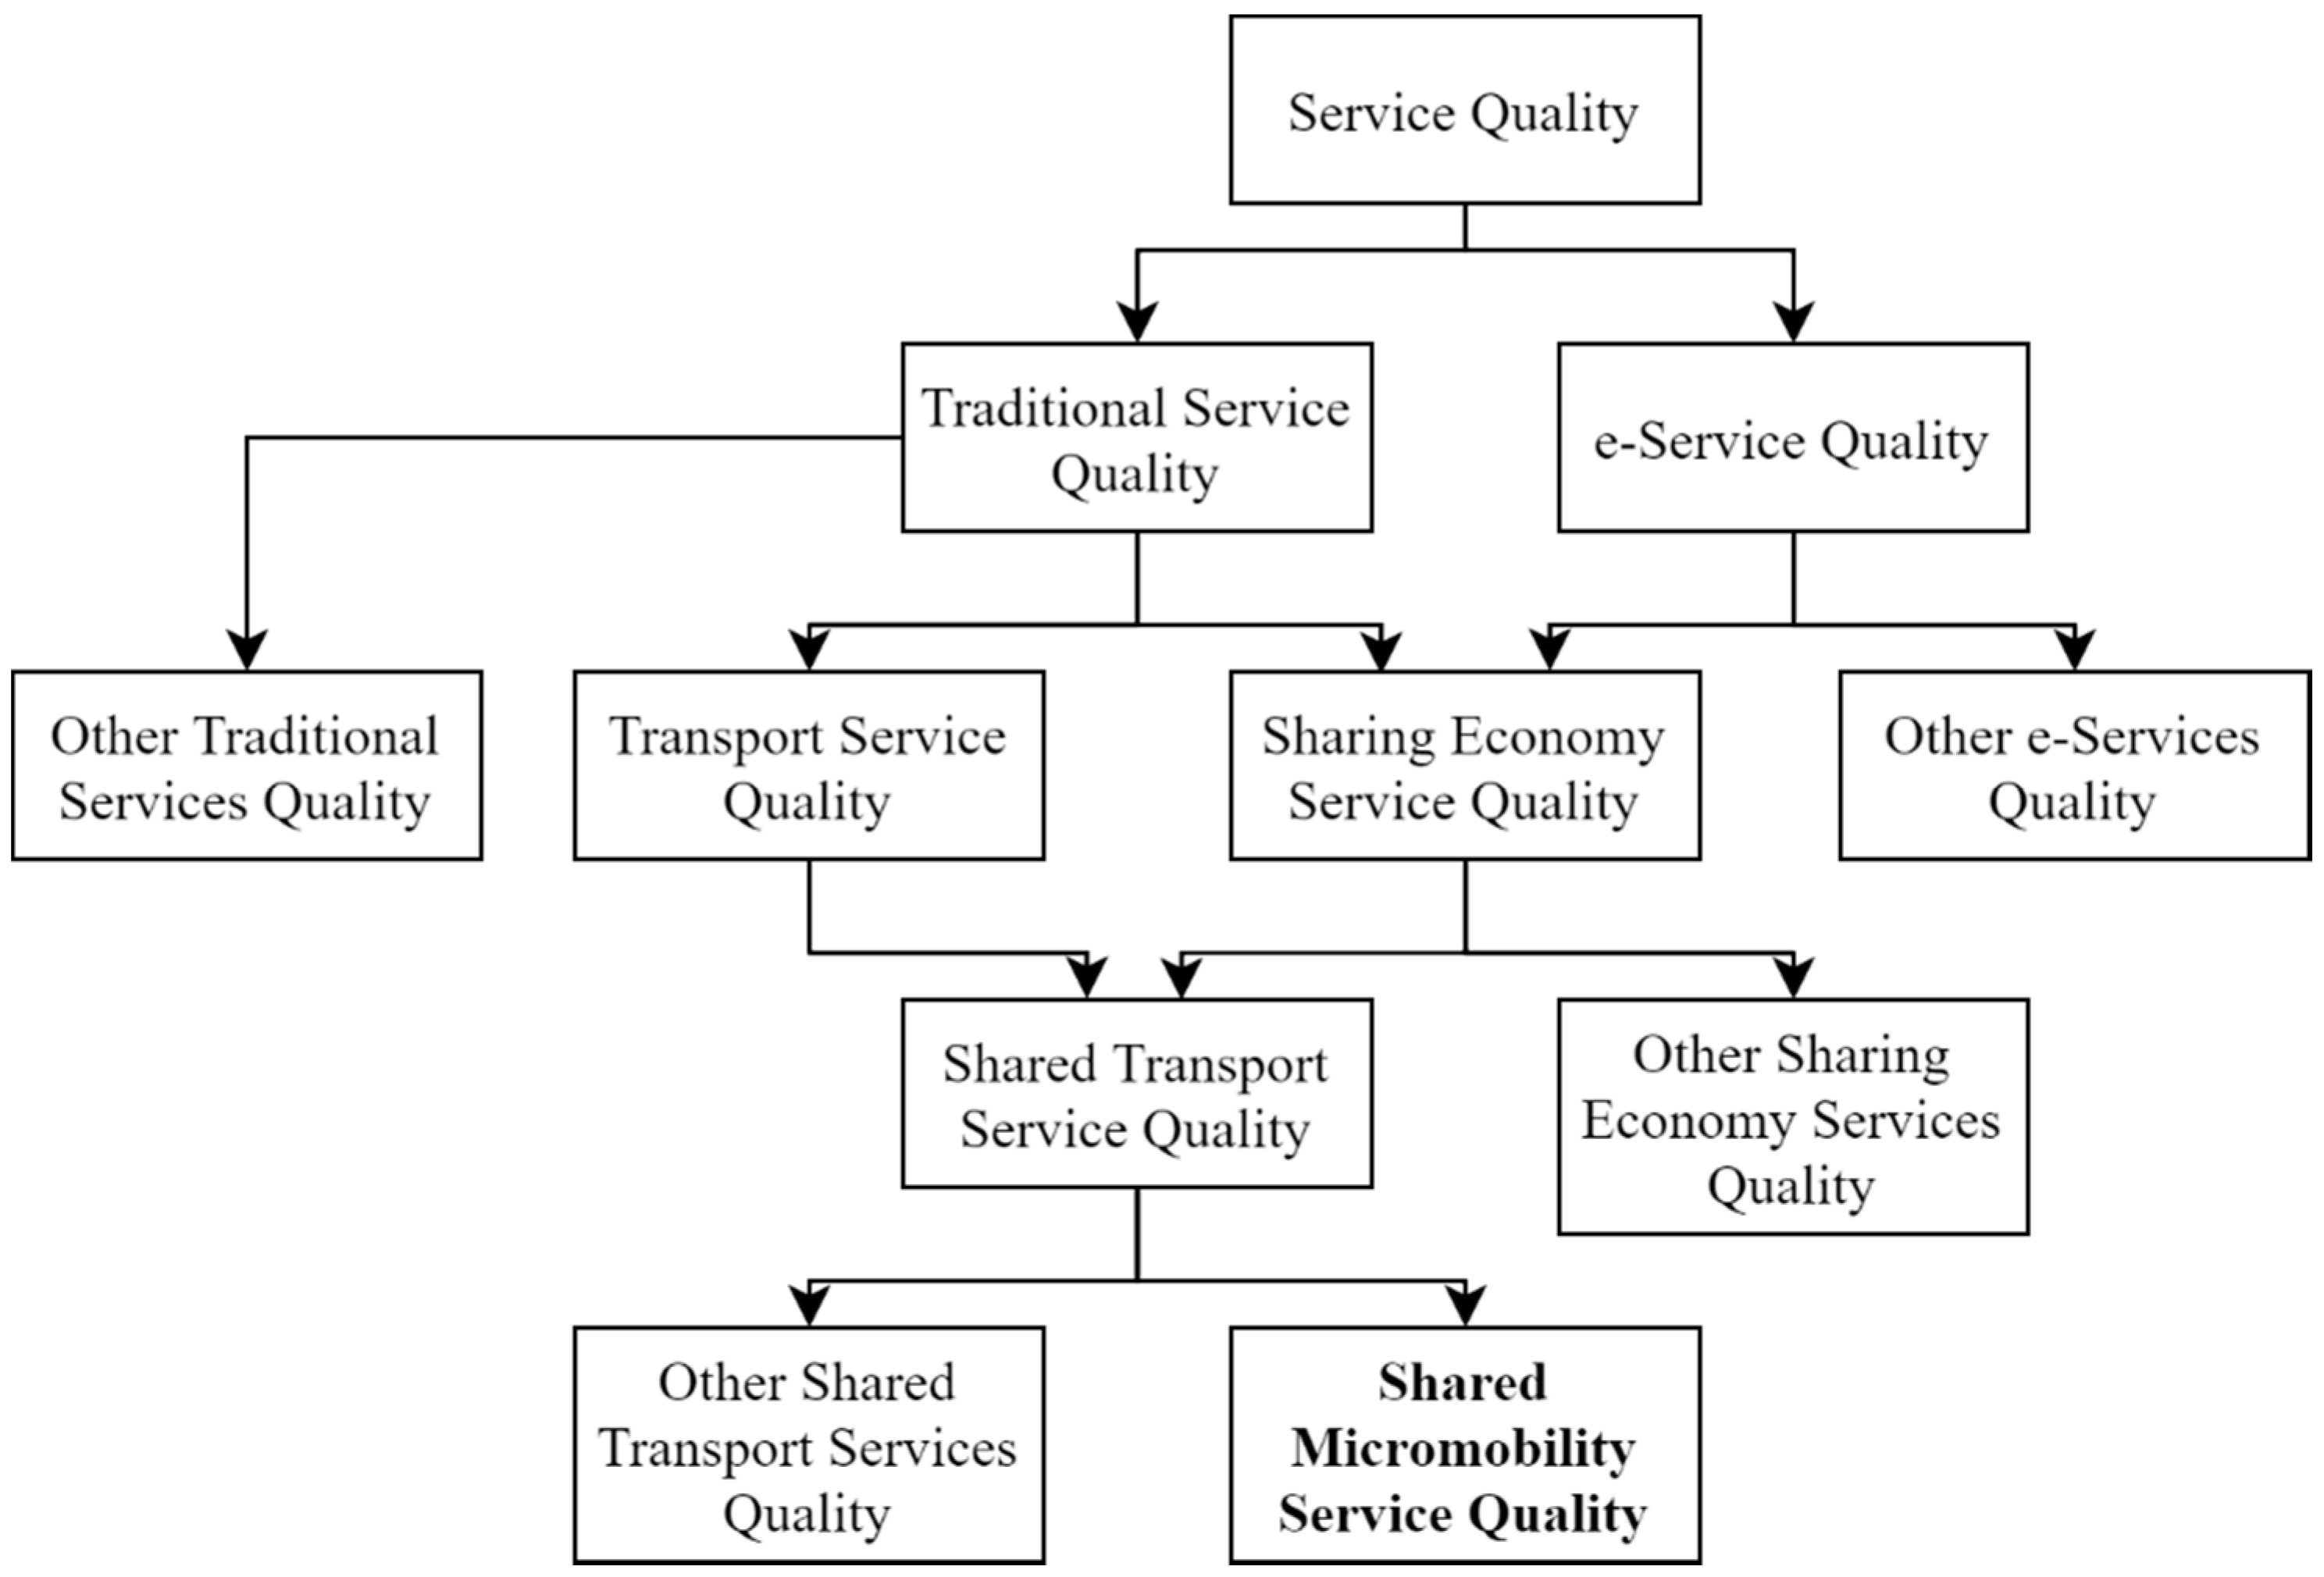
Figure 2.
Stages of creating and verification of the MMQUAL model.
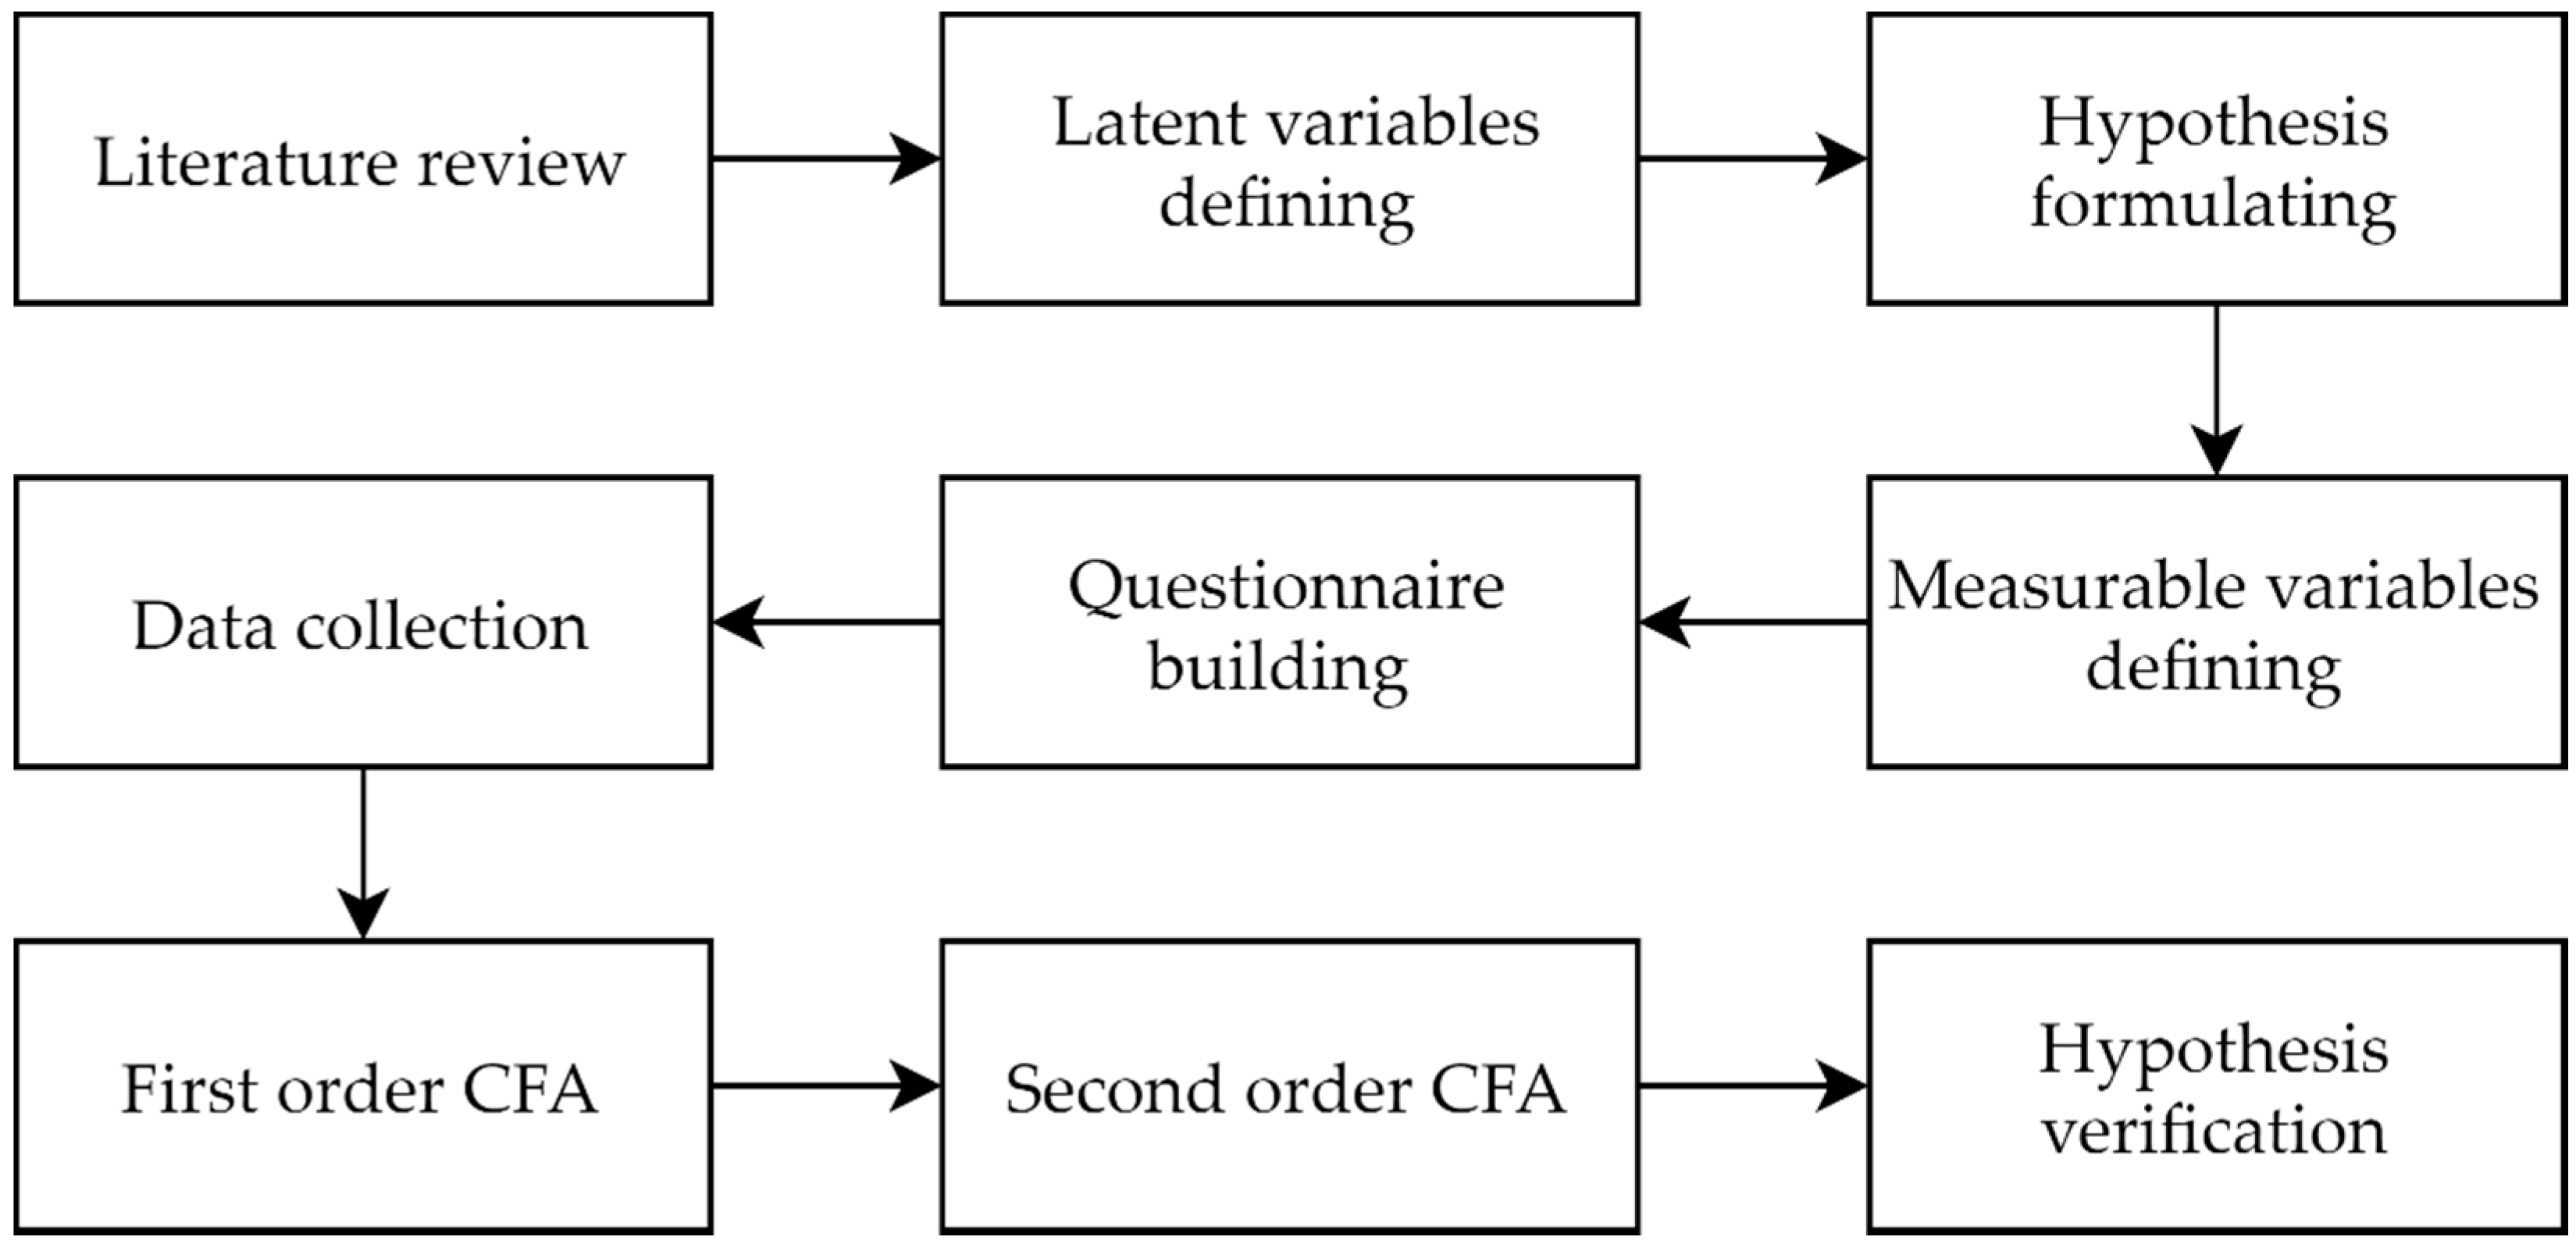
Figure 3.
Research procedure.
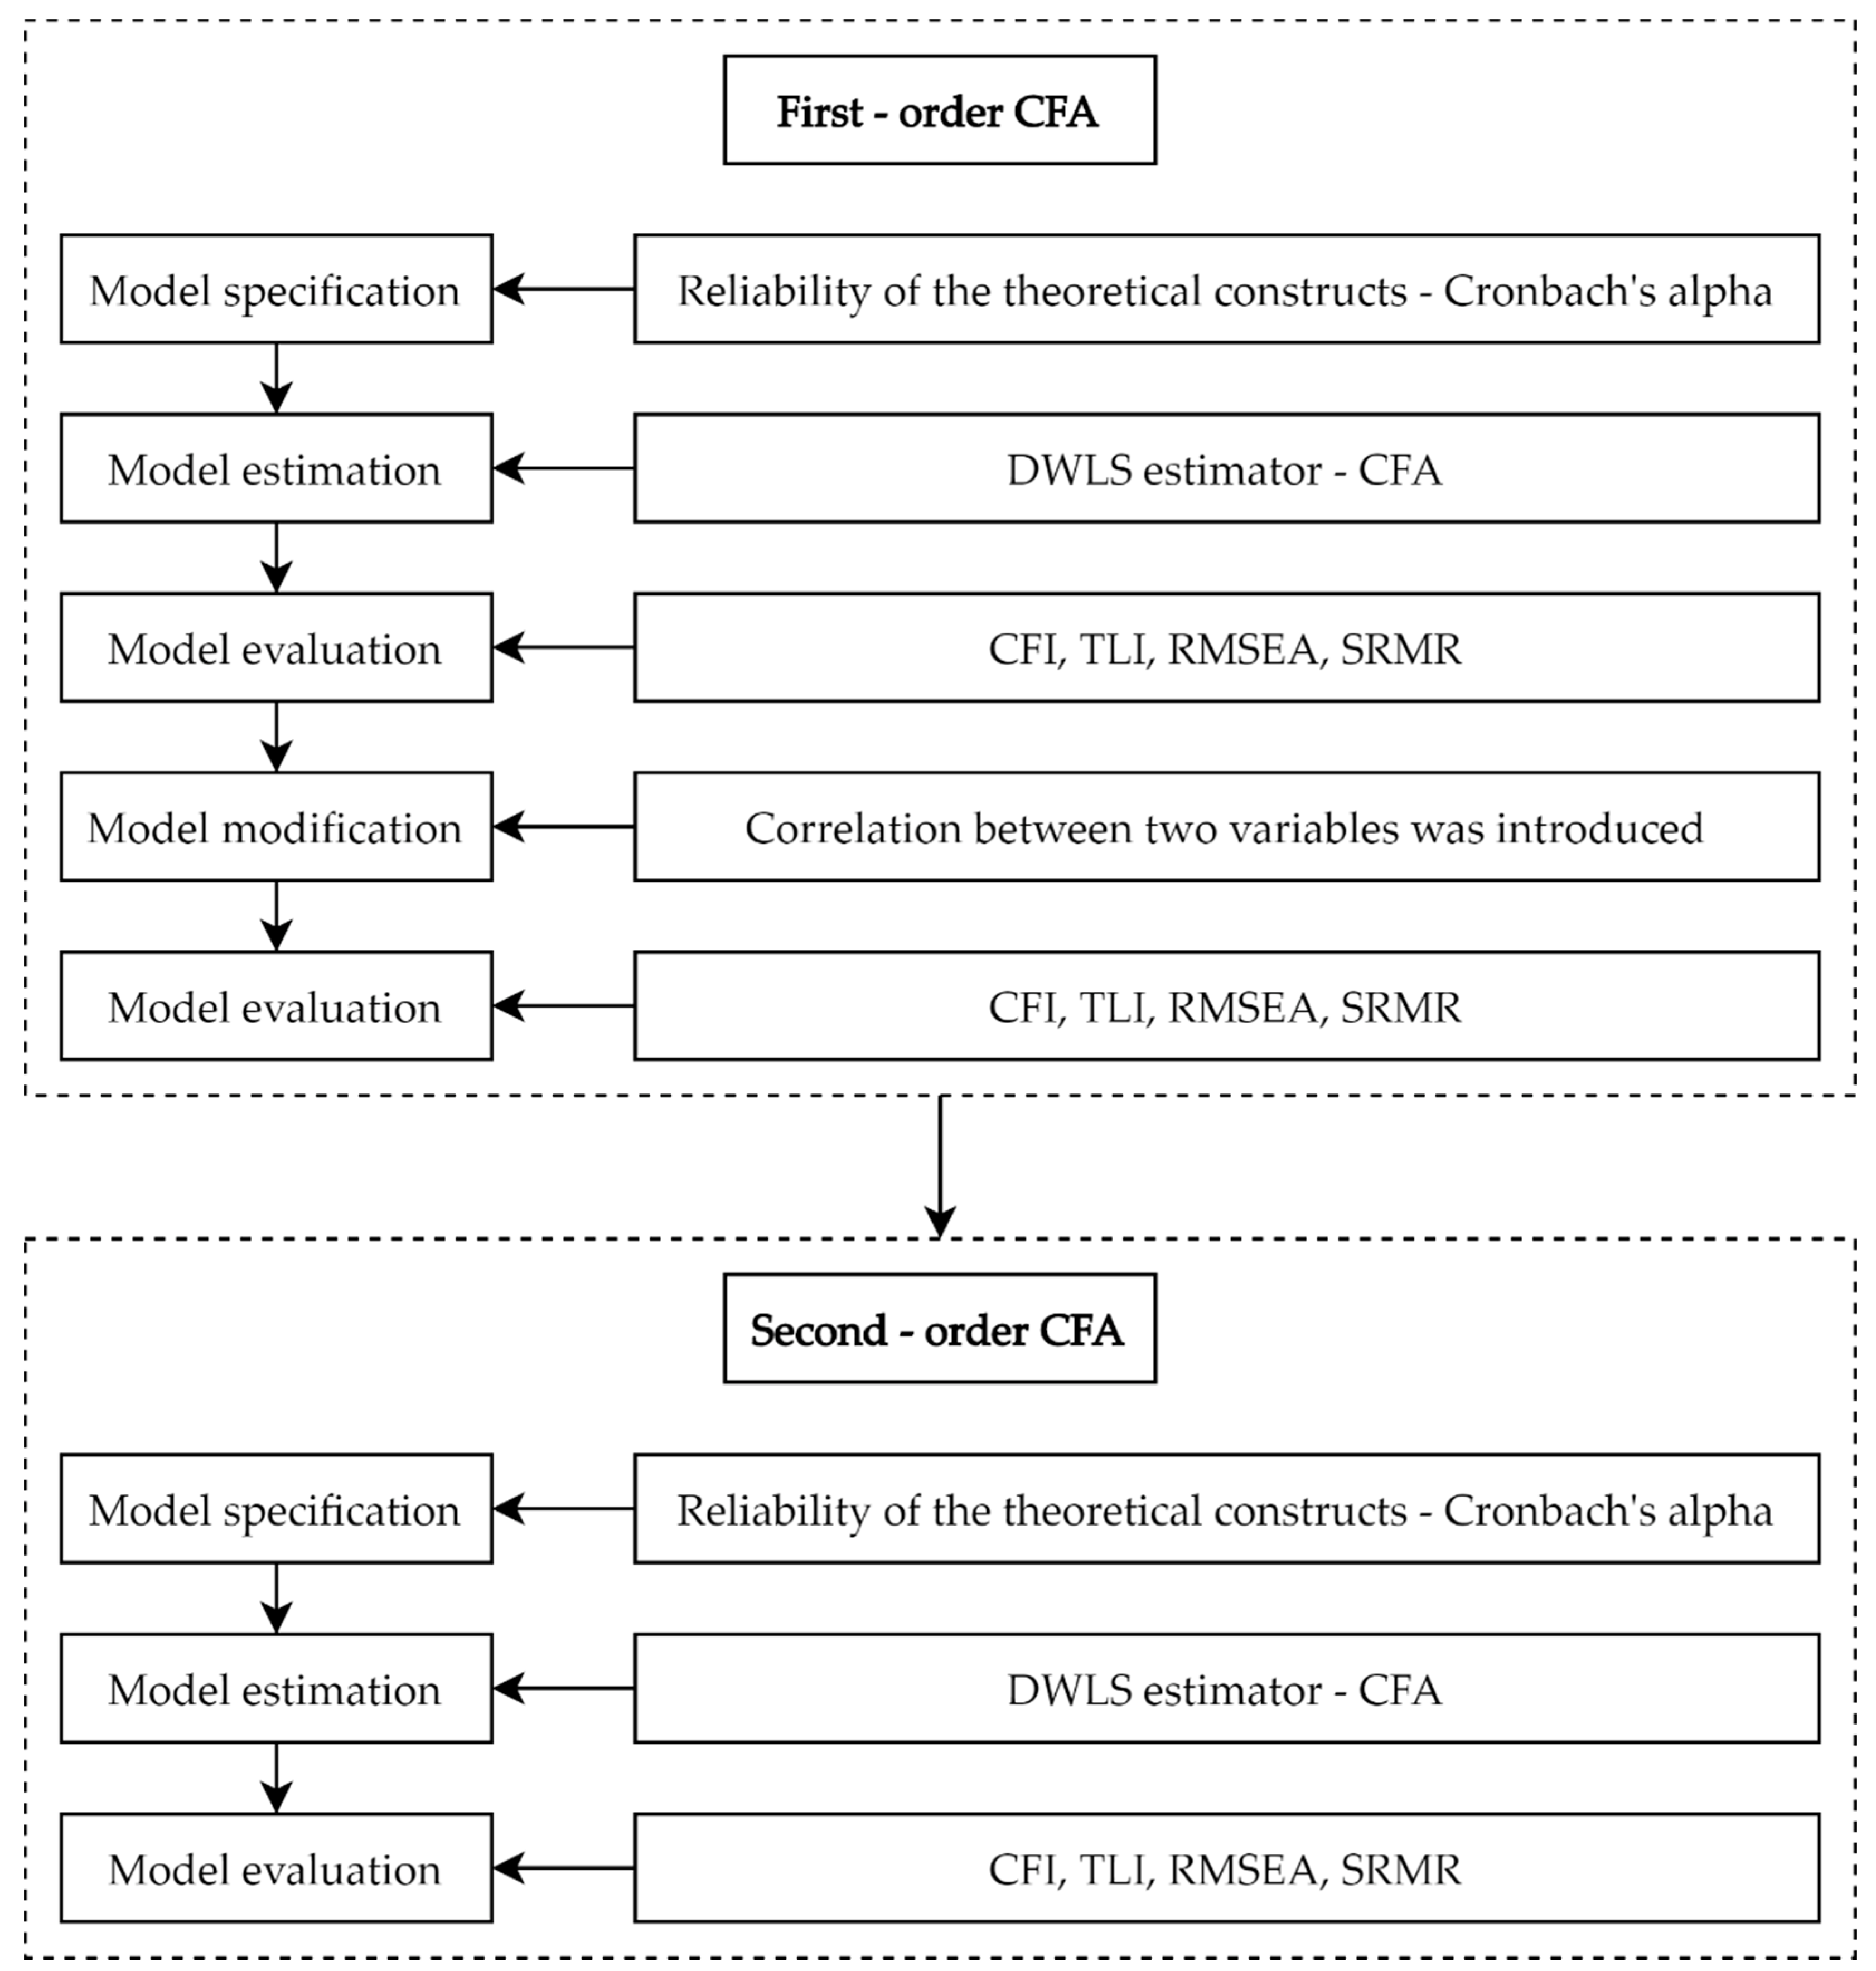
Figure 4.
MMQUAL model (first-order confirmatory factor analysis).
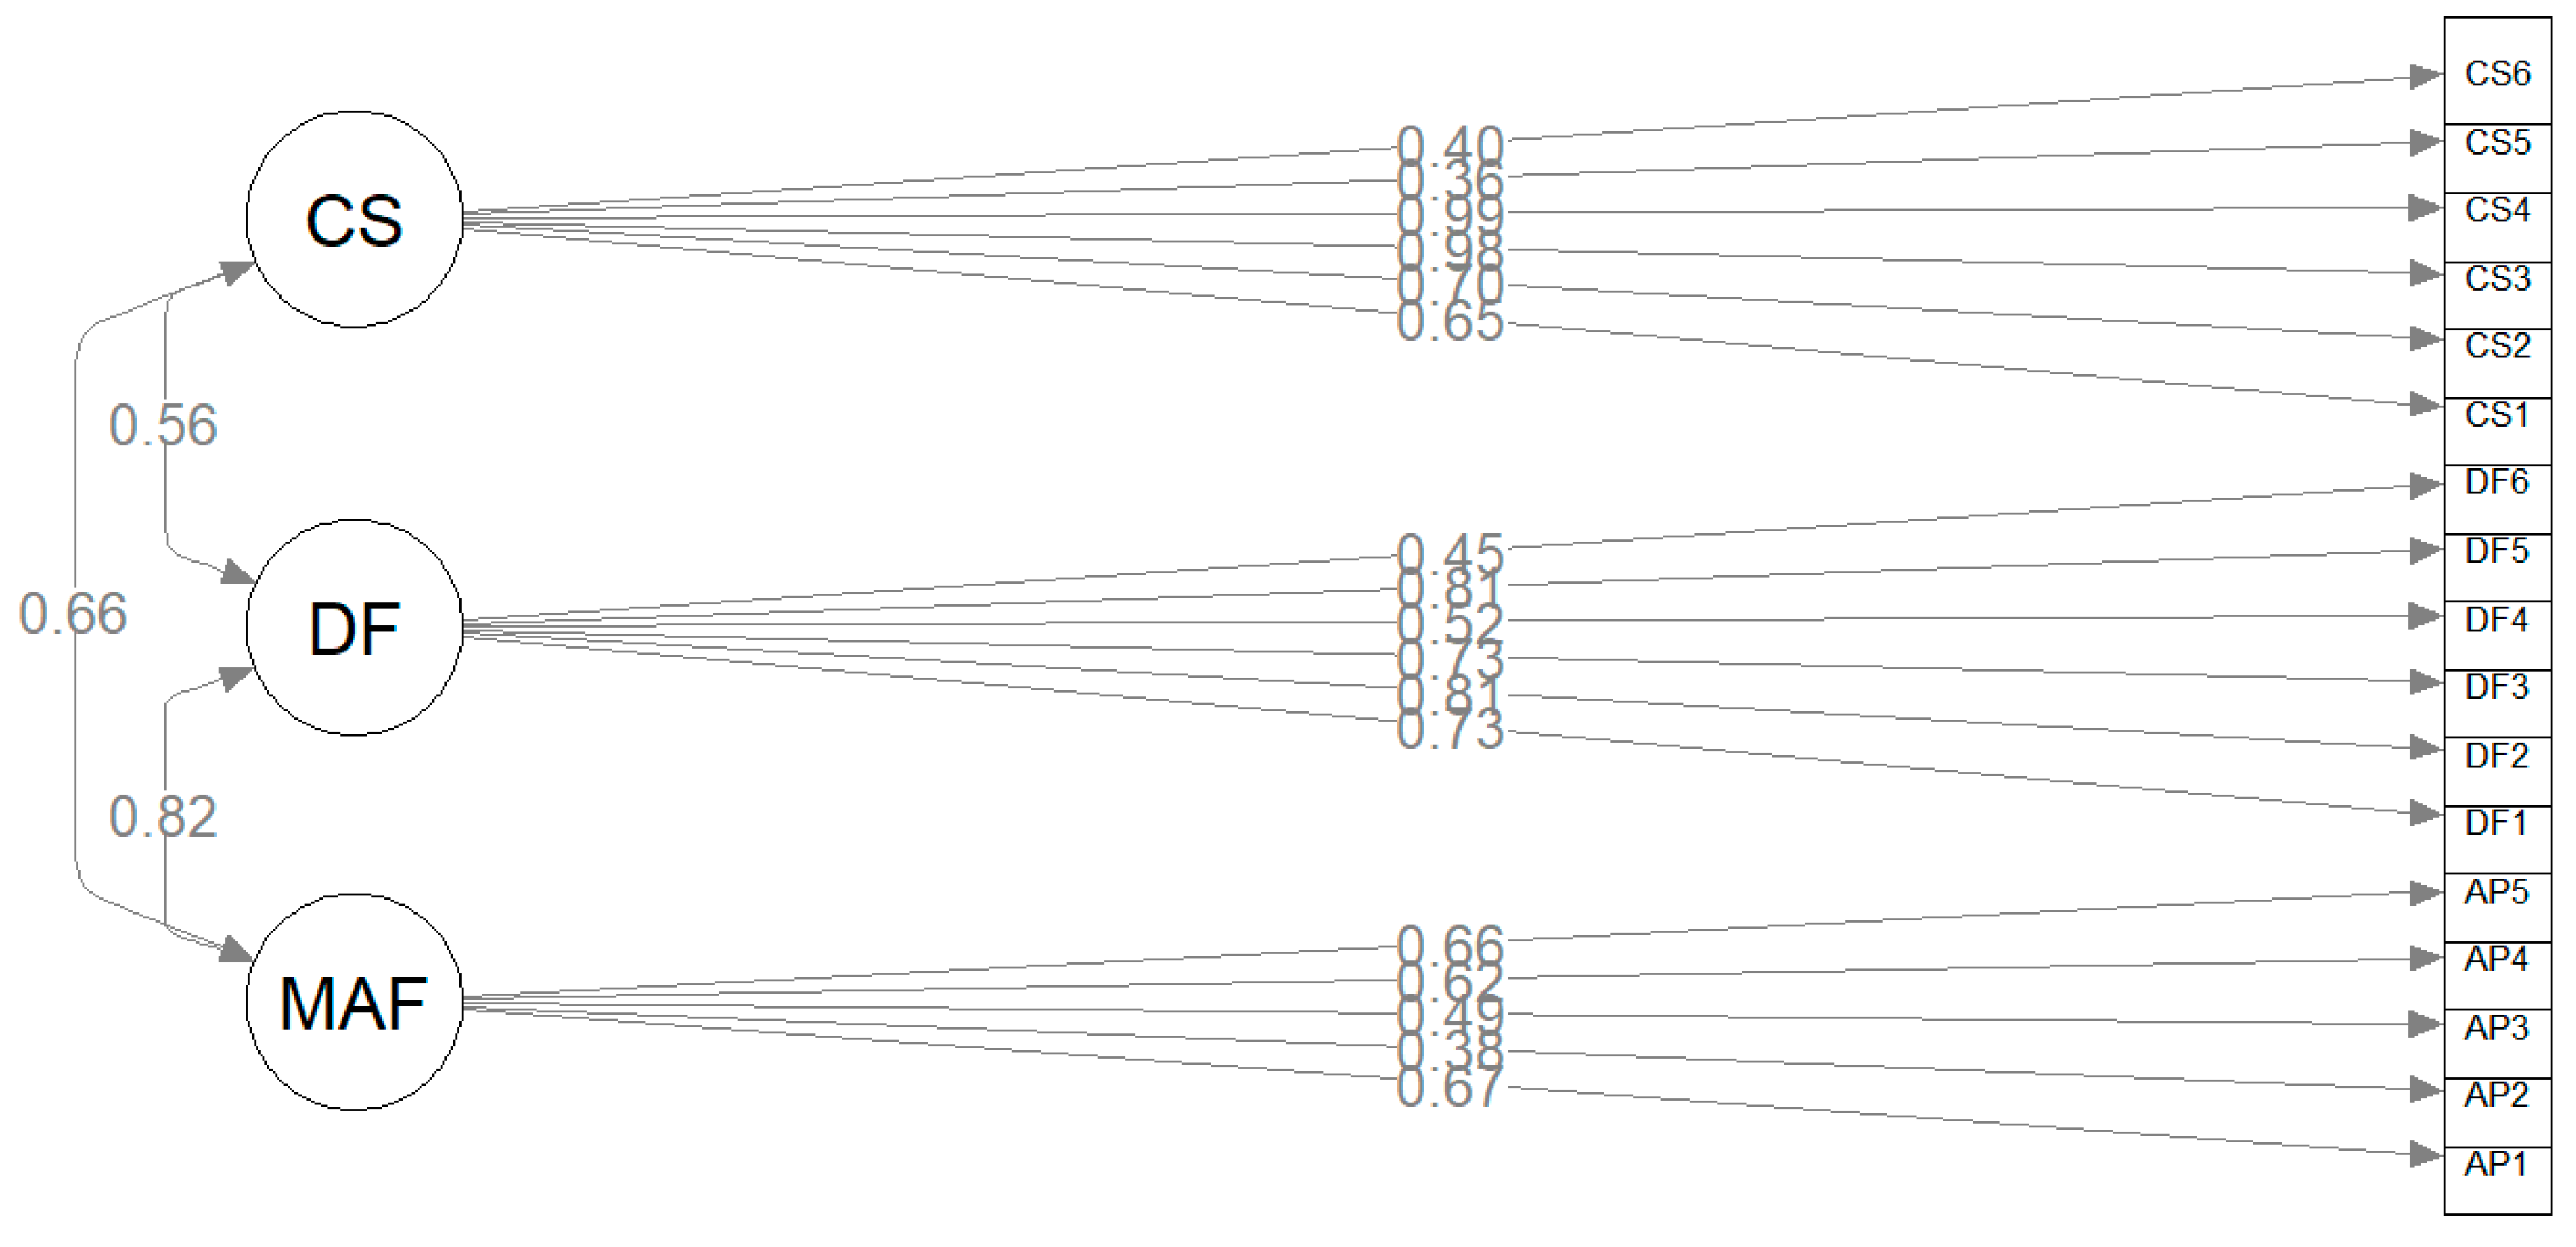
Figure 5.
First-order confirmatory factor analysis—MMQUAL model after modification.

Figure 6.
Model MMQUAL (second-order confirmatory factor analysis).
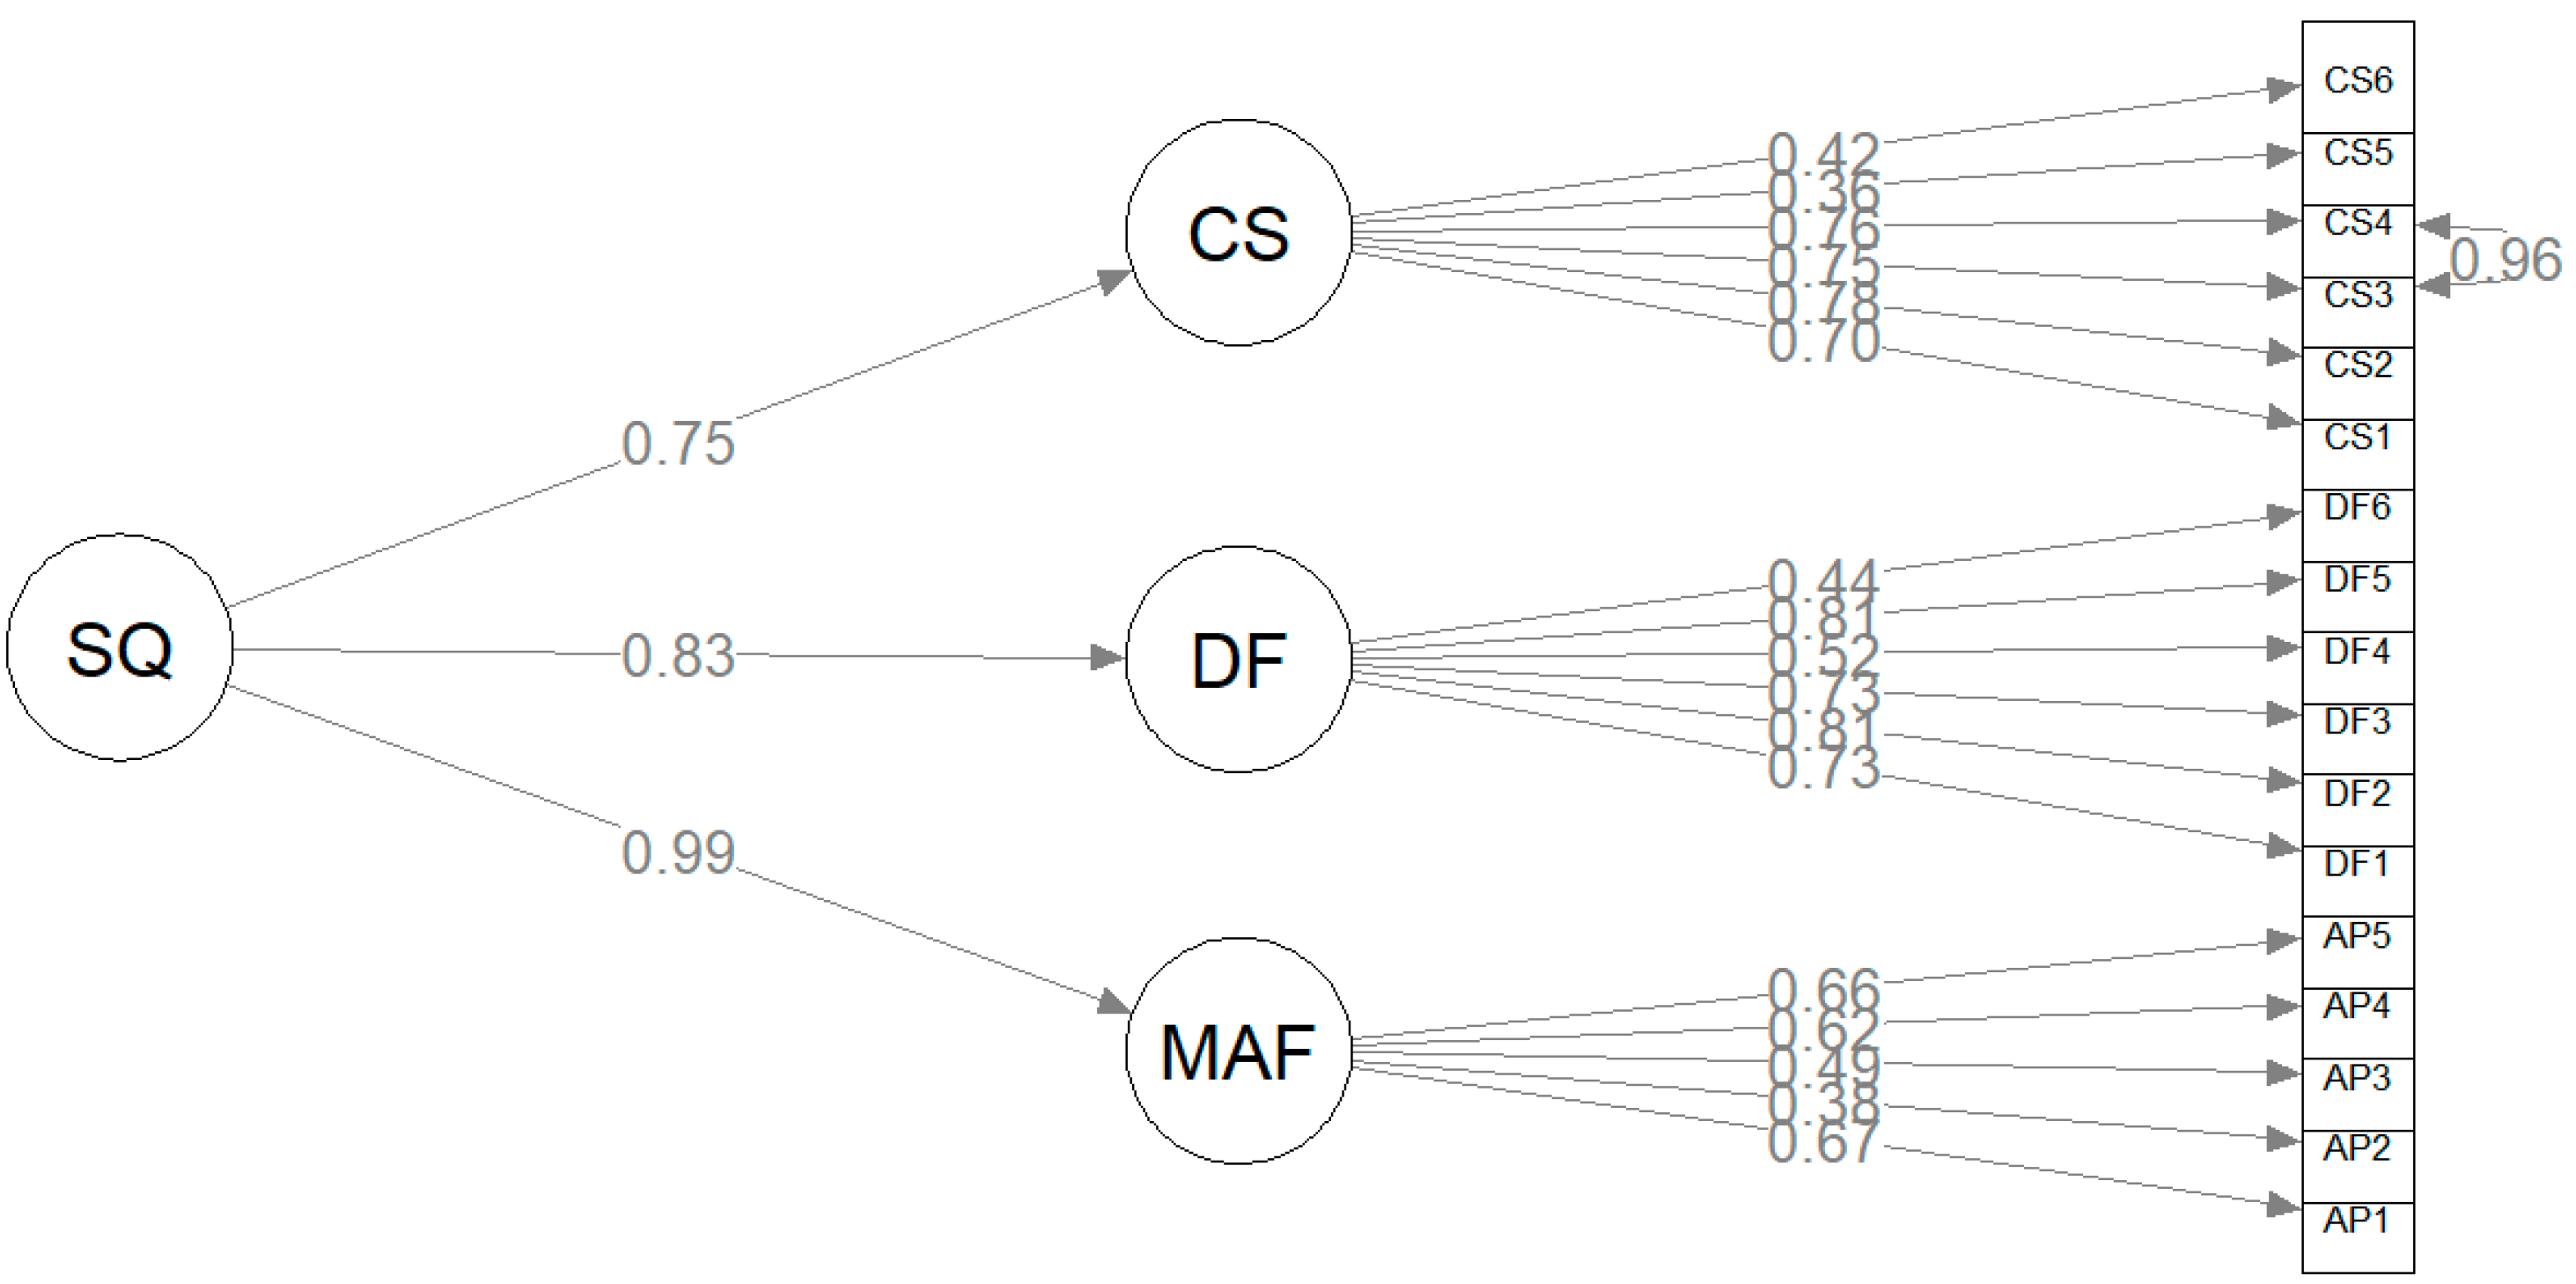
Table 2.
Latent and observable variables.
| Latent Variable | Measurement Variables (Observable) |
|---|---|
| Mobile application functions—MAF | Intuitive application interface—AP1 User can register an opinion about the used e-scooter—AP2 User can order/reserve the device in the application—AP3 Battery level compatible with the application—AP4 Fees charged in accordance with the tariff and time—AP5 |
| Device features—DF | Clean and aesthetic appearance—DF1 Ease and convenience of use—DF2 Adequate technical condition—DF3 Charge level of the e-scooter is sufficient for a minimum one hour ride—DF4 Security—DF5 Speed minimum 25 km per hour—DF6 |
| Customer service—CS | Easy access to technical service points—CS1 Access to a hotline—CS2 Helpful and patient staff—CS3 Staff with expert knowledge—CS4 Loyalty programmes (discounts)—CS5 Parking in designated zones—CS6 |
Table 3.
Demographic structure of the respondents.
| Demographic Variable | Category | Quantity | Percent |
|---|---|---|---|
| Gender | Males | 303 | 52% |
| Females | 281 | 48% | |
| Age | Below 18 | 17 | 3% |
| 18–30 | 544 | 93% | |
| Above 30 | 23 | 4% | |
| Education | Primary | 6 | 1% |
| Secondary | 397 | 68% | |
| Tertiary | 181 | 31% |
Publisher’s Note: MDPI stays neutral with regard to jurisdictional claims in published maps and institutional affiliations. |
© 2022 by the authors. Licensee MDPI, Basel, Switzerland. This article is an open access article distributed under the terms and conditions of the Creative Commons Attribution (CC BY) license (https://creativecommons.org/licenses/by/4.0/).
Share and Cite
MDPI and ACS Style
Hamerska, M.; Ziółko, M.; Stawiarski, P. A Sustainable Transport System—The MMQUAL Model of Shared Micromobility Service Quality Assessment. Sustainability 2022, 14, 4168. https://doi.org/10.3390/su14074168
AMA Style
Hamerska M, Ziółko M, Stawiarski P. A Sustainable Transport System—The MMQUAL Model of Shared Micromobility Service Quality Assessment. Sustainability. 2022; 14(7):4168. https://doi.org/10.3390/su14074168
Chicago/Turabian StyleHamerska, Monika, Monika Ziółko, and Patryk Stawiarski. 2022. "A Sustainable Transport System—The MMQUAL Model of Shared Micromobility Service Quality Assessment" Sustainability 14, no. 7: 4168. https://doi.org/10.3390/su14074168
Note that from the first issue of 2016, this journal uses article numbers instead of page numbers. See further details here.