
Struvite Production from Dairy Processing Waste
by
 , , and
Shane McIntosh
*,
Louise Hunt
,
Emma Thompson Brewster
,
Andrew Rose
,
Aaron Thornton
and
Dirk Erler
Faculty of Science and Engineering, Southern Cross University, Lismore, NSW 2480, Australia
*
Author to whom correspondence should be addressed.
Sustainability 2022, 14(23), 15807; https://doi.org/10.3390/su142315807
Submission received: 14 October 2022
/
Revised: 21 November 2022
/
Accepted: 23 November 2022
/
Published: 28 November 2022
(This article belongs to the Special Issue Sludge: A Renewable Source for Energy and Resources Recovery)
Abstract
:Food security depends on sustainable phosphorus (P) fertilisers, which at present are mostly supplied from a finite rock phosphate source. Phosphate (PO43−) and ammonium (NH4+) in dairy processing wastewater can be recovered as struvite (Mg + NH4+ + PO43− 6H20), a nutrient rich mineral for fertiliser application. The objectives of this study were to (1) quantify the effects of, pH, temperature and Mg: PO43− dosing rates on nutrient (PO43− and NH4+) removal and struvite precipitation from post anaerobic digested dairy processing wastewater, and (2) co-blend different dairy processing wastewaters to improve the reactant stoichiometry of NH4+ and PO43− for optimal struvite recovery and NH4+ removal. Phosphate removal (>90%) and struvite production (>60%) was achieved across a range of synthesis conditions, and was significantly impacted by pH as determined by response surface modelling. A combination of disproportionate molar ratios of PO43− and NH4+, presence of calcium and the apparent mineralisation of organic N, resulted in co-precipitation of hydroxyapatite and elevated levels of residual aqueous NH4+. In the second phase of this study, struvite was successfully precipitated and NH4+ removal was improved (~17%) however, higher concentrations of calcium in the wastewater blends resulted in greater hydroxyapatite co-precipitation (up to 30%). While struvite was the desired product in this study the formation of multiple heterogenous P-rich products (struvite and hydroxyapatite) has the potential to improve P recovery from dairy processing wastewaters and produce a fertiliser blend with amenity and value in agricultural systems.
1. Introduction
Phosphorus (P) is an essential plant nutrient and a fundamental fertiliser component for modern day agriculture, and is thus essential for global food security [1]. Currently P is predominantly mined from non-renewable sources such as phosphate rock (PR) and guano deposits, at increasing rates as the global population and the global ‘appetite’ grows [2]. The present use of PR is inefficient with research estimating only 22% of extracted PR supporting food and fibre production, with the balance inadvertently ending up in the environment [3]. In addition, with about 90% of the mined PR extracted from a mere 5 countries, world-wide P access is susceptible to costly and complex multinational supply chains [4,5]. Here, we test the hypothesis that dairy processing wastewaters can be a source of P through the precipitation of the mineral struvite (MgNH4PO4∙6H2O). In addition to P extraction, struvite also contains nitrogen, another important plant nutrient. To date, the potential for dairy processing effluent to be a source of struvite, and the conditions that would maximise precipitation, have not been sufficiently addressed in the literature.
There are well founded predictions that the present supply of PR may peak as soon as 2033, after which the availability of PR will decline [5,6]. Actions to minimise PR dependence, optimise plant uptake of P plus retention and recovery of P within food production systems are essential in the long term to ensure sustainable food security [7]. As such, recovery of P has been the subject of much scientific research in recent years, and there have been concerted efforts to develop technologies that close the ‘P-loop’ by recycling P from waste nutrients from a variety of sources, to sustain agriculture and protect future food security [8].
The predominant input of P originates from commercial fertilisers, which is subsequently dispersed from within agricultural and food production systems to become available for recovery from multiple differing sources ranging from agricultural, industrial and municipal solid and liquid wastes [9]. As such a variety of approaches are necessary to recover the P from these sources to ensure optimal conservation and recovery of P [7,10]. This research focusses on recovery of P from wastewater generated in the dairy processing industry.
Dairy processing produces effluent that is rich in P. For example, in an Australian analysis of potential industry sources for nutrient recovery as fertiliser, dairy processing wastewater contained the highest quantities of P (over 2000 µmol/L) [9]. One of the most common treatment technologies used for dairy processing wastewater is anaerobic digestion (AD). While well suited to the high organic loads, AD focuses on the reduction of organic carbon rather than P removal. As such, AD liquor is commonly fed into aerated biological treatment systems to remove N and P as bacterial biomass [11,12,13]. This biomass is collected and returned to the AD system or removed and disposed of in landfill. In any case there is no recapture of the P from the original wastewater.
One technique suited for P recovery is the precipitation of struvite. Struvite is a crystal formed by the reaction between Mg, NH4+, PO43− and water. Struvite has long been considered a problem in wastewater treatment plants as it can form spontaneously inside pipes causing fouling or blockages. However, struvite has value by recovering both P and N from wastewater to form a nutrient dense slow release fertiliser [14,15,16].
Struvite precipitation has been trialled from a range of animal (swine, cattle and poultry) and human excreta wastes, mainly in the form of post AD sludges and effluents. For the most part these studies reported successful struvite precipitation accompanied by high removal rates of PO43− (70–100%) and NH4+ (65–90%) [17,18,19,20,21,22]. However, beyond the livestock primary production, wastes from industries such as abattoirs and dairy processing plants have rarely been assessed for their struvite production potential [23]. To date there is only one published study demonstrating removal of PO43− (79.3%) and NH4+ (88.4%) by struvite precipitation from dairy processing wastewater [24]. This study narrowly focused on the performance of struvite as a fertiliser rather than an assessment of the conditions that optimised struvite formation, nor was there any consideration of the potential formation of other minerals resulting from the high concentrations of Ca and Mg in dairy processing effluent [25].
In this study, we aimed to determine the potential struvite production from dairy processing wastewater. In the first phase of the work response surface models, incorporating variables of temperature (10, 20, 30 and 40 °C), pH (7, 8, 9 and10) and Mg: PO43− dosing ratios (0:1, 0.5:1, 1:1, 1.5:1, 2:1, 10:1, 20:1, 30:1 and 40:1), were used to identify the significance of each parameter and define the optimum synthesis parameters to maximise PO43− removal and recovery of struvite from a post anaerobically digested dairy processing wastewater. In the second phase, different dairy processing wastewaters were co-blended to improve reactant stoichiometry of NH4+ and PO43− for optimal struvite recovery and NH4+ removal. The nature of the P containing precipitates from both phases were further characterised using X-ray diffraction (XRD), scanning electron microscopy (SEM) and Energy Dispersive X-ray Spectroscopy (EDS).
2. Methods
2.1. Materials
Struvite precipitation was assessed on three representative wastewaters collected from two local dairy processors (Richmond Dairies, Casino Australia and Norco Co-Operative Limited, Lismore, NSW, Australia) including: (1) a post anaerobic digester wastewater (AD) recovered from separation of post AD digestate slurries, supplied by Richmond Dairies, (2) an untreated wastewater high in suspended solids (HL) from Norco and (3) an untreated wastewater lower in suspended solids (AT) also from Norco. HL and AT are separated into distinct waste processing fraction at the processing plant based on turbidity. Characterization of process wastewaters are presented in Table 1. All samples were kept at 4 °C. To reduce the level of clumped suspended solids all wastewaters were allowed to settle at 4 °C for 48 h prior to decanting off the wastewaters. For elemental analysis, wastewater subsamples were air-dried at 40 °C for 72 h and recovered solids were ground with a mortar and pestle. Milled material was stored at room temperature in airtight containers. All chemicals including acid, bases, salts and analytical standards were of reagent grade or higher and purchased from Sigma Chemical Co. (St. Louis, MO, USA).
2.2. Struvite Precipitation
Struvite precipitations were evaluated using a range of different synthesis conditions by varying temperature, pH and Mg: PO43− ratios. The Mg dosing ratio was calculated relative to the total P content of wastewaters on a mol/mol basis and was added in the form of a 1 M MgCl2 solution. Typically, each treatment was conducted separately by firstly taking 1 L wastewater subsamples and adjusting the pH with 1 M NaOH to reach desired final pH. A magnetic stirrer was used to keep the sample mixed during the pH adjustment. Following pH adjustment, subsamples (50 mL) were dosed with 1 M MgCl2 and placed into a shaker (400 rpm) temperature-controlled incubator for 1 h. Samples were centrifuged (1000 rpm/30 min), and supernatant decanted for further analysis. Solids remaining were dried at 40 °C for 24 h prior to analysis.
In the first set of Struvite precipitation optimisation experiments, AD wastewaters were subjected to precipitation under different combinations of temperature, pH and Mg dosing ratios. The range of each variable was based on those reported in the literature and on preliminary single factor experiments. Temperature and pH were tested at 4 levels (10, 20, 30 and 40 °C and 7, 8, 9, 10, respectively), and MgCl2: PO43− dose ratio at 9 levels (0, 0.5, 1, 1.5, 2, 10, 20, 30 and 40), where a combination pH of 7 and dose ratio of 0 represents the AD wastewater as received with no adjustments. 144 full factorial experimental runs were performed. Each replicated twice, allowed 288 measured responses corresponding to the aqueous phase PO43− and NH4+ percentage reduction. The full range of experimental conditions and aqueous phase PO43− reductions (%) appears in Supplementary Material Table S1.
In the second set of Struvite precipitations dairy processing wastewaters were blended in different combinations to achieve NH4+ and PO43− in concentrations conducive to enhance precipitation of Struvite (i.e., molar ration of 1:1). The three solution blends include (1) AD+HL, (2) AD+AT, and (3) AD+HL+AT. Mg was added to satisfy the molar ratio and supersaturation required to form Struvite as in Mg: PO43− was added at 2:1. The blending ratios and Mg addition appears in Supplementary Material Table S2. The concentrations of PO43−, NH4+ and Mg already in the solutions were considered in these calculations. All precipitation experiments were performed at 20 °C and pH10 which was identified within the optimal range of conditions for AD Struvite precipitation from AD wastewaters in phase 1.
2.3. Analytical Methods
Supernatants recovered following precipitations were analysed for PO43−, NH4+, Mg and Ca by flow injection analysis (FIA) and a LachatTM QuickChem 8500 four channel Flow Injection Analyser (HACH, Ames, IA, USA) according to APHA methods [26], whereas total N and P were measured as NO3− and PO43− after oxidation with K2S2O8. For analysis of precipitates by X-ray diffraction (XRD) and scanning electron microscopy SEM all solids were firstly powered in a mortar and pestle and bone dried at 50 °C for 24 h. All XRD analysis was performed on a Bruker D4 Endeavor X-ray Diffractometer (Billerica, MA, USA). Each sample ran for a 30 min analysis. Analysis of the diffractograms was performed using Bruker Diffrac (Bruker, MA, USA) evaluation program: identifying peaks, characterising material and generating a semi quantitative ratio (%) of characterised material. For SEM, the samples were coated in gold and analysed on a Zeiss Evo LS15 SEM (Zeiss, Oberkochen, Germany) under high vacuum and X-ray. For imaging the microscope settings included: probe (25 pA), the electron high tension (EHT) (8 kV) with the site imaging width set at 7.5 mm. For characterisation of mineral elements within the precipitates Energy Dispersive X-ray Spectroscopy (EDS) was performed. Carbon coated samples were analysed on a Zeiss Evo LS15 SEM with the following settings probe set at 1000 pA; EHT was set at 20 kV; 12 mm site imaging width and the resolution was set on the Optibeam setting (Zeiss, Oberkochen, Germany).
2.4. Process Optimisation and Statistical Analysis
In the first experimental phase we use PO43− removal as a proxy for struvite production and determine the best choice of factor levels to optimise PO43− removal from AD wastewater using a linear response surface model (RSM), fitted using linear regression in Excel (Microsoft Office 2019) through a mixed-mode ANOVA to identify significant factors and interaction effects between factors. For each factor and interaction effect the hypothesis is that the factor or interaction is significant to the model using a critical threshold of 5% for the p-value. The variables are denoted xT for temperature, xpH for pH, xR for the Mg: PO43− dose ratio and y for the percentage reduction in aqueous PO43−. The resulting model is shown in Equation (1).
Considering that pH was identified as the most significant parameter, a non-linear model was developed to explore the influence of this parameter in more detail. Equation (2), shown below, is a modification of Equation (1), where a new non-linear term is introduced as the square of pH.
In the second experimental phase using blended wastewaters the average removal efficiency of PO43− and NH4+, and changes in concentration, over the incubation period were statistically compared using a generalised linear model (univariate analysis) after data were screened for homogeneity of variances. Significant differences (at the 5% level) were further interrogated using least significant difference testing in (SPSS-27, https://www.ibm.com/products/spss-statistics, accessed on 2 October 2021).
3. Results
3.1. Optimisation of Struvite Recovery from AD Wastewaters
Characterisation of AD wastewaters showed that the bulk of the P was in the form of PO43− (83%) whereas NH4+ represented only 53% of the total N (Table 1). Both Ca and Mg were also found to be in AD wastewaters, along with other trace minerals. The molar ratio of PO43−: NH4+: Mg in the AD wastewater was 2.5:22.2:1 suggesting that some PO43− removal via struvite is possible without Mg addition. Moreover, the presence of Ca also suggests the formation of Ca-P minerals as a mode of action in P removal.
The PO43− removal from AD wastewater alone varied considerably across the 144 full factorial experimental data. The highest PO43− removal (>90%) occurred at lower temperature (10–20 °C), pH 10 with Mg: PO43− dosing ratios from 2–30:1 (Supplementary Material Table S1). Conversely, PO43− removal was low without Mg addition or when pH was neutral (7.0), and was typically less than about 22% and 55%, respectively. Operational response of PO43− removal (%) from AD wastewaters following precipitation as a function of temperature, Mg dosing ratio and pH variables, (as tabulated in Supplementary Material Table S1), were modelled according to a mixed-mode ANOVA as shown in Equation (1). The sequential removal of the most insignificant factors and interactions by removing the factor with the largest p-value each time, resulted in the final equation shown in Equation (3) (p-value results for each sequential regression available in Supplementary Material Table S3). The mean coefficient values and 95% confidence intervals for the optimised model shown in Table 2 illustrate that the factor most significant to the model is pH, followed by the interaction of pH and Mg dosing ratio, then temperature, then the interaction of temperature and pH.
Equation (3) and Table 2 illustrate the significant relationship between increasing pH and improved PO43− reduction and a small temperature effect. An additional small interaction effect between dosing ratio and pH is apparent where increasing both Mg dosing and pH slightly increased PO43− reduction.
To further explore the effect of pH, the non-linear model detailed in Equation (2) was used to fit four separate data sets with constant Mg dosing ratios 0, 2, 10 and 30:1 (see Supplementary Table S4). The goodness of fit represented by the R2 (also known as the coefficient of determination, where R2 = 1 represents a perfect fit) ranged between 0.77 to 0.91. The resulting RSM’s are shown in Figure 1. Based on the RSM the optimum conditions for PO43 removal is pH 10 with a Mg: PO43− dosing ratio of 2:1 at 10 °C. It is evident that Mg dosing ratios above 2 and temperature ranges between 10 and 20 °C had little effect on PO43− reduction.
Despite the almost complete removal of PO43− there was little effect on the overall NH4+ concentrations. In fact, under all experimental conditions tested, NH4+ concentrations increased (Figure 2). The increase in NH4+ levels above the starting concentration were lowest at 10 °C but were shown to nearly double (increasing to a height of 170 mg/L) at higher temperatures. Similar increases in NH4+ levels were observed between both pH 9 and 10. In contrast, following precipitation the aqueous Ca levels decreased across all synthesis conditions (maximum reduction observed was from 40 mg/L down to 6 mg/L), demonstrating a net removal of Ca. One exception was a slight increase in overall Ca at pH 9 at the 40:1 Mg dosing ratio. Given the disparities between PO43− and NH4+ removal, and the significant reduction in aqueous Ca, it suggests minerals other than struvite may be present in precipitates. XRD analysis of recovered precipitates (Supplementary Material Figure S5) confirmed an abundance of struvite along with other insoluble minerals (discussed further in Section 3.3).
3.2. Improved Struvite Recovery with Mixed Dairy Processing Wastewaters
Based on the Struvite process optimisation using AD wastewaters and the limitations observed for NH4+ removal, a second series of experiments were designed to improve struvite recovery whist also considering a commercial scale setting. Due to the excess molar ratio of NH4+: PO43− (8.8:1) in AD wastewaters alone, the inclusion of an additional source of PO43− would likely improve NH4+ removal and further maximise struvite formation. Two additional dairy processing wastewater streams (HL and AT) were identified to contain relatively low concentrations of NH4+ (approximately 305 and 45 µmol/L, respectively) and high concentrations of PO43− (approximately 2219 and 1411 µmol/L, respectively) were blended with AD to achieve a NH4+ and PO43− molar ration of 1:1. As shown in Figure 3a the highest PO43− removal of 77% was observed in the AD+HL blend, although, this is about 13% less than the maximum observed for AD wastewater alone in phase 1 trials. Both the AD + AT and AD + HL + AT had similar PO43 removal at around 57% and were both significantly (p < 0.05) lower then was achieved in the AD+HL blend. NH4+ removal occurred in all three blends at similar levels from 13.6 to 17.3%, with the highest recorded in the AD+HL blend. Given the differences in initial PO43− and NH4+ concentrations between the blends (Supplementary Material Table S2) the AD + HL showed significantly (p < 0.05) greater PO43− and NH4+ removal efficiencies at 1603 µmol/L and 303 µmol/L, respectively (Figure 3b).
3.3. Characterization of Precipitates by XRD and SEM Analysis
XRD diffractograms of the precipitates recorded in the range of 0 to 90° (2θ) reveals typical fingerprint peaks for struvite (Struvite mineral reference, RRUFF ID: R050540 [27]) (example diffractograms are shown in Supplementary Material Figure S5). It is noted that a slight shift in the peak positions in comparison to pure struvite samples is evident due to precipitates having a mixed mineral composition, however, key peaks at 2θ = 20, 25 and 40° confirms the crystalline structure of struvite. XRD analysis identified a number of additional dominate mineral species in the precipitates most notably hydroxyapatite (Ca5(PO4)3OH) and a mixture of calcites (mainly monohydro- and Mg- calcites) at varying proportions (Figure 4).
For AD wastewaters the maximum proportion of struvite (72.1%) was recorded at pH 9, Mg dosing ratio of 2:1. Similar high struvite compositions (~70%) was recorded at a Mg dosing ratio of 1:1. At pH 10 and Mg dosing rations of 1:1 and 2:1 the struvite composition in precipitates was about 10% lower (60–65%). Including hydroxyapatite, the total combined proportion of precipitated P-containing minerals increased around 13–15% giving totals of 87.4 and 77.2% at pH 9 and 10, respectively. In experiments where no additional Mg was added, struvite accounted for 21.1 and 33.2% of the precipitates at pH 9 and 10, respectively. Moreover, in the absence of Mg dosing, the proportion of hydroxyapatite and calcite formation in precipitates increased. The greatest composition of P-containing minerals was recovered from blending AD+HL wastewaters and contributed about 83% of the precipitate’s product distribution. Of this ~57% constituted struvite, while hydroxyapatite contributed between 17–23 % of the total P-containing minerals across all blends.
To further investigate the effects of synthesis condition (temperature, pH and Mg dosing) on P speciation in precipitates a multi-way ANOVA analysis was performed on the relative product distribution from AD precipitates using a significance threshold of 5%. The response variables included % distribution of struvite, Ca-P/hydroxyapatite and mixed calcites in precipitates. Each were evaluated individually for the factors of temperature, pH and MgCl2 dosing ratio. For struvite formation the significant factors are pH (p-value of 0.0067) and dosing ratio (p-value of 0.001). To increase percentage distribution of struvite in solids, the dosing ratio needs to be greater than 0, but little to no difference was observed at ratios > 2. For Ca-P/hydroxyapatite the only significant factor is MgCl2 dosing ratio (p-value of 0.0005), as in, hydroxyapatite formation was favoured in the absence of Mg dosing. For calcites the significant factors are pH (p-value of 0.0003) and dosing ratio (p-value of 0.0026). With increasing pH there appears to be a larger percentage of calcite formation. Temperature was not observed to influence the percentage distribution of the solid precipitates.
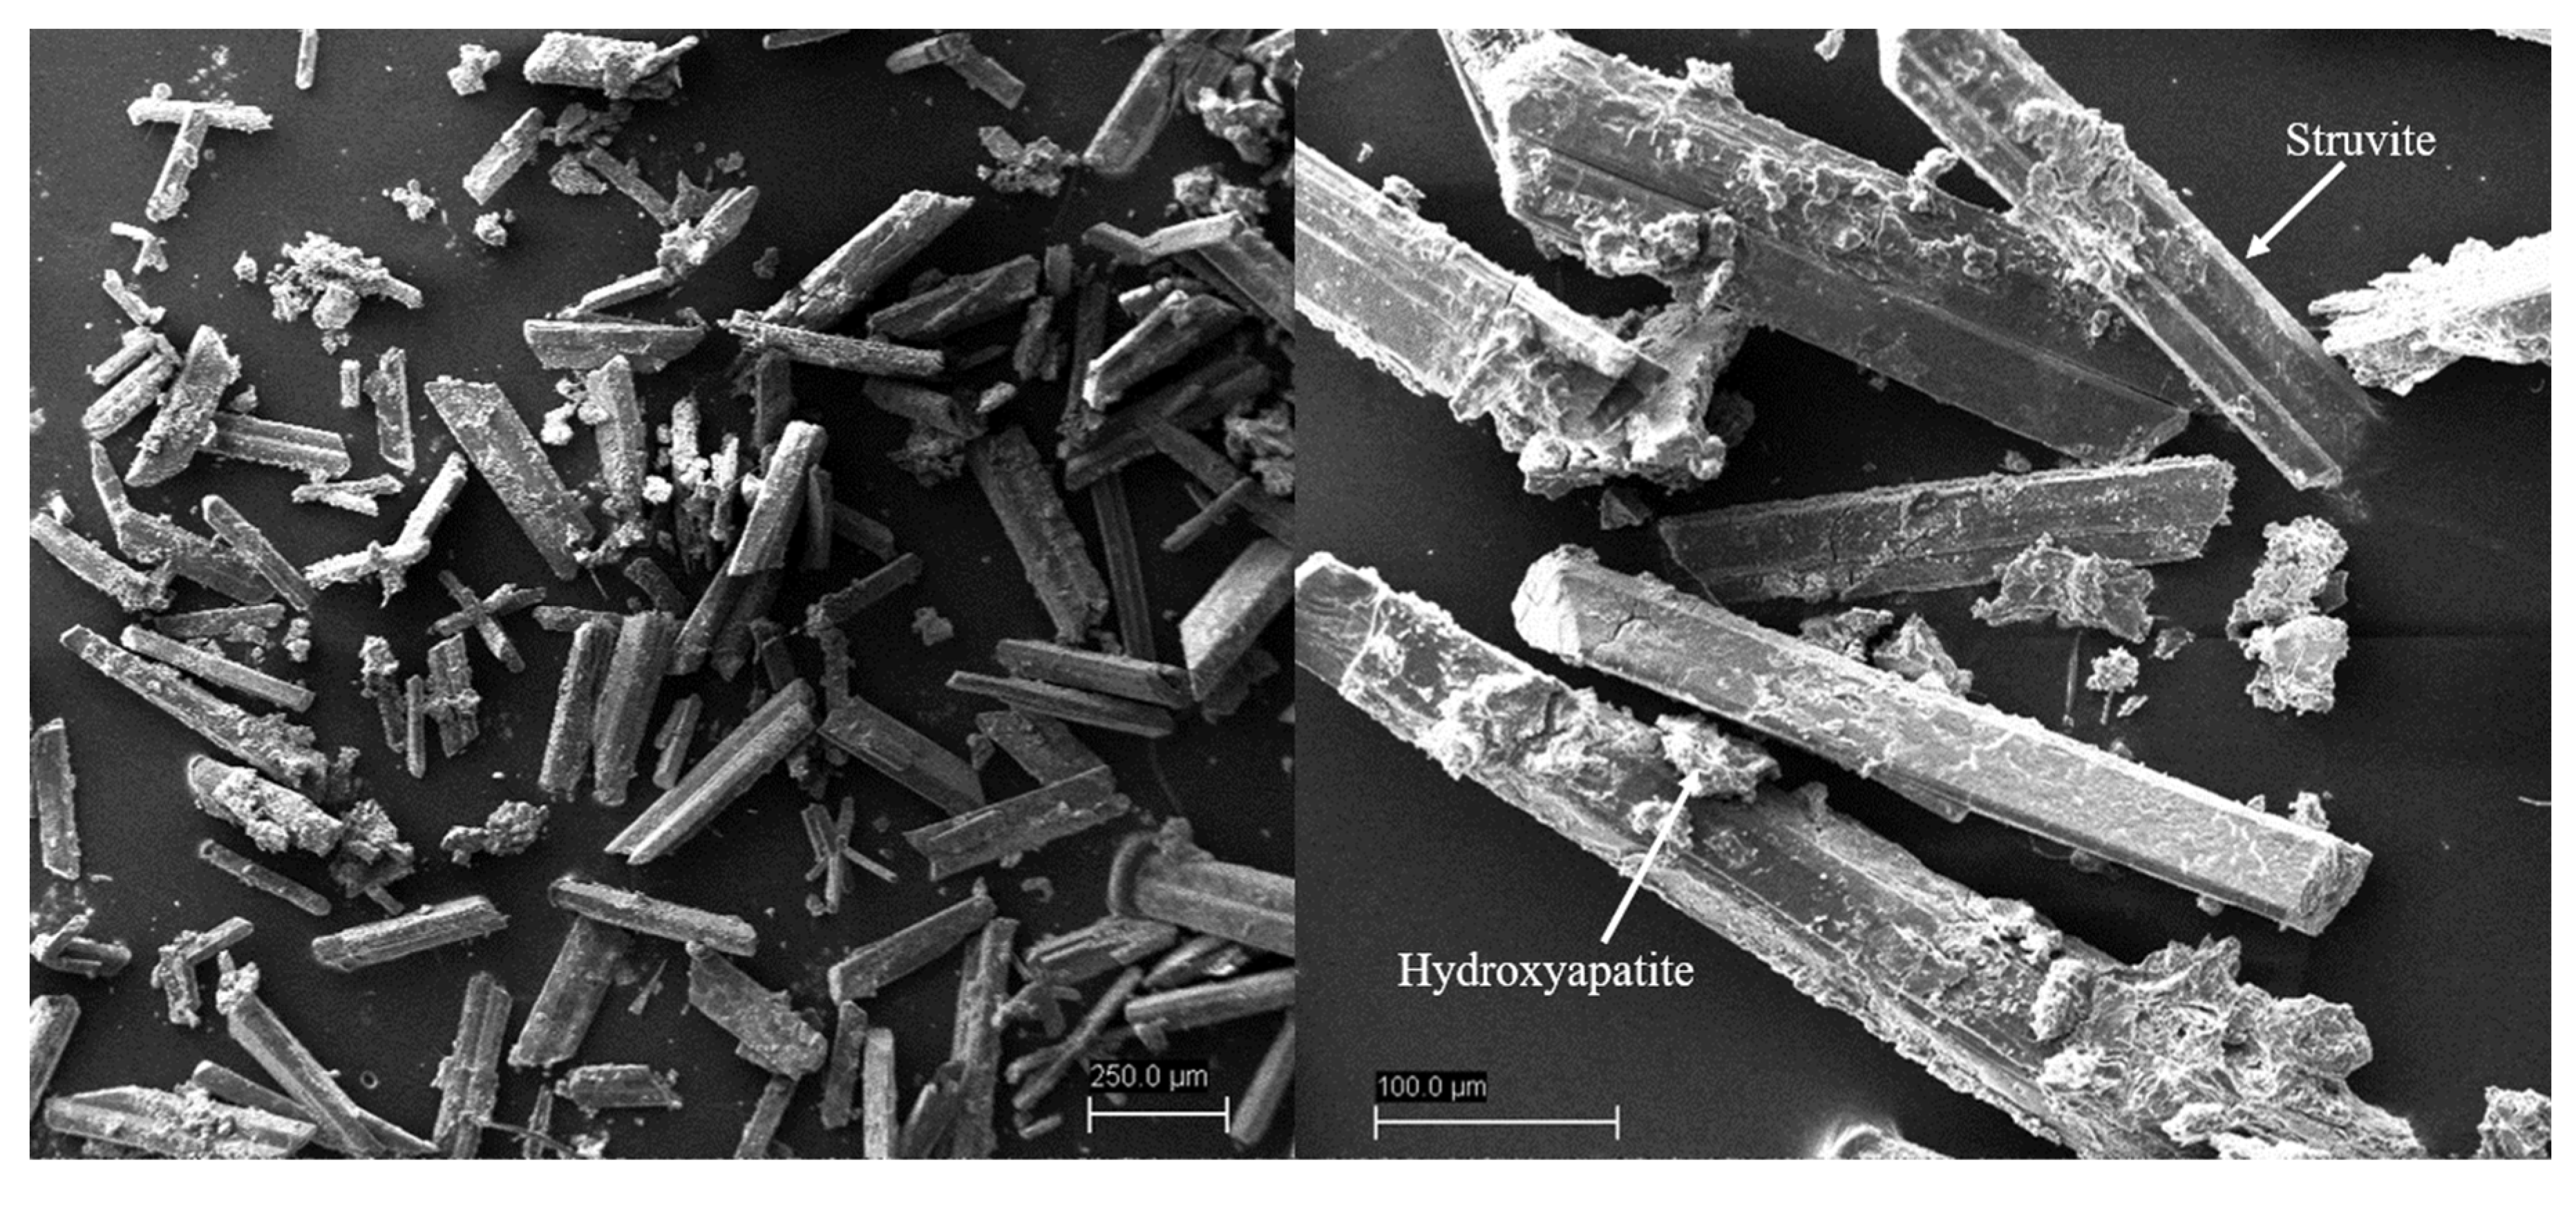
Struvite crystals were further identified by SEM (Figure 5). The precipitates had a white homogenous ‘salt’ appearance with typical struvite morphology of orthorhombic crystals from all feedstock’s [28]. Energy Dispersive X-ray Spectroscopy (EDS) analysis determined material on the large orthorhombic crystals were highly enriched in Mg and P, while abundant Ca and P was found to be present in the ‘fluffy coating’ amongst the crystals, typical of hydroxyapatite (Supplementary Material Figures S6 and S7).
4. Discussion
Nutrient rich wastewaters, like those from dairy processing are well suited to struvite formation, as they contain Mg, NH4+ and PO43−. Struvite precipitation has been demonstrated to precipitate within a range of operational conditions pertaining to temperature, pH, ratio and supersaturation of Mg, NH4+ and PO43−, and is overarchingly influenced by the physicochemical composition of the feedstock. The saturation index (SI) for struvite within the solution needs to be >0 for struvite to precipitate, and ideally ≥2 for homogenous struvite precipitates [29]. Struvite nucleates in alkaline conditions, typically in the pH range 7–11, with varying degrees of precipitate purity, although a pH of 8–10 is commonly considered optimal within a wide range of literature, [28,30,31]. While a broad range of temperatures (10–50 °C) will allow struvite to precipitate, there is a trade off between increasing temperature and increased struvite solubility [29]. Residence time, mixing velocity and dynamics of the wastewater feedstock, also impact the formation of struvite [32,33].
Given dairy processing wastewaters have unique chemical compositions the factors controlling optimal struvite formation are likely to be different to those determined in other studies. In phase one of this study, using AD dairy processing wastewater we examined the precipitation variables of pH, temperature and Mg: PO43− ratio and its effects on PO43− and NH4+ removal from solution as the measured response. The post struvite precipitation concentrations of the PO43− in the AD wastewater decreased by 60%–92% relative to the starting concentration with additional Mg dosing and pH adjustment into the alkaline range (Supplementary Material Table S1). The removal of PO43− was found to be highest (about 92%) at 20 °C, pH 10 with Mg: PO43− dosing ration of 2:1. However, statistically similar levels of PO43− removal (>90%) were observed across a broad range of synthesis temperatures and Mg dosing ratios at pH 10. Conversely, at low pH (7.0) PO43− recoveries were typically less than about 30% and are consistent with the ideal range of synthesis conditions and PO43− removal rates reported for a variety of feedstocks (recently reviewed by Peng et al. [31]). The effects on PO43− removal as a function of the synthesis conditions of temperature, pH and Mg dosing ratio are further illustrated in 2D scatter plots (Supplementary Material Figures S1–S4), indicating there may not be strong evidence to support a reduction in aqueous PO43− concentration in the ranges of temperature and MgCl2 ratios chosen. However, a clear trend is evident for pH. The evident relationship with pH may be explained by the saturation index of struvite increasing as the ionic activity product contribution by PO43− increases due to relative shift in HxPO4y− species with increasing pH. For both temperature and Mg dosing ratio the PO43− reduction has a very broad range indicating high variability across the experimental conditions tested. Mg dosing ratios above 1:1 appear to be in excess and do not significantly contribute further to PO43− removal. A slight improvement at high temperature is seen under the given conditions (Supplementary Material Figure S1).
Further investigation using RSM confirmed the most significant factor contributing to increase PO43− removal is pH, as in, increasing pH had the greatest positive influence on PO43− removal. Although pH 10 was the highest pH level experimentally tested, the non-linear model suggests that a pH of 10 is close to its optimum with a maximum PO43− removal. Increasing pH further, would only result in very slight increases in PO43− removal. Furthermore, increasing pH beyond 10 is not recommend as higher pH solutions pose hazards, promote ammonia stripping and XRD analysis of the product distribution in the solids suggested that at higher pH values, even at 10, the percentage of calcites compared to struvite in the solid product increases. Although the theoretical solubility of struvite has been reported between pH 8 to 10.7 (typically 9.0) [21], the observed decrease in struvite at higher pH suggests the optimum theoretical solubility of struvite in dairy AD wastewaters is likely between pH 9–10. Temperature was shown to have a small but significant effect in the regression, with increasing temperature improving PO43− removal. However, the effect was small, and the likelihood of controlling temperature at large scale with high precision is unlikely to be feasible. Mg: PO43− dosing ratio was shown to have a small but significant interaction effect with pH, however independently Mg: PO43− dosing ratio effect on PO43− was not significant and is supported by similar response surface modelling by Zhang et.al [34]. Considering the regression results and XRD analysis there is not likely to be an improvement in PO43− removal with a dosing ratio above 2. However, in the absence of additional Mg dosing PO43− removal is low and hydroxyapatite formation was favoured. Hence, the levels of pH 10, temperature of 20 °C and a MgCl2 dosing ratio of 2 are considered within the optimal range for PO43− removal and struvite precipitation from milk processing AD wastewater.
While PO43− removal from AD wastewater was near completion around pH 9 to 10, NH4+ was not efficiently removed (Figure 2). If we were to assume all the PO43− removed from solution formed struvite, an expected concentration of NH4+ at the end of the incubation can be calculated by subtracting the PO43− removal from the starting concentration of NH4+ because the stoichiometry of removal of PO43−: NH4+ is 1:1. As shown in Figure 2, the measured concentrations of NH4+ was not only found to be greater than the calculated expected concentration at pH 9 and pH 10, but there was a net increase in NH4+ availability, and in some cases almost doubling when compared to the starting concentration. This suggests that NH4+ was being produced during the incubations. One possible scenario is that ammonification, a process whereby organic N is converted to NH4+ by microbial activity [35] is occurring in the reaction vessel. The fact that anaerobic digestion of the raw milk processing wastewater at 37 °C increased NH4+ concentrations from 0.96 mmol/L to 6 mmol/L (data not reported) and that our observed relative increase in NH4+ was a lowest at 10 °C further suggest that the process may be microbially driven. Moreover, the disparities between PO43− and NH4+ removal is likely compounded by the coprecipitation of other P-containing minerals other than struvite. As shown in Table 1 AD wastewaters not only contain N, P and Mg they also contain spectator ions like Ca, which is reported to significantly impact the dynamics of struvite formation and removal of PO43− [21,36]. XRD analysis of AD precipitates confirmed hydroxyapatite as the second most abundant precipitated P-mineral and was supported by the concurrent removal of aqueous Ca from AD wastewaters following precipitations (Figure 2). Numerous studies have investigated the effects of Ca as an additional mechanism for the removal of P and have suggested the proportions of Mg and Ca are major influencing factors of struvite formation and PO43− removal [37,38]. As shown in Figure 2, Ca removal was highest (approaching 90%) when the ratio of Mg was low and tended to decreased when increasing levels of Mg dosing was included. Moreover, at pH 10 less Ca generally remained in solution across all Mg doses when compared to pH 9, suggesting more Ca-mineral precipitation at pH 10. XRD analysis of precipitates (Figure 4) generally confirmed an increasing trend in Ca- minerals at pH 10 but a decreasing proportion as the Mg dose increased. So, while RSM modeling may have identified pH 10 as optimal for PO43− removal, the presence of Ca biased struvite formation at the slightly lower pH 9. Multi-way ANOVA analysis of XRD product distribution identified Mg: PO43− dosing ratio as the only significant (p-value of 0.0005) factor influencing hydroxyapatite formation. Yilmazel and Demirer [21] along with others reported similar observations and concluded that the Mg ion ‘kinetically hinder’ the nucleation and growth of Ca-P minerals including hydroxyapatite [39]. While it is commonly agreed the optimal pH for struvite precipitation is around pH 8–10, the presence of Ca at this pH and above, renders conditions also suitable for hydroxyapatite and calcite precipitation, and as Lee and colleagues reported Ca is often underestimated and needs to be considered when striving for uncontaminated struvite precipitates [40].
Given the NH4+ was in excess in AD wastewaters and a resulting imbalance of struvite -forming ions, additional PO43− and Mg sources were predicted to improve NH4+ removal and struvite formation. In phase 2 of this study, three different dairy processing wastewater blends were prepared to balance NH4+ and PO43− in concentrations conducive to enhance precipitation of struvite (i.e., molar ration of 1:1) from AD wastewaters. Using readily available dairy processing wastewaters was also considered as a cost-effective solution to supply additional PO43−. Blended wastewater precipitations resulted in both PO43− and NH4+ removal (Figure 3) as well as struvite being produced (Figure 4). Noting each individual wastewater blend achieved differing ratios of struvite precipitation and nutrient removal.
The AD+HL wastewater blend, achieved a significantly (p < 0.05) greater PO43− removal than the AD+AT and AD+HL+AT blends on both a % (77%) and molar concentration (1603 µmol/L) basis. The highest PO43− molar removal relative to AD and other blended wastewater was likely related to the higher starting concentrations of PO43− (2053 µmol/L) in the AD+HL blend. As shown in Figure 3 blending of the AD wastewaters with additional PO43− has achieved a 14–17% NH4+ removal, which was a significant improvement in comparison to the AD wastewater alone. Accounting for the fact that 57% of the recovered P in AD+HL precipitates was struvite (Figure 4) and a balanced ratio of PO43− and NH4+, the molar removal efficiencies of PO43− exceeded that of NH4+ by approximately 4–5-fold across the three blends, again demonstrating an ‘unequal’ molar usage in the precipitation reaction. Perhaps unsurprisingly, the increased Ca concentration in AH and AT wastewaters lead to greater competition for PO43− and greater hydroxyapatite formation in precipitates (Figure 4) when compared to AD wastewaters alone. As discussed earlier the process of ammonification is also likely to be an influencing factor contributing to this disproportionate NH4+ removal. Other studies, acknowledging the likelihood of NH4+ to become increasingly available in wastewaters, attempted improved NH4+ reduction during struvite precipitation from leachate and reported the best NH4+ removal was attained by repeated cycling of the struvite through a reactor where the ratio of Mg and P exceeded N, thus utilising the ammonification process to add NH4+ to the reaction [41]. Further, Zhou and Wu [42] reported a pH of 10 was optimal for NH4+ removal during struvite precipitation, although total aqueous N removal could be improved during struvite precipitations when conducted with air exposure to allow volatilisation of N to the atmosphere. Although volatilisation of ammonium may be considered a loss of valuable N, it is possible to recover ammonium sulphate through the use of a sulphuric acid trap, thus providing an alternate strategy to recover an additional N-rich mineral with fertilizer value and further improve wastewater quality before environmental discharge.
While struvite formation was the desired product in this study, as it removes both NH4+ and PO43− from wastewater, formation of Ca-P minerals such as hydroxyapatite also has the potential to enhance the recovery PO43−. Although NH4+ removal is less than effective there is not the same urgency to recover NH4+ for reuse as there is for P, so where a wastewater contains Ca, consideration of allowing co-precipitation of hydroxyapatite may be preferable, given its potential as a valuable P fertiliser [40,43]. Further exploration of deliberately co-precipitating Ca minerals as fertiliser is of interest given that Ca is an inherent component of dairy processing wastewaters, and may benefit in reducing the cost of Mg dosing, enhance PO43− removal and precipitate a heterogenous P-rich product with amenity and value in agricultural systems.
5. Conclusions
This study has demonstrated that dairy processing wastewaters are a promising source of sustainable P which can be recovered in various mineral forms via precipitation. Struvite recovery favoured a combination of pH adjustment into the alkaline range and Mg dosing, despite the presence of Mg in the raw wastewaters. Blending different dairy processing wastewaters to improve P: N molar ratios increased NH4+ removal, however, NH4+ removal was relatively ineffective most likely as a result of competition by endogenous Ca for PO43− leading to formation of hydroxyapatite, and mineralisation of organic N in the wastewaters. Therefore, while precipitation of struvite was promising, it is not the only mechanism for mineral P removal from dairy processing wastewater. Further investigation into the efficacy of the precipitated minerals from dairy processing wastewaters on crop growth and soil health would be a progressive next step.
Supplementary Materials
The following supporting information can be downloaded at: https://www.mdpi.com/article/10.3390/su142315807/s1, Figure S1: Raw data for temperature and PO43− reduction indicating a small potential relationship; Figure S2: Raw data for pH and PO43− reduction indicating a likely relationship; Figure S3: Raw data for dosing ratio and PO43− reduction indicating an unlikely potential relationship; Figure S4: Raw data for dosing ratio and PO43− reduction on a smaller x-axis range indicating an unlikely potential relationship; Figure S5: Example of XRD diffractograms showing the main struvite peaks in precipitates generated at 20 °C at pH 9 (a) and 10 (b) using various Mg:PO43− ratios; Figure S6: SEM micrographs of precipitates generated from AD wastewaters at 20 °C and pH 10, showing the presence of both struvite and hydroxyapatite crystals. EDS spectrums of points 1 and 2 are shown in Figure S7; Figure S7: Energy Dispersive X-Ray Spectroscopy (EDS) elemental identification of struvite (Spectrum 1) and hydroxyapatite (Spectrum 2) in precipitates recovered from AD wastewater. Location points for spectrums are shown in Figure S6; Table S1: Experimental matrix and quantitative PO43− reduction from AD wastewater following struvite precipitation; Table S2: Final concentration (µmol/L) of PO43− and NH4+ for blended feedstocks as calculated from raw compositions; Table S3: P-values for sequential regressions identifying important factors to the linear model; Table S4: Fitting parameters and goodness of fit for a non-linear model.
Author Contributions
All authors listed have made a substantial and direct contribution to the work and have approved it for publication. S.M.: conceptualization, methodology, investigation, writing (Original Draft); L.H.: conceptualization, methodology, investigation, writing (Original Draft); E.T.B.: methodology, formal analysis, writing (Original Draft); A.R.: formal analysis, methodology, writing (Review and Editing); A.T.: formal analysis, writing (Original Draft); D.E.: validation, writing (Review and Editing), funding acquisition, project administration. All authors have read and agreed to the published version of the manuscript.
Funding
This study was funded by The Cooperative Research Centre for Contamination Assessment and Remediation of the Environment (Research project; 4.3.05.17.18).
Acknowledgments
The authors express their gratitude to The Cooperative Research Centre for Contamination Assessment and Remediation of the Environment (CRC CARE) for financial support (Research project; 4.3.05.17.18), as well as Southern Cross University for supporting this work and Mathew Veness for technical assistance.
Conflicts of Interest
The authors declare no conflict of interest.
References
- Childers, D.L.; Corman, J.; Edwards, M.; Elser, J. Sustainability Challenges of Phosphorus and Food: Solutions from Closing the Human Phosphorus Cycle. BioScience 2011, 61, 117–124. [Google Scholar] [CrossRef]
- Cordell, D.; White, S. Peak Phosphorus: Clarifying the Key Issues of a Vigorous Debate about Long-Term Phosphorus Security. Sustainability 2011, 3, 2027–2049. [Google Scholar] [CrossRef] [Green Version]
- Chen, M.; Graedel, T.E. A half-century of global phosphorus flows, stocks, production, consumption, recycling, and environmental impacts. Glob. Environ. Chang. 2016, 36, 139–152. [Google Scholar] [CrossRef]
- Clabby, C. Does Peak Phosphorus Loom? Am. Sci. 2010, 98, 291–292. [Google Scholar]
- Rhodes, C.J. Peak Phosphorus—Peak Food? The Need to Close the Phosphorus Cycle. Sci. Prog. 2013, 96, 109–152. [Google Scholar] [CrossRef] [PubMed]
- Cordell, D.; Jackson, M.; White, S. Phosphorus flows through the Australian food system: Identifying intervention points as a roadmap to phosphorus security. Environ. Sci. Policy 2013, 29, 87–102. [Google Scholar] [CrossRef]
- Withers, P.J.A.; Doody, D.G.; Sylvester-Bradley, R. Achieving Sustainable Phosphorus Use in Food Systems through Circularisation. Sustainability 2018, 10, 1804. [Google Scholar] [CrossRef] [Green Version]
- Scholz, R.W.; Ulrich, A.E.; Eilittä, M.; Roy, A. Sustainable use of phosphorus: A finite resource. Sci. Total Environ. 2013, 461–462, 799–803. [Google Scholar] [CrossRef]
- Mehta, C.; Tuker, R.; Poad, G.; Davis, R.; McGahan, E.; Galloway, J. Nutrients in Australian agro-industrial residues: Production, characteristics and mapping. Australas. J. Environ. Manag. 2016, 23, 206–222. [Google Scholar] [CrossRef]
- Sarvajayakesavalu, S.; Lu, Y.; Whithers, P.; Pavinato, P.S.; Pan, G.; Chareonsudjai, P. Phosphorus recovery: A need for an integrated approach. Ecosyst. Health Sustain. 2018, 4, 48–57. [Google Scholar] [CrossRef] [Green Version]
- Kushwaha, J.P.; Srivastava, V.C.; Mall, I.D. An Overview of Various Technologies for the Treatment of Dairy Wastewaters. Crit. Rev. Food Sci. Nutr. 2011, 51, 442–452. [Google Scholar] [CrossRef] [PubMed]
- Mao, Y.; Graham, D.W.; Tamaki, H.; Zhang, T. Dominant and novel clades of Candidatus Accumulibacter phosphatis in 18 globally distributed full-scale wastewater treatment plants. Sci. Rep. 2015, 5, 11857. [Google Scholar] [CrossRef] [PubMed] [Green Version]
- Wilk, M. A novel method of sewage sludge pre-treatment—HTC. In Proceedings of the 1st International Conference on the Sustainable Energy and Environment Development, Bangkok, Thailand, 20–21 March 2016. [Google Scholar]
- Rittmann, B.E.; Mayer, B.; Westerhoff, P.; Edwards, M. Capturing the lost phosphorus. Chemosphere 2011, 84, 846–853. [Google Scholar] [CrossRef] [PubMed]
- Talboys, P.J.; Heppell, J.; Roose, T.; Healey, J.R.; Jones, D.L.; Withers, P.J.A. Struvite: A slow-release fertiliser for sustainable phosphorus management? Plant Soil 2016, 401, 109–123. [Google Scholar] [CrossRef] [PubMed] [Green Version]
- Ueno, Y.; Fujii, M. Three Years Experience of Operating and Selling Recovered Struvite from Full-Scale Plant. Environ. Technol. 2001, 22, 1373–1381. [Google Scholar] [CrossRef] [PubMed]
- Latifian, M.; Liu, J.; Mattiasson, B. Struvite-based fertilizer and its physical and chemical properties. Environ. Technol. 2012, 33, 2691–2697. [Google Scholar] [CrossRef] [PubMed]
- Liu, Y.; Kwag, J.H.; Kim, J.H.; Ra, C. Recovery of nitrogen and phosphorus by struvite crystallization from swine wastewater. Desalination 2011, 277, 364–369. [Google Scholar] [CrossRef]
- Qian, F.; Song, Y. Phosphorus recovery from anaerobic-digested piggery wastewater by collecting reactor of map crystal. Huanjing Kexue Xuebao/Acta Sci. Circumstantiae 2014, 34, 2991–2997. [Google Scholar]
- Ryu, H.D.; Lee, S.L. Application of struvite precipitation as a pretreatment in treating swine wastewater. Process Bioch. 2010, 45, 563–572. [Google Scholar] [CrossRef]
- Yilmazel, Y.D.; Demirer, G.N. Removal and recovery of nutrients as struvite from anaerobic digestion residues of poultry manure. Environ. Technol. 2011, 32, 783–794. [Google Scholar] [CrossRef]
- Zeng, F.; Zhao, Q.; Jin, W.; Liu, Y.; Wang, K.; Lee, D.J. Struvite precipitation from anaerobic sludge supernatant and mixed fresh/stale human urine. J. Chem. Eng. 2018, 344, 254–261. [Google Scholar] [CrossRef]
- Butler, B. Struvite or Traditional Chemical Phosphorus Precipitation—What Option Rocks? Project Reports; Australian Meat Processor Corporation: Sydney, Australia, 2018. [Google Scholar]
- Uysal, A.; Kuru, B. The fertilizer effect of struvite recovered from dairy industry wastewater on the growth and nutrition of maize plant. Fresenius Environ. Bull. 2015, 24, 3155–3162. [Google Scholar]
- Slavov, A. Dairy Wastewaters—General Characteristics and Treatment Possibilities—A Review. Food Technol. Biotechnol. 2017, 55, 14–28. [Google Scholar] [CrossRef] [PubMed]
- APHA. Standard Methods for the Examination of Water and Wastewater, 21st ed.; American Public Health Association: Washington, DC, USA, 2017. [Google Scholar]
- Lafuente, B.; Downs, R.T.; Yang, H.; Stone, N. The power of databases: The RRUFF project. In Highlights in Mineralogical Crystallography; Armbruster, T., Danisi, R.M., Eds.; W. De Gruyter: Berlin, Germany, 2015. [Google Scholar]
- Babić-Ivančić, V.; Kontrec, J.; Kralj, D.; Brecevic, L. Precipitation diagrams of struvite and dissolution kinetics of different struvite morphologies. Croat. Chem. Acta 2002, 75, 89–106. [Google Scholar]
- Rouff, A.A. Temperature-dependent phosphorus precipitation and chromium removal from struvite-saturated solutions. J. Colloid Interface 2013, 392, 343–348. [Google Scholar] [CrossRef]
- Kim, D.; Min, K.J.; Lee, K.; Yu, M.S.; Park, K.Y. Effects of pH, molar ratios and pre-treatment on phosphorus recovery through struvite crystallization from effluent of anaerobically digested swine wastewater. Environ. Eng. Res. 2017, 22, 12–18. [Google Scholar] [CrossRef] [Green Version]
- Peng, L.; Dai, H.; Wu, Y.; Peng, Y.; Lu, X. A comprehensive review of phosphorus recovery from wastewater by crystallization processes. Chemosphere 2018, 197, 768–781. [Google Scholar] [CrossRef] [PubMed]
- Bhuiyan, M.I.H.; Mavinic, D.S.; Beckie, R.D. A solubility and thermodynamic study of struvite. Environ. Technol. 2007, 28, 1015–1026. [Google Scholar]
- Booker, N.A.; Priestley, A.J.; Fraser, I.H. Struvite Formation in Wastewater Treatment Plants: Opportunities for Nutrient Recovery. Environ. Technol. 1999, 20, 777–782. [Google Scholar] [CrossRef]
- Zhang, H.; Gong, W.; Luo, X.; Xie, B.; Li, G.; Liang, H. Obtaining High-Purity Struvite from Anaerobically Digested Wastewater: Effects of pH, Mg/P, and Ca2+ Interactions. Environ. Eng. Sci. 2019, 36, 102–113. [Google Scholar] [CrossRef]
- Dodson, S.I. Introduction to Limnology, 1st ed.; McGraw-Hill: New York, NY, USA, 2005. [Google Scholar]
- Muhmood, A.; Lu, J.; Dong, R.; Wu, S. Formation of struvite from agricultural wastewaters and its reuse on farmlands: Status and hindrances to closing the nutrient loop. J. Environ. Manag. 2019, 230, 1–13. [Google Scholar] [CrossRef] [PubMed]
- Le Corre, K.S.; Valsami-Jones, E.; Hobbs, P.; Parsons, S.A. Impact of calcium on struvite crystal size, shape and purity. J. Cryst. Growth 2005, 283, 514–522. [Google Scholar] [CrossRef] [Green Version]
- Wang, J.; Burken, J.B.; Zhang, X.; Surampalli, R.Y. Engineered Struvite Precipitation: Impacts of Component-Ion Molar Ratios and pH. J. Environ. Eng. 2005, 131, 1433–1440. [Google Scholar] [CrossRef]
- Çelen, I.; Buchanan, J.R.; Burns, R.T.; Robinson, R.B.; Raman, D.R. Using a chemical equilibrium model to predict amendmets required to precipitate phosphorus as struvite in liquid swine manure. Water Res. 2007, 41, 1689–1696. [Google Scholar] [CrossRef]
- Lee, S.-H.; Yoo, B.H.; Lim, S.J.; Kim, T.H.; Kim, S.K.; Kim, J.Y. Development and validation of an equilibrium model for struvite formation with calcium co-precipitation. J. Cryst. Growth 2013, 372, 129–137. [Google Scholar] [CrossRef]
- Siciliano, A.; Stillitano, M.A.; Limonti, C.; Marchio, F. Ammonium Removal from Landfill Leachate by Means of Multiple Recycling of Struvite Residues Obtained through Acid Decomposition. Appl. Sci. 2016, 6, 375. [Google Scholar] [CrossRef] [Green Version]
- Zhou, S.; Wu, Y. Improving the prediction of ammonium nitrogen removal through struvite precipitation. Environ. Sci. Pollut. Res. 2012, 19, 347–360. [Google Scholar] [CrossRef] [PubMed]
- Tsuji, H.; Fujii, S. Phosphate recovery by generating hydroxyapatite via reaction of calcium eluted from layered double hydroxides. Appl. Clay Sci. 2014, 99, 261–265. [Google Scholar] [CrossRef]
Figure 1.
Response surface models for optimisation of PO43− (%) removal as a function of pH and temperature, holding Mg: PO43− dosing ratio at 0 (a), 2 (b), 10 (c) and 30:1 (d).
Figure 1.
Response surface models for optimisation of PO43− (%) removal as a function of pH and temperature, holding Mg: PO43− dosing ratio at 0 (a), 2 (b), 10 (c) and 30:1 (d).
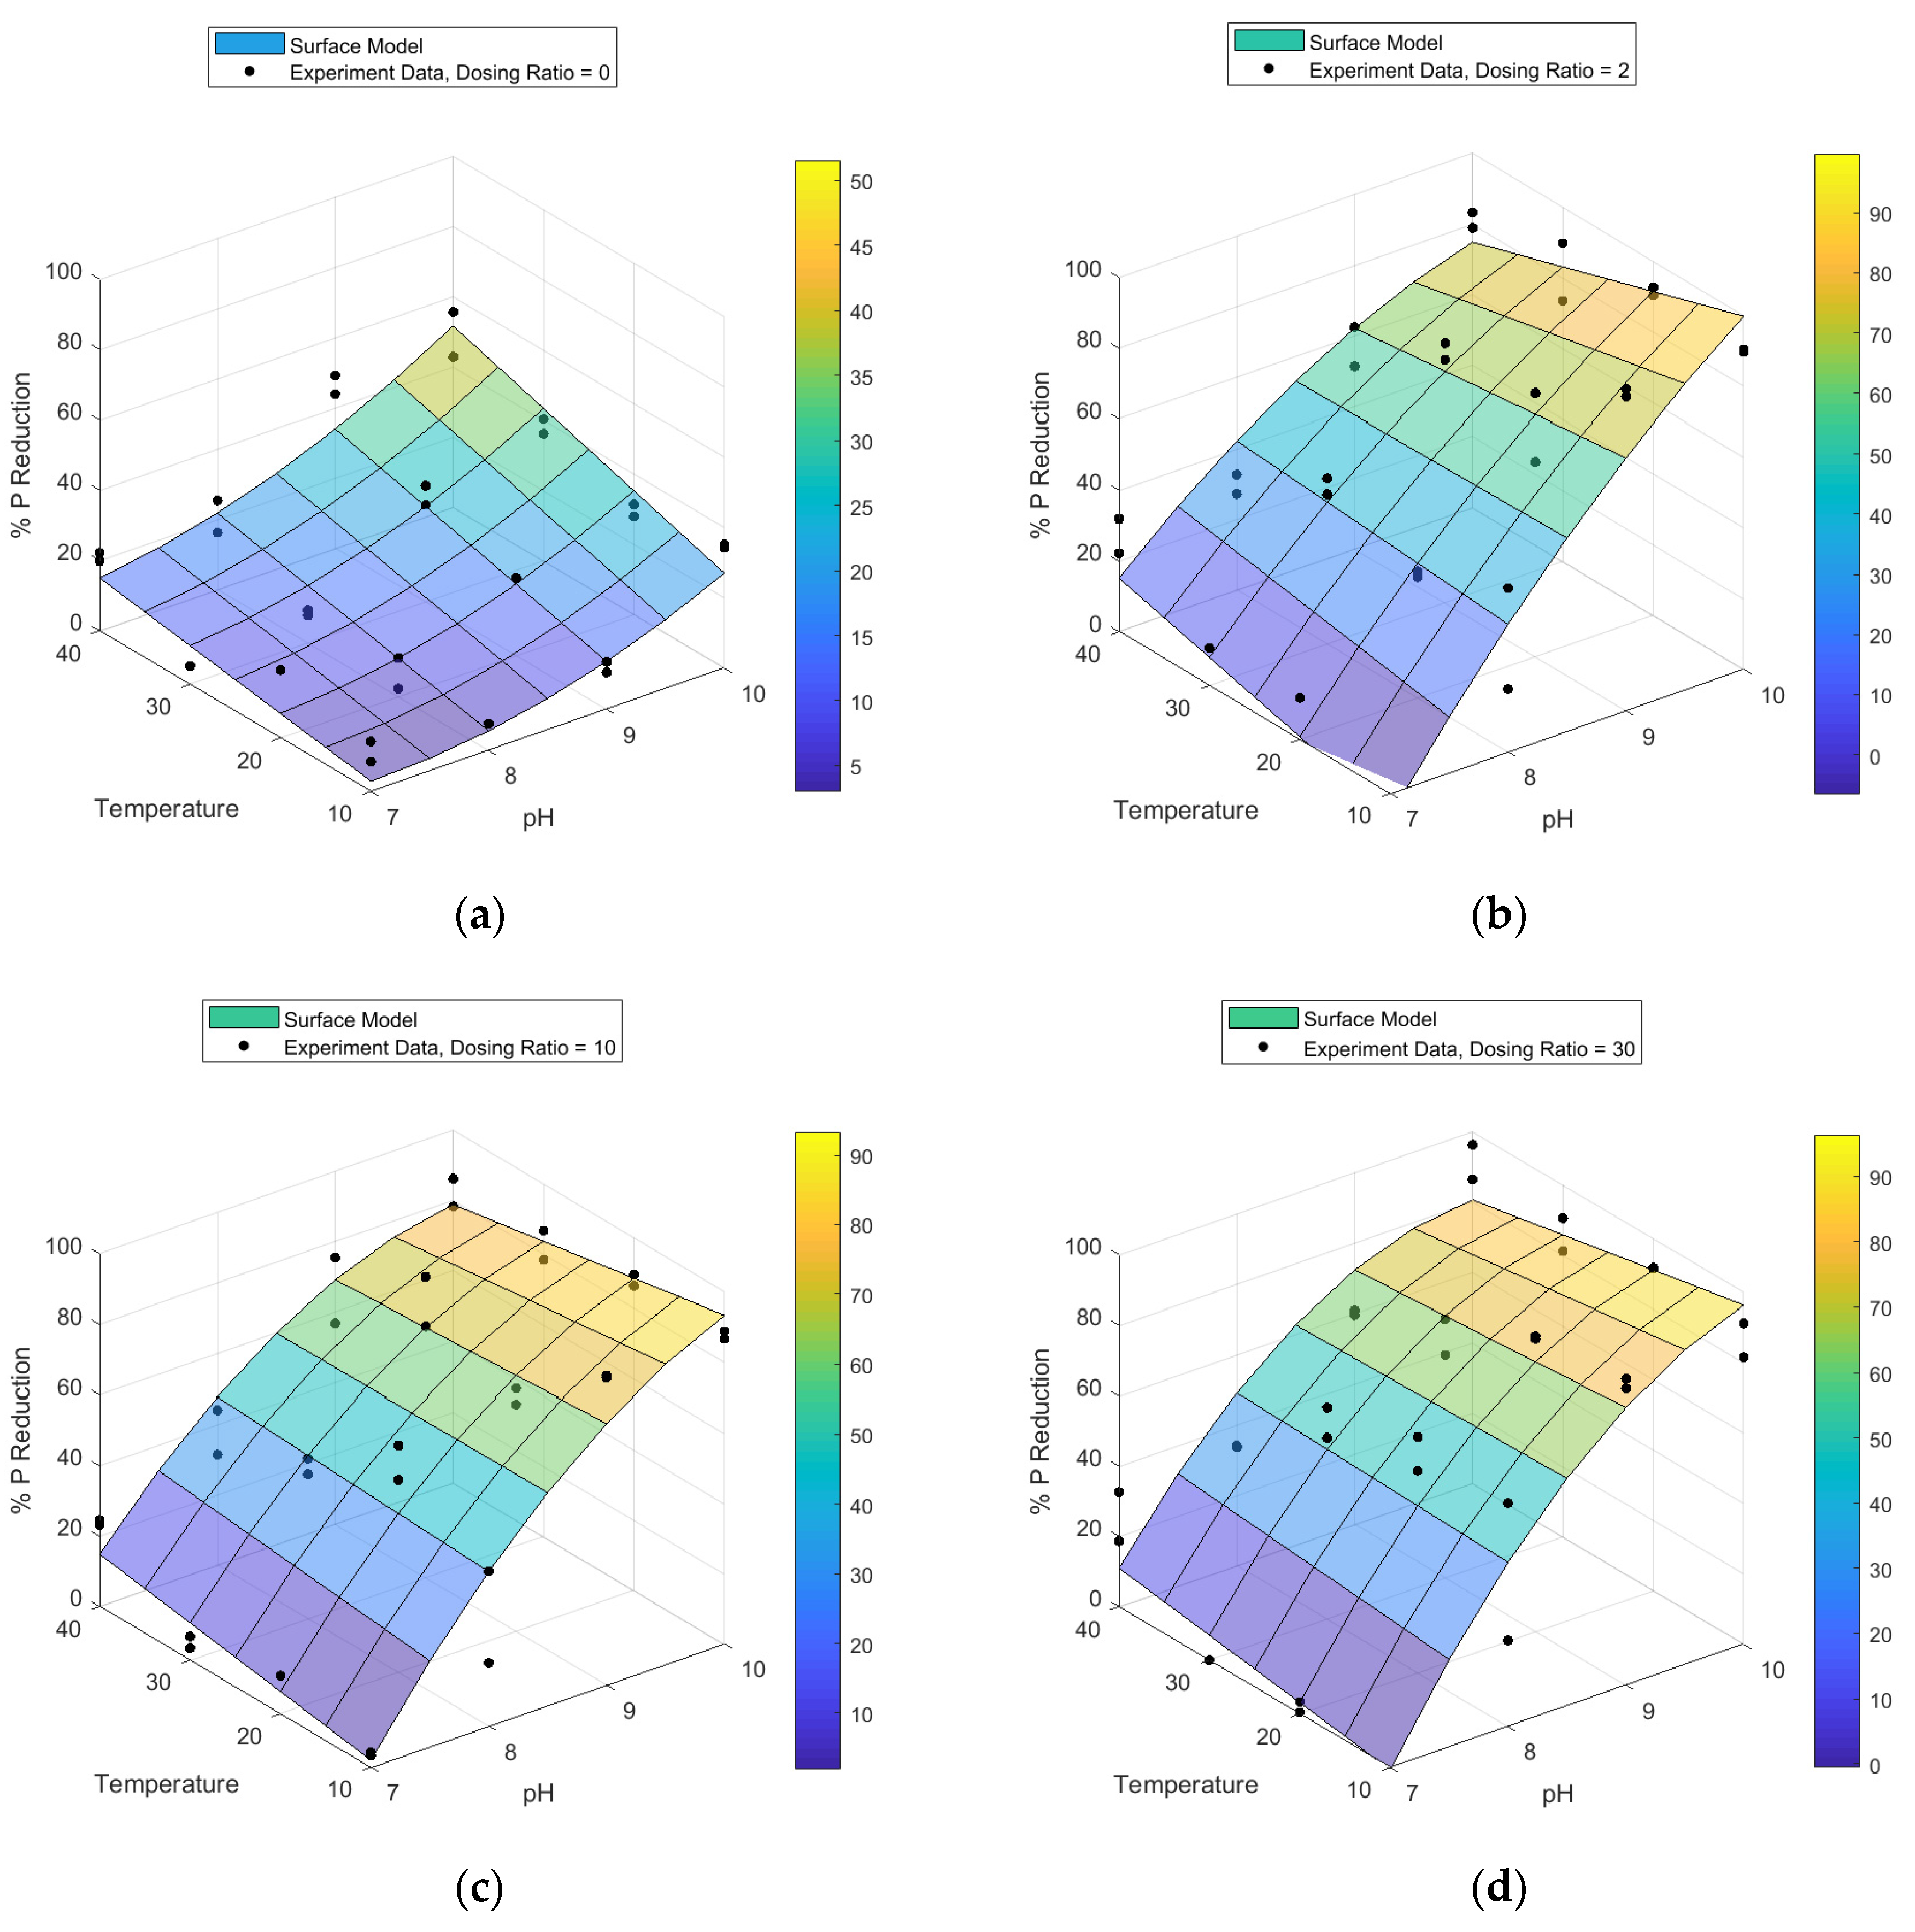
Figure 2.
Concentration change of aqueous ammonium-N and Ca following struvite precipitation under various pH, temperature and Mg dosing synthesis conditions. A negative % represents a decrease in concentration (removal) whereas a positive % is an increase in concentration over the experimental period.
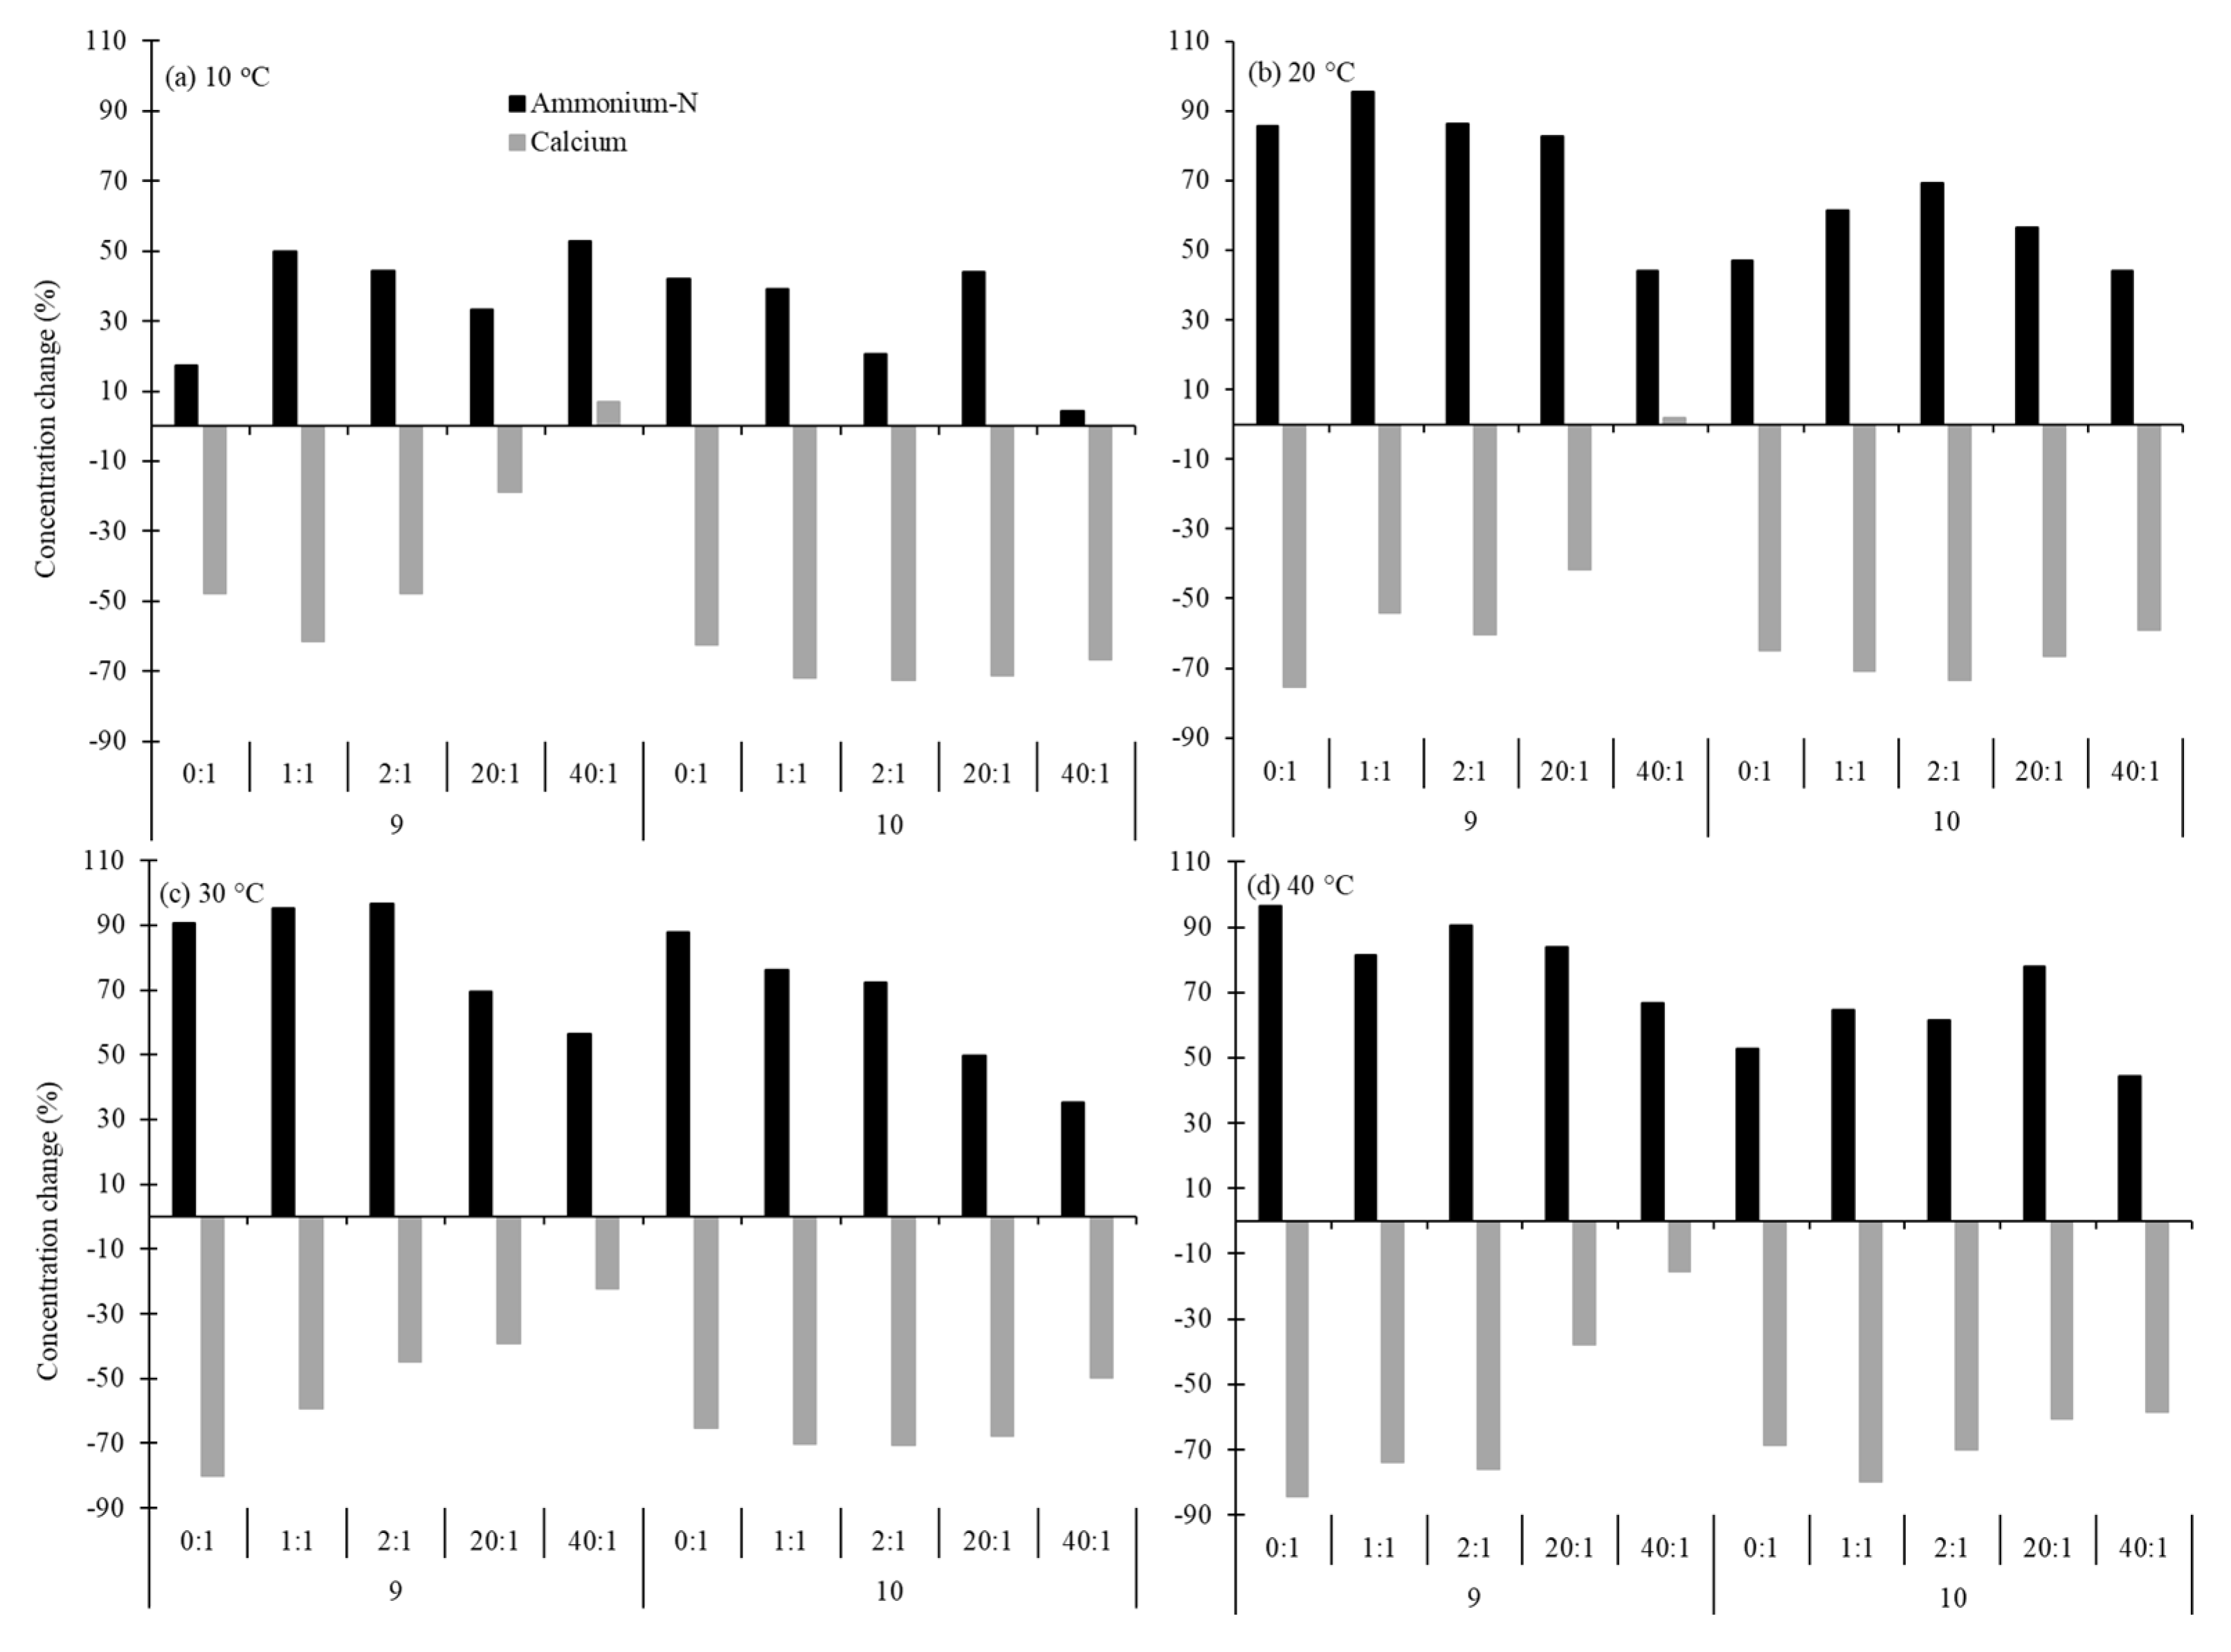
Figure 3.
PO43− and NH4+ removal efficiencies for various wastewater blends as a percentage (a) and µmol/L (b).
Figure 3.
PO43− and NH4+ removal efficiencies for various wastewater blends as a percentage (a) and µmol/L (b).
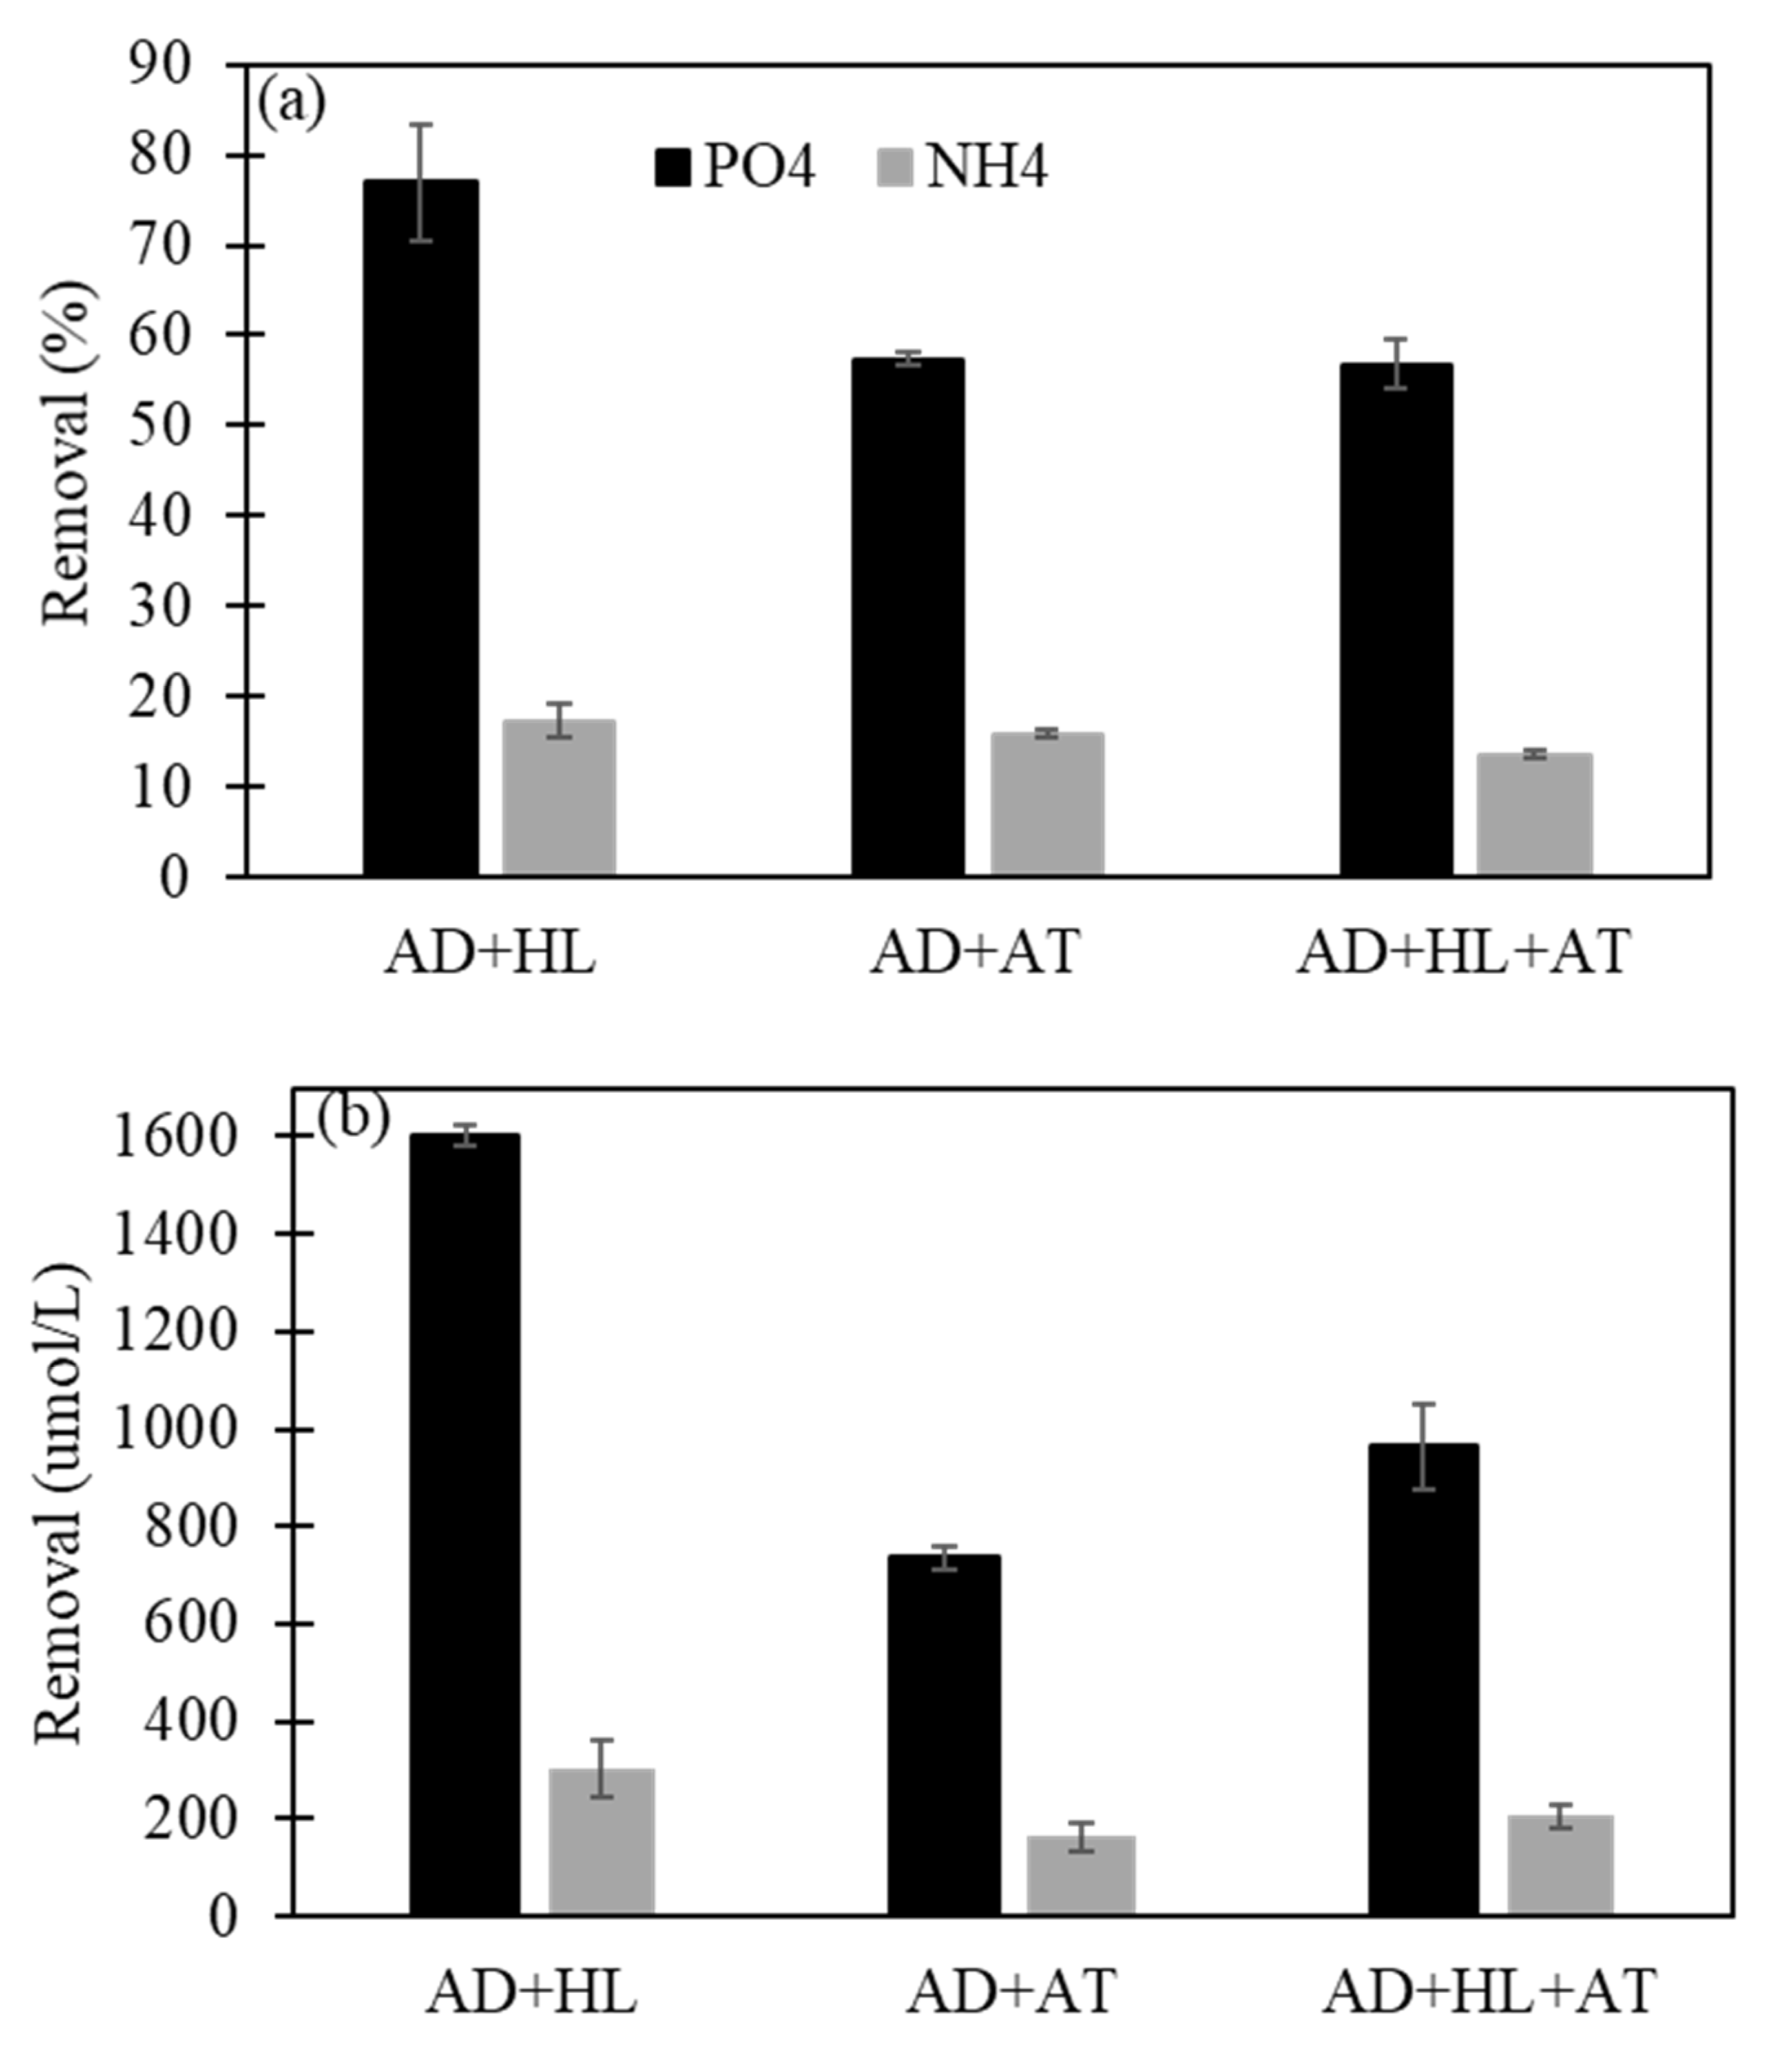
Figure 4.
Fractional distribution products, in AD and blended wastewater precipitates. Colours represent combined P-containing minerals (black), combined calcites (grey) and struvite (hatched).
Figure 4.
Fractional distribution products, in AD and blended wastewater precipitates. Colours represent combined P-containing minerals (black), combined calcites (grey) and struvite (hatched).
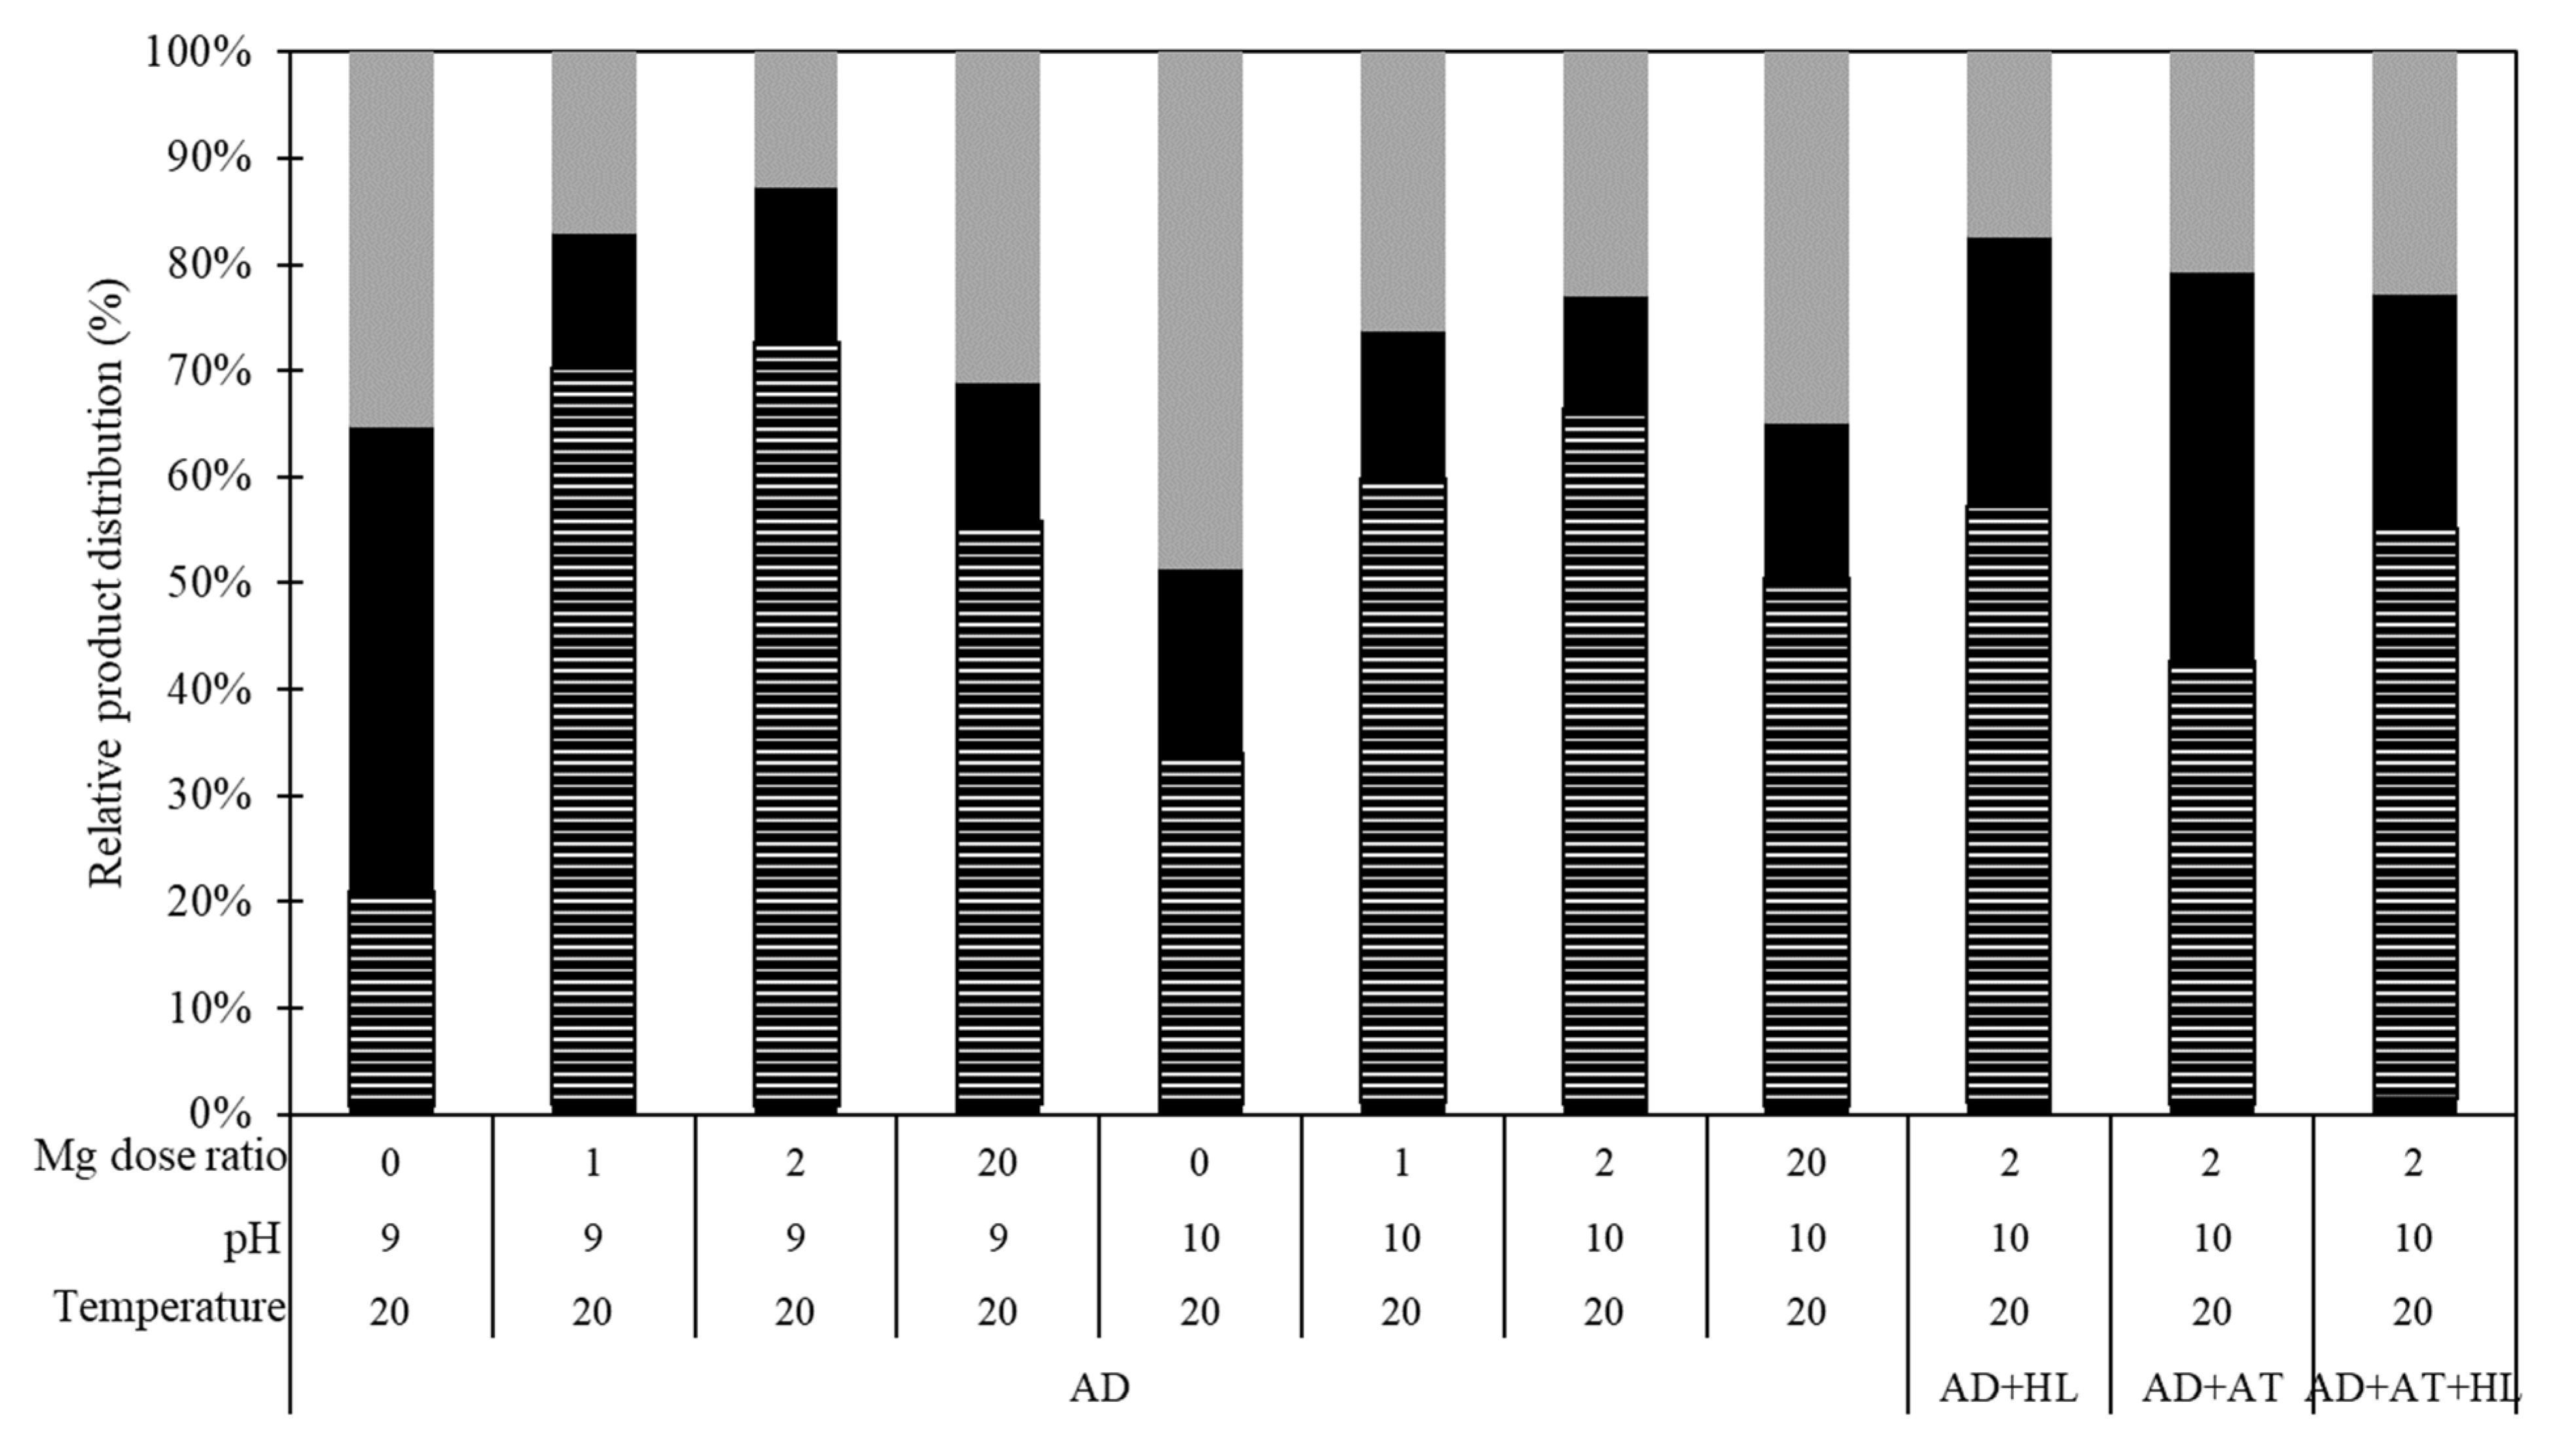
Figure 5.
SEM micrographs of precipitates generated from AD wastewaters at 20 °C and pH 10, showing the presence of both struvite and hydroxyapatite crystals. Higher magnification micrographs and EDS spectrum are available in the Supplementary material (Figures S6 and S7).
Figure 5.
SEM micrographs of precipitates generated from AD wastewaters at 20 °C and pH 10, showing the presence of both struvite and hydroxyapatite crystals. Higher magnification micrographs and EDS spectrum are available in the Supplementary material (Figures S6 and S7).

Table 1.
Compositional analysis of dairy processing wastewaters.
| Processing Wastewater | TP | PO43− | TN | NH4+ | Ca | Mg | pH |
|---|---|---|---|---|---|---|---|
| (mg/L) | (mg/L P) | (mg/L) | (mg/L N) | (mg/L) | (mg/L) | ||
| AD | 81.4 | 67.3 | 212.1 | 111.8 | 40.0 | 6.8 | 7.09 |
| HL | 248.2 | 210.8 | 51.9 | 5.5 | 98.1 | 9.0 | 3.85 |
| AT | 156.5 | 134.1 | 14.3 | 0.8 | 48.4 | 1.4 | 5.84 |
Table 2.
Coefficients, 95% confidence intervals and p-values from the final optimised regression (Equation (3)).
Table 2.
Coefficients, 95% confidence intervals and p-values from the final optimised regression (Equation (3)).
| Factor | Coefficient | 95% Confidence Interval | p-Value |
|---|---|---|---|
| ) | −220 | 30 | |
| ) | 2.1 | 1.2 | 0.00088 |
| ) | 29 | 4 | |
| ) | −0.23 | 0.15 | 0.0017 |
| ) | 0.066 | 0.015 |
Publisher’s Note: MDPI stays neutral with regard to jurisdictional claims in published maps and institutional affiliations. |
© 2022 by the authors. Licensee MDPI, Basel, Switzerland. This article is an open access article distributed under the terms and conditions of the Creative Commons Attribution (CC BY) license (https://creativecommons.org/licenses/by/4.0/).
Share and Cite
MDPI and ACS Style
McIntosh, S.; Hunt, L.; Thompson Brewster, E.; Rose, A.; Thornton, A.; Erler, D. Struvite Production from Dairy Processing Waste. Sustainability 2022, 14, 15807. https://doi.org/10.3390/su142315807
AMA Style
McIntosh S, Hunt L, Thompson Brewster E, Rose A, Thornton A, Erler D. Struvite Production from Dairy Processing Waste. Sustainability. 2022; 14(23):15807. https://doi.org/10.3390/su142315807
Chicago/Turabian StyleMcIntosh, Shane, Louise Hunt, Emma Thompson Brewster, Andrew Rose, Aaron Thornton, and Dirk Erler. 2022. "Struvite Production from Dairy Processing Waste" Sustainability 14, no. 23: 15807. https://doi.org/10.3390/su142315807
Note that from the first issue of 2016, this journal uses article numbers instead of page numbers. See further details here.