Article

Pretreatment of Slaughterhouse Effluent Treatment Plant Sludge Using Electro-Fenton Process for Anaerobic Digestion

by
Mohd Imran Siddiqui
1,
Izharul Haq Farooqi
1,*,
Farrukh Basheer
1,
Hasan Rameez
1 and
Mohamed Hasnain Isa
2
1
Department of Civil Engineering, Zakir Husain College of Engineering and Technology, Aligarh Muslim University, Aligarh 202002, India
2
Civil Engineering Programme, Faculty of Engineering, Universiti Teknologi Brunei, Tungku Highway, Gadong BE1410, Brunei
*
Author to whom correspondence should be addressed.
Sustainability 2023, 15(4), 3159; https://doi.org/10.3390/su15043159
Submission received: 22 November 2022 / Revised: 1 February 2023 / Accepted: 4 February 2023 / Published: 9 February 2023
(This article belongs to the Special Issue Sludge: A Renewable Source for Energy and Resources Recovery)

Abstract

:
Sludge management is an integral process of an effluent treatment plant (ETP). This study aimed at using the electro-Fenton (EF) process for pretreatment of a cattle-based slaughterhouse ETP sludge to enhance biogas production from anaerobic digestion. EF-oxidation experiments were conducted in 0.5 L beakers with mild-steel electrodes, to study the effect of factors, viz., H2O2 concentration, current density and reaction time on soluble chemical oxygen demand (sCOD) concentration, soluble extracellular polymeric substances (sEPS) concentration and volatile suspended solids (VSS) removal efficiency. This was followed by the quantification of biogas production from the raw and pretreated sludge in anaerobic digestion (AD). Experimental conditions for the EF process were optimized using response surface methodology (RSM). At optimized experimental conditions, EF pretreatment resulted in an increase in sCOD and sEPS concentrations, from 0.91 g/L to 6.1 g/L and 0.18 g/L to 1.4 g/L, respectively. VSS removal efficiency was 68.1%. Batch anaerobic digestion studies demonstrated an enhancement in the specific biogas yield, from 110 NmL/g-VS to 460 NmL/g-VS.

1. Introduction

Slaughterhouses generate large quantities of highly polluted wastewater. The main contributors to the organic matter in these effluents include excreta, fat, undigested food, blood, meat bits, suspended material and colloidal particles [1]. Pathogenic microorganisms are also commonly found in animal waste. Hence, slaughterhouse wastewater has to be treated adequately prior to discharge into the environment. Treatment of such kind of wastewater is often carried out by traditional physicochemical and biological (aerobic and anaerobic) systems. Wastewater treatment is generally accompanied by the production of significant volumes of sludge that need further treatment and disposal [2]. Sludge management accounts for more than 60% of the total treatment cost of conventional wastewater treatment plants (WWTPs), due to the challenging and costly nature of sludge treatment and disposal [3]. Anaerobic digestion (AD), a method for producing renewable energy, has been the subject of substantial investigation as a solution to this problem [4]. However, hydrolysis (the first step in anaerobic digestion), which is the transformation of complex organic molecules into appropriate substrates for microorganisms, significantly limits the pace of anaerobic sludge digestion [5]. Under ideal environmental circumstances, it typically takes 20 to 30 days for 30 to 50% of raw sludge’s volatile solids to decompose [6]. The colloidal structure of sludge particles, which includes the primary constituent species of cells (proteins, carbohydrates, lipids, and volatile fatty acids), as well as extracellular polymeric substances (EPS), is the cause of the sluggish hydrolysis rate of this kind of waste [7,8]. Approximately 80% of the organic matter in sludge is made up of proteins and carbohydrates. Cell walls shield the bulk of these proteins and carbohydrates from enzymatic hydrolysis, but there are also significant amounts of proteins and carbohydrates in the EPS [5,9]. These high-molecular-weight polymers significantly impact sludge settleability, bio flocculation, floc size, and floc stability. They also tend to inhibit the hydrolysis of the biomass during AD [8].
Pretreatment of sludge using chemical, mechanical, thermal, physical, and biological methods has been extensively researched, to accelerate the sludge breakdown and increase the biogas generation [10]. Pretreatment refers to the treatment of the sludge to increase the availability of the substrate components to microbial enzymes and, as a result, enhance the removal of organics, improve the reaction kinetics, and increase the total biogas generation [11]. The release of trapped organic compounds, an increase in surface area-to-volume ratio, and the hydrolysis of macromolecules, are some of the processes that are known to increase the availability of the substrate to microorganisms [12]. In particular, hydrolysis and β-oxidation are the two processes of utmost importance. As hydrolysis is the first reaction involved in the breakdown of complex substrates, this is often regarded as the rate-limiting phase [13]. Long-chain fatty acid (LCFA) degradation by β-oxidation, on the other hand, is the slowest process, and regulates the overall degradation kinetics for the substrate rich in fat, oil, and grease (FOG) [14]. Researchers have suggested novel approaches to enhance sludge pretreatment over the last decade, by combining well-known technologies in inventive ways, such as thermal-alkaline [15,16], ultrasonic-Fenton [8,17], electrochemical and sodium hypochlorite [18], photo-Fenton [9] and microwave-ozone [19]. By breaking up sludge flocs, destroying microbial cell walls, and transferring EPS and intracellular organic matter into the waste’s soluble fraction, these methods have shown their ability to accelerate sludge hydrolysis and solubilize complicated particulate matter [10,20]. Advanced oxidation processes (AOPs) have garnered much interest recently, because they can improve biogas generation, accelerate sludge breakdown, and reduce sludge’s potential to pollute the environment [21]. In this context, Fenton oxidation has been extensively used to increase biogas generation, sludge dewatering, and sludge weight reduction [22,23]. The Fenton-process efficiency depends on producing extremely reactive hydroxyl radicals (•OH), potent and unselective oxidizing species [24]. The catalytic breakdown of hydrogen peroxide (H2O2) with iron ions (Fe2+) in an acidic environment results in the in situ production of (•OH) radicals [18]. Through a dehydrogenating or hydroxylating process, these hydroxyl radicals oxidize the majority of organic compounds into CO2, H2O, and inorganic ions [25]. The electro-Fenton (EF) technique, which depends on the electrochemical in situ generation of Fe2+ or H2O2 using specific electrodes, is another well-known Fenton technology. It includes the combined advantages of electrochemical and Fenton treatment methods [26,27]. There is little information available on the use of the EF process for the pretreatment of sludge, as most research until the present date has focused on chemical Fenton pretreatment prior to anaerobic digestion [17,22,28]. In situ (•OH) radical production and the absence of formation of secondary sludge are the two characteristics of these ecologically sound techniques. Additionally, it could compete economically with other AOPs and function in benign circumstances [29]. One of the most common electrochemical-advanced oxidation processes (EAOPs), the EF process, depends on the production of the •OH radical in the bulk solution through Fenton’s reaction.
This paper investigates the electro-Fenton pretreatment of waste activated sludge (WAS) from the effluent treatment plant (ETP) of a cattle-based slaughterhouse, followed by anaerobic digestion. The variables considered under the investigation for the electro-Fenton pretreatment were H2O2 concentration, current density and reaction time. Moreover, as we already know, pretreatment results in solid solubilization or disintegration of organic matter, so after effective pretreatment, sCOD and sEPS concentrations would increase, while VSS concentration would decrease. A preliminary study was performed to determine the effective range of the variables (H2O2 concentration, current density and reaction time) for the efficient response outcome (sCOD concentration, sEPS concentration and VSS removal efficiency) with the help of one-factor variation, while keeping the other factors constant. After filtering the range, Design Expert software was used to apply the response surface methodology to obtain the optimized result with two-factor interaction curves. After optimization, a biomethane potential (BMP) test was performed to find the enhanced specific biogas yield of the pretreated sludge, compared to untreated sludge.

2. Materials and Methods

WAS and Anaerobic Microbial Consortium (Inoculum). The waste activated sludge (WAS) sample utilized for EF pretreatment and anaerobic digestion was collected from a local cattle-based slaughterhouse’s ETP in Aligarh (Uttar Pradesh, India). The industry’s slaughtering capacity was 800 buffaloes per day, while the ETP’s treatment capacity was 800 kL per day. The collected samples were kept at 4 °C for further studies [30]. Table 1 shows the properties of the collected WAS. Anaerobic digestion was conducted in duplicate, to evaluate the digestibility of raw and EF-pretreated sludge. The anaerobic microbial consortium (inoculum) utilized for anaerobic digestion was also taken from the same slaughterhouse’s upflow anaerobic sludge blanket reactor (UASBR).
Electro-Fenton Pretreatment. The EF process depends on the production of the •OH radical in the bulk solution through Fenton’s reaction (Equation (1)). According to Equations (2) and (3), acidic solutions with catalytic quantities of Fe2+ ions are more likely to cause the Fenton’s reagents (H2O2 and Fe2+) to be produced cathodically [31,32].
H2O2 + Fe2+ → Fe3+ + OH + OH
O2 + 2H+ + 2e → H2O2
Fe3+ + e → Fe2+
Laboratory-scale studies for electro-Fenton pretreatment were carried out in a 0.5 L reactor linked to a regulated DC power supply rated 30 V/05 A. For this investigation, two mild-steel electrodes (purity > 99.5%), were employed to provide the necessary Fe2+ to catalyze the process depicted in Equation (1). The reaction was started by manually adding H2O2 (30% w/w). Based on the hypothetical synthesis of Fe2+ using Faraday’s law (Equation (4)) and the stoichiometry of the Fenton reaction, the H2O2 concentration was determined. The electrodes were positioned at the reactor’s center, approximately 2 cm apart. The electrode had a 0.3 dm2 active surface area. At room temperature, 0.3 L of raw WAS was subjected to batch pretreatment trials. Before each run of the experiment, the electrodes were cleaned with a 1 M HCl solution and sandpaper to remove any oxide layer, to prevent passivation. Almost all the literature confirmed the optimum pH for the electro-Fenton process to be around 3. Without investigating the pH effect prior to every experiment, the sample pH was set to 3. H2SO4 and NaOH were used for pH adjustment, Na2SO4 (0.1 M) was used as a supporting electrolyte. Sample homogeneity was maintained with a magnetic stirrer operating at 300 rpm throughout the pretreatment process.
m = I   t   M w n   F
where m stands for mass in grams, I for current in amps, t for time in seconds, Mw for the molecular weight of iron (55.85 gm/mol), n for the number of electrons (2), and F for the Faraday constant (96,487 C/mol).
Analytical Methods. All sample collection, processing, and storage procedures were carried out in accordance with APHA’s Standard Methods for the Examination of Water and Wastewater (2017) [33]. The WAS sludge was collected from a cattle-based slaughterhouse ETP and characterized freshly. After characterization, it was stored at below 4 °C until further use. The maximum storage period was one week. In the process of obtaining the optimum conditions for electro-Fenton pretreatment, the pretreated sample’s properties were identified immediately, i.e., without any storage. After obtaining the optimum conditions, the freshly pretreated sludge was subjected to anaerobic digestion for the BMP test. The inoculum was collected from the UASBR of the same ETP, and freshly inoculated in the reactor without any starvation period.
Analyses were conducted in duplicate for reliability. The samples were filtered using a 0.45 µm Whatman syringe filter. Total dissolved solids (TDS), electrical conductivity (EC), and pH were measured using a Hach probe. The Hach vial test was used to determine chemical oxygen demand (COD), orthophosphate (PO43−), total Kjeldahl nitrogen (TKN), nitrite nitrogen (NO2-N), and nitrate nitrogen (NO3-N). The 5-day biological oxygen demand (BOD5) test, total solids (TS), volatile solids (VS), suspended solids (SS), and volatile suspended solids (VSS) tests were carried out, following standard procedures APHA (2017) [33]. The titration technique was used for alkalinity and volatile fatty acids (VFA) determination [34]. To quantify sEPS (protein and polysaccharides), a UV-Vis spectrophotometer was used. The Folin-phenol reagent technique [35] was used to determine the concentration of protein (PN), and the sulphuric acid-UV method was employed to determine the content of polysaccharides (PS) [36]. Table 2 shows the parameters and their respective analytical methods.
Biomethane Potential (BMP) Test. To assess the specific biogas yield for untreated and EF-pretreated sludge, batch fermentation assays under mesophilic conditions were carried out [37]. Anaerobic digestion was carried out in a reactor with a total capacity of 6 L. All reactors were fed in duplicate, with a working capacity of 4 L. The amounts of the WAS sample (substrate) and inoculum were added to the reactor in such a proportion so as to maintain a VS (substrate)/VS (inoculum) ratio equal to 1 [38]. The anaerobic medium’s pH was adjusted to 7.2. To maintain homogeneity in the reactor, it was mixed manually by shaking it once daily. A control batch experiment was run, using just the inoculum to determine the amount of biogas that would be produced from the seeding material itself. Utilizing the water-displacement technique, the daily production of biogas was measured. Biogas yield was calculated in terms of biogas volume at normal temperature and pressure conditions per unit mass of substrate VS(Nml/g-VS) added at the start of fermentation.
Optimization of Factors. The main objective was to analyze the data and look into the process’s viability, in order to enhance the pretreatment system. In order to fully comprehend the subject and the range of possible operating settings for the variables, the rise in sCOD concentration as a response was investigated. The examined ranges for H2O2 concentration (mg/g-TS), current density (mA/cm2), and response time (min) were 25–1000 mg/g-TS, 10–60 mA/cm2, and 15–180 min, respectively. Design Expert software was used for central composite design (CCD) and response surface methodology (RSM), to analyze the experimental data with sCOD concentration (mg/L), sEPS concentration (mg/L), and the VSS removal efficiency (%) as response parameters. The model was then developed using the experimental results to determine the coefficients and effects of each parameter.

3. Results

Effect of H2O2 Concentration. A vast range of H2O2 concentrations has been studied and significantly diverse results have been reported in the literature. Studies conducted by Feki et al. 2019 [39] found an optimal H2O2 concentration of 1.8 g/L for municipal sludge. To assess the impact of H2O2 concentration, the other operating parameters were held constant (current density = 40 mA/cm2 and time = 60 min) and the H2O2 dosage was varied from 25 to 1000 mg/g-TS. Figure 1 depicts the variation in sCOD with H2O2 concentration. It clearly shows improvement in sCOD with increasing H2O2 concentration up to 300 mg/g-TS, after which a negative trend is seen. The mineralization action of H2O2 at high concentrations might explain the reduction in sCOD with increasing H2O2 concentration.
Effect of Current Density. Current density is an essential parameter for electro-Fenton pretreatment, since power consumption accounts for a large proportion of the cost of this pretreatment [40]. It has an impact on the generation of Fe2+, H2O2, and (•OH) radicals [41,42]. To assess the impact of current density, the remaining operating parameters were held constant (H2O2 concentration = 250 mg/g TS, reaction time = 60 min). The experiments were conducted over a current density range of 10–60 mA/cm2. The effect of current density on sCOD concentration is shown in Figure 2. It was observed that a considerable change in sCOD was detected up to a current density of 40 mA/cm2. Further increase in current density did not result in a substantial rise of sCOD as compared to power usage. This could be explained by the fact that with the increase in current density, the dissipation rate of Fe2+ was increased, which reacted with the available H2O2 as per Eq. 1, and resulted in more •OH generation. However, as the available amount of H2O2 and the reaction time were limited, so further increase in current density did not result in a further significant increase in sCOD.
Effect of Reaction Time. Reaction time is also an essential element in electro-Fenton pretreatment. Whereas adequate time is required for the reaction to be carried out, excessively long reaction times result in excessive energy consumption, which raises the cost of pretreatment. To investigate the impact of time, a range of 15–180 min was chosen while the other factors were kept constant (H2O2 dosage = 250 mg/g-TS, current density = 30 mA/cm2). The results are summarized in Figure 3, from where it can be seen that sCOD increased with increasing reaction time until 120 min, after which it decreased. This reduction in sCOD with increasing reaction time might be attributed to the mineralization of solubilized organics into CO2, H2O, inorganic ions, etc. [21].

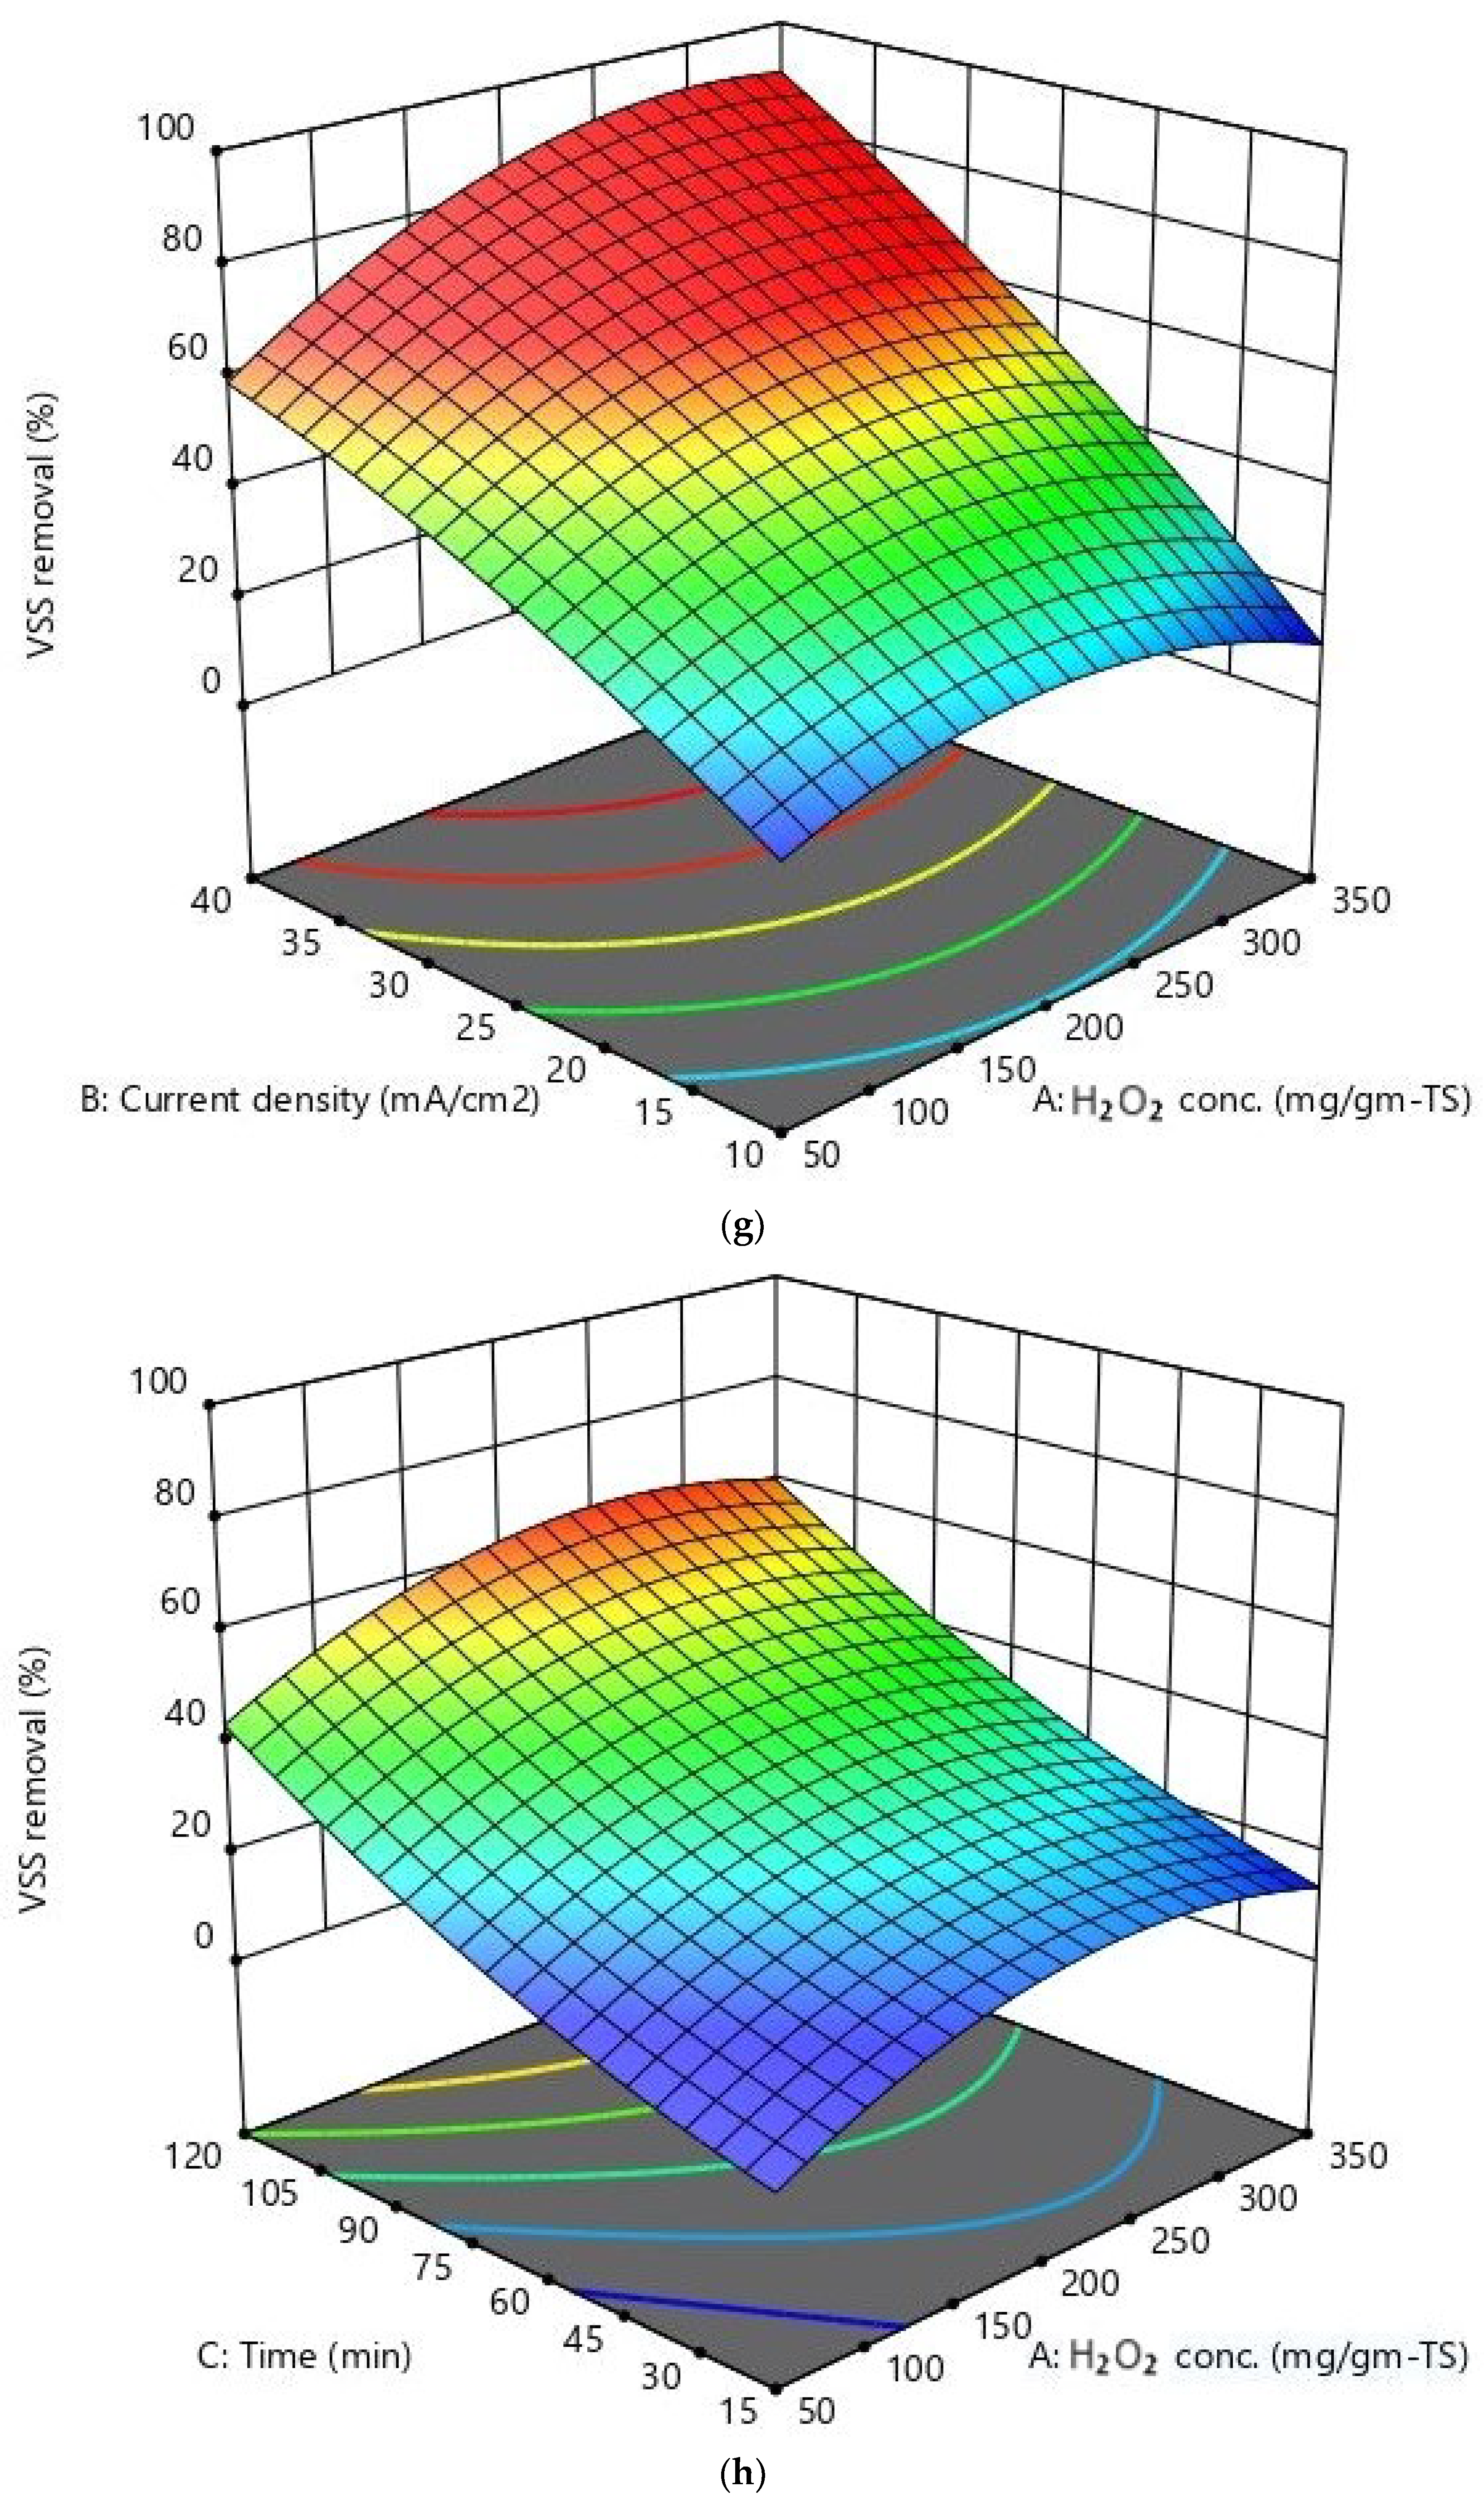
Response Surface Methodology (RSM)

Statistical Analysis. RSM is a valuable statistical tool for planning, modeling, assessing, and optimizing chemical processes in wastewater and water pretreatment. Central composite design (CCD), the most commonly used approach, was employed in this work to maximize the responses viz., sCOD concentration, sEPS concentration, and VSS removal efficiency. The statistical design of the experiment and data analysis were performed using Design Expert®, Version 12.0.1.0 software (Stat-Ease Inc., Minneapolis, MN, USA). In order to examine the influence of operational parameters (variables) on responses, three primary experimental factors were chosen: H2O2 concentration (mg/g-TS), current density (mA/cm2), and reaction time (min). It is also feasible to express the independent operating parameters and the reaction quantitatively.
y = β 0 + i 1 k β i x i + i 1 k β i i x i 2 + j < i 2 k β i j x i x j + e j
where y is the response, xi and xj are variables, β0 is the constant coefficient, βi’s, βii’s, and βij’s are linear, quadratic, and second-order interaction coefficients, respectively, and ej is the error.
Effective Variable Range Determination and Experiment Designing. Considering the theoretical studies and laboratory experiment results, a CCD was performed at the set minimum and maximum levels. The studied ranges were 50 to 350 mg/g-TS for H2O2 concentration, 10 to 40 mA/cm2 for current density, and 15 to 120 min for time. Table 3 presents the coded values of the five-level variables; −1.682 (minimum), −1, 0 (center), +1, +1.682 (maximum). The responses are represented by sCOD concentration (mg/L), sEPS concentration (mg/L), and VSS removal efficiency (%).
Table 4 displays the results of experiments based on CCD for analyzing the influence of the three independent factors on the responses. Solving the regression equation and studying the response surface contour plots, the optimal values for the selected variables were obtained [43]. The coefficient of determination, R2, indicates the quality of fit of the regression model. The modelled equation was used to predict the optimal values and highlight the interaction between the elements within the defined range [44]. Twenty tests were carried out in duplicate, in accordance with the strategy outlined in Table 4.
Analysis of Variance (ANOVA). The ANOVA approach was used to examine the impact of various parameters on sCOD concentration, sEPS concentration, and VSS removal efficiency. Table 5 shows the ANOVA findings for the models obtained for sCOD concentration, sEPS concentration, and VSS removal efficiency. Low p-values (<0.05) suggest that the models are statistically significant. The (ANOVA) findings showed that only the quadratic model is suitable for sCOD concentration and VSS removal efficiency. In contrast, the two-factor interaction model was suitable for sEPS concentration. The large model F-values (28.77, 40.62, and 25.41) indicate that the models are significant for the three responses. The corresponding Prob. > F value is lower than 0.05 at the same time. The R2 and adjusted R2 values are near 1.0 and close to each other, which supports a strong correlation between the factors and the responses. The large p values for lack of fit (>0.05) show that the F-statistic was insignificant for the three models, implying significant model correlation between the variables and process responses [45].
The following model equations were obtained; A, B, and C represent the three independent variables sCOD concentration, sEPS concentration, and VSS removal efficiency, respectively. The student’s t-test and p-value were used to assess the significance of each coefficient in these equations [43].
For sCOD concentration (mg/L),
sCOD = 3399.88 + 576.64 × A + 639.94 × B + 758.89 × C + 109.5 × AB + 288 × AC + 159.25 × BC − 337.22 × A2 − 73.8202 × B2 − 206.93 × C2
For sEPS concentration (mg/L),
sEPS = 772.75 + 117.68 × A + 207.39 × B + 129.45 × C + 92.50 × AB + 199.50 × AC − 97.75 × BC
For VSS removal efficiency (%),
VSS = 34.65 + 3.79 × A + 6.67 × B + 11.72 × C + 2.92 × AB + 0.33 × AC + 7.09 × BC − 4.05 × A2 − 1.47 × B2 + 1.71 × C2
To assess how satisfactory a model is, diagnostic plots such as the predicted vs. actual values shown in Figure 4 are helpful. Figure 4a–c show the predicted versus actual plots for sCOD concentration, sEPS concentration and VSS removal efficiency, respectively. The R2 and adjusted R2 values were 0.9628 and 0.9294 for sCOD, 0.9494 and 0.9260 for sEPS, and 0.9581 and 0.9204 for VSS removal efficiency. These plots show a good level of agreement between actual and model-derived values.
Results of RSM. Figure 5 illustrates how the operational parameters H2O2 concentration, current density, and response time affect the sCOD concentration, sEPS concentration, and VSS removal efficiency.
Figure 5a–c depict the variation in sCOD concentration with the change in H2O2 concentration, current density, and time. The slopes of the surface plot in Figure 5a,c are steeper as compared to that in Figure 5b, indicating that the interactive effects of H2O2 concentration and current density, time, and current density were more significant as compared to the interactive effect of H2O2 concentration and time. It was also observed that the maximum solubilization of organic matter or increase in sCOD occurred at the higher H2O2 concentration, current density, and time value. Figure 5d–f show the variation of sEPS concentration with the interactive effect of operational parameters. From Figure 5d, it was concluded that the H2O2 concentration was more impactful than the current density, because the rate of increase in sEPS with the change in H2O2 concentration was higher than that with the change in current density. Figure 5e shows that the effect of H2O2 concentration and time was very little at the initial values. At the high end of the selected variables, the effect was significantly sharper. The increment in sEPS was steeper between the 90 and 120 min interval and 280–350 mg/g-TS of H2O2 concentration. This means that hydroxyl radical generation and the disintegration of organic matter were more significant at a longer time and higher H2O2 concentration. Figure 5f shows the change in sEPS concentration with the interactive behavior of time and current density. It was observed that the starting range of time (15–45 min) and current density (10–18 mA/cm2) was less effective for EPS solubilization, while the range between 60 and 120 min for time and 25–40 mA/cm2 for current density showed a significantly steeper change in sEPS. It was concluded that the optimum condition exists somewhere in this region. Figure 5g–i present the variation in VSS removal efficiency with the change in H2O2 concentration, current density, and time. The surface plot, Figure 5g, indicates that VSS solubilization increased continuously with the increase in current density. H2O2 concentration showed a positive effect up to around 300 mg/g-TS, and with further increase in H2O2 concentration, a decrease in VSS solubilization was observed. In Figure 5h, the interactive behavior of H2O2 concentration and time was also the same as in the surface plot in Figure 5g, but the steepness was slightly less. From Figure 5i, it was noticed that VSS removal efficiency was lower in the initial range of current density and time, while at the high end of the range the VSS removal plot is steepest. RSM has studied the performance of EF pretreatment under various operating conditions, and optimized it. The RSM-optimized procedure demonstrates that the operating parameters of EF pretreatment are consistent with experimental findings. The optimal conditions of EF pretreatment for maximum sCOD concentration, sEPS concentration, and VSS removal efficiency were determined as H2O2 concentration = 300 mg/g-TS, current density = 30 mA/cm2, and reaction time = 120 min, with the maximum increase in sCOD being 6.1 g/L from 0.91 g/L, the maximum increase in sEPS being 1.4 g/L from 0.18 g/L and the maximum VSS removal efficiency being 68.1%.
Enhancement in Specific Biogas Yield Potential. A biomethane potential test (BMP) was performed in duplicate to quantify the improvement in the biodegradability of EF-pretreated sludge, compared to untreated sludge. The control batch was run only with the inoculum, to determine how much biogas was generated from the seeding material. Figure 6 shows the cumulative quantity of biogas produced during the anaerobic digestion carried over several days. Values shown in the graph represent net BMP values of the WAS obtained by subtracting the BMP values of the seeding material. In contrast to fermentation of the raw sludge, fermentation of the EF-pretreated sludge did not start with a time lag in biogas production. Raw WAS produced approximately 110 Nml/g-VS of biogas, while EF-pretreated sludge produced 460 Nml/g-TS of biogas. From Figure 6, it can also be seen that 90 percent of the biogas yield was reached in 21 days for untreated sludge and 15 days for EF-pretreated sludge. With a 4.2-fold increase in specific biogas yield production of EF-pretreated sludge compared to untreated sludge, this shows that EF pretreatment is a suitable method for enhancement of biogas production.

4. Conclusions

The study was carried out to analyze the effect of the EF process on the pretreatment of ETP sludge from a cattle-based slaughterhouse. Experiments were designed and optimized using the RSM technique. H2O2 concentration, current density, and reaction time were considered as variables. The results showed that at the optimal operational conditions (pH = 3, H2O2 = 300 mg/g-TS, current density = 30 mA/cm2, and reaction time = 120 min), the maximum increase in sCOD was 6.1 g/L from 0.91 g/L, and the maximum increase in sEPS was 1.4 g/L from 0.18 g/L. The maximum VSS removal efficiency was 68.1%. The model predicted results were in agreement with the experimental findings. Compared to raw sludge, much better results were found for the anaerobic digestion of EF-pretreated sludge. It was found that EF-pretreated sludge had a 4.2 times higher specific biogas yield than untreated sludge. The results of the study indicated that EF pretreatment could effectively be used as an environmentally benign technique to enhance the biogas yield of a slaughterhouse, and other kinds of sludge.

Author Contributions

Conceptualization, M.I.S., I.H.F., M.H.I.; methodology, M.I.S., I.H.F., F.B.; software, M.I.S., H.R.; analysis, M.I.S.; writing—original draft preparation, M.I.S., H.R.; writing—review and editing, I.H.F., F.B., M.H.I. All authors have read and agreed to the published version of the manuscript.

Funding

This research received no external funding.

Institutional Review Board Statement

Not applicable.

Informed Consent Statement

Not applicable.

Data Availability Statement

Data is contained within the article.

Acknowledgments

The authors would like to acknowledge Zakir Hussain College of Engineering and Technology, Aligarh Muslim University, for providing administrative and technical support.

Conflicts of Interest

The authors declare no conflict of interest.

References

  1. Vítězová, M.; Kohoutová, A.; Vítěz, T.; Hanišáková, N.; Kushkevych, I. Methanogenic microorganisms in industrial wastewater anaerobic treatment. Processes 2020, 8, 1546. [Google Scholar] [CrossRef]
  2. Christensen, M.L.; Keiding, K.; Nielsen, P.H.; Jørgensen, M.K. Dewatering in biological wastewater treatment: A review. Water Res. 2015, 82, 14–24. [Google Scholar] [CrossRef] [PubMed]
  3. Zhou, X.; Jiang, G.; Wang, Q.; Yuan, Z. A review on sludge conditioning by sludge pre-treatment with a focus on advanced oxidation. RSC Adv. 2014, 4, 50644–50652. [Google Scholar] [CrossRef]
  4. Wu, C.; Jin, L.; Zhang, P.; Zhang, G. Effects of potassium ferrate oxidation on sludge disintegration, dewaterability and anaerobic biodegradation. Int. Biodeterior. Biodegrad. 2015, 102, 137–142. [Google Scholar] [CrossRef]
  5. Heng, G.C.; Isa, M.H.; Lock, S.S.M.; Ng, C.A. Process optimization of waste activated sludge in anaerobic digestion and biogas production by electrochemical pre-treatment using ruthenium oxide coated titanium electrodes. Sustainability 2021, 13, 4874. [Google Scholar] [CrossRef]
  6. Ennouri, H.; Miladi, B.; Diaz, S.Z.; Güelfo, L.A.F.; Solera, R.; Hamdi, M.; Bouallagui, H. Effect of thermal pretreatment on the biogas production and microbial communities balance during anaerobic digestion of urban and industrial waste activated sludge. Bioresour. Technol. 2016, 214, 184–191. [Google Scholar] [CrossRef]
  7. Jin, B.; Wang, S.; Xing, L.; Li, B.; Peng, Y. Long term effect of alkali types on waste activated sludge hydrolytic acidification and microbial community at low temperature. Bioresour. Technol. 2016, 200, 587–597. [Google Scholar] [CrossRef]
  8. Rumky, J.; Ncibi, M.C.; Burgos-Castillo, R.C.; Deb, A.; Sillanpää, M. Optimization of integrated ultrasonic-Fenton system for metal removal and dewatering of anaerobically digested sludge by Box-Behnken design. Sci. Total Environ. 2018, 645, 573–584. [Google Scholar] [CrossRef]
  9. Heng, G.C.; Isa, M.H.; Lim, J.-W.; Ho, Y.-C.; Zinatizadeh, A.A.L. Enhancement of anaerobic digestibility of waste activated sludge using photo-Fenton pretreatment. Environ. Sci. Pollut. Res. 2017, 24, 27113–27124. [Google Scholar] [CrossRef]
  10. Zhen, G.; Lu, X.; Kato, H.; Zhao, Y.; Li, Y.Y. Overview of pretreatment strategies for enhancing sewage sludge disintegration and subsequent anaerobic digestion: Current advances, full-scale application and future perspectives. Renew. Sustain. Energy Rev. 2017, 69, 559–577. [Google Scholar] [CrossRef]
  11. Ahn, J.Y.; Chang, S.W. Effects of Sludge Concentration and Disintegration/Solubilization Pretreatment Methods on Increasing Anaerobic Biodegradation Efficiency and Biogas Production. Sustainability 2021, 13, 12887. [Google Scholar] [CrossRef]
  12. Zawieja, I.; Worwąg, M. Biogas Production from excess sludge oxidized with peracetic acid (PAA). Energies 2021, 14, 3434. [Google Scholar] [CrossRef]
  13. Luo, K.; Yang, Q.; Li, X.M.; Yang, G.J.; Liu, Y.; Wang, D.B.; Zheng, W.; Zeng, G.M. Hydrolysis kinetics in anaerobic digestion of waste activated sludge enhanced by α-amylase. Biochem. Eng. J. 2012, 62, 17–21. [Google Scholar] [CrossRef]
  14. Ma, J.; Zhao, Q.B.; Laurens, L.L.; Jarvis, E.E.; Nagle, N.J.; Chen, S.; Frear, C.S. Mechanism, kinetics and microbiology of inhibition caused by long-chain fatty acids in anaerobic digestion of algal biomass. Biotechnol. Biofuels 2015, 8, 141. [Google Scholar] [CrossRef]
  15. Liu, X.; Xu, Q.; Wang, D.; Yang, Q.; Wu, Y.; Li, Y.; Fu, Q.; Yang, F.; Liu, Y.; Ni, B.J.; et al. Thermal-alkaline pretreatment of polyacrylamide flocculated waste activated sludge: Process optimization and effects on anaerobic digestion and polyacrylamide degradation. Bioresour. Technol. 2019, 281, 158–167. [Google Scholar] [CrossRef]
  16. Zhang, J.; Li, N.; Dai, X.; Tao, W.; Jenkinson, I.R.; Li, Z. Enhanced dewaterability of sludge during anaerobic digestion with thermal hydrolysis pretreatment: New insights through structure evolution. Water Res. 2018, 131, 177–185. [Google Scholar] [CrossRef]
  17. Kavitha, S.; Banu, J.R.; IvinShaju, C.D.; Kaliappan, S.; Yeom, I.T. Fenton mediated ultrasonic disintegration of sludge biomass: Biodegradability studies, energetic assessment, and its economic viability. Bioresour. Technol. 2016, 221, 1–8. [Google Scholar] [CrossRef]
  18. Yuan, H.; Yu, B.; Cheng, P.; Zhu, N.; Yin, C.; Ying, L. Pilot-scale study of enhanced anaerobic digestion of waste activated sludge by electrochemical and sodium hypochlorite combination pretreatment. Int. Biodeterior. Biodegrad. 2016, 110, 227–234. [Google Scholar] [CrossRef]
  19. Cosgun, S.; Semerci, N. Combined and individual applications of ozonation and microwave treatment for waste activated sludge solubilization and nutrient release. J. Environ. Manag. 2019, 241, 76–83. [Google Scholar] [CrossRef]
  20. Yu, L.; Zhang, W.; Liu, H.; Wang, G.; Liu, H. Evaluation of volatile fatty acids production and dewaterability of waste activated sludge with different thermo-chemical pretreatments. Int. Biodeterior. Biodegrad. 2018, 129, 170–178. [Google Scholar] [CrossRef]
  21. Feki, E.; Battimelli, A.; Sayadi, S.; Dhouib, A.; Khoufi, S. High-rate anaerobic digestion of waste activated sludge by integration of electro-Fenton process. Molecules 2020, 25, 626. [Google Scholar] [CrossRef] [PubMed]
  22. Pilli, S.; More, T.T.; Yan, S.; Tyagi, R.D.; Surampalli, R.Y. Fenton pre-treatment of secondary sludge to enhance anaerobic digestion: Energy balance and greenhouse gas emissions. Chem. Eng. J. 2016, 283, 285–292. [Google Scholar] [CrossRef]
  23. Şahinkaya, S.; Kalıpcı, E.; Aras, S. Disintegration of waste activated sludge by different applications of Fenton process. Process Saf. Environ. Prot. 2015, 93, 274–281. [Google Scholar] [CrossRef]
  24. Yang, H.G.; Chun, H.Y.; Pak, D. Improvement of sludge anaerobic degradability by combined electro-flotation and electro-oxidation treatment. Biochem. Eng. J. 2014, 90, 44–48. [Google Scholar] [CrossRef]
  25. Ma, L.; Zhou, M.; Ren, G.; Yang, W.; Liang, L. A highly energy-efficient flow-through electro-Fenton process for organic pollutants degradation. Electrochim. Acta 2016, 200, 222–230. [Google Scholar] [CrossRef]
  26. Mohajeri, S.; Aziz, H.A.; Isa, M.H.; Zahed, M.A.; Adlan, M.N. Statistical optimization of process parameters for landfill leachate treatment using electro-Fenton technique. J. Hazard. Mater. 2010, 176, 749–758. [Google Scholar] [CrossRef]
  27. Mohajeri, S.; Hamidi, A.A.; Isa, M.H.; Zahed, M.A. Landfill Leachate Treatment through Electro-Fenton Oxidation. Pollution 2019, 5, 199–209. [Google Scholar]
  28. He, D.Q.; Wang, L.F.; Jiang, H.; Yu, H.Q. A Fenton-like process for the enhanced activated sludge dewatering. Chem. Eng. J. 2015, 272, 128–134. [Google Scholar] [CrossRef]
  29. Canizares, P.; Sáez, C.; Lobato, J.; Rodrigo, M.A. Electrochemical oxidation of polyhydroxybenzenes on boron-doped diamond anodes. Ind. Eng. Chem. Res. 2004, 43, 6629–6637. [Google Scholar] [CrossRef]
  30. Astals, S.; Koch, K.; Weinrich, S.; Hafner, S.D.; Tait, S.; Peces, M. Impact of storage conditions on the methanogenic activity of anaerobic digestion inocula. Water 2020, 12, 1321. [Google Scholar] [CrossRef]
  31. Brillas, E.; Sirés, I.; Oturan, M.A. Electro-Fenton process and related electrochemical technologies based on Fenton’s reaction chemistry. Chem. Rev. 2009, 109, 6570–6631. [Google Scholar] [CrossRef]
  32. Sirés, I.; Brillas, E. Electro-Fenton process: Fundamentals and reactivity. Electro-Fent. Process 2017, 1–28. [Google Scholar] [CrossRef]
  33. Standard Methods for the Examination of Water and Wastewater, 23rd ed.; American Public Health Association/American Water Works Association/Water Environment Federation: Washington, DC, USA, 2017.
  34. Anderson, G.K.; Yang, G. Determination of bicarbonate and total volatile acid concentration in anaerobic digesters using a simple titration. Water Environ. Res. 1992, 64, 53–59. [Google Scholar] [CrossRef]
  35. Lowry, O.H. Protein measurement with the Folin phenol reagent. J. Biol. Chem. 1951, 193, 265–275. [Google Scholar] [CrossRef]
  36. Albalasmeh, A.A.; Berhe, A.A.; Ghezzehei, T.A. A new method for rapid determination of carbohydrate and total carbon concentrations using UV spectrophotometry. Carbohydr. Polym. 2013, 97, 253–261. [Google Scholar] [CrossRef]
  37. Holliger, C.; Alves, M.; Andrade, D.; Angelidaki, I.; Astals, S.; Baier, U.; Bougrier, C.; Buffière, P.; Carballa, M.; De Wilde, V.; et al. Towards a standardization of biomethane potential tests. Water Sci. Technol. 2016, 74, 2515–2522. [Google Scholar] [CrossRef]
  38. Khoufi, S.; Louhichi, A.; Sayadi, S. Optimization of anaerobic co-digestion of olive mill wastewater and liquid poultry manure in batch condition and semi-continuous jet-loop reactor. Bioresour. Technol. 2015, 182, 67–74. [Google Scholar] [CrossRef]
  39. Feki, E.; Sayadi, S.; Loukil, S.; Dhouib, A.; Khoufi, S. Comparison between thermo-alkaline and electro-fenton disintegration effect on waste activated sludge anaerobic digestion. BioMed Res. Int. 2019, 2019, 2496905. [Google Scholar] [CrossRef]
  40. Olvera-Vargas, H.; Zheng, X.; Garcia-Rodriguez, O.; Lefebvre, O. Sequential “electrochemical peroxidation–Electro-Fenton” process for anaerobic sludge treatment. Water Res. 2019, 154, 277–286. [Google Scholar] [CrossRef]
  41. Zhang, H.; Fei, C.; Zhang, D.; Tang, F. Degradation of 4-nitrophenol in aqueous medium by electro-Fenton method. J. Hazard. Mater. 2007, 145, 227–232. [Google Scholar] [CrossRef]
  42. Sirés, I.; Brillas, E.; Oturan, M.A.; Rodrigo, M.A.; Panizza, M. Electrochemical advanced oxidation processes: Today and tomorrow. A review. Environ. Sci. Pollut. Res. 2014, 21, 8336–8367. [Google Scholar] [CrossRef] [PubMed]
  43. Noordin, M.Y.; Venkatesh, V.C.; Sharif, S.; Elting, S.; Abdullah, A. Application of response surface methodology in describing the performance of coated carbide tools when turning AISI 1045 steel. J. Mater. Process. Technol. 2004, 145, 46–58. [Google Scholar] [CrossRef]
  44. Elibol, M. Response surface methodological approach for inclusion of perfluorocarbon in actinorhodin fermentation medium. Process Biochem. 2002, 38, 667–673. [Google Scholar] [CrossRef]
  45. Wong, L.-P.; Isa, M.H.; Bashir, M.J.K. Disintegration of palm oil mill effluent organic solids by ultrasonication: Optimization by response surface methodology. Process Saf. Environ. Prot. 2018, 114, 123–132. [Google Scholar] [CrossRef]
Figure 1. Variation in sCOD vs. H2O2 conc (current density = 40 mA/cm2, time = 60 min).
Sustainability 15 03159 g001
Figure 2. Variation in sCOD vs. current density (H2O2 conc = 250 mg/g-TS, time = 60 min).
Sustainability 15 03159 g002
Figure 3. Variation in sCOD vs. time (H2O2 conc = 250 mg/g-TS, current density = 30 mA/cm2).
Sustainability 15 03159 g003
Figure 4. Predicted vs. actual plot for (a) sCOD, (b) sEPS and (c) VSS removal efficiency.
Sustainability 15 03159 g004aSustainability 15 03159 g004b
Figure 5. Response surface plots of operational variables versus responses.
Sustainability 15 03159 g005aSustainability 15 03159 g005bSustainability 15 03159 g005cSustainability 15 03159 g005dSustainability 15 03159 g005e
Figure 6. Specific biogas yield for untreated sludge and EF-pretreated sludge.
Sustainability 15 03159 g006
Table 1. Characteristics of Waste Activated Sludge (WAS).
Parameter (Unit)Mean Value ± SD
pH7.3 ± 0.1
EC (mS/cm)7.2 ± 1.1
TDS (mg/L)3470 ± 710
TS (mg/L)30,140 ± 4070
VS (mg/L)21,000 ± 4960
SS (mg/L)26,420 ± 3270
VSS (mg/L)19,970 ± 4590
sBOD5 (mg/L)454 ± 63
sCOD (mg/L)1087 ± 130
tCOD (mg/L)35,082 ± 9118
VFA (mg/L)52 ± 11
Alkalinity (mg/L as CaCO3)1242 ± 141
sEPS (mg/L)196 ± 23
PO43− (mg/L)154 ± 44
TKN (mg/L)185 ± 97
NO2-N (mg/L)2.93 ± 0.56
NO3-N (mg/L)28.75 ± 4.99
Table 2. Analytical methods for sludge characterization.
ParametersMethod/Reference
TDSProbe CDC-401, Hach
ECProbe CDC-401, Hach
pHProbe pH-201, Hach
CODUSEPA reactor digestion method 8000, Hach
PO43-Molybdovanadate method 8114, Hach
TKNNessler method 8075, Hach
NO2-NFerrous Sulphate method 8153, Hach
NO3-NCadmium-reduction method 8039, Hach
BOD55210 B, Standard methods, APHA 2017 [33]
TS2540 B, Standard methods, APHA 2017 [33]
VS2540 E, Standard methods, APHA 2017 [33]
SS2540 D, Standard methods, APHA 2017 [33]
VSS2540 E, Standard methods, APHA 2017 [33]
VFATitration method [34]
Protein (PN)Folin-phenol reagent method [35]
Polysaccharides (PS)Sulphuric acid-UV method [36]
Table 3. Independent variable experiment range and levels.
FactorRange and Levels (Coded)
−1.682−10+1+1.682
H2O2 concentration (mg/g-TS)(A)50110.81200289.19350
Current density (mA/cm2)(B)1016.082533.9240
Reaction time (min)(C)1536.2867.598.71120
Table 4. CCD based on three independent variables.
Run No.H2O2 Conc.
mg/g-TS
(A)
Current Density mA/cm2
(B)
Reaction Time
min
(C)
sCOD
mg/L
EPS
mg/L
VSS Removal
%
1−1−1−1149956216.58
2+1+1−13110100524.78
3+1+1+15305144866.2
4+1−1+13644106629.56
5000276972439.06
6000344480730.2
7000327978929.5
8000358885133.96
900−1.682135544022.46
10000357075037.24
11−1+1+1340563452.02
120+1.68204199112838.26
13−1−1+1190559828.32
14000378085938.04
15+1−1−1180920817.76
1600+1.682409589355.92
170−1.6820200440622.16
18+1.68200321985129.92
19−1.68200149447115.9
20−1+1−1208596513.18
Table 5. ANOVA table.
SourcesSum of SquareDegree of FreedomMean SquaresF-Valuesp-Values
Prob > F
sCOD concentration a
Model2.105 × 10792.339 × 10628.77<0.0001
(significant)
Residual8.128 × 1051081,282.05--
Lack of fit1.896 × 105537,917.690.30420.8913
(not significant)
Pure error6.232 × 1055
1.246 × 10⁵
--
sEPS concentration b
Model1.469 × 10662.448 × 10540.62<0.0001
(significant)
Residual78,340.96136026.23--
Lack of fit63,879.6387984.952.760.1392
(not significant)
Pure error14,461.3352892.27-
VSS removal efficiency c
Model3474.669386.0725.41<0.0001
(significant)
Residual151.941015.19--
Lack of fit67.50513.500.79930.5941
(not significant)
Pure error84.45516.89--
a R2 = 0.9628, R2adj = 0.9294, Coefficient of variance (CV) % = 09.57. b R2 = 0.9494, R2adj = 0.9260, Coefficient of variance (CV) % = 10.05. c R2 = 0.9581, R2adj = 0.9204, Coefficient of variance (CV) % = 12.16.
Disclaimer/Publisher’s Note: The statements, opinions and data contained in all publications are solely those of the individual author(s) and contributor(s) and not of MDPI and/or the editor(s). MDPI and/or the editor(s) disclaim responsibility for any injury to people or property resulting from any ideas, methods, instructions or products referred to in the content.

