Article

Long-Term Dynamics of Chlorophyll-a Concentration and Its Response to Human and Natural Factors in Lake Taihu Based on MODIS Data

1
South China Institute of Environmental Science, Ministry of Ecology and Environment, NO.18 Ruihe RD., Guangzhou 510535, China
2
School of Geography and Planning, Nanning Normal University, Nanning 530001, China
3
School of Geography and Remote Sensing, Guangzhou University, Guangzhou 510006, China
*
Author to whom correspondence should be addressed.
These authors contributed equally to this work.
Sustainability 2022, 14(24), 16874; https://doi.org/10.3390/su142416874
Submission received: 15 November 2022 / Revised: 7 December 2022 / Accepted: 13 December 2022 / Published: 15 December 2022
(This article belongs to the Special Issue Spatial Analysis and Land Use Planning for Sustainable Ecosystem)

Abstract

:
Chlorophyll-a plays an essential biochemical role in the eutrophication process, and is widely considered an important water quality indicator for assessing human activity’s effects on aquatic ecosystems. Herein, 20 years of moderate resolution imaging spectroradiometer (MODIS) data were applied to investigate the spatiotemporal patterns and trends of chlorophyll-a concentration (Chla) in the eutrophic Lake Taihu, based on a new empirical model. The validated results suggested that our developed model presented appreciable performance in estimating Chla, with a root mean square error (MAPE) of 12.95 μg/L and mean absolute percentage error (RMSE) of 29.98%. Long-term MODIS observations suggested that the Chla of Lake Taihu experienced an overall increasing trend and significant spatiotemporal heterogeneity during 2002–2021. A driving factor analysis indicated that precipitation and air temperature had a significant impact on the monthly dynamics of Chla, while chemical fertilizer consumption, municipal wastewater, industrial sewage, precipitation, and air temperature were important driving factors and together explained more than 81% of the long-term dynamics of Chla. This study provides a 20 year recorded dataset of Chla for inland waters, offering new insights for future precise eutrophication control and efficient water resource management.

1. Introduction

The serious eutrophication and severe water quality degradation caused by the overloading of large amounts of agricultural and anthropogenic effluents rich in nutrients into surface waters leads to the proliferation of phytoplankton growth [1,2,3]. Eutrophication can lead to a series of negative ecological consequences, such as frequent cyanobacterial blooms, toxin release, water acidification, and biodiversity degradation [4,5,6]. Chlorophyll-a is a biochemical pigment in water eutrophication and one of the most useful metrics of eutrophication level, and its total amount markedly affects the change in nutrient level, photosynthetic potential, and net primary productivity of waters [7,8]. Therefore, monitoring chlorophyll-a concentrations (Chla) has been widely recognized as a proactive and effective strategy for assessing eutrophication status and restoring aquatic ecosystems [5,9].
Numerous attempts, with various monitoring technologies, have been made to determine the Chla in water bodies [7,10,11,12,13,14,15]. Conventional Chla monitoring measures, primarily based on ground sampling and laboratory spectrophotometric analysis, are time-consuming and labor-expensive, and the corresponding results are confined to limited spatiotemporal scales, hindering the ability to understand the overall health of an aquatic ecosystem [7,8,16]. In comparison, the remote sensing technique is characterized by its high-efficiency, convenient data acquisition, and widespread coverage, affording spatially continuous views of various water quality parameters in a low-cost manner [17,18,19,20].
Previous studies have monitored the Chla using various remote sensing data, including medium resolution imaging spectrometer (MERIS, from 2003 to 2012) [10], ocean and land color imager (OLCI, from 2016 to present) [21], moderate resolution imaging spectrometer (MODIS, from 2000 to present) [22,23], and Landsat images (from 1984 to present) [7,24], while the latter two can provide data for more than 20 years. Some attempts have been made to document long-term Chla using Landsat series images in various settings [7,24]. However, due to the significant short-term variations in Chla and image unavailability caused by cloudy and rainy periods, the semi-monthly revisits of Landsat series images are not sufficient to track the long-term dynamics of Chla in inland waters, limiting their application in aquatic environments. With a high revisit frequency (1 day), MODIS images provide an encouraging opportunity to investigate and to track the dynamics of water quality parameters in more depth [25,26,27]. However, to date, no studies have used MODIS images to estimate long-term Chla, for up to 20 years.
Lake Taihu is a large and hypereutrophic inland water located in the Eastern Plain Region (EPR), China, providing a range of ecological and economical services to the region’s ecological and social systems, including nourishing organisms, transportation, and aquaculture activities [27,28]. Over the past two decades, it has been exposed to the threat of severe aquatic ecosystems degradation, due to the overloading of abundant terrestrial nutrients and extreme climatic conditions [17,29]. As a consequence, severe and frequent cyanobacterial blooms have occurred in Lake Taihu, causing undesirable ecological damage and aquatic environmental disasters [30,31]. As Chla is a crucial indicator for assessing water quality conditions [32,33], monitoring the long-term spatiotemporal dynamic of Chla in Lake Taihu and elucidating its drivers are of particular significance for water resource management and ecological restoration.
Therefore, this study aimed to (1) establish and validate a robust model for estimating Chla in eutrophic waters; (2) apply the proposed model to the eutrophic Lake Taihu, to obtain the spatiotemporal patterns of Chla based on 20 years of MODIS observations (2002–2021); and (3) clarify the driving factors of Chla, to improve future water quality management.

2. Study Area and Data Collection
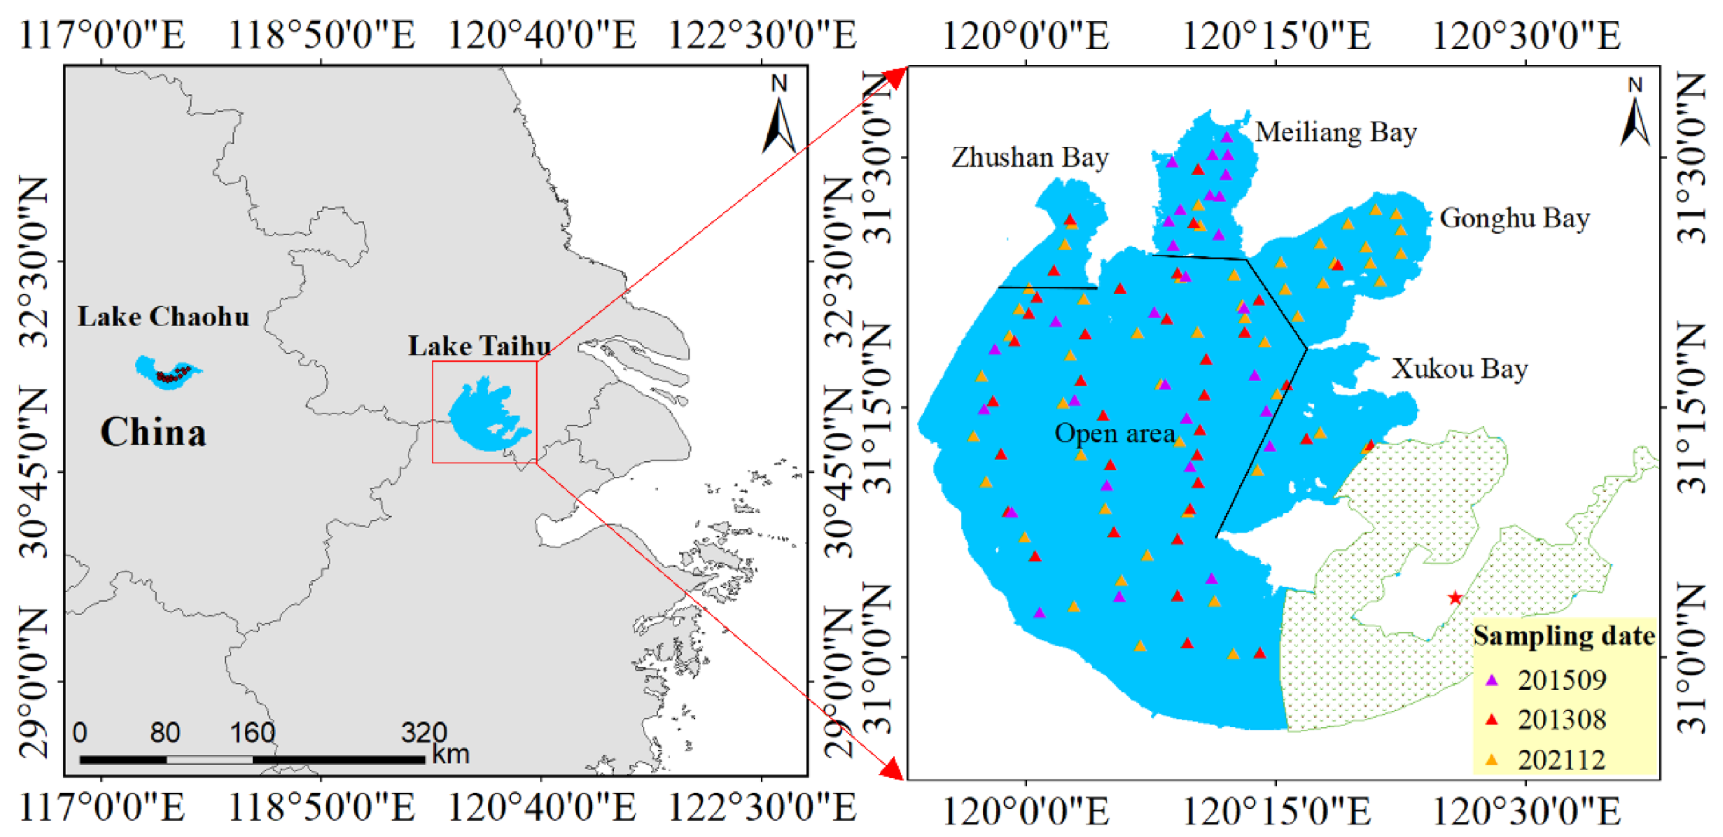
2.1. Study Area

Lake Taihu (119°55′–120°37′ E, 30°57′–31°34′ N, Figure 1) is located in the eastern part of China. It has a total water area of ~2340 km2, a lakeshore of 393.2 km, and a shallow mean depth (~1.9 m). It has a multi-year average air temperature of ~17.5 °C and an annual mean precipitation of 1000 mm [19,34]. Based on the geographical topography and aquatic ecosystem conditions, Lake Taihu was divided into five lake segments, including the Open Area, Zhushan Bay, Xukou Bay, Meiliang Bay, and Gonghu Bay. The southeastern region of Lake Taihu was excluded, because of the abundant submerged aquatic vegetation (Figure 1). In recent decades, environmental changes and economic development in the surrounding watershed have exerted tremendous pressure on the water quality of Lake Taihu.

2.2. Field-Measured Data

Three field measurements were made in Lake Taihu from August 2013 to December 2021 (Figure 1). Surface water samples (~30 cm) were obtained using well-washed Niskin bottles and stored at low temperature (±4 °C). Within the next few days, the Chla concentrations was determined [14,16]. The data measured in December 2021 (N = 60) and August 2013 (N = 34) were used to establish an optical estimation model, while the remaining data measured in September 2015 (N = 60) were applied to validate the model. Furthermore, another dataset (N = 30), collected in Lake Chaohu, was used to validate the model’s portability (Figure 1).
Three optical radiometric parameters, including the total surface radiance L t , the radiance of sky L s k y , and the gray panel reflectivity L p were collected using an ASD field spectroradiometer [35,36]. Subsequently, the remote sensing reflectance R r s λ could be derived, as shown below:
R r s λ = ρ p L t r a w L s k y / π L p
where r a w is the skylight reflectance between air and water, which is valued to 0.022 for calm weather [20,34]. To establish and validate the optical estimation model, the field-measured reflectance was calculated using corresponding simulated satellite reflectance, using the spectral response function [37,38].
Monthly hydro-meteorological data, covering air temperature (℃), sunshine duration (h), wind speed (m/s), and rainfall (mm) for the period 2002–2021 and collected by the meteorological station (red star, Figure 1) were freely downloaded from the National Meteorological Data Center archive (http://data.cma.cn/(accessed on 9 May 2022)). The anthropogenic activities data of the Taihu Basin, including amount of chemical fertilizer consumption (t), industrial sewage (t), and municipal wastewater (t) were also collected from the statistical yearbook of Jiangsu Province.

2.3. Satellite Data

A total of 1514 MODIS-Aqua images with time coverage from 2002 to 2021 were used to track temporal dynamic and long-term trends in the Chla concentration of the studied Lake Taihu, which can be freely downloaded from the NASA Goddard Space Flight Center archive (GSFC) (http://oceancolor.gsfc.nasa.gov/ (accessed on 9 May 2022)). With a modest spatial resolution of 250 m and fine revisit frequency of 1 day, MODIS-Aqua images are widely believed to represent superior satellite data for inland water quality variable estimation [39,40,41]. To ensure a high quality for latter applications, images containing significant clouds, thick aerosols, and sun glint were excluded and subsequently pre-processed to generate reflectance products, following the methods in prior studies [17,42]. In addition, the floating algae index (FAI) developed by Hu [43] was applied to capture and mask the image pixels with surface cyanobacterial blooms areas.

2.4. Statistical Analysis and Accuracy Assessment

Pearson’s correlation analysis was performed in SPSS software with a significance level of significant (t-test, p ≤ 0.05) or insignificant (p > 0.05). To quantitatively assess the implementation of the established algorithm, indicators including the coefficient of determination (R2), root mean square error (RMSE, μg/L), and mean absolute percentage error (MAPE, %) were adopted:
  M A P E = 1 n i = 1 n y m i y p i / y m e a s i 100 %
  R M S E = i = 1 n y m i y p i 2 n
where n is the number of water samples, and y m i and y p i are the field-measured and predicted values, respectively.
To calculate the potential driving factor(s) and quantitatively assess the contribution rates of the six explanatory variables to the long-term variations in Chla, a multiple generalized linear regression (MLR) and variation partitioning model was constructed followed the methods in previous studies [18,44].

3. Results

3.1. Model Establishment and Validation

To establish a high accuracy model for deriving Chla concentrations in Lake Taihu using MODIS atmospherically-corrected wavebands, three steps were adopted: (1) choosing the band/bands combinations as the spectral index, which is significantly related with Chla concentrations (p < 0.05); (2) establishing the corrections between the optimized spectral index and Chla using various mathematical functions; (3) determining the optimal relationship, by assessing the implementation of various mathematical functions.
Following the above-mentioned methods, the normalized spectral index of (Exp( R r s 645 − Exp( R r s 859 )/(Exp( R r s 645 + Exp( R r s 859 ) was found to have the highest correction coefficient with field-measured Chla (r = −0.82), and the empirical relationship model had the best estimated performance (R2 = 0.69, p < 0.05) (Figure 2a):
C PP = 7561.8 Index + 144.07
Index = Exp R r s 645 Exp R r s 859 / Exp R r s 645 + Exp R r s 859
where R r s 645 and R r s 859 are the MODIS atmospherically corrected bands at 645 and 859 nm, respectively.
In addition, the remaining field-measured data, collected in July 2021 (N = 20), were used to independently validate the developed model (Figure 2b). Three evaluating metrics, including R2, RMSE, and MAPE, were applied to quantitatively assess the developed model. The developed model showed an appreciable prediction performance with R2 = 0.69, MAPE = 29.98%, and RMSE = 12.95 μg/L, suggesting that the constructed model had great potential for Chla estimation and could be implemented to acquire and quantitatively analyze the spatiotemporal distribution patterns of Chla in Lake Taihu.
At the same time, many attempts have been made to investigate Chla in other waters [7,10,16,45] that have similar climate conditions to Lake Taihu. To examine whether the developed model would be applicable to other waters, we validated the algorithm using another field-measured dataset collected in Lake Chaohu (N = 30, Figure 1). The validated results showed that the MAPE and RMSE of the matching points between the field-measured and predicted Chla were 30.41% and 12.42 μg/L, respectively (Figure 2c), demonstrating that the developed model performed well and had promising applicability for the estimation of Chla in other waters.

3.2. Temporal Dynamics of Chla

The temporal dynamics of Chla in Lake Taihu were acquired based on the new algorithm (Figure 3, Table 1), demonstrating considerably spatiotemporal heterogeneity in spring (from March to May), summer (from June to August), autumn (from September to November), and winter (from December to February) during the studied period. The maximum value of monthly Chla was found in August (35.55 ± 7.81 μg/L), while the minimum was found in January (13.16 ± 7.51 μg/L). The seasonal average Chla in spring, summer, autumn, and winter were 22.31 ± 5.52 μg/L, 28.27 ± 7.43 μg/L, 25.74 ± 6.91 μg/L, and 20.52 ± 5.49 μg/L, respectively. Overall, the seasonal Chla values of Lake Taihu were highest in summer and lowest in winter.
The annual satellite-derived Chla products for the studied area are shown in Figure 4, indicating an overall increasing trend but a fluctuating variation of Chla during the observation period (2002–2021). An obvious increasing trend was found between 2002 and 2007, followed by a significant decrease between 2007 and 2009, a slow and insignificant increase between 2009 and 2014, and an obvious increasing trend between 2014 and 2017, indicating that these four years, including 2007, 2009, 2014, and 2017, were special turning point years. The maximum value for the entire lake was observed in 2017 at 35.75 ± 7.94 μg/L. In addition, moderate values were found in 2007, 2011, and 2019, at 31.12 ± 5.08, 32.58 ± 6.23, and 31.83 ± 4.25 μg/L, respectively. However, the lowest Chla was found in 2009 at 23.38 ± 4.13 μg/L. These results revealed that Lake Taihu experienced interesting inter-annual variations in its Chla concentrations.

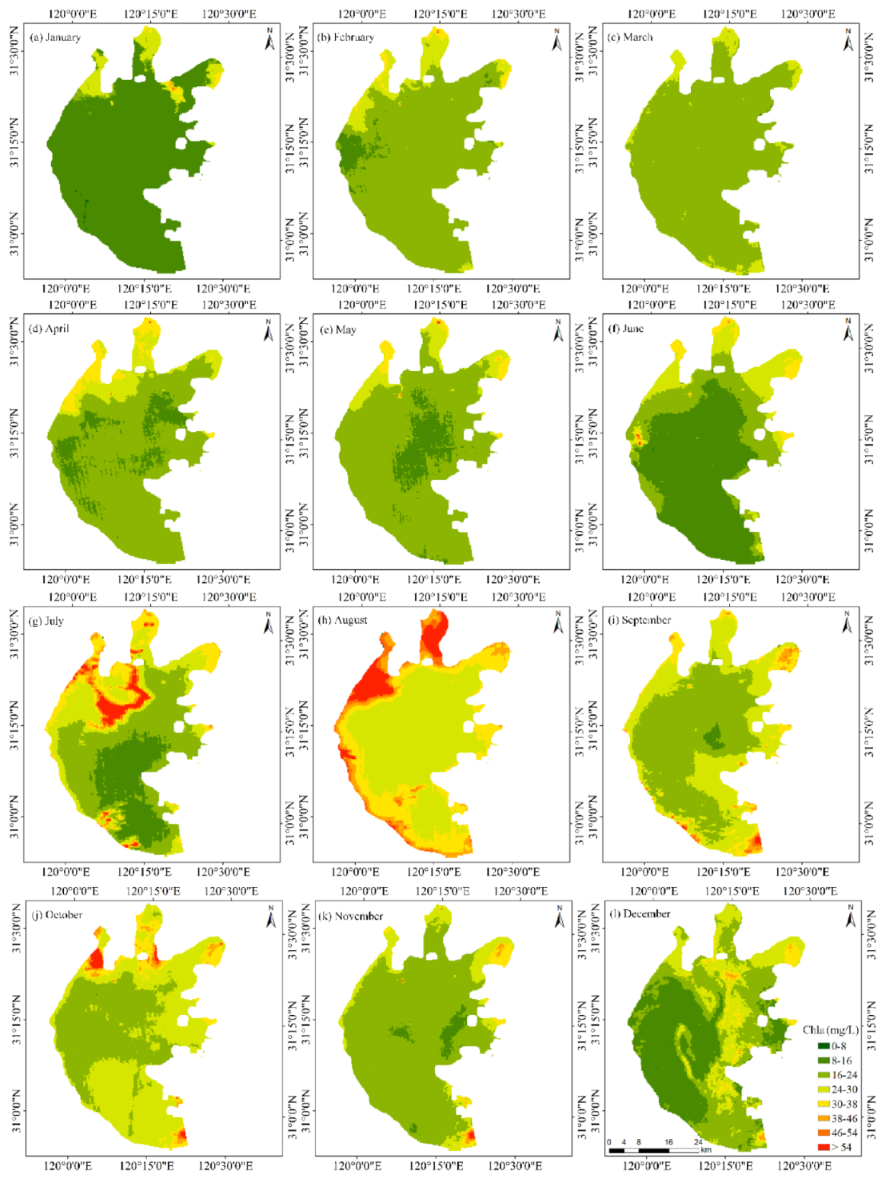
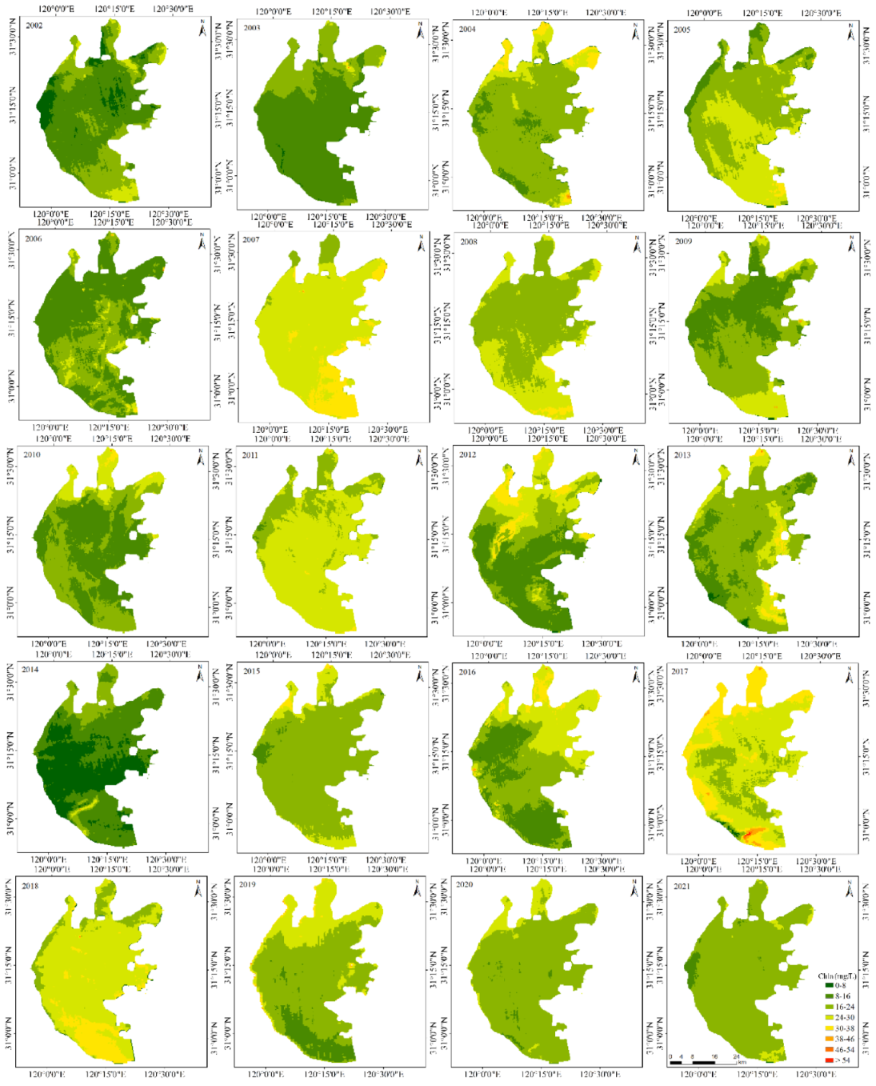
3.3. Spatial Distribution Characterization of Chla

The corresponding mean spatial distribution pattern of Chla was also determined by averaging all the satellite-obtained Chla products from 2002 to 2021, indicating an overall increasing gradient from the southern to northern parts of the lake, and from the center area to the edges of the lake (Figure 5a). The mean value across Lake Taihu for 20 years reached 29.26 μg/L, with a standard deviation (SD) of 5.42 μg/L. Specifically, relatively lower values were found in the Xukou Bay (18.95 ± 3.48 μg/L), whereas higher values were observed in the three northern regions, with means of 28.23 ± 6.83, 30.99 ± 9.65, and 33.51 ± 7.49 μg/L in Gonghu Bay, Meiliang Bay, and Zhushan Bay, respectively. According to the biological conditions in Lake Taihu, a high phytoplankton coverage with strong metabolic activity is distributed in these regions, which may have contributed to the higher Chla compared to that in the other regions. In addition, the north-northwest dominant wind directions in Lake Taihu may be another important reason for this phenomenon. The path of the wind in the three northern regions is longer than in the other areas, resulting in a smaller wind force, triggering more phytoplankton proliferation and leading to a higher Chla. Moreover, upstream runoff and inflowing rivers are mostly located in the western and northern parts of the lake, which may contribute to the massive nutrient and suspended matter levels in nearby areas, leading to higher Chla in these parts.
The corresponding spatial distribution information of the coefficient of variation (CV) was obtained based on all MODIS-derived Chla products during the observation period (Figure 5b). The CV values ranged from 0.25 to 88.35%, with a mean value of 10.01%, demonstrating a substantially spatial variation in the Chla of Lake Taihu. A relatively high CV for Chla was found in the northern three bays, the Meiliang, Gonghu, and Zhushan Bay, with the maximum values >80%, indicating that these regions experienced significant variations in Chla from 2002 to 2021. In contrast, a relatively lower CV was found in the southern and eastern parts (e.g., Xukou Bay), with a mean value of 4.83%, demonstrating the stable dynamic patterns of Chla in these areas, where the sediment aquatic ecosystem is stable and less susceptible to disturbance factors [20,36].

4. Discussion

4.1. The Intra-Annual Response of Chla to Drivers

Substantial multi-temporal dynamics of Chla were found in Lake Taihu during the observations period, exhibiting a relatively higher Chla in summer and autumn months, with lower Chla in the spring and winter months (Figure 4), which could be controlled by a variety of nature factors. Hydro-meteorological factors are considered important in explaining the temporal dynamics of Chla, particularly in hypereutrophic inland waters, where nutrient conditions are no longer the dominant limiting factor affecting the growth of phytoplankton [8,46]. In general, higher air temperatures and large amount of precipitation favor the growth of phytoplankton [16,25]. Previous studies revealed that Lake Taihu, similarly to other subtropical eutrophic waters on the Yangtze Plain, experiences typical temporal cyclic fluctuations in climatic conditions [47,48,49], which was further confirmed by the field-measured climatic data in this study (Figure 6). However, little information was obtained regarding their effect on monthly variations in Chla.
To assess the effect of drivers on the monthly dynamics of Chla, a correlation analysis between the satellite-estimated monthly Chla and the potential driving factors was performed (Figure 7). The relationships between monthly Chla and anthropogenic factors were not included in this section, due to unavailability of monthly anthropogenic data. Chla has a high and positive correlation with air temperature (r = 0.86, p < 0.05), demonstrating that air temperature may have a significant impact on the variations of Chla at monthly scale, which is consistent with prior studies [8,24]. High air temperatures are conducive to growth of phytoplankton and result in high Chla levels in the water column [50,51]. A significant positive relationship was also observed between Chla and precipitation, suggesting that precipitation is another important meteorological factor in the monthly dynamics of Chla. At the same time, a relatively weaker correlation coefficient value (r = 0.04, p < 0.05) was observed between wind speed and Chla, indicating that wind disturbance-induced sedimentation has little effect on monthly-scale Chla.

4.2. The Inter-Annual Response of Chla to Driving Factors

Over the last two decades, Lake Taihu has experienced significant fluctuations in climatic and anthropogenic conditions [27,52]. These findings suggested that an intense turbulence of environmental conditions and human activities occurred in Lake Taihu; however, what is the dominant driving factor of the long-term dynamics of Chla? To answer this question, Pearson correlation and multiple linear regression analyses between the satellite-derived annual mean Chla and driving factors were performed.
The annual mean Chla presented a significant and positive correlation with chemical fertilizer consumption, municipal wastewater, and industrial sewage, with correlation coefficients of r = 0.62, 0.68, and 0.41, respectively (Figure 7, Table 2), suggesting that these anthropogenic activities had a large impact on Chla variations. At the same time, Chla had close relationships with air temperature (r = 0.68, p < 0.05) and wind speed (r = 0.60, p < 0.05), which corroborated prior findings that shallow lakes are prone to increased wind speeds and higher air temperatures, resulting in the release of large amounts of nutrients from bottom sediments [18,37] and ultimately increasing Chla [53,54]. In contrast, a relatively weaker relationship was observed between the annual mean Chla and precipitation (r = 0.26, p < 0.05), suggesting that precipitation had less effect on the annual mean Chla during the observation period (2002–2021).
The long-term satellite-derived Chla was fit with all possible combinations of the six explaining variables using MLR, and five models were chosen based on the significance of the model and variables (Table 3). There were 6, 5, 5, 3, 2, 1 explanatory variables contained in Model 1, Model 2, Model 3, Model 4, Model 5, and Model 6, respectively. The findings suggest that these factors were promising predictors, which could explain the long-term dynamics of Chla. For example, in Model 6, municipal wastewater played an important role in the long-term dynamics of Chla, and could explain 48.8% of the Chla variation. Furthermore, the most appreciable model (Model 1), consisting of all the driving factors, explained 85.25% of the dynamics of the long-term trend of Chla, while only 14.75% was unexplained, suggesting a limited contribution from other factors to the changes in Chla. Of the 85.25% explained variation, precipitation accounted for 20.01%, municipal wastewater 11.66%, industrial sewage 21.85%, chemical fertilizer consumption 23.03%, and air temperature 7.49%, suggesting that human activities, rather than hydro-climatic change, play the dominant driving roles in the long-term dynamics of Chla in Lake Taihu.

4.3. Implications for the Results

In recent decades, with the rapid economic development and intense human activities in the watershed, the water quality of Lake Taihu has experienced substantial changes, leading to a series of ecological problems. Therefore, effective eutrophication control and efficient water resource management require rapid understanding of the overall health of aquatic ecosystems at the scale of decades. In this study, compelling temporal cycling patterns of Chla in Lake Taihu were obtained, based on a 20 year MODIS observation, and overall increasing trends of Chla were found over the past 20 years, which may be related to anthropogenic disturbances and significant climate changes. Furthermore, the relationship analysis of the driving factors and distribution characteristics of the long-term dynamics of Chla in Lake Taihu can provide a basis for other inland waters disturbed by eutrophication problems, such as the inland waters in the lower reaches of the Yangtze River Plain, Lake Gaoyou, and Lake Chaohu. Undoubtedly, these results can provide precious baseline data for water conservation activities and scientific management decision-making, and thus the restoration of the aquatic ecosystem in Lake Taihu.

5. Conclusions

In this study, we developed an optical model for Chla estimation in Lake Taihu based on 20 year MODIS and analyzed the spatiotemporal dynamics of Chla in the lake from 2002 to 2021. The validations indicated that the constructed model, based on the independent field-measured data, could be applied to estimate Chla with a satisfactory performance (MAPE = 29.98%, RMSE = 12.95 μg/L). The long-term MODIS observations demonstrated an overall increasing trend, but with a fluctuating variation, of Chla over the past two decades, and relatively higher mean values in summer (28.2 ± 7.43 μg/L) and autumn (25.7 ± 6.91 μg/L), while being lower in spring (22.3 ± 5.52 μg/L) and winter (20.5 ± 5.49 μg/L). The driving factor analysis showed the importance of the regulatory factors of industrial sewage, chemical fertilizer consumption, precipitation, air temperature, wind speed, and municipal wastewater for the Chla in Lake Taihu. The research results can provide some suggestions for the establishment of nutrient mitigation and eutrophication control strategies in inland waters.

Author Contributions

Software, Z.Q. and J.Y.; conceptualization, Z.Q.; methodology, Z.Q. and Q.S.; validation, Z.Q. and Q.S.; investigation, Z.Q. and Q.S.; writing—original draft, Z.Q.; writing—review and editing, Z.Q. and Q.S.; resources, B.R.; visualization, B.R. and Z.W.; funding acquisition, W.S. and Z.W. All authors have read and agreed to the published version of the manuscript.

Funding

This work was funded by the Central Fund Supporting Nonprofit Scientific Institutes for Basic Research and Development (PM-zx703-202104-051) and the Fundamental Research Funds for the Central Public Welfare Research Institutes (PM-zx703-202004-149).

Institutional Review Board Statement

Not applicable.

Informed Consent Statement

Not applicable.

Data Availability Statement

The data presented in this study are available on request from the corresponding author.

Acknowledgments

We thank NASA’s GSFC for providing MODIS data, and the China Meteorological Data Sharing Service System (http://cdc.cma.gov.cn/ (accessed on 9 May 2022)) for providing the hydro-meteorological data.

Conflicts of Interest

The authors declare no conflict of interest.

References

  1. Hu, M.; Ma, R.; Xiong, J.; Wang, M.; Cao, Z.; Xue, K. Eutrophication state in the Eastern China based on Landsat 35-year observations. Remote Sens. Environ. 2022, 277, 113057. [Google Scholar] [CrossRef]
  2. Saar, K.; Noges, P.; Sondergaard, M.; Jensen, M.; Jorgensen, C.; Reitzel, K.; Jeppesen, E.; Lauridsen, T.L.; Jensen, H.S. The impact of climate change and eutrophication on phosphorus forms in sediment: Results from a long-term lake mesocosm experiment. Sci. Total Environ. 2022, 825, 153751. [Google Scholar] [CrossRef] [PubMed]
  3. Dong, B.; Zhou, Y.; Jeppesen, E.; Qin, B.; Shi, K. Six decades of field observations reveal how anthropogenic pressure changes the coverage and community of submerged aquatic vegetation in a eutrophic lake. Sci. Total Environ. 2022, 842, 156878. [Google Scholar] [CrossRef] [PubMed]
  4. Li, N.; Zhang, Y.; Shi, K.; Zhang, Y.; Sun, X.; Wang, W.; Huang, X. Monitoring water transparency, total suspended matter and the beam attenuation coefficient in inland water using innovative ground-based proximal sensing technology. J. Environ. Manage. 2022, 306, 114477. [Google Scholar] [CrossRef] [PubMed]
  5. Mu, M.; Li, Y.; Bi, S.; Lyu, H.; Xu, J.; Lei, S.; Miao, S.; Zeng, S.; Zheng, Z.; Du, C. Prediction of algal bloom occurrence based on the naive Bayesian model considering satellite image pixel differences. Ecol. Indic. 2021, 124, 107416. [Google Scholar] [CrossRef]
  6. Du, C.; Shi, K.; Liu, N.; Li, Y.; Lyu, H.; Yan, C.; Pan, J. Remote Estimation of the Particulate Phosphorus Concentrations in Inland Water Bodies: A Case Study in Hongze Lake. Remote Sens. 2022, 14, 3863. [Google Scholar] [CrossRef]
  7. Li, Y.; Shi, K.; Zhang, Y.; Zhu, G.; Qin, B.; Zhang, Y.; Liu, M.; Zhu, M.; Dong, B.; Guo, Y. Remote sensing of column-integrated chlorophyll a in a large deep-water reservoir. J. Hydrol. 2022, 610, 127918. [Google Scholar] [CrossRef]
  8. Shi, K.; Zhang, Y.; Zhang, Y.; Qin, B.; Zhu, G. Understanding the long-term trend of particulate phosphorus in a cyanobacteria-dominated lake using MODIS-Aqua observations. Sci. Total Environ. 2020, 737, 139736. [Google Scholar] [CrossRef]
  9. Le, C.; Hu, C.; Cannizzaro, J.; English, D.; Muller-Karger, F.; Lee, Z. Evaluation of chlorophyll-a remote sensing algorithms for an optically complex estuary. Remote Sens. Environ. 2013, 129, 75–89. [Google Scholar] [CrossRef]
  10. Shen, F.; Zhou, Y.-X.; Li, D.-J.; Zhu, W.-J.; Suhyb Salama, M. Medium resolution imaging spectrometer (MERIS) estimation of chlorophyll-a concentration in the turbid sediment-laden waters of the Changjiang (Yangtze) Estuary. Int. J. Remote Sens. 2010, 31, 4635–4650. [Google Scholar] [CrossRef]
  11. Gentine, J.A.; Conard, W.M.; O’Reilly, K.E.; Cooper, M.J.; Fiorino, G.E.; Harrison, A.M.; Hein, M.; Moerke, A.H.; Ruetz, C.R.; Uzarski, D.G.; et al. Environmental predictors of phytoplankton chlorophyll-a in Great Lakes coastal wetlands. J. Great Lakes Res. 2022, 48, 927–934. [Google Scholar] [CrossRef]
  12. Kim, E.; Nam, S.-H.; Ahn, C.H.; Lee, S.; Koo, J.-W.; Hwang, T.-M. Comparison of spatial interpolation methods for distribution map an unmanned surface vehicle data for chlorophyll-a monitoring in the stream. Environ. Technol. Innov. 2022, 28, 102637. [Google Scholar] [CrossRef]
  13. Wu, T.; Qin, B.; Zhu, G.; Luo, L.; Ding, Y.; Bian, G. Dynamics of cyanobacterial bloom formation during short-term hydrodynamic fluctuation in a large shallow, eutrophic, and wind-exposed Lake Taihu, China. Environ. Sci. Pollut. Res. Int. 2013, 20, 8546–8556. [Google Scholar] [CrossRef]
  14. Matsushita, B.; Yang, W.; Yu, G.; Oyama, Y.; Yoshimura, K.; Fukushima, T. A hybrid algorithm for estimating the chlorophyll-a concentration across different trophic states in Asian inland waters. ISPRS J. Photogramm. Remote Sens. 2015, 102, 28–37. [Google Scholar] [CrossRef] [Green Version]
  15. Watanabe, F.S.; Alcantara, E.; Rodrigues, T.W.; Imai, N.N.; Barbosa, C.C.; Rotta, L.H. Estimation of Chlorophyll-a Concentration and the Trophic State of the Barra Bonita Hydroelectric Reservoir Using OLI/Landsat-8 Images. Int. J. Environ. Res. Public. Health 2015, 12, 10391–10417. [Google Scholar] [CrossRef] [Green Version]
  16. Zeng, S.; Li, Y.; Lyu, H.; Xu, J.; Dong, X.; Wang, R.; Yang, Z.; Li, J. Mapping spatio-temporal dynamics of main water parameters and understanding their relationships with driving factors using GF-1 images in a clear reservoir. Environ. Sci. Pollut. Res. Int. 2020, 27, 33929–33950. [Google Scholar] [CrossRef]
  17. Shi, K.; Zhang, Y.; Zhu, G.; Qin, B.; Pan, D. Deteriorating water clarity in shallow waters: Evidence from long term MODIS and in-situ observations. Int. J. Appl. Earth Obs. Geoinf. 2018, 68, 287–297. [Google Scholar] [CrossRef]
  18. Li, Y.; Shi, K.; Zhang, Y.; Zhu, G.; Zhang, Y.; Wu, Z.; Liu, M.; Guo, Y.; Li, N. Analysis of water clarity decrease in Xin’anjiang Reservoir, China, from 30-Year Landsat TM, ETM+, and OLI observations. J. Hydrol. 2020, 590, 125476. [Google Scholar] [CrossRef]
  19. Du, C.; Li, Y.; Lyu, H.; Liu, N.; Zheng, Z.; Li, Y. Remote estimation of total phosphorus concentration in the Taihu Lake using a semi-analytical model. Int. J. Remote Sens. 2020, 41, 7993–8013. [Google Scholar] [CrossRef]
  20. Wang, H.; Li, Y.; Zeng, S.; Cai, X.; Bi, S.; Liu, H.; Mu, M.; Dong, X.; Li, J.; Xu, J.; et al. Recognition of aquatic vegetation above water using shortwave infrared baseline and phenological features. Ecol. Indic. 2022, 136, 108607. [Google Scholar] [CrossRef]
  21. Smith, M.E.; Robertson Lain, L.; Bernard, S. An optimized Chlorophyll a switching algorithm for MERIS and OLCI in phytoplankton-dominated waters. Remote Sens. Environ. 2018, 215, 217–227. [Google Scholar] [CrossRef]
  22. Huang, C.; Zhang, Y.; Huang, T.; Yang, H.; Li, Y.; Zhang, Z.; He, M.; Hu, Z.; Song, T.; Zhu, A.X. Long-term variation of phytoplankton biomass and physiology in Taihu lake as observed via MODIS satellite. Water Res. 2019, 153, 187–199. [Google Scholar] [CrossRef] [PubMed]
  23. Qi, L.; Hu, C.; Duan, H.; Barnes, B.; Ma, R. An EOF-Based Algorithm to Estimate Chlorophyll a Concentrations in Taihu Lake from MODIS Land-Band Measurements: Implications for Near Real-Time Applications and Forecasting Models. Remote Sens. 2014, 6, 10694–10715. [Google Scholar] [CrossRef] [Green Version]
  24. Cao, Z.; Ma, R.; Melack, J.M.; Duan, H.; Liu, M.; Kutser, T.; Xue, K.; Shen, M.; Qi, T.; Yuan, H. Landsat observations of chlorophyll-a variations in Lake Taihu from 1984 to 2019. Int. J. Appl. Earth Obs. Geoinf. 2022, 106, 102642. [Google Scholar] [CrossRef]
  25. Shi, K.; Zhang, Y.; Zhou, Y.; Liu, X.; Zhu, G.; Qin, B.; Gao, G. Long-term MODIS observations of cyanobacterial dynamics in Lake Taihu: Responses to nutrient enrichment and meteorological factors. Sci. Rep. 2017, 7, 40326. [Google Scholar] [CrossRef] [Green Version]
  26. Li, N.; Shi, K.; Zhang, Y.; Gong, Z.; Peng, K.; Zhang, Y.; Zha, Y. Decline in Transparency of Lake Hongze from Long-Term MODIS Observations: Possible Causes and Potential Significance. Remote Sens. 2019, 11, 177. [Google Scholar] [CrossRef] [Green Version]
  27. Guo, H.; Liu, H.; Lyu, H.; Bian, Y.; Zhong, S.; Li, Y.; Miao, S.; Yang, Z.; Xu, J.; Cao, J.; et al. Is there any difference on cyanobacterial blooms patterns between Lake Chaohu and Lake Taihu over the last 20 years? Environ. Sci. Pollut. Res. Int. 2022, 29, 40941–40953. [Google Scholar] [CrossRef]
  28. Tao, S.; Fang, J.; Ma, S.; Cai, Q.; Xiong, X.; Tian, D.; Zhao, X.; Fang, L.; Zhang, H.; Zhu, J.; et al. Changes in China’s lakes: Climate and human impacts. Natl. Sci. Rev. 2020, 7, 132–140. [Google Scholar] [CrossRef] [Green Version]
  29. Wang, M.; Strokal, M.; Burek, P.; Kroeze, C.; Ma, L.; Janssen, A.B.G. Excess nutrient loads to Lake Taihu: Opportunities for nutrient reduction. Sci. Total. Environ. 2019, 664, 865–873. [Google Scholar] [CrossRef]
  30. Xy, A.; Yz, A.; Lu, Z.A.; Gz, A.; Bq, A.; Yz, A.; Jxa, B. Emerging role of dissolved organic nitrogen in supporting algal bloom persistence in Lake Taihu, China: Emphasis on internal transformations. Sci. Total Environ. 2020, 736, 139497. [Google Scholar]
  31. Xu, J.; Lei, S.; Bi, S.; Li, Y.; Lyu, H.; Xu, J.; Xu, X.; Mu, M.; Miao, S.; Zeng, S.; et al. Tracking spatio-temporal dynamics of POC sources in eutrophic lakes by remote sensing. Water Res. 2020, 168, 115162. [Google Scholar] [CrossRef]
  32. Song, K.; Lu, D.; Li, L.; Li, S.; Wang, Z.; Du, J. Remote sensing of chlorophyll-a concentration for drinking water source using genetic algorithms (GA)-partial least square (PLS) modeling. Ecol. Inform. 2012, 10, 25–36. [Google Scholar] [CrossRef]
  33. Shi, K.; Li, Y.; Li, L.; Lu, H.; Song, K.; Liu, Z.; Xu, Y.; Li, Z. Remote chlorophyll-a estimates for inland waters based on a cluster-based classification. Sci. Total Environ. 2013, 444, 1–15. [Google Scholar] [CrossRef]
  34. Zeng, S.; Lei, S.; Li, Y.; Lyu, H.; Dong, X.; Li, J.; Cai, X. Remote monitoring of total dissolved phosphorus in eutrophic Lake Taihu based on a novel algorithm: Implications for contributing factors and lake management. Environ. Pollut. 2022, 296, 118740. [Google Scholar] [CrossRef]
  35. Lei, S.; Wu, D.; Li, Y.; Wang, Q.; Huang, C.; Liu, G.; Zheng, Z.; Du, C.; Mu, M.; Xu, J.; et al. Remote sensing monitoring of the suspended particle size in Hongze Lake based on GF-1 data. Int. J. Remote Sens. 2018, 40, 3179–3203. [Google Scholar] [CrossRef]
  36. Zeng, S.; Du, C.; Li, Y.; Lyu, H.; Dong, X.; Lei, S.; Li, J.; Wang, H. Monitoring the particulate phosphorus concentration of inland waters on the Yangtze Plain and understanding its relationship with driving factors based on OLCI data. Sci. Total Environ. 2022, 809, 151992. [Google Scholar] [CrossRef]
  37. Lei, S.; Xu, J.; Li, Y.; Lyu, H.; Liu, G.; Zheng, Z.; Xu, Y.; Du, C.; Zeng, S.; Wang, H.; et al. Temporal and spatial distribution of Kd(490) and its response to precipitation and wind in lake Hongze based on MODIS data. Ecol. Indic. 2020, 108, 105684. [Google Scholar] [CrossRef]
  38. Cai, X.; Li, Y.; Bi, S.; Lei, S.; Xu, J.; Wang, H.; Dong, X.; Li, J.; Zeng, S.; Lyu, H. Urban Water Quality Assessment Based on Remote Sensing Reflectance Optical Classification. Remote Sens. 2021, 13, 4047. [Google Scholar] [CrossRef]
  39. Lei, S.; Xu, J.; Li, Y.; Du, C.; Liu, G.; Zheng, Z.; Xu, Y.; Lyu, H.; Mu, M.; Miao, S.; et al. An approach for retrieval of horizontal and vertical distribution of total suspended matter concentration from GOCI data over Lake Hongze. Sci. Total Environ. 2019, 700, 134524. [Google Scholar] [CrossRef]
  40. Liu, G.; Li, L.; Song, K.; Li, Y.; Lyu, H.; Wen, Z.; Fang, C.; Bi, S.; Sun, X.; Wang, Z.; et al. An OLCI-based algorithm for semi-empirically partitioning absorption coefficient and estimating chlorophyll a concentration in various turbid case-2 waters. Remote Sens. Environ. 2020, 239, 111648. [Google Scholar] [CrossRef]
  41. Zhang, Y.; Shi, K.; Zhou, Y.; Liu, X.; Qin, B. Monitoring the river plume induced by heavy rainfall events in large, shallow, Lake Taihu using MODIS 250m imagery. Remote Sens. Environ. 2016, 173, 109–121. [Google Scholar] [CrossRef]
  42. Zeng, S.; Lei, S.; Li, Y.; Lyu, H.; Xu, J.; Dong, X.; Wang, R.; Yang, Z.; Li, J. Retrieval of Secchi Disk Depth in Turbid Lakes from GOCI Based on a New Semi-Analytical Algorithm. Remote Sens. 2020, 12, 1516. [Google Scholar] [CrossRef]
  43. Hu, C. A novel ocean color index to detect floating algae in the global oceans. Remote Sens. Environ. 2009, 113, 2118–2129. [Google Scholar] [CrossRef]
  44. Wang, X.; Zhang, F. Multi-scale analysis of the relationship between landscape patterns and a water quality index (WQI) based on a stepwise linear regression (SLR) and geographically weighted regression (GWR) in the Ebinur Lake oasis. Environ. Sci. Pollut. Res. Int. 2018, 25, 7033–7048. [Google Scholar] [CrossRef] [PubMed]
  45. Feng, L.; Hu, C.; Han, X.; Chen, X.; Qi, L. Long-Term Distribution Patterns of Chlorophyll-a Concentration in China’s Largest Freshwater Lake: MERIS Full-Resolution Observations with a Practical Approach. Remote Sens. 2014, 7, 275–299. [Google Scholar] [CrossRef] [Green Version]
  46. Zhang, Y.; Qin, B.; Zhu, G.; Shi, K.; Zhou, Y. Profound Changes in the Physical Environment of Lake Taihu From 25 Years of Long-Term Observations: Implications for Algal Bloom Outbreaks and Aquatic Macrophyte Loss. Water Resour. Res. 2018, 54, 4319–4331. [Google Scholar] [CrossRef]
  47. Li, J.; Zhang, Y.; Ma, R.; Duan, H.; Loiselle, S.; Xue, K.; Liang, Q. Satellite-Based Estimation of Column-Integrated Algal Biomass in Nonalgae Bloom Conditions: A Case Study of Lake Chaohu, China. IEEE J. Sel. Top. Appl. Earth Obs. Remote Sens. 2017, 10, 450–462. [Google Scholar] [CrossRef]
  48. Yang, P.; Yang, C.; Yin, H. Dynamics of phosphorus composition in suspended particulate matter from a turbid eutrophic shallow lake (Lake Chaohu, China): Implications for phosphorus cycling and management. Sci. Total Environ. 2020, 741, 140203. [Google Scholar] [CrossRef]
  49. Bian, Y.; Zhao, Y.; Lyu, H.; Guo, F.; Li, Y.; Xu, J.; Liu, H.; Ni, S. Nineteen Years of Trophic State Variation in Large Lakes of the Yangtze River Delta Region Derived from MODIS Images. Remote Sens. 2021, 13, 4322. [Google Scholar] [CrossRef]
  50. Le, C.; Hu, C.; English, D.; Cannizzaro, J.; Kovach, C. Climate-driven chlorophyll-a changes in a turbid estuary: Observations from satellites and implications for management. Remote Sens. Environ. 2013, 130, 11–24. [Google Scholar] [CrossRef]
  51. Song, K.; Li, L.; Tedesco, L.P.; Li, S.; Duan, H.; Liu, D.; Hall, B.E.; Du, J.; Li, Z.; Shi, K.; et al. Remote estimation of chlorophyll-a in turbid inland waters: Three-band model versus GA-PLS model. Remote Sens. Environ. 2013, 136, 342–357. [Google Scholar] [CrossRef]
  52. Qin, B.; Deng, J.; Shi, K.; Wang, J.; Brookes, J.; Zhou, J.; Zhang, Y.; Zhu, G.; Paerl, H.W.; Wu, L. Extreme Climate Anomalies Enhancing Cyanobacterial Blooms in Eutrophic Lake Taihu, China. Water Resour. Res. 2021, 57, e2020WR029371. [Google Scholar] [CrossRef]
  53. Li, Y.; Zhang, Y.; Shi, K.; Zhou, Y.; Zhang, Y.; Liu, X.; Guo, Y. Spatiotemporal dynamics of chlorophyll-a in a large reservoir as derived from Landsat 8 OLI data: Understanding its driving and restrictive factors. Environ. Sci. Pollut. Res. Int. 2018, 25, 1359–1374. [Google Scholar] [CrossRef]
  54. Tang, Q.; Peng, L.; Yang, Y.; Lin, Q.; Qian, S.S.; Han, B.P. Total phosphorus-precipitation and Chlorophyll a-phosphorus relationships of lakes and reservoirs mediated by soil iron at regional scale. Water Res. 2019, 154, 136–143. [Google Scholar] [CrossRef]
Figure 1. The locations of the studied Lake Taihu and Lake Chaohu. The red star is the location of Dongshan meteorological station.
Sustainability 14 16874 g001
Figure 2. (a,b) Model calibration and validation in Lake Taihu, and (c) validation of the model’s transferability in Lake Chaohu.
Sustainability 14 16874 g002
Figure 3. (a–l) Monthly dynamics of Chla in Lake Taihu from 2002 to 2021.
Sustainability 14 16874 g003
Figure 4. The annual Chla of Lake Taihu during 2002–2021.
Sustainability 14 16874 g004
Figure 5. Spatial distribution patterns of (a) averaged Chla and (b) the coefficient of variation (CV).
Sustainability 14 16874 g005
Figure 6. Relationships between Chla and meteorological factors.
Sustainability 14 16874 g006
Figure 7. The relationships between annual Chla and (a) chemical fertilizer consumption, (b) municipal wastewater, (c) industrial sewage, (d) precipitation, (e) wind speed, and (f) air temperature during 2002–2021.
Sustainability 14 16874 g007
Table 1. Annual, seasonal, and monthly Chla of Lake Taihu from 2002 to 2021.
YearsChla (μg/L) Months and SeasonsChla (μg/L)
200225.86 ± 5.38January13.16 ± 7.51
200327.62 ± 6.24February21.78 ± 6.95
200428.47 ± 6.39March24.01 ± 6.87
200528.89 ± 6.62April26.17 ± 6.52
200627.83 ± 6.15May26.89 ± 5.96
200731.12 ± 5.08June32.71 ± 6.74
200828.19 ± 5.81July32.93 ± 7.28
200923.38 ± 4.13August35.55 ± 7.81
201030.24 ± 7.53September33.99 ± 7.52
201132.58 ± 6.23October30.65 ± 6.82
201232.48 ± 5.87November27.78 ± 5.42
201329.59 ± 6.42December16.1 ± 5.35
201430.99 ± 6.82Spring22.31 ± 5.52
201528.75 ± 5.63Summer28.27 ± 7.43
201632.86 ± 5.37Autumn25.74 ± 6.91
201735.75 ± 7.68Winter20.52 ± 5.49
201829.85 ± 6.83
201931.83 ± 4.25
202027.98 ± 5.63
202126.65 ± 5.34
Table 2. The relationships between Chla and chemical fertilizer consumption (CF), municipal wastewater (MW), industrial sewage (IS), precipitation (PR), wind speed (WS), and air temperature (AT) during 2002–2021. The statistical significance (p < 0.05) is marked by “*”.
ChlaCFMWISPRWSAT
Chla1620.680.410.260.60.68
CF*10.810.850.380.70.06
MW**10.710.530.630.17
IS***10.140.55−0.13
PR ** 10.41−0.12
WS*****10.05
AT* 1
Table 3. The relative contributions of the driving factors to the long-term change of Chla.
PRWSATMWCFISResidual
Model 120.01%1.17%7.49%11.66%23.03%21.85%14.75%
Model 218.16%-8.16%16.07%18.03%19.87%19.69%
Model 39.56%-8.60%17.17%19.80%22.27%22.59%
Model 45.79%--26.39%22.19%-45.61%
Model 520.24%--36.16%--43.58%
Model 6---48.82%--51.17%
Publisher’s Note: MDPI stays neutral with regard to jurisdictional claims in published maps and institutional affiliations.

