
Application of Forecasting as an Element of Effective Management in the Field of Improving Occupational Health and Safety in the Steel Industry in Poland


Department of Production Engineering, Silesian University of Technology, 40-019 Katowice, Poland
Sustainability 2022, 14(3), 1351; https://doi.org/10.3390/su14031351
Submission received: 29 October 2021
/
Revised: 13 January 2022
/
Accepted: 19 January 2022
/
Published: 25 January 2022
(This article belongs to the Special Issue Risk Management and Safety Engineering)
Abstract
:(1) Background: Every day, human beings fall victim to accidents. We implement solutions aimed at reducing accidents in everyday life, but we are not able to eliminate all accidents from our life. This article addresses the issue of forecasting accidents at work in the steel industry in Poland. Particular attention is paid to other accidents, given that those events are most often recorded in the sector under analysis. (2) Methods: The process of predicting quantitative data on the number of persons injured in other accidents in 2009–2018 employed Holt’s models: with an additive and multiplicative trend, with the trend smoothing effect in the multiplicative and additive formula. (3) Results: The forecasts prepared on the basis of Holt’s models and the combined model show a decreasing trend in the number of persons injured in other accidents in the steel sector, which is a positive development in the area of occupational safety and health. (4) Conclusions: The number of persons injured in other accidents at work in the steel sector shows a downward trend, which is significant and valid information for managers. The analysis of the results indicated that the combined forecast model best reflects the accidents at work in the steel industry.
1. Introduction
Ensuring safety in the workplace is one of the basic duties of the organizers of the work process—employers. Employers should limit and eliminate all occupational hazards and nuisances related to the performed work that cause accidents at work and occupational diseases. The occurrence of accidental events in enterprises generates social and economic costs [1,2] to be borne by all entities, including those that cooperate with the enterprise. Anyone who performs work may potentially sustain a work-related injury [3]. It seems appropriate to clarify at the outset what events are classified as accidents at work. Under Polish law [4], an accident at work is a sudden event caused by an external factor arising from work performed that results in injury or death. All the above features of the accident must occur simultaneously for an event to be considered an accident at work. The definition of the accident varies across different countries. There is agreement as to the urgency of the event and the external cause. The differences relate to the further part of the definition regarding damage, injury, or loss [2,5].
The investigation of accidents at work is still a relevant issue examined by many researchers. It concerns, among others, safety in individual sectors of the economy important for the country, such as construction [6,7], mining [8,9], food industry [10], steel industry [11], and agriculture [12]. Researchers also show interest in the influence of external factors, such as the economic situation, e.g., recession [13], on the accident rate in enterprises. In the case of high unemployment, workers are more likely to be dismissed and, therefore, fewer accidents are reported [13]. The culture of work safety (safety climate) plays an important role in the creation of safe working conditions aimed at reducing the number of accidents at work. Safety culture significantly affects the attitudes and behavior associated with increasing or reducing risk [14], and it hasanimpact on workers’ attitudes and behavior related to the current safety performance of the enterprise [15,16]. It is therefore hugely important that all workers engage in activities aimed at improving safety, which may lead to a reduction in the number of accidents at work because safety culture also applies to the value system of all participants of the work process [17].
The investigation of the accident rate subject to analysis [1,11,18,19] is based on the determination of accident rates—so-called accident indices. The determined values of the indices make it possible to compare enterprises, industries, and countries in terms of the number of reported accidents at work. The so-called accident indices (frequency index and severity index) are used for the purposes of an evaluation of the accident rate. The determination of the values of accident indices under investigation is related to the analysis of historical data. The conducted investigation provides top management with valuable information to be used both for informative and motivating purposes. The provision of information to workers on the in-house accident rate and comparing it between departments (branches) may be one of the elements of developing safety awareness and building a culture of work safety [20]. However, the provided information is still of a historical nature. Given the above, this study presents the possibility of adaptation of the forecasts in the area of occupational safety and health—analysis of accident statistics. The obtained forecasts will give employers information on how their activities (carried out over a long period of time) in the area of occupational safety and health relate to the number of accidents at work. The forecast analyses will provide employers with information in the form of a numerical value on what number of accidents is forecast for the period under investigation. The information thus obtained may serve as a warning, prompting the employer to action in the event that an increase in accidents at work is indicated (numerical values of the produced forecasts), which is above all the basic function of forecasts [21,22,23,24].
The term prognosis is derived from the Greek prognosis and means making a prediction based on specific data [23]. Prognoses are built on the basis of experts’ opinions or models that best describe, according to a “specific criterion”, the issue under analysis. The prognostic model provides a more or less accurate reflection of the real subject to analysis. Depending on the type of prognosis, its purpose, and the nature of the forecast phenomenon, various forecasting methods are used in practice. Given the above, in order to analyze the use of forecasting methods, a review of bibliometric databases was made, namely: Web of Science, Scopus, Google Scholar. Keywords “forecasting models”, “adaptation models”, “Holt’s model”, “Winters’ model”, “ARIMA model”, were entered in those databases. Prognostic models were applied to, inter alia, forecasting the processes of: steel production volume [25], Euro selling rate [26], exchange rates [27], economic cycles [28], revenue [29], sales of motorcycles [30], livestock and wheat prices [31], consumption of materials [32], forecasting of load in the electric industry [33], emission of organic water pollutants [34], telecommunication data [35], network anomaly detection [36], electric load [37], customer-credit evaluation [38], predicting lung cancer cases [39]. The bibliometric analysis, the type of the model, and its practical application are presented in Table 1. It does not list exhaustively all the possible applications of forecasting to the investigation of various phenomena.
The occurrence of accidents at work has a significant impact on the day-to-day operations of the enterprise, and consequently on its functioning. Understanding why accidents happen at work is the first step in preventing them. A favorable and competitive working environment may help the company in its day-to-day operations, as well as in achieving strategic goals [40]. This study, therefore, presents the possibility of adaptation of prognostic models in the area of accident rates as an option for planning and assessing the effectiveness of implemented preventive solutions aimed at improving work safety. The nationwide effectiveness of the implemented preventive solutions (technical, organizational) is assessed in the number of people injured in accidents at work, e.g., in the years for which forecasts have been made. Therefore, the designated forecasts may constitute important information enabling the assessment of the activities already implemented by employers in the field of improving working conditions. This study presents the possibilities of using prognostic models in terms of the number of people injured in accidents. However, the prediction can also be used in the scope of forecasting: the number of days of incapacity for work, causes of accidents, or accident rates.
The most common causes of accidents in the steel industry in Poland (including other accidents) include incorrect behavior of an employee, ignorance of health and safety hazards and regulations, disregard for hazards in the workplace, lack of experience, lack of concentration of employees [41]. Therefore, an important element is the implementation of preventive measures aimed at reducing the causes of accidents at work in the form of a combination of technical and organizational solutions. The assessment of the effectiveness of the implemented solutions is possible to observe thanks to the possibility of using the forecasted number of people injured in accidents, where the designated forecasts (number of injured persons) will indicate a probable trend (decreasing, increasing) or fluctuations (increasing, decreasing).
2. Materials and Methods
2.1. Research Subject
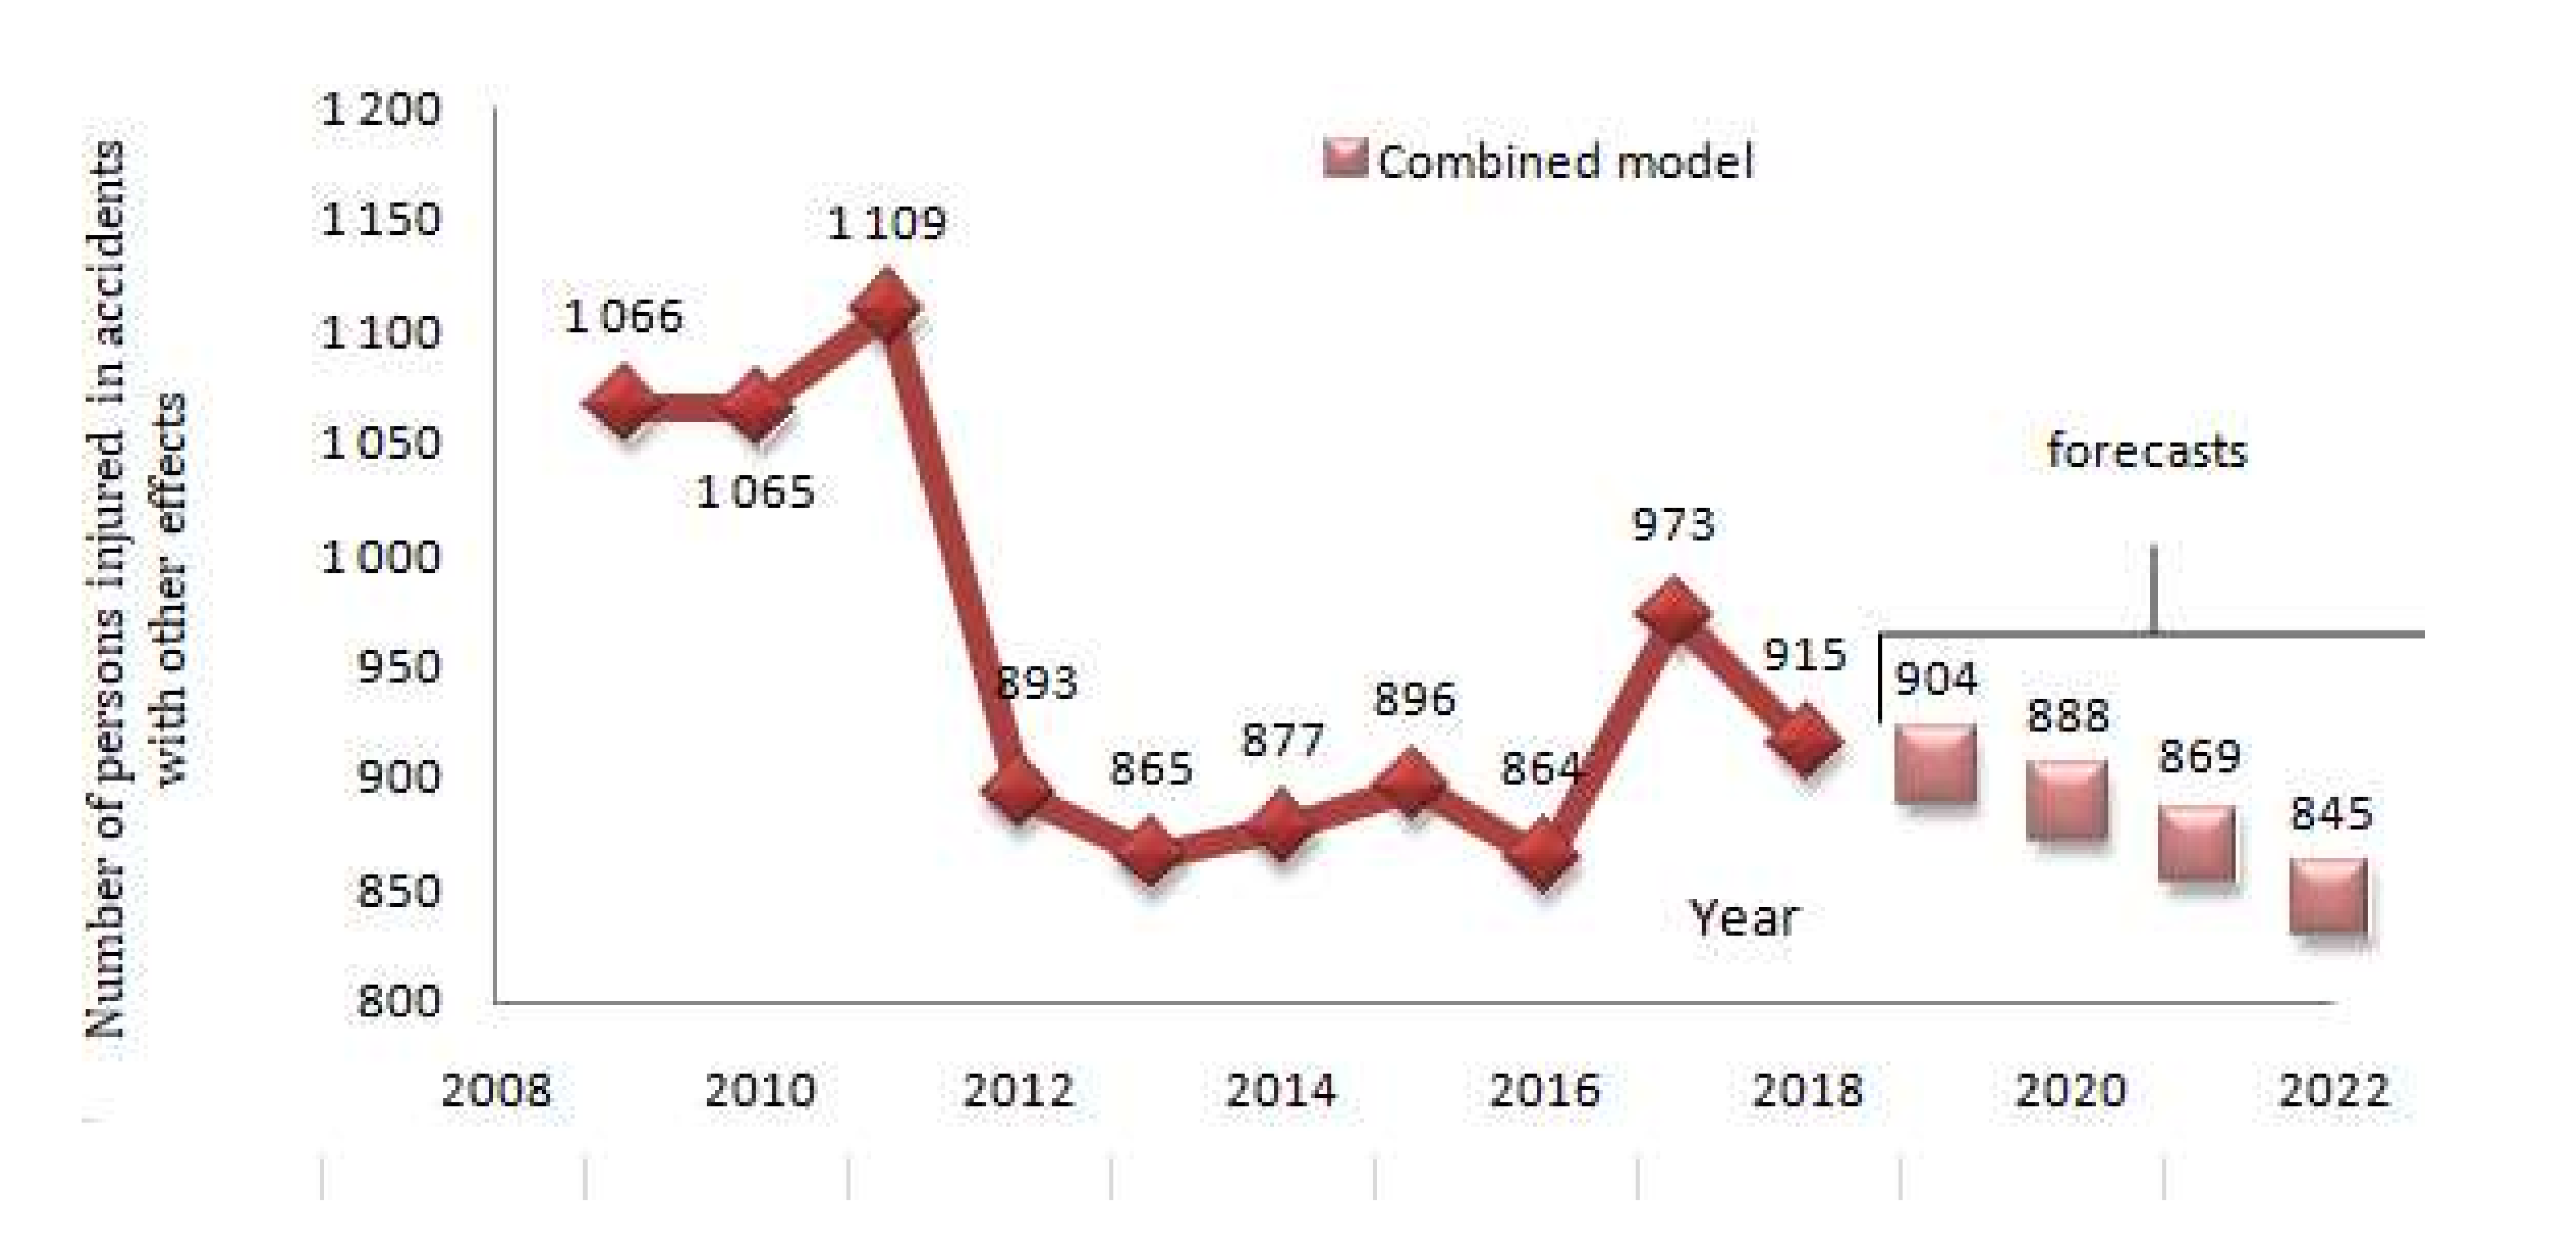
Other accidents (accidents resulting in short-term absenteeism) are events that were most often recorded in the steel sector in Poland in the years 2009–2018 under analysis. Those events are marked by fluctuations, i.e., an increase and decrease in the number of persons injured, which may not be viewed as positive information for managerial staff. The recorded fluctuations were due to the changes that occurred in the employment structure in the steel sector in Poland in the analyzed period. The largest number of persons injured in other accidents was reported in 2011 (1109 injured persons). Since that year, a decrease in the total number of persons injured in accidents was observed. In the years 2012–2016, the number of persons injured in other accidents did not exceed 900 cases. The year 2017 saw an increase in injuries—973 persons, followed by a decrease in 2018—i.e., 915 persons injured in other accidents. The number of persons injured in other accidents in the steel sector is presented graphically in Figure 1. Given the fact that those events prevail in the accident statistics of the steel sector in Poland, they were subjected to analysis in terms of forecasting the number of such events for the years 2019–2022.
The choice of the time period (ten years) was conditioned by the availability and consistency of data on accidents in the remaining steel sector in Poland. Since 2009, there have been changes in the classification of economic activities in Poland, and so, in 2008 the production of metals and metal products was mentioned, while from 2009, the area was related to the production of metals, which made it possible to compare the number of people injured in other accidents with each other.
2.2. Purpose and Methodology of Research
The aim of this study is to present the possibility of adapting Holt’s models in the process of forecasting the number of persons injured in other accidents (so-called minor accidents) in the steel sector in Poland. In connection with the above, a research methodology was developed, allowing the achievement of the objective pursued in this study. The research process was divided into steps (four-step process). The first step involved the development of prognostic models based on empirical data on the number of persons injured in other accidents (so-called minor accidents) in the steel sector in Poland—data obtained from Statistics Poland for the years 2009–2018 [41]. For the purposes of this study, the following models were developed [22,23,24,42,43]: Holt’s square model (M1), Holt’s model with a multiplicative trend (M2), Holt’s model with an additive trend (M3), Holt’s model for the trend smoothed in the additive formula (M4) Holt’s model for the trend smoothed in the multiplicative formula (M5).
In the second step, the accuracy of forecasts was assessed by means of ex post forecast errors used in the relevant literature on forecasting [21,22,23,24,26,43,44,45,46,47,48,49]:
- adjusted average relative ex post error Θ (1):
- mean error ψ (2):
- mean absolute error MAE (3):
- Rot Mean Square Error RMSE (4):
- adjusted average relative ex post error Θ—the error value should be in the range from <0–200%>;
- mean error ψ, the error value should not exceed 10%;
- mean absolute error MAE, the error value should satisfy the relationship that occurs between the measures—MAE ≤ RMSE;
- root mean square error (RMSE) takes values less than or equal to the standard deviation of the Se model residuals. The standard deviation of the model residuals is determined from the relationship (5):
The third step consisted in a qualitative analysis of expost forecasts and assessment of the validity of the developed forecasting models. The validity of the model was assessed using the Janus coefficient (J2), which determines the matching ratio of the forecasts and the model to the actual data. The econometric model is considered valid when the value J2 ≤ 1. Only a model for which the Janus coefficient is estimated at J2 ≤ 1 may be used for exante forecasts. Otherwise, it must be changed [22]. The Janus coefficient was determined on the basis of mathematical dependency (6):
where T is the number of the least period.
The fourth step involved the production of exante forecasts of the number of persons injured in other accidents for the models that fulfill the assumptions made in the second stage concerning the acceptability of expired forecast errors and the third stage dedicated to the assessment of the validity of the developed models. A combined forecast model defined by dependency (7) was constructed on the basis of the developed models. The combined model built on the basis of the developed Holt’s models contained “W” weights that were assigned to the exante forecasts. The sum of the weights was 1. The values of the weights depended on the value of expost forecast errors for the developed models (Table 2). The lower the expost error values, the higher the value for the “W” weight.
3. Results
3.1. Error Analysis and Evaluation of the Validity of the Developed Models
In compliance with research methodology (Section 2.2—Purpose and methodology of research), prognostic models were constructed (Table 2) for which ex post forecast errors were determined (Table 2, column 2–4). The analysis of Holt’s models, i.e., quadratic model (M1), model with a multiplicative trend (M2), additive trend (M3), and models with the trend expiration effect (M4 and M5) showed that the values of ex post forecast errors (Table 1) make it possible to consider the forecasts as acceptable. The values of the estimated errors were as follows:
- the mean error ψ was in a range between 5.8% for model (M5) and 6.3% for model (M1);
- the adjusted average relative ex post error Θ was in a range between 1.4% for model (M5) and 1.5% for the other Holt’s models (M1–M4);
- Root Mean Square Error RMSE values of expost forecast errors were in a range between 83.1 and 92.9 and did not exceed the values set for the standard deviation of the residuals of model Se (Table 2, column 6);
- the values of mean absolute error MAE were lower than the values of RMSE errors.
The developed models were also subject to a validity assessment. The values of the Janus coefficient (J2) were established for that purpose. In order to establish the value of the coefficient, the ex post period was divided into the trial period (the numerical value of the trial period was 5) and the testing period (the numerical value of the testing period was 4). The determined values of the Janus coefficient (Table 2, column 7–10) were lower than one (the highest value of the coefficient was J2 = 0.689 − model M4). Given the above, the models must be considered as valid and may be used for the determination of the value of ex ante forecasts.
3.2. Forecasts of the Number of Persons Injured in Other Accidents in the Years 2019–2022
Exante forecasts of the number of persons injured in other accidents in the steel sector in Poland were prepared (Table 3, column 2–5) on the basis of the developed prognostic models. The forecasting of the number of persons injured in other accidents with the use of Holt’s model involved the minimization of the mean error of expired forecasts ψ (Table 2, column 2). The optimal values for the smoothing parameters α, β as well as the trend expiration parameter Փ were selected on an individual basis for each model using Solver software (Table 3, column 6–8).
The determined values of exante forecasts of the number of persons injured in other accidents show a decreasing trend in relation to empirical data (Figure 1):
- model (M1) shows a decline in the number of persons injured in other accidents throughout the whole period considered. A drop of 1.3% is indicated in 2019 in relation to 2018, but in 2022, a significant drop of 36.7% is revealed in relation to 2018, which must be viewed as a very unlikely event;
- model (M2) shows a decreasing trend. A decline of 0.21% is indicated in 2019 in relation to 2018, whereas the year 2022 brings a drop of 2.2% in relation to 2018;
- model (M3) shows a decreasing trend in 2019–2022. A decline of 0.65% is indicated in 2019 in relation to 2018, whereas the year 2022 brings a decline of 3.2% in relation to 2018;
- model (M4) shows a decreasing trend in 2019–2021 (a drop of 2.1% in relation to 2018), but an increase in the number of persons injured in other accidents is indicated in 2022, i.e., 897 injured persons are recorded;
- model (M5) shows a decline throughout the whole period considered, in 2019, a drop of 2.3% in relation to 2018, whereas in 2022, a drop of 8.9% is revealed in relation to 2018.
The developed forecasting models allow for the conclusion that the number of persons injured in other accidents shows a downward trend, which is a positive forecast for the steel industry in Poland (Figure 2). In connection with the above, measures should be taken to improve occupational safety, ensuring that the forecast trend for the number of persons injured in other accidents (so-called minor accidents) is maintained.
3.3. Combination of Forecasts
A combination of forecasts of the number of persons injured in other (minor) accidents in the steel industry in Poland was carried out using mathematical dependency (7), which prescribes that the value of a combined forecast for a given year (Table 4, column 2–5) is the sum of the values of exante forecasts (Table 3), taking into account the assigned values of weights “λ”. The values of weights “λ” depend on the value of determined ex post errors (Table 2, column 2–5) calculated for models M1–M5. The adopted values of the weights were as follows: λ1 = 0.3 (model M5); λ2 = 0.25 (model M2); λ3 = 0.20 (model M3); λ4 = 0.15 (model M4); λ5 = 0.10 (model M1). Table 4 shows combined forecasts prepared for the number of persons injured in other accidents in the steel sector in Poland in 2019–2022.
The analysis of the combined forecasts for the number of persons injured in other accidents shows a downward trend (Figure 3), as is the case with the developed Holt models (M1-M5). As regards the combined model, the differences in individual years between the number of persons injured in other accidents may be considered acceptable due to the lack of significant declines. The forecast values provide guidance for the managerial staff and confirm the forecast trend of changes disclosed due to the analyses of models M1-M5. The combined forecasts show a decline in the number of persons injured in other accidents in relation to 2018 of, respectively, 1.2% in 2019, 2.9% in 2020, 5.0% in 2021, and 7.7% in 2022.
4. Discussion
The issue of work safety plays an important role in the functioning of every enterprise. This study presents the adaptation of Holt’s models to forecast the number of persons injured in other accidents in the steel sector in Poland. The developed prognostic models M1–M5 made it possible to prepare exante forecasts which may be subjected to an assessment once the data concerning the number of persons injured in other accidents in 2019–2022 is published. The obtained forecast values provide significant information for the managerial staff. The developed models show the continuation of the downward trend in 2019–2022, although significant decreases in the number of persons injured in other accidents are also revealed—model (M1) in 2022. Notably, the other models (M2–M5) do not indicate such a case. The knowledge on the accident rate suggests that this situation is unlikely to occur. In order to avoid the selection of the best model, a model of combined forecasts was developed. Its forecasts are more probable and may thus predict the number of persons injured in other accidents in the steel sector in Poland.
Analyzing the numerical values of the forecasts of the number of persons injured in other accidents in 2020, a scenario of models showing a visible decline in the number of injured persons in 2020 may be likely (Holt’s square model, Holt’s model with the trend expiration effect in the additive and multiplicative formula, combined model). These models show, respectively, M1 = 836, M4 = 873, M5 = 873, Mc = 888 persons injured in other accidents. That situation is probably due to the occurrence of infections caused by SARS-CoV-2 all over the world and in Poland, which led to production limitations and work stoppages. For example, steel production from January to June 2020 decreased by about 16% compared to 2019 [50]. The downward trend is also recorded in the years 2021–2022, in respect of which we do not have the necessary knowledge at present on what the situation related to infections, restrictions, and thus the implementation of production tasks will look like. The registered downward trend indicates the effectiveness of the implemented protective prophylaxis in relation to the most common causes of accidents at work (e.g., OHS training, shaping the health and safety culture, occupational risk assessment, technological improvements). It may also be useful to apply the other solutions provided, for example, in the lean manufacturing concept (e.g., 6S, TPM, OPL, VM, Kaizen) [51].
5. Conclusions
Analyzing the numerical values of the forecasts of the number of persons injured in other accidents in 2020, a scenario of models showing a visible decline in the number of injured persons in 2020 may be likely (Holt’s square model, Holt’s model with the trend expiration effect in the additive, and multiplicative formula, combined model). These models show, respectively, M1 = 836, M4 = 873, M5 = 873, and Mc = 888 persons injured in other accidents. That situation is probablydue to the occurrence of infections caused by SARS-CoV-2 all over the world and in Poland, which led to production limitations and work stoppages. For example, steel production from January to June 2020 decreased by about 16% compared to 2019 [50]. The downward trend is also recorded in the years 2021–2022, in respect of which we do not have the necessary knowledge at present on what the situation related to infections, restrictions, and thus the implementation of production tasks will look like.
The issue of work safety plays an important role in the functioning of any enterprise. The relative risk of accidents in the industrial sector (including steel) in Poland is estimated at the level of RR = 0.33. However, in other countries it is significantly lower: Latvia (RR = 0.15), Lithuania (RR = 0.12), and Bulgaria (RR = 0.052) [52]. Therefore, the risk of an accident at work is higher in Poland, and therefore all measures should be taken to reduce the number of accidents at work.
This study presents the adaptation of Holt’s models to forecast the number of persons injured in other accidents in the steel sector in Poland. The developed prognostic models M1–M5 made it possible to prepare exante forecasts that may be subjected to an assessment once the number of persons injured in other accidents in 2019–2022 is published. The obtained forecast values provide significant information for the managerial staff. The developed models show the continuation of the downward trend in 2019–2022, although significant decreases in the number of persons injured in other accidents are also revealed—model (M1) in 2022. Notably, the other models (M2–M5) do not indicate such a case. The knowledge on the accident rate suggests that this situation is unlikely to occur. In order to avoid the selection of the best model, a model of combined forecasts was developed. Its forecasts are more probable and may thus predict the number of persons injured in other accidents in the steel sector in Poland.
Funding
This research received no external funding.
Institutional Review Board Statement
Not applicable.
Informed Consent Statement
Not applicable.
Data Availability Statement
The data presented in this study are available on request from the corresponding author.
Acknowledgments
Silesian University of Technology (Faculty of Materials Engineering, Department of Production Engineering) supported this work as a part of Statutory Research BK-207/RM1/2022 (11/010/BK_22/0038).
Conflicts of Interest
The author declares no conflict of interest.
References
- Ceylan, H. Analysis of occupational accidents according to the sectors in Turkey. Gazi Univ. J. Sci. 2012, 25, 909–918. [Google Scholar]
- Feng, Y.; Zhang, S.; Wu, P. Factors influencing workplace accident costs of building projects. Saf. Sci. 2015, 72, 97–104. [Google Scholar] [CrossRef]
- Kim, J. Psychologicaldistress and occupational injury: Findings from the national health interview survey 2000–2003. J. Prev. Med. Public Health 2008, 41, 200–207. [Google Scholar] [CrossRef] [PubMed]
- Act of 30 October 2002 on social insurance of accidents at work and occupational diseases. Available online: https://isap.sejm.gov.pl (accessed on 10 October 2021).
- Szlązak, J.; Szlązak, N. Occupational Health and Safety; AGH: Cracow, Poland, 2012; p. 91. [Google Scholar]
- Whiteoak, W.J.; Mohamed, S. Employee engagement, boredom and frontline construction workers feeling safe in their workplace. Accid. Anal. Prev. 2016, 93, 291–298. [Google Scholar] [CrossRef] [Green Version]
- Arquillos, A.L.; Romero, J.C.R.; Gibb, A. Analysis of construction accident in Spain, 2003–2008. J. Saf. Res. 2012, 43, 381–388. [Google Scholar] [CrossRef] [Green Version]
- Blank, V.L.G.; Andersson, R.; Linden, A.; Nilsson, B.-C. Hidden accident rates and patterns in the Swedish mining industry due to involvement of contractor workers. Saf. Sci. 1995, 21, 23–35. [Google Scholar] [CrossRef]
- Bonsu, J.; Vyk, W.; Franzidis, J.-P.; Petersen, F.; Isafiade, A. A systemic study of mining accident causality: An analysis of 91 mining accidents form a platinum mine in South Africa. J. South Afr. Inst. Min. Metall. 2017, 117, 59–66. [Google Scholar] [CrossRef]
- Jacinto, C.; Canoa, M.; Soares, C.G. Workplace and organizational factors in accident analysis within the Food Industry. Saf. Sci. 2009, 49, 626–635. [Google Scholar] [CrossRef]
- Gajdzik, B.; Zwolińska, D.; Szymszal, J. Behavioural determinants of work accidents and absenteeism in a metallurgical enterprise. Metalurgija 2015, 54, 741–744. [Google Scholar]
- Facchinetti, D.; Santoro, S.; Galli, L.E.; Pessina, D. Agricultural Tractor Roll-Over Related Fatalities in Italy: Results from a 12 Years Analysis. Sustainability 2021, 13, 4536. [Google Scholar] [CrossRef]
- Boone, J.; van Ours, J.C. Are recessions good for workplace safety? J. Health Econ. 2006, 25, 1069–1093. [Google Scholar] [CrossRef] [PubMed] [Green Version]
- Guldenmund, F.W. The nature of safety culture: A review of theory and research. Saf. Sci. 2000, 34, 215–257. [Google Scholar] [CrossRef]
- Mohamed, S. Scorecard approach to benchmarking organizational safety culture in construction. J. Constr. Eng. Manag. 2003, 129, 80–88. [Google Scholar] [CrossRef]
- Nowacki, K. Safety Modeling in Industry; SUT: Gliwice, Poland, 2019; pp. 12–13. [Google Scholar]
- Nowacki, K. The impact of implemented management systems on the safety culture of work in production. Multidiscip. Asp. Prod. Eng. 2019, 2, 243–252. [Google Scholar] [CrossRef] [Green Version]
- Małysa, T. Work safety during usage, repair and maintenance of machines—A review of work safety in the aspect of accident at work. Sel. Asp. Prod. Eng. Manag. Mater. Eng. 2019, 2, 151–161. [Google Scholar] [CrossRef] [Green Version]
- Yoon, S.J.; Lin, H.K.; Chen, G.; Yi, S.; Choi, J.; Rui, Z. Effect of occupational health and safety Management System on work-related accident rate and differences of occupational health and safety management system awareness between managers in South Korea’s construction industry. Saf. Health Work. 2013, 4, 201–209. [Google Scholar] [CrossRef] [Green Version]
- Lis, T.; Nowacki, K. Occupational Health and Safety Management in an Industrial Plant; SUT: Gliwice, Poland, 2005; p. 188. [Google Scholar]
- Cieślak, M. Economic Forecasting. Methods and Application; PWN: Warsaw, Poland, 2001; pp. 71–72. [Google Scholar]
- Dittmann, P. Forecasting in the Enterprise—Methods and Their Application; Nieoczywiste: Warsaw, Poland, 2016. [Google Scholar]
- Sobczyk, M. Prognozowanie—Teoria. Przykłady. Zadania; Placet: Warsaw, Poland, 2008. [Google Scholar]
- Nowak, E. Economic Forecasting—Methods, Models, Applications, Examples; Placet: Warsaw, Poland, 1998. [Google Scholar]
- Gajdzik, B.; Szymszal, J. Prognosis of steel production and employment in the steel market using C.C. Holt method. Organ. Manag. 2016, 1, 23–38. [Google Scholar]
- Halicka, K.; Winkowski, C. The use of exponential smoothing methods for forecasting EUR sell rate. Econ. Manag. 2013, 2, 70–80. [Google Scholar] [CrossRef]
- Ortiz, R.L.P. The accuracy rate of Holt—Winters model with particle swarm optimization in forecasting exchange rates. J. Comput. 2016, 11, 215–224. [Google Scholar] [CrossRef] [Green Version]
- Agapie, A.; Agapie, A. Forecasting the Economic cycles Based on an Extension of the Holt—Winters Model. A Genetic Algorithms Approach. In Proceeding of the IEEE/IAFE 1997 Computational Intelligence for Financial Engineering, New York, NY, USA, 24–25 March 1997; pp. 96–99. [Google Scholar]
- Rachman, H.; Salma, U.; Hossain, M.; Khan, T.F. Revenue forecasting using Holt—Winters exponential smoothing. Res. Rev. J. Stat. 2016, 5, 19–25. [Google Scholar]
- Puthran, D.; Shivaprasead, H.C.; Kumar, K.S.K.; Manjunath, M. Comparing SARIMA and Holt-Winters’ forecasting accuracy with respect to Indian motorcycle industry. Trans. Eng. Sci. 2014, 2, 25–28. [Google Scholar]
- Kohzadi, N.; Boyd, M.S.; Kermanshahi, B.; Kaastra, I. A comparison of artificial neural network and time series models for forecasting commodity prices. Neurocomputing 1996, 10, 169–181. [Google Scholar] [CrossRef]
- Yang, Y.; Wang, W.; Gup, C. Forecasting of air material consumption based on Winters exponential smoothing model. Adv. Eng. Res. 2017, 118, 695–698. [Google Scholar] [CrossRef] [Green Version]
- Ramos, S.; Soares, J.; Vale, Z.; Ramos, S. Short—Term Load Forecasting Based on Load Profiling. In Proceedings of the 2013 IEEE Power and Energy Society General Meeting, Vancouver, BC, Canada, 21–25 July 2013; pp. 1–5. [Google Scholar]
- Paraschiv, D.; Tudor, C.; Petrariu, R. The textile industry and sustainable development: A Holt—Winters forecasting investigation for the eastern European area. Sustainability 2015, 7, 1280–1291. [Google Scholar] [CrossRef] [Green Version]
- Madden, G.; Tan, J. Forecasting telecommunications data with linear models. Telecommun. Policy 2007, 31, 31–44. [Google Scholar] [CrossRef] [Green Version]
- Pena, E.H.M.; De Assis, M.V.O.; Proença, M.L. Anomaly Detection using Forecasting methods ARIMA and HWDS. In Proceedings of the 2013 32nd International Conference of the Chilean Computer Science Society, Temuco, Chile, 11–15 November 2013; pp. 63–66. [Google Scholar]
- Wang, J.; Zhu, S.; Zhang, W.; Lu, H. Combined modeling for electric load forecasting with adaptive particle swarm optimization. Energy 2010, 36, 1671–1678. [Google Scholar] [CrossRef]
- Zhu, G.; Zheng, C.; Hui, H.; Wei, G.; Shen, J. A Kind of Demand Forecasting Model Based on Holt—Winters Model and Customer—Credit Evaluation Model. In Proceedings of the 2006 International Conferences on Service and System and Service Management, Troyes, France, 25–27 October 2006. [Google Scholar]
- Wah, W.; Stirling, R.G.; Ahern, S.; Earnest, A. Forecasting of Lung Cancer Incident Cases at the Small-Area Level in Victoria, Australia. Int. J. Environ. Res. Public Health 2021, 18, 5069. [Google Scholar] [CrossRef]
- Zakaria, N.H.; Mansor, N.; Abdullah, Z. Workplace accident in Malaysia: Most common causes and solutions. Bus. Manag. Rev. 2012, 2, 75–88. [Google Scholar]
- Statistic Poland. Available online: www.stat.gov.pl (accessed on 2 July 2021).
- Snarska, A. Statistics, Econometrics, Forecasting. Exercises with Excel; Placet: Warsaw, Poland, 2005. [Google Scholar]
- Krawiec, S. AdaptacyjneModeleWygładzaniaWykładniczegoJako Instrument PrognozowaniaKrótkoterminowegoZjawiskIlościowych; SUT: Gliwice, Poland, 2014. [Google Scholar]
- Małysa, T. Use Holt’s model for forecasting until 2023 occupational accidents in the metallurgical industry in Poland. Metalurgija 2020, 59, 578–580. [Google Scholar]
- Liu, C.; Sun, B.; Zhang, C.; Li, Z. A hybrid prediction model for residential electricity consumption using Holt-Winters and extreme learning machine. Appl. Energy 2020, 275, 115383. [Google Scholar] [CrossRef]
- Luo, Z.; Guo, W.; Liu, Q.; Zhang, Z. A hybrid model for financial time-series forecasting based on mixed methodologies. Expert Syst. 2020, 38, 115383. [Google Scholar] [CrossRef]
- Gunter, U.; Önder, I.; Smeral, E. Are Combined Tourism Forecasts Better at Minimizing Forecasting Errors? Forecasting 2020, 2, 12. [Google Scholar] [CrossRef]
- Zhang, R.; Guo, Z.; Meng, Y.; Wang, S.; Li, S.; Niu, R.; Wang, Y.; Guo, Q.; Li, Y. Comparison of ARIMA and LSTM in Forecasting the Incidence of HFMD Combined and Uncombined with Exogenous Meteorological Variables in Ningbo, China. Int. J. Environ. Res. Public Health 2021, 18, 6174. [Google Scholar] [CrossRef] [PubMed]
- Małysa, T.; Gajdzik, B. Predictive Models of Accidents at Work in the Steel Sector as a Framework for Sustainable Safety. Energies 2021, 14, 129. [Google Scholar] [CrossRef]
- Gajdzik, B. Steel production in Poland with pessimistic forecasts in COVID-19 crisis. Metalurgija 2021, 60, 169–172. [Google Scholar]
- Małysa, T.; Furman, J. Application of selected Lean Manufacturing (LM) tools for the improvement of work safety in the steel industry. Metalurgija 2021, 60, 434–436. [Google Scholar]
- Nowacki, K. Accident risk in the production sector of EU countries—Cohort studies. Int. J. Environ. Res. Public Health 2021, 18, 3618. [Google Scholar] [CrossRef]
Figure 1.
Number of people injured in accidents remaining the steel sector in Poland in 2009–2018 (own elaboration based on Statistic Poland [41]).
Figure 1.
Number of people injured in accidents remaining the steel sector in Poland in 2009–2018 (own elaboration based on Statistic Poland [41]).

Figure 2.
The number of persons injured in other accidents in the steel sector in Poland, with regard to forecasts produced on the basis of Holt’s models, M1–M5 (own elaboration).
Figure 2.
The number of persons injured in other accidents in the steel sector in Poland, with regard to forecasts produced on the basis of Holt’s models, M1–M5 (own elaboration).

Figure 3.
The numberof persons injured in other accidents in the steel sector in Poland with regard to forecasts prepared on the basis of the combined model (Mc).
Figure 3.
The numberof persons injured in other accidents in the steel sector in Poland with regard to forecasts prepared on the basis of the combined model (Mc).

Table 1.
Selected applications of prognostic models—literature review.
| Authors, Year of Publication | Type of Model | Application |
|---|---|---|
| Gajdzik et al., 2016 [25] | Holt’s model | forecasting the volume of steel production |
| Halicka et al., 2013 [26] | forecasting the Euro sales rate | |
| Agapie et al., 1997 [28] | forecasting economic cycles | |
| Rachman et al., 2016 [29] Yang et al., 2017 [32] | revenue forecasting forecasting for air material consumption | |
| Putharn et al., 2014 [30] Ramos et al., 2013 [33] | Holt–Winters model/ Winters model | forecasting motorcycle sales forecasting of load in the electric industry |
| Paraschiv et al., 2015 [34] Ortiz 2016 [27] | forecasting emission of organic water pollutants forecasting exchange rates | |
| Madden et al., 2007 [35] | linear model | telecommunications data forecasting |
| Wah et al., 2021 [39] | Bayesian spatio-temporal models | predicting lung cancer cases |
| Pena et al., 2013 [36] | ARIMA neutral networks | forecasting the detection of network anomalies |
| Kohzadi et al., 1996 [31] | forecasting of livestock and wheat prices | |
| Wang et al., 2010 [37] Zhu et al., 2016 [38] | combined model | electric load forecasting forecasting customer-credit evaluation |
Table 2.
Values of ex post forecast errors and Janus coefficient J2 (own elaboration).
| Forecasting Model (Model Designation) | Designated ex Post Forecast Errors | Se | Coefficient Values J2 | ||||||
|---|---|---|---|---|---|---|---|---|---|
| Ψ, % | Θ, % | RMSE | MAE | 2015 | 2016 | 2017 | 2018 | ||
| 1 | 2 | 3 | 4 | 5 | 6 | 7 | 8 | 9 | 10 |
| Holt’s square model (M1) | 6.3 | 1.5 | 92.9 | 58.4 | 105.4 | 0.000 | 0.082 | 0.471 | 0.438 |
| Holt’s model with a multiplicative trend (M2) | 6.1 | 1.5 | 86.2 | 56.5 | 97.7 | 0.128 | 0.065 | 0.529 | 0.400 |
| Holt’s model with an additive trend (M3) | 6.1 | 1.5 | 87.1 | 56.2 | 98.7 | 0.155 | 0.077 | 0.577 | 0.433 |
| Holt’s model for the trend smoothed in the additive formula (M4) | 6.2 | 1.5 | 84.1 | 57.9 | 95.3 | 0.171 | 0.097 | 0.689 | 0.569 |
| Holt’s model for the trend smoothed in the multiplicative formula (M5) | 5.8 | 1.4 | 83.1 | 53.9 | 94.2 | 0.117 | 0.061 | 0.604 | 0.453 |
Table 3.
Forecasts of the number of persons injured in other accidents (minor accidents), smoothing parameters α, β, and trend expiration parameter Փ (own elaboration).
Table 3.
Forecasts of the number of persons injured in other accidents (minor accidents), smoothing parameters α, β, and trend expiration parameter Փ (own elaboration).
| Forecasting Model (Model Designation) | Forecasts | Model Parameters | |||||
|---|---|---|---|---|---|---|---|
| 2019 | 2020 | 2021 | 2022 | α | β | Փ | |
| 1 | 2 | 3 | 3 | 5 | 6 | 7 | 8 |
| Holt’s square model (M1) | 903 | 836 | 728 | 579 | 0.85 | 0.05 | 0.60 |
| Holt’s model with a multiplicative trend (M2) | 913 | 907 | 901 | 895 | 0.65 | 0.12 | - |
| Holt’s model with an additive trend (M3) | 909 | 901 | 893 | 886 | 0.63 | 0.12 | - |
| Holt’s model for the trend smoothed in the additive formula (M4) | 896 | 896 | 896 | 897 | 0.96 | 0.16 | 0.39 |
| Holt’s model for the trend smoothed in the multiplicative formula (M5) | 894 | 873 | 853 | 833 | 0.69 | 0.01 | 0.99 |
Table 4.
Combined forecast values(own elaboration).
| Forecasting Model (Model Designation) | Forecasts | |||
|---|---|---|---|---|
| 2019 | 2020 | 2021 | 2022 | |
| 1 | 2 | 3 | 3 | 5 |
| Combined model (Mc) | 904 | 888 | 869 | 845 |
Publisher’s Note: MDPI stays neutral with regard to jurisdictional claims in published maps and institutional affiliations. |
© 2022 by the author. Licensee MDPI, Basel, Switzerland. This article is an open access article distributed under the terms and conditions of the Creative Commons Attribution (CC BY) license (https://creativecommons.org/licenses/by/4.0/).
Share and Cite
MDPI and ACS Style
Małysa, T. Application of Forecasting as an Element of Effective Management in the Field of Improving Occupational Health and Safety in the Steel Industry in Poland. Sustainability 2022, 14, 1351. https://doi.org/10.3390/su14031351
AMA Style
Małysa T. Application of Forecasting as an Element of Effective Management in the Field of Improving Occupational Health and Safety in the Steel Industry in Poland. Sustainability. 2022; 14(3):1351. https://doi.org/10.3390/su14031351
Chicago/Turabian StyleMałysa, Tomasz. 2022. "Application of Forecasting as an Element of Effective Management in the Field of Improving Occupational Health and Safety in the Steel Industry in Poland" Sustainability 14, no. 3: 1351. https://doi.org/10.3390/su14031351
Note that from the first issue of 2016, this journal uses article numbers instead of page numbers. See further details here.