
Designing with Ecosystem Modelling: The Sponge District Application in İzmir, Turkey


Laboratory od Ecosystem Planning and Circular Adaptation—Lab EPiCA, City and Regional Planning Department, İzmir Institute of Technology, Urla 35430, Turkey
*
Author to whom correspondence should be addressed.
Sustainability 2022, 14(6), 3420; https://doi.org/10.3390/su14063420
Submission received: 14 February 2022
/
Revised: 11 March 2022
/
Accepted: 13 March 2022
/
Published: 15 March 2022
(This article belongs to the Special Issue Designing Resilient Cities by Ecosystem Service Mapping)
Abstract
:Climate change is threatening coastal cities affected by multiple hazards worldwide. Due to the increase in extreme weather events and the low capacity of cities to adapt to these odds, losses, exposure, and fatalities arise with the occurred events. Besides, traditional hazard mapping and risk planning techniques often fall behind when facing a climate crisis since extreme changes in quantity, frequency, and distribution of meteorological phenomena are observed. Specific and localized flood vulnerability mitigation strategies need to be developed, particularly for settlements on coastal and sloppy areas with a high risk of stream accumulation during rainfall days. This paper uses the urban flood risk mitigation of Integrated Valuation of Ecosystem Services and Tradeoffs (InVEST) generated within the Natural Capital Project to determine İzmir’s cloudburst vulnerability level. The city has experienced several cloudbursts in the last couple of months which inundated densely populated areas. The soil’s hydrologic conductibility and the land use/land cover (LULC) map were required as main inputs. The LULC map was produced on the basis of surface imperviousness. The model calculates the run-off volume and how much is retained by soil and vegetation. Outputs were used to concretely apply the sponge district concept while designing performance-based ecosystem solutions. In the light of the findings, the new performance-based design demonstrated how digital ecosystem modelling could support the urban design decision-making process.
1. Introduction
As introduced by Rosenzweig et al. [1], cloudburst events represent one of the most potentially dangerous conditions for coastal cities worldwide [2,3]. In fact, climate change is rapidly augmenting the number of extreme events while exposing the densely inhabited coastal areas to potential damages and dangerous situations [4,5,6]. Besides, mountainous coastal cities have an idiosyncratic vulnerability to be flooded, here intended as the propensity of an urban system to be inundated during a cloudburst event [7,8,9]. In particular, numerous high-dense Mediterranean urban areas are developed on hillside terrains along the coastline, on poorly hydraulically-conductible soils, with a limited capacity to drain the rainwater and a favorable terrain to create run-off streams [10,11,12].
Among these cities, İzmir (Turkey) represents a peculiar case since the city is experiencing one of the fastest land-use change transformations over the last thirty years. The urbanization process between 1990 and 2018 in the entire Province of İzmir involved more than 33 thousand hectares of land converted from agricultural or natural/semi-natural function into urban uses [13]. The growth rate of the artificial land reached 99.3%, which means the city almost doubled in size in less than thirty years. Unfortunately, the urbanization process only partially occurred in agricultural areas (26 thousand hectares), since a relevant share of urbanization also happened in the natural and semi-natural Mediterranean environment surrounding this part of Turkey [14,15]. What is worse is that these numbers probably underestimate the real proportion of the urbanization process since, as has been demonstrated by several authors, Corine Land Cover has several gaps while being used for land take estimation at the urban scale [16,17]. At the same time, the population of İzmir has been increased by 60.3% [18], which indicates that this part of the Mediterranean basin is undertaking a dynamic of fast changes that lead to increasing vulnerability conditions (increased soil sealing) and an increase in the exposure as well (higher population density).
Unfortunately, this fast development occurs with insufficient knowledge of the effects of ecosystems vulnerability [19,20], and without any real comprehension of the aforementioned massive urbanization’s spatial effects on the natural environment [21]. Although important initiatives are taken at the metropolitan scale, a real spatial integration of ecosystem vulnerability into the decision-making process that shapes the plans and projects is still lacking [22,23], especially regarding the problem of cloudburst flooding vulnerability. The threat is even more serious because of the specific climatic conditions of Izmir: a typical dry Mediterranean climate with a concentration of huge rain phenomena between November and March [24]. The threat is not specific for İzmir: it is a well—known problem all over the world. To cope with these odds and reduce its effects worldwide, agreements like the international Paris Agreement have been signed [25] by many countries. Additionally, it has been demonstrated that coastal cities are more vulnerable to the consequences of climate change in the Sixth Assessment Report of the Intergovernmental Panel on Climate Change. People, neighbourhoods, ecosystems, buildings, and cities have suffered from climate change impacts, including coastal floods [26].
The İzmir’s metropolitan agency for water management is well-aware of the risks due to the combined effect of urbanization and increasing population density. Nevertheless, the assessment of the discharge capacity of the run-off is still underestimated and, besides, is focused on the definition of riverine risks areas, and ignores that flooding by cloudburst has a different dynamic from riverine or fluvial flooding [27,28]. Traditional fluvial flooding happens along riverine areas when river flows exceed the streambed capacity. In contrast, cloudburst flooding can happen even without experiencing river flooding [29]. Still, it can contribute to a severe overcharge of the discharge capacity of urban streams during an extreme rainfall event. As the latest advancements have demonstrated in this field, the run-off is the key parameter to determine the vulnerability of urban systems to cloudburst events [11,30,31,32].
The traditional hazard mapping and risk planning techniques often fall behind when facing a climate crisis since extreme changes in quantity, frequency, and distribution of meteorological phenomena are observed. To increase our capacity to respond to changing global threats, we must update ourselves and also the methods we use. We believe that ecosystem services are very powerful tools in adapting to changing threats with changing climate. To be specific, the flood risk can be decreased using planning and design tools integrated with ecosystem services [33]. The first step towards achieving this purpose is measuring the flood risk of the area.
The research employs the “Urban Flood Risk Mitigation” model of Integrated Valuation of Ecosystem Services and Tradeoffs (InVEST) software version 3.9.2 [34]. This ecosystem service (ES) model is a prototype of the new “Urban” suite, which is dedicated to collecting the models which deal specifically with the urban ecosystem supply. The ES modeling output has been used to evaluate the biophysical distribution of run-off and its retention in the entire Province of İzmir [35].
To understand the vulnerability of the İzmir Province to cloudburst events, the analytical biophysical results of the run-off have been integrated by the analysis of the flow accumulations [36]. The assumption below this concept is that the cloudburst vulnerability in hilly coastal cities is higher when settlements are distributed in sloping lands.
The streams analysis has been performed by the hydrological processing toolbox of ESRI ArcGIS, while employing the digital elevation model, and evaluating the direction of the stream and the flow accumulation. To visualize the result, a threshold accumulation parameter has been set above 200 to identify the streams in the catchment. This number depends on the visual calibration of the number of pixels that accumulates into the downstream areas to determine the stream path, and depends on the resolution of the digital elevation model. The final threshold was chosen because in the visual test, the flow accumulates at the places where there are real streams. To validate the result, it must be assumed that if the model is correct, it locates the streams in the right position (thus, one can see if the model fits with the real physical condition).
The research assumes the definition of the areas vulnerable to cloudburst events as a step towards the “resilience of the system”, according to the vision of “co-evolutionary resilience” [37,38,39,40]. Through this vision, it is possible to identify the conditions for resilient urban planning: the preservation of the system’s constitutional framework and the ability to evolve, thus aiding the decision-making processes [41,42,43] while identifying problems (e.g., vulnerability analysis) and determining the kind and quantity of solutions through plans and projects [44]. Here, we want to combine different datasets to demonstrate how the traditional hydrological risk assessment based on a historical probability of flooding is now obsolete if compared with an extended hydraulic vulnerability assessment. To do so, we modelled the spatial flooding vulnerability mitigation by using InVEST. Results of the vulnerability assessment will be discussed in light of context-specific nature-based solutions that can be used to design waterproof sponge districts in İzmir.
This paper examines the current situation of İzmir, reveals the flood risk of the area, and reveals how these risks can be reduced by using which tools. The information about the area, and how to use that information, was discussed in materials and methods. Additionally, the section includes the potentialities of these elements. Outcomes of the modelling session, which is one of the methods used to support future interventions in the area, was demonstrated in the results section. After the results section, a proposal for risk reduction methods was discussed. The issue has been finalized with the conclusion part.
2. Materials and Methods
2.1. The Area of Interest
The İzmir Province (see Figure 1) spans 1,187,869.08 ha, and it covers the western coast of Turkey that creates a peninsula in the Aegean Sea toward the Greek Archipelago (Chios) [45].
İzmir has a distinctive identity with a heterogeneous topography, a characteristic flora and fauna, a shaped conformation for the coasts, and huge natural resources with historical sites and archaeological heritage [46]. The altitude ranges between 0 and 1200 m, and the peninsula is characterized by a Mediterranean climate with a hot and dry summer and a rainy winter [47,48].
The urbanization process occurred in particular at the expense of plain, fertile agricultural areas (26 thousand hectares). Still, it is noticeable that the same process occurred even at the expense of the characteristic natural and seminatural Mediterranean environment surrounding this part of Turkey; more than 10 thousand hectares of seminatural land uses disappeared in the last 18 years, while revealing a strong presence of a biodiversity reduction process [49].
A deeper analysis of the land-use change indicates that the biggest land-use change has happened to the complex cultivation patterns, which decreased by more than 8 thousand hectares which became discontinuous urban fabric, and more than 3 thousand hectares that became industrial or commercial units [50]. However, other considerable transitions also happened to the permanently irrigated land that became urban, industrial, or commercial areas. Moreover, big losses happened even to agriculture, with the presence of high natural areas, natural grassland and transitional woodland-shrub decreasing dramatically.
Finally, significant urbanization processes happened to sclerophyllous vegetation and the sparsely vegetated areas, which represent an important particularity of the eco-mosaic of this province (see Figure 2, Figure 3 and Figure 4).
Other important “transitions” are even happening to the unbuilt land which is experiencing a certain kind of transformation that leads to a more “intensive” utilization of the agricultural land: more than 34 thousand hectares of non-irrigated arable land become permanently irrigated land (it should be pointed out that this transition is quantitatively equal to the total amount of land taken by new urban areas), 14 thousand hectares of non-irrigated arable land has become complex cultivation patterns, and a strong process of conversion from coniferous forest to transitional woodland-shrub is happening, due to other agroforestry evolutionary dynamics [49,50].
As it has been pointed out, the process of urban growth is consuming some of the most biodiverse and environmentally rich areas of the Mediterranean basin, while causing several correlated impacts, such as the loss of biodiversity and the related regulative, productive, and cultural ecosystem services that the Natural Capital Project provides [51,52,53].
2.2. The Idiosyncratic Vulnerability of the City
Dealing with hydraulic vulnerability from a cloudburst in a city like İzmir (Turkey) means considering this city’s extraordinary condition, which is idiosyncratically sensitive to any rainy event. Table 1 shows that İzmir is a highly sealed city [54,55,56] with certain urban districts that reach the peak of 100% of sealed surfaces (e.g., the productive sites or the densely built-up residential areas). Each rainy phenomenon has a slightly higher intensity than normal conditions and can provoke isolated flooding or other impacts, such as diseases.
It is well-known that the imperviousness [54], among compactness [57], salinization [58], desertification [59], or the loss of organic matter [58,60], is the worst kind of degradation [61] that the soil can receive from a land-use alteration. The so-called “land take” (described above) is defined as an unsustainable kind of land-use alteration that compromises the possibility of the soil returning to its original natural properties [62,63]. Therefore, the urbanization that occurred during the last twenty years and the related sealing process is considered an irreversible dynamic since it does not allow the return to natural conditions while maintaining the initial stock of the (limited) soil resource.
The peculiarity of İzmir is that it is developing a deep “compact” urban texture [64,65,66], since the soil sealing rate for each land use demonstrates that the city has been subject to a concentrated anthropic transformation while creating a densely built-up core urban area, with a low rate of permeability.
According to a spatial analysis made with the raster statistics tool (see Table 1), the average soil sealing of the land-use class “continuous urban fabric” in the entire İzmir Province is 75%, with a high standard deviation that implies that, in the core areas of İzmir city, the soil sealing reaches a peak of 100% in some districts. Continuous urban fabric land uses are on average much more sealed than the “industrial or commercial units” (44%, with a high standard deviation), which is a peculiarity that characterizes the kind of urban development growing in this catchment. The “discontinuous urban fabric” land uses are on average 34% sealed, which seems to be less impacting, but it should be considered that these land uses are largely sprawled and diffused in the catchment while defining the borders between the built and the unbuilt environment, thus playing a crucial role in the ecological balancing of the area.
This empirical evidence is crucial since urban adaptation can be realistically pursued if the capacity to measure and evaluate the urban system is precise and reliable while accurately comprehending the urban environment’s biophysical performance.
The intense rainfall phenomena that flooded the historical center during recent years were not considered in traditional hydrological maps, thus underestimating how climate change affected the distribution and intensity of certain natural events and, consequently, the maps of flooding hazards [20,67,68]. To detect the effects of flooding risk due to climate change, we combined different datasets and modelled the spatial flooding vulnerability mitigation by using InVEST.
2.3. Modeling Urban Run-Off
The urban flood mitigation model represents one of the first explicitly designed tools for mapping urban vulnerabilities. The model assumes that flood-prone areas are impermeable material of artificial surfaces built upon low drainage soils [69]. The model considers that the water on the impervious surface moves directly to the area next to it, contributing directly to a surface flow accumulation. Obviously, the model oversimplifies the run-off formation since, as it is well-known, in dense urban catchments, the building roofs, terraces, and other horizontal or vertical surfaces retain the rainwater before it generates a ground run-off. Indeed, rainwater can be temporarily retained by water pipes and contributes to the total discharge sometime later. Nevertheless, run-off is generally estimated by parametric association values between land use permeability and hydraulic conductibility (run-off curve numbers) [70,71]. The run-off curve number (RCN) is a parameter that provides a combination of run-off factors using a coupled integration of land use classification and hydraulic conductibility.
However, the exact biophysical estimation of the run-off in urban land can be significantly difficult to compute since the discharge volume during a cloudburst can be affected by many factors (quantity, quality, and surface of buildings, sewer systems capacity, the presence of dust/leaves in the ground).
The output calculates the run-off retention index (i.e., the percentage of run-off retained per pixel compared to the storm volume) and, on the contrary, the millimeters of water that undergoes the run-off process.
The inputs required are:
- Watershed vector delineating areas of interest;
- Depth of rainfall in mm (of a single cloudburst event);
- Land use/land cover map (LULC);
- Soil hydrologic group raster;
- The biophysical value corresponds to each land-use class in the land cover map.
2.3.1. The Land Use/Land Cover Dataset
The land use/land cover has been built around the RCN classification. Table 2 shows that the RCN A, B, C, and D was associated with the classes on the permeability of urban soil. Therefore, the land use classification was entirely built around the United States Department of Agriculture (USDA) classes, employing the Imperviousness High-Resolution Layer (HRL) database (available at https://land.copernicus.eu/pan-european/high-resolution-layers/imperviousness (accessed on 15 September 2021)). The Imperviousness HRL captures the spatial distribution of artificially sealed areas, including the level of sealing of the soil per area unit. The level of sealed soil (imperviousness degree 1–100%) is produced using a semi-automated classification based on the calibrated normalized difference vegetation index (NDVI).
The dataset has the following characteristics: the impervious layer captures the percentage and change of soil sealing. Sealed/impervious areas are characterized by the substitution of the original natural/semi-natural land cover or water surface with an artificial, often impervious, cover. These artificial surfaces are usually maintained over long periods.
Then, the tree cover density dataset was used to classify the forest areas accordingly. The tree cover density product consists of the status layers showing the level of tree cover density in a range from 0–100%, available for 2012, 2015, and 2018 reference years, and a change product showing the increase or decrease of tree cover in 2012–2015 and 2015–2018 [72].
For the green areas in urban texture, agricultural lands, and grasslands, the Urban Atlas 2018 dataset was used. The imperviousness of those areas was classified according to their condition and use.
The three datasets (imperviousness density, tree cover density, and urban atlas) were spatially merged to obtain a land use classification of the run-off curve numbers on built and unbuilt land (see Table 2).
Data processing has been conducted by using the ESRI ArcGIS software licensed by the İzmir Institute of Technology. A reclassification sampling and raster combination have been employed by using Esri ArcGIS (ver.10.8 Redlands, California, the United States). In particular, the procedure has been made by four steps:
- From the continuous imperviousness value to a discrete classification of urban areas;
- Reclassification of the urban green areas, agricultural lands, and grasslands according to their imperviousness levels;
- From continuous forest value to a discrete reclassification in three classes: poor, fair and good;
- Utilization of the raster combine tool and final classification (see Figure 5).
2.3.2. The Soil Hydraulic Conductibility
The second, and most important model input is the map of saturated hydraulic conductibility (Ksat, mm/h, see Table 3), defined as the soil’s saturated ability to be vertically crossed by fluids [73]. Soils with good porosity conductibility allow a significant quantity of water retention and movement in a short period. The water quickly reaches the aquifer with a high conductibility, while the surface flow processes result is limited. On the contrary, low infiltration of poorly conductible soils generates high processes of surface run-off.
Hydraulic conductibility is a function of soil porosity and, in turn, soil texture: clay soils generally have a lower conductibility than sandy and gravel soils.
For this research, an ancillary dataset based on the more accurate Geological Unit was designed using the raster reclassification. The classification has been made while assigning a specific hydrological soil classification according to Ress et al. [74] (see Table 4).
Results of the classification are reported in Figure 6.
3. Results
3.1. The Modeling Output
The modelling session was launched using a single rain event of 70 mm as the default parameter (considering the recent cloudburst events which overcome 100 mm in one hour, this parameter has been considered reasonable, even taking into account that the bibliography considers flash floods or cloudburst single rain events that overcome 50 mm; see Figure 7).
Figure 8 is the output of the InVEST modeling. It will be presented hereafter while commenting on its results.
As can be seen from the data reported in Table 5, there is a huge heterogeneity of data in the different municipalities that compose the metropolitan İzmir area. These differences are due to the distribution of the hydraulic soil performance in the catchment. Figure 7 clearly shows that the run-off retention is much higher in the plain-fertile areas where sediments are present, and the water can be absorbed underground with more efficiency. The major problem arises when the dense settlement system is built on poorly conductible soils. Looking at the municipality data, the worst performance is by the Konak district, which has a run-off retention index of 28% (this means that only 28% of the rain volume can be retained by the soil, while the rest undergoes a process of surface run-off). According to this modelling simulation, under a rain event of 70 mm, more than 1.2 million cube meters of water will run-off in the district, thereby creating a dangerous situation. Bad performances also affect Bayraklı, Karşıyaka, Gaziemir, Balçova, and Karabağlar, since their run-off retention performance does not overcome the 65% rain volume. In these specific districts, there is a high probability that a huge amount of rainwater will create urban streams of debris during a cloudburst event.
3.2. The Modeling Output
As previously mentioned, to better understand the vulnerability of the İzmir Province to cloudburst events, the analysis of the stream has been used to integrate the analytical biophysical results of the run-off. The assumption below this concept is that the hydraulic risk in hilly coastal cities is problematic and higher when settlements are distributed in slope areas. Unfortunately, İzmir is a typical city built on high slopes, thus creating a massive water flow problem that runs to the coast during flashing rains. Therefore, the more the quantification of run-off is concentrated in a sloped area, the more probable this run-off will transform itself into an urban stream with several dangerous consequences.
The streams analysis has been performed by the hydrological processing toolbox of ESRI ArcGIS, while employing the digital elevation model, and evaluating the direction of the stream and the flows accumulation. To visualize the result, a threshold accumulation parameter has been set above 200 to identify the streams in the catchment (see Figure 9). This number, 200, depends on the visual test of the digital elevation model. This number was chosen because the visual test model (flow accumulation) is at the same level of streams in the area. In doing this operation, it has to be considered that the model uses the Digital Elevation Model without accounting where the system is highly anthropized; thus, in the densely built-up areas, the streams of the model does not correspond with the anthropic canals, pipes, underground courses, and all the rectification that the process of anthropization has made to the original hydraulic network. However, to solve this problem, the artificial stream network has been further analyzed.
3.3. A Final Composite Hydrological Vulnerability Index
The hydrological vulnerability has been calculated with a raster overlay composite index which sums the (normalized 0–1) indexes of run-off and flow accumulation (therefore, the final index will range between 0 and 2). As previously explained, the theory behind the calculation is that the run-off can become dangerous as there is a huge presence of slopes and streams, creating torrents and potential dangers. The composite index can be assumed as an early monitoring system that is able to determine the part of the territory that undergoes risk during rain events of 70 mm.
Figure 10 demonstrates that the distribution of vulnerability is not only concentrated on the dense central part of İzmir (Konak, Karabağlar, Karşıyaka, Bornova, and Buca), but also in the far eastern districts of Kiraz and Beydağ, in the western peninsula of Çeşme, and in the northern districts of Foça and Aliağa.
To better visualize and locate the potentially vulnerable districts of İzmir, the map has been intersected with the “Urban Atlas” (2018) database available at the European Union Copernicus website.
The Urban Atlas dataset had a detailed classification of the urban district, thus allowing a better distribution of the vulnerability values at the district scale. Unfortunately, the Urban Atlas catalogue does not cover the entire İzmir metropolitan area; therefore, the analytical assessment has been executed in a reduced catchment.
The output represents the calculation of the mean vulnerability of the pixels in each urban district of İzmir (see Figure 11). This classification helps to detect the zones of intervention where the “sponge district” concept should be applied with priority.
Within this baseline assessment, we can answer the question “which urban districts have good water retention performances?”. The next analytical part has been developed to define a threshold of hydraulic sustainability in the city’s different districts and according to the soil type.
To do so, we intersected the vulnerability index of each Urban Atlas district with the soil type, then we created a pivot table, and we performed a data analysis (calculation of the average values to understand the threshold for each soil type). We calculated three main parameters for the districts (the population density, the imperviousness density, and the forest density) and observed its relationship with the hydraulic vulnerability.
According to Table 6, the average characteristics (for all kinds of soils) of the continuous urban fabric is to have a hydraulic vulnerability value of 0.78, with a size of 4244.60 square meters, and impervious rate of 89.29% of the plot surface, a 37% of forest cover area and a density of population per hectare of 350.79 people/ha (all this are average numbers). Thus, if we want to reduce the hydraulic risk, the new continuous urban fabric districts should be replaced by new ones that have less impervious rates, more permeability, and more forest cover (thus less built-up footprints and adjacent impermeable spaces).
3.4. Measuring the Biophysical Benefits
We re-calculated the Urban Flood Vulnerability biophysical index using the masterplan scenario at the end of the designing process. Then we compared the new with the old values (see Table 7) to check the differences. We aimed to create empirical evidence of what kind of design rules and prescriptions can efficiently reduce the risk of urban flooding. Our results indicate that this first experimental modelling integration in the design phase was successful.
The run-off retention index increased from 0.38 to 0.60. Which means it almost doubled (see Figure 12). The main reason for this improvement is the increase in green and permeable surfaces compatible with nature. Particularly, the open and green space system was designed on vulnerable areas with flow accumulation problems, allowing the development of site-specific performance-based solutions throughout the plan.
4. Discussion
This study outlines that the vulnerability of urban systems needs to be evaluated using both institutional data, big data, ancillary and hand-made data that urban and environmental analysts have, in order to build and define site-specific supporting decision-making systems [75,76], while obtaining site-specific data that includes statistical, geographical and documental information.
Designing the Sponge District Using Digital Models
As mentioned in the introduction, one of the most severe limits on ecosystem vulnerability digital modelling is that spatial information does not intercept the design phase while remaining at the border of the decision-making process regarding urban transformation [30,77].
The sponge city design has been essentially based on spatially evident strategies for developing urban water management mechanisms within this research. Regulation of urban water flow, management of urban water pollution and storage and use of rainwater, as well as the protection and establishment of the ecological balance of the urban water cycle with nature-based solutions are the objectives of sponge city management. According to flood vulnerability analysis, we had three critical districts: Konak, Karşıyaka, and Bayraklı. We designed a water-sensitive master plan for Karşıyaka while testing some solutions to apply to the sponge district using performance-based solutions and empirically measuring how these solutions produce biophysical benefits. The priority for the master plan was to reduce the districts’ run-off while slowing and directing the surface water flow by creating a blue and green corridor.
Initially, a broad study area was selected for Karşıyaka, considering the quantity and distribution of natural features: urban green areas, urban forest, etc.; the flow accumulation data; the run-off quantity; and urban transportation system elements such as railways and bus routes, and stops. According to the most common practices on sustainable urban drainage systems [10,78], we believe that some priorities in city planning should change, so we focus the design approach on the definition of open system (green spaces) instead of roads and buildings (grey space). In doing this, we applied the first concept of sponge district design: prioritizing the green design while placing nature along the urban flow accumulation paths.
The conceptual map of green spaces (see Figure 13) has been designed with the support (overlay) of the digital flow accumulation map to maximize the drainage capacity of the district.
Once the main open and green systems were designed, the area was divided into sub-sections according to their characteristics. We concentrated our attention on the intermediate section between the uphill and the plain part of the district (see Figure 14). This has a heterogenic urban texture and offers a lot of potentialities in terms of transformations. Besides, from a hydraulic perspective, it works as a membrane between the upstream areas that come from the natural mountainous areas and the downstream areas in the city. This district section also presents a good balance between problems and potentials: high run-off accumulation in the dense built-up parts placed next to the hill land which offers low vulnerability. Additionally, there is an urban renewal project underway.
The final master plan (see Figure 15) has been designed after many tentative designs of dividing the private and public and the permeable and unpaved vegetated areas using the flow accumulation and the spatial vulnerability distribution. Open and green spaces, which are key elements in tackling urban floods, were placed on the field where flow accumulation occurs. At the same time, the distribution of functions in the built areas has been designed balancing public urban facilities (healthcare, education, etc.) with private residential, commercial, and tertiary functions (see Table 8).
The final master plan was designed to emphasize the different nature-based solutions employed to sole site-specific vulnerabilities (see Figure 16).
The correct use of ecosystem services developed with nature-based solutions has a great role in reducing the risk of flooding. The example of the sponge district master plan application demonstrates the power of ecosystem services in risk reduction in urban areas with high flood risk. The nature-based solutions are the key tools of this application, and using the tools in the right places provide run-off reduction. The master plan was designed to show the practical applicability of the flood resilience theoretical aspects.
A composite index was used instead of the original run-off data as the main input of the master plan design. The amount of run-off was measured using one of the InVEST modules, an ecosystem service modelling software for cloudburst flooding. In the light of the findings, the run-off volume dataset was integrated into flow accumulation data which was produced by a visual test of the digital elevation model. The integration of these flood-important data allowed us to analyze the most vulnerable areas for flooding. The flood vulnerability analysis maps of the area are crucial in designing the performance-based solutions, which are the tools for the most effective use of limited resources. With analysis outputs showing which area needs the most resources, we designed the sponge district master plan. When we designed the master plan, we wanted to measure the actual biophysical benefits empirically. To do so, we ran the model once again with the new spatial interventions. Finally, the new model outputs demonstrated that the methods and tools used have a significant role in reducing the area’s flood vulnerability. We would like to mention that the method can be replicable in any coastal city which suffers from flooding by cloudburst.
5. Conclusions
In this work we wanted to demonstrate how digital ecosystem modelling can be practically used to (i) design sponge districts, and (ii) measure the benefits of performance-based solutions. Particularly, we employed the urban flood vulnerability model of InVEST at the city scale. We integrated the model with the digital flow accumulation map while achieving a broad preliminary assessment of the city’s predisposition to be flooded by a cloudburst. We used the composite index as the main input instead of the original run-off in the study.
We demonstrated that, according to modelling results, there are some districts of the city where the coupled interaction of soil characteristics with high imperviousness generates a tremendous vulnerable pattern: in the case of a rain event of 70 mm, there are areas where more than half of the rain volume does not infiltrate, thus causing run-off. This fact, associated with the landform character of the city, can lead to the formation of streams and potentially dangerous situations.
For the above reasons, we decided to deepen our attention to a highly vulnerable district (Karşıyaka) where urban transformations are occurring and the heterogeneous characteristics of the terrain and of the built-up space offered a suitable location to test an application of the sponge district.
We designed the sponge district using the spatial ecosystem and the flow accumulation models as background layers. With a stepwise process, because of the limited resources, we detailed the masterplan composition by selecting site-specific nature-based solutions to achieve performance-based solutions. In doing this process, we aimed to bridge the gap separating the analytical spatial knowledge of urban systems and their practical utilization as supporting decision-making tools.
When we finished designing the flood resilience master plan, we wanted to measure the real biophysical benefits empirically. We ran the model again, within the framework of new spatial interventions. New modelling results indicate that the digitally aided design of the sponge district increased the run-off retention of 58% in the selected district, thus emphasizing the importance of testing by designing the efficacy and efficiency of nature-based solutions. The study has proved that performance-based flooding solutions can be applied in any city that suffers from cloudburst flooding.
Author Contributions
Conceptualization, S.S. and B.A.; methodology, S.S. and B.A.; formal analysis, B.A.; investigation, S.S. and B.A.; writing—original draft preparation, S.S. and B.A.; writing—review and editing, S.S. and B.A.; visualization, B.A.; supervision, S.S. All authors have read and agreed to the published version of the manuscript.
Funding
This research received no external funding.
Acknowledgments
We want to thank the team members that worked on the design of the sponge district: Aleyna Yorulmaz, Gizem Yüksel, Gökay Karakalpaklıoğulları, Sena Aydemir. For more details about the project, go to https://arcg.is/08Kja (accessed on 3 February 2022).
Conflicts of Interest
The authors declare no conflict of interest.
References
- Rosenzweig, B.; Ruddell, B.L.; McPhillips, L.; Hobbins, R.; McPhearson, T.; Cheng, Z.; Chang, H.; Kim, Y. Developing Knowledge Systems for Urban Resilience to Cloudburst Rain Events. Environ. Sci. Policy 2019, 99, 150–159. [Google Scholar] [CrossRef]
- Bernstein, L.; Bosch, P.; Canziani, O.; Chen, Z.; Christ, R.; Davidson, O.; Hare, W.; Huq, S.; Karoly, D.; Kattsov, V.; et al. Climate Change 2007: Synthesis Report. Contribution of Working Groups I, II and III to the Fourth Assessment Report of the Intergovernmental Panel on Climate Change; IPCC: Geneva, Switzerland, 2007. [Google Scholar]
- Copenhagen Municipality. City of Copenhagen Cloudburst Management Plan 2012; Copenhagen Municipality: Copenhagen, Denmark, 2012; pp. 1–28. [Google Scholar]
- Pelling, M.; Manuel-Navarrete, D. From Resilience to Transformation: The Adaptive Cycle in Two Mexican Urban Centers. Ecol. Soc. 2011, 16. Available online: https://www.ecologyandsociety.org/vol16/iss2/art11/ (accessed on 3 February 2022). [CrossRef] [Green Version]
- Chelleri, L. From the «Resilient City» to Urban Resilience. A Review Essay on Understanding and Integrating the Resilience Perspective for Urban Systems. Doc. D’anàlisi Geogràfica 2012, 582, 287–306. [Google Scholar] [CrossRef]
- Runhaar, H.; Wilk, B.; Persson, Å.; Uittenbroek, C.; Wamsler, C. Mainstreaming Climate Adaptation: Taking Stock about “What Works” from Empirical Research Worldwide. Reg. Environ. Chang. 2018, 18, 1201–1210. [Google Scholar] [CrossRef] [Green Version]
- Weichselgartner, J.; Kelman, I. Geographies of Resilience: Challenges and Opportunities of a Descriptive Concept. Prog. Hum. Geogr. 2015, 39, 249–267. [Google Scholar] [CrossRef] [Green Version]
- Ali, R.; Kuriqi, A.; Kisi, O. Human-Environment Natural Disasters Interconnection in China: A Review. Climate 2020, 8, 48. [Google Scholar] [CrossRef] [Green Version]
- Mitchell, J.K. Megacities and Natural Disasters: A Comparative Analysis. GeoJournal 1999, 49, 137–142. [Google Scholar] [CrossRef]
- Pappalardo, V.; La Rosa, D.; Campisano, A.; La Greca, P. The Potential of Green Infrastructure Application in Urban Runoff Control for Land Use Planning: A Preliminary Evaluation from a Southern Italy Case Study. Ecosyst. Serv. 2017, 26, 345–354. [Google Scholar] [CrossRef]
- Gill, S.E.; Handley, J.F.; Ennos, A.R.; Pauleit, S. Adapting Cities for Climate Change: The Role of the Green Infrastructure. Built Environ. 2007, 33, 115–133. [Google Scholar] [CrossRef] [Green Version]
- Chang, B.; Wherley, B.; Aitkenhead-Peterson, J.A.; McInnes, K.J. Effects of Urban Residential Landscape Composition on Surface Runoff Generation. Sci. Total Environ. 2021, 783, 146977. [Google Scholar] [CrossRef] [PubMed]
- Land Monitoring Service European Commission CORINE Land Cover. Available online: https://land.copernicus.eu/pan-european/corine-land-cover (accessed on 3 February 2022).
- Coskun Hepcan, C. Quantifying Landscape Pattern and Connectivity in a Mediterranean Coastal Settlement: The Case of the Urla District, Turkey. Environ. Monit. Assess. 2013, 185, 143–155. [Google Scholar] [CrossRef] [PubMed]
- Kesgin Atak, B.; Ersoy Tonyaloğlu, E. Monitoring the Spatiotemporal Changes in Regional Ecosystem Health: A Case Study in Izmir, Turkey. Environ. Monit. Assess. 2020, 192, 385. [Google Scholar] [CrossRef] [PubMed]
- Benini, L.; Bandini, V.; Marazza, D.; Contin, A. Assessment of Land Use Changes through an Indicator-Based Approach: A Case Study from the Lamone River Basin in Northern Italy. Ecol. Indic. 2010, 10, 4–14. [Google Scholar] [CrossRef]
- Salata, S.; Gardi, C. From Quantitative to Qualitative Analysis of Land-Take. The Application of a Composite Indicator for Targeted Policies of Land Take Reduction. CSE J. 2014, 1, 15–31. [Google Scholar] [CrossRef]
- TURKSTAT Turkish Statistical Institute. Address Based Population Registration System. Available online: https://www.tuik.gov.tr/ (accessed on 3 February 2022).
- Meerow, S.; Newell, J.P. Urban Resilience for Whom, What, When, Where, and Why? Urban Geogr. 2016, 40, 309–329. [Google Scholar] [CrossRef]
- Towfiqul Islam, A.R.M.; Talukdar, S.; Mahato, S.; Kundu, S.; Eibek, K.U.; Pham, Q.B.; Kuriqi, A.; Linh, N.T.T. Flood Susceptibility Modelling Using Advanced Ensemble Machine Learning Models. Geosci. Front. 2021, 12, 101075. [Google Scholar] [CrossRef]
- Salata, S. Land Take in the Italian Alps: Assessment and Proposals for Further Development. Manag. Environ. Qual. 2014, 25, 407–420. [Google Scholar] [CrossRef]
- Leal, M.; Fragoso, M.; Lopes, S.; Reis, E. Material damage caused by high-magnitude rainfall based on insurance data: Comparing two flooding events in the Lisbon Metropolitan Area and Madeira Island, Portugal. Int. J. Disaster Risk Reduct. 2020, 51. [Google Scholar] [CrossRef]
- Eraydin, A.; Tasan-Kok, T. Resilience Thinking in Urban Planning; Springer: Dordrecht, The Netherlands, 2013; ISBN 9789400754751. [Google Scholar]
- Özcan, E. Sel Olayı ve Türkiye Floods and Turkey; Gazi University Journal of Gazi Education Faculty: Ankara, Turkey, 2006; Volume 26. [Google Scholar]
- Schreurs, M.A. The Paris Climate Agreement and the Three Largest Emitters: China, the United States, and the European Union. Politics Gov. 2016, 4, 219–223. [Google Scholar] [CrossRef] [Green Version]
- IPCC. Climate Change 2022: Impacts, Adaptation, and Vulnerability. Contribution of Working Group II to the Sixth Assessment Report of the Intergovernmental Panel on Climate Change; Pörtner, H.-O., Roberts, D.C., Tignor, M., Poloczanska, E.S., Mintenbeck, K., Alegría, A., Craig, M., Langsdorf, S., Löschke, S., Möller, V., et al., Eds.; Cambridge University Press: Cambridge, UK, 2022; in press. [Google Scholar]
- Fuchs, S.; Keiler, M.; Ortlepp, R.; Schinke, R.; Papathoma-Köhle, M. Recent Advances in Vulnerability Assessment for the Built Environment Exposed to Torrential Hazards: Challenges and the Way Forward. J. Hydrol. 2019, 575, 587–595. [Google Scholar] [CrossRef]
- Rehan, B.M. Accounting Public and Individual Flood Protection Measures in Damage Assessment: A Novel Approach for Quantitative Assessment of Vulnerability and Flood Risk Associated with Local Engineering Adaptation Options. J. Hydrol. 2018, 563, 863–873. [Google Scholar] [CrossRef]
- Çağla, E. Assessing Adaptation Strategies against Flood Risk in Urban Coastal Areas through Izmir Karsıyaka Coastline Case. MEGARON/Yıldız Tech. Univ. Fac. Archit. E-J. 2022. [Google Scholar] [CrossRef]
- Langemeyer, J.; Gómez-Baggethun, E.; Haase, D.; Scheuer, S.; Elmqvist, T. Bridging the Gap between Ecosystem Service Assessments and Land-Use Planning through Multi-Criteria Decision Analysis (MCDA). Environ. Sci. Policy 2016, 62, 45–56. [Google Scholar] [CrossRef]
- Langemeyer, J.; Wedgwood, D.; McPhearson, T.; Baró, F.; Madsen, A.L.; Barton, D. Creating Nature-Based Solutions Where They Are Needed—A Spatial Ecosystem Service-Based Decision Analysis of Green Roofs in Barcelona. Sci. Total Environ. 2019, 707, 135487. [Google Scholar] [CrossRef]
- Yang, B.; Lee, D. Urban Green Space Arrangement for an Optimal Landscape Planning Strategy for Runoff Reduction. Land 2021, 10, 897. [Google Scholar] [CrossRef]
- Maragno, D.; Gaglio, M.; Robbi, M.; Appiotti, F.; Fano, E.A.; Gissi, E. Fine-Scale Analysis of Urban Flooding Reduction from Green Infrastructure: An Ecosystem Services Approach for the Management of Water Flows. Ecol. Model. 2018, 386, 1–10. [Google Scholar] [CrossRef]
- Tallis, H.T.; Ricketts, T.; Guerry, A.D.; Wood, S.A.; Sharp, R.; Nelson, E.; Ennaanay, D.; Wolny, S.; Olwero, N.; Vigerstol, K.; et al. InVEST 2.0 Beta User’s Guide; Stanford University: Stanford, CA, USA, 2011. [Google Scholar]
- Salata, S.; Ronchi, S.; Giaimo, C.; Arcidiacono, A.; Pantaloni, G.G. Performance-Based Planning to Reduce Flooding Vulnerability Insights from the Case of Turin (North-West Italy). Sustainability 2021, 13, 5697. [Google Scholar] [CrossRef]
- Arthur-Hartranft, S.T.; Carlson, T.N.; Clarke, K.C. Satellite and Ground-Based Microclimate and Hydrologic Analyses Coupled with a Regional Urban Growth Model. Remote Sens. Environ. 2003, 86, 385–400. [Google Scholar] [CrossRef]
- Terryn, E.; Boelens, L.; Pisman, A. Beyond the Divide: Evaluation in Co-Evolutionary Spatial Planning. Eur. Plan. Stud. 2016, 24, 1079–1097. [Google Scholar] [CrossRef]
- Brunetta, G.; Ceravolo, R.; Barbieri, C.A.; Borghini, A.; de Carlo, F.; Mela, A.; Beltramo, S.; Longhi, A.; De Lucia, G.; Ferraris, S.; et al. Territorial Resilience: Toward a Proactive Meaning for Spatial Planning. Sustainability 2019, 11, 2286. [Google Scholar] [CrossRef] [Green Version]
- Davoudi, S.; Crawford, J.; Mehmood, A. Planning for Climate Change: Strategies for Mitigation and Adaption for Spatial Planners; Routledge: London, UK, 2009; ISBN 9781844076628. [Google Scholar]
- Davoudi, S.; Brooks, E.; Mehmood, A. Evolutionary Resilience and Strategies for Climate Adaptation. Plan. Pract. Res. 2013, 28, 307–322. [Google Scholar] [CrossRef] [Green Version]
- Maragno, D.; Dall’omo, C.F.; Pozzer, G.; Musco, F. Multi-Risk Climate Mapping for the Adaptation of the Venice Metropolitan Area. Sustainability 2021, 13, 1334. [Google Scholar] [CrossRef]
- Albert, C.; Galler, C.; Hermes, J.; Neuendorf, F.; Von Haaren, C.; Lovett, A. Applying Ecosystem Services Indicators in Landscape Planning and Management: The ES-in-Planning Framework. Ecol. Indic. 2016, 61, 100–113. [Google Scholar] [CrossRef]
- Salata, S. Ecologically-Compatible urban Planning. Designing a Healthier Environment; Emerald Publishing Limited: Bingley, UK, 2019; ISBN 9781789737844. [Google Scholar]
- Brunetta, G.; Salata, S. Mapping Urban Resilience for Spatial Planning—A First Attempt to Measure the Vulnerability of the System. Sustainability 2019, 11, 2331. [Google Scholar] [CrossRef] [Green Version]
- Velibeyoğlu, K.; Özdemir, S.; Baba, A.; Arsan, Z.D.; Yazdani, H.; Hazar, D.; Kaplan, A.; Boyacı, M.; Kurucu, Y.; Erdoğan, N.; et al. ‘Urla-Çeşme-Karaburun’ Peninsula Sustainable Development Strategy 2014–2023; İZKA (İzmir Development Agency): Izmir, Turkey, 2014. [Google Scholar]
- Matthews, H. Greco-Romans Cities of Aegean Turkey. History, Archaeology, Architecture; Ege Yayinlari: Istanbul, Turkey, 2014. [Google Scholar]
- Velibeyoglu, K. Regional Acupuncture for Izmir Peninsula: Creating Capital Web for Creative Eco-Tourism. J. Environ. Prot. Ecol. 2016, 17, 666–674. [Google Scholar]
- Saricam, S.Y.; Erdem, U. Planning of Izmir-Karaburun Peninsula as Biosphere Reserve Area. Ekoloji 2010, 19, 42–50. [Google Scholar] [CrossRef]
- Kurucu, Y.; Chiristina, N. Monitoring the Impacts of Urbanization and Industrialization on the Agricultural Land and Environment of the Torbali, Izmir Region, Turkey. Environ. Monit. Assess. 2008, 136, 289–297. [Google Scholar] [CrossRef] [PubMed]
- Ozdemir, C.; Şahinkaya, S.; Kalıpcı, E.; Oden, M.K.; Nurlu, E.; Erdem, Ü.; Doygun, H.; Oğuz, H.; Kesgin, B.; Doygun, N.; et al. The Effects of Land Cover Change on Natural Ecosystems: The Case of İzmir, Turkey Digital Proceeding Of THE ICOEST’2013-, Cappadocia The Effects of Land Cover Change on Natural Ecosystems: The Case of İzmir, Turkey; Selcuk University: Konya, Turkey, 2013. [Google Scholar]
- Duarte, G.T.; Ribeiro, M.C.; Paglia, A.P.; Csuti, B.; Fackler, P.; Lonsdorf, E. Ecosystem Services Modeling as a Tool for Defining Priority Areas for Conservation. PLoS ONE 2016, 11, e0154573. [Google Scholar] [CrossRef] [PubMed] [Green Version]
- Maes, J.; Liquete, C.; Teller, A.; Erhard, M.; Paracchini, M.L.; Barredo, J.I.; Grizzetti, B.; Cardoso, A.; Somma, F.; Petersen, J.E.; et al. An Indicator Framework for Assessing Ecosystem Services in Support of the EU Biodiversity Strategy to 2020. Ecosyst. Serv. 2016, 17, 14–23. [Google Scholar] [CrossRef] [Green Version]
- Gómez-Baggethun, E.; Barton, D.N. Classifying and Valuing Ecosystem Services for Urban Planning. Ecol. Econ. 2012, 86, 235–245. [Google Scholar] [CrossRef]
- Morabito, M.; Crisci, A.; Georgiadis, T.; Orlandini, S.; Munafò, M.; Congedo, L.; Rota, P.; Zazzi, M. Urban Imperviousness Effects on Summer Surface Temperatures Nearby Residential Buildings in Different Urban Zones of Parma. Remote Sens. 2018, 10, 26. [Google Scholar] [CrossRef] [Green Version]
- Diakakis, M.; Deligiannakis, G.; Pallikarakis, A.; Skordoulis, M. Factors Controlling the Spatial Distribution of Flash Flooding in the Complex Environment of a Metropolitan Urban Area. The Case of Athens 2013 Flash Flood Event. Int. J. Disaster Risk Reduct. 2016, 18, 171–180. [Google Scholar] [CrossRef]
- Artmann, M. Urban Gray vs. Urban Green vs. Soil Protection—Development of a Systemic Solution to Soil Sealing Management on the Example of Germany. Environ. Impact Assess. Rev. 2016, 59, 27–42. [Google Scholar] [CrossRef]
- Lamandé, M.; Greve, M.H.; Schjønning, P. Risk Assessment of Soil Compaction in Europe—Rubber Tracks or Wheels on Machinery. Catena 2018, 167, 353–362. [Google Scholar] [CrossRef]
- Glæsner, N.; Helming, K.; de Vries, W. Do Current European Policies Prevent Soil Threats and Support Soil Functions. Sustainability 2014, 6, 9538–9563. [Google Scholar] [CrossRef] [Green Version]
- United Nations. Convention to Combat Desertification in Those Countries Experiencing Serious Drought and/or Desertification, Particularly in Africa; United Nations: Paris, France, 1994; Volume 1954. [Google Scholar]
- Ronchi, S.; Salata, S.; Arcidiacono, A.; Piroli, E.; Montanarella, L. Policy Instruments for Soil Protection among the EU Member States: A Comparative Analysis. Land Use Policy 2019, 82, 763–780. [Google Scholar] [CrossRef]
- Prăvălie, R.; Patriche, C.; Bandoc, G. Quantification of Land Degradation Sensitivity Areas in Southern and Central Southeastern Europe. New Results Based on Improving DISMED Methodology with New Climate Data. Catena 2017, 158, 309–320. [Google Scholar] [CrossRef]
- European Commission. Guidelines on Best Practice to Limit, Mitigate or Compensate Soil Sealing; European Union: Brussels, Belgium, 2012; ISBN 9789279262104. [Google Scholar]
- European Commission. Future Brief: No Net Land Take by 2050? European Union: Bristol, UK, 2016. [Google Scholar]
- Giridharan, R.; Emmanuel, R. The Impact of Urban Compactness, Comfort Strategies and Energy Consumption on Tropical Urban Heat Island Intensity: A Review. Sustain. Cities Soc. 2018, 40, 677–687. [Google Scholar] [CrossRef] [Green Version]
- Jiao, L. Urban Land Density Function: A New Method to Characterize Urban Expansion. Landsc. Urban Plan. 2015, 139, 26–39. [Google Scholar] [CrossRef]
- Mubareka, S.; Koomen, E.; Estreguil, C.; Lavalle, C. Development of a Composite Index of Urban Compactness for Land Use Modelling Applications. Landsc. Urban Plan. 2011, 103, 303–317. [Google Scholar] [CrossRef]
- Chelleri, L.; Waters, J.J.; Olazabal, M.; Minucci, G. Resilience Trade-Offs: Addressing Multiple Scales and Temporal Aspects of Urban Resilience. Environ. Urban. 2015, 27, 181–198. [Google Scholar] [CrossRef] [Green Version]
- Pistocchi, A.; Calzolari, C.; Malucelli, F.; Ungaro, F. Soil Sealing and Flood Risks in the Plains of Emilia-Romagna, Italy. J. Hydrol. Reg. Stud. 2015, 4, 398–409. [Google Scholar] [CrossRef]
- Davis, M.; Naumann, S. Making the Case for Sustainable Urban Drainage Systems as a Nature-Based Solution to Urban Flooding. In Theory and Practice of Urban Sustainability Transitions; Springer: Cham, Switzerland, 2017; pp. 123–137. [Google Scholar]
- Xu, C.; Rahman, M.; Haase, D.; Wu, Y.; Su, M.; Pauleit, S. Surface Runoff in Urban Areas: The Role of Residential Cover and Urban Growth Form. J. Clean. Prod. 2020, 262, 121421. [Google Scholar] [CrossRef]
- USDA. Module 104: Runoff Curve Number Computations. Study Guide; United States Department of Agriculture Hydrology Training Series; Natural Resources Conservation Service: Washington, DC, USA, 1989. Available online: https://www.nrcs.usda.gov/Internet/FSE_DOCUMENTS/stelprdb1082992.pdf (accessed on 3 February 2022).
- Buchhorn, M.; Lesiv, M.; Tsendbazar, N.-E.; Herold, M.; Bertels, L.; Smets, B. Copernicus Global Land Cover Layers—Collection 2. Remote Sens. 2020, 12, 1044. [Google Scholar] [CrossRef] [Green Version]
- Muñoz-Carpena, R.; Zajac, Z.; Kuo, Y. Global Sensitivity and Uncertainty Analyses of the Water Quality Model VFSMOD-W. Trans. Asabe 2007, 50, 1719–1732. [Google Scholar] [CrossRef] [Green Version]
- Ross, C.W.; Prihodko, L.; Anchang, J.; Kumar, S.; Ji, W.; Hanan, N.P. HYSOGs250m, Global Gridded Hydrologic Soil Groups for Curve-Number-Based Runoff Modeling. Sci. Data 2018, 5, 180091. [Google Scholar] [CrossRef] [PubMed]
- Salata, S.; Giaimo, C.; Barbieri, C.A.; Ballocca, A.; Scalise, F.; Pantaloni, G. The Utilization of Normalized Difference Vegetation Index to Map Habitat Quality in Turin (Italy). Sustainability 2020, 12, 7751. [Google Scholar] [CrossRef]
- Grêt-Regamey, A.; Altwegg, J.; Sirén, E.A.; van Strien, M.J.; Weibel, B. Integrating Ecosystem Services into Spatial Planning—A Spatial Decision Support Tool. Landsc. Urban Plan. 2017, 165, 206–219. [Google Scholar] [CrossRef] [Green Version]
- McPhearson, T.; Andersson, E.; Elmqvist, T.; Frantzeskaki, N. Resilience of and through Urban Ecosystem Services. Ecosyst. Serv. 2015, 12, 152–156. [Google Scholar] [CrossRef]
- Beven, K. The SuDS Manual; CIRIA: London, UK, 2012; ISBN 9780860177609. [Google Scholar]
Figure 1.
The location of the study area. The İzmir Province is experiencing one of Turkey’s most rapid urbanization processes. As already mentioned, raw data on the recent land-take between 1990 and 2018 analyzed by a land use change analysis on the Corine Land Cover dataset [13,15] in the province of İzmir demonstrate that more than 33 thousand hectares of land were converted from agricultural or natural/seminatural uses into urban uses, while provoking a sensible reduction of the ecological integrity of this part of the Aegean Promontory. To get an idea, the absolute urbanization process corresponded to a rate of variation by artificial land uses of 99.3%. This means that urban areas in the İzmir Province almost doubled in less than 20 years, with a speed of urbanization equal to 4.26 square meters for each resident per year.

Figure 2.
Spatial (buffered) distribution of the urbanization process happened to the plain agricultural land.
Figure 2.
Spatial (buffered) distribution of the urbanization process happened to the plain agricultural land.

Figure 3.
Spatial (buffered) distribution of the urbanization process happened to the natural or seminatural areas.
Figure 3.
Spatial (buffered) distribution of the urbanization process happened to the natural or seminatural areas.

Figure 4.
Land use composition (1990 and 2018).
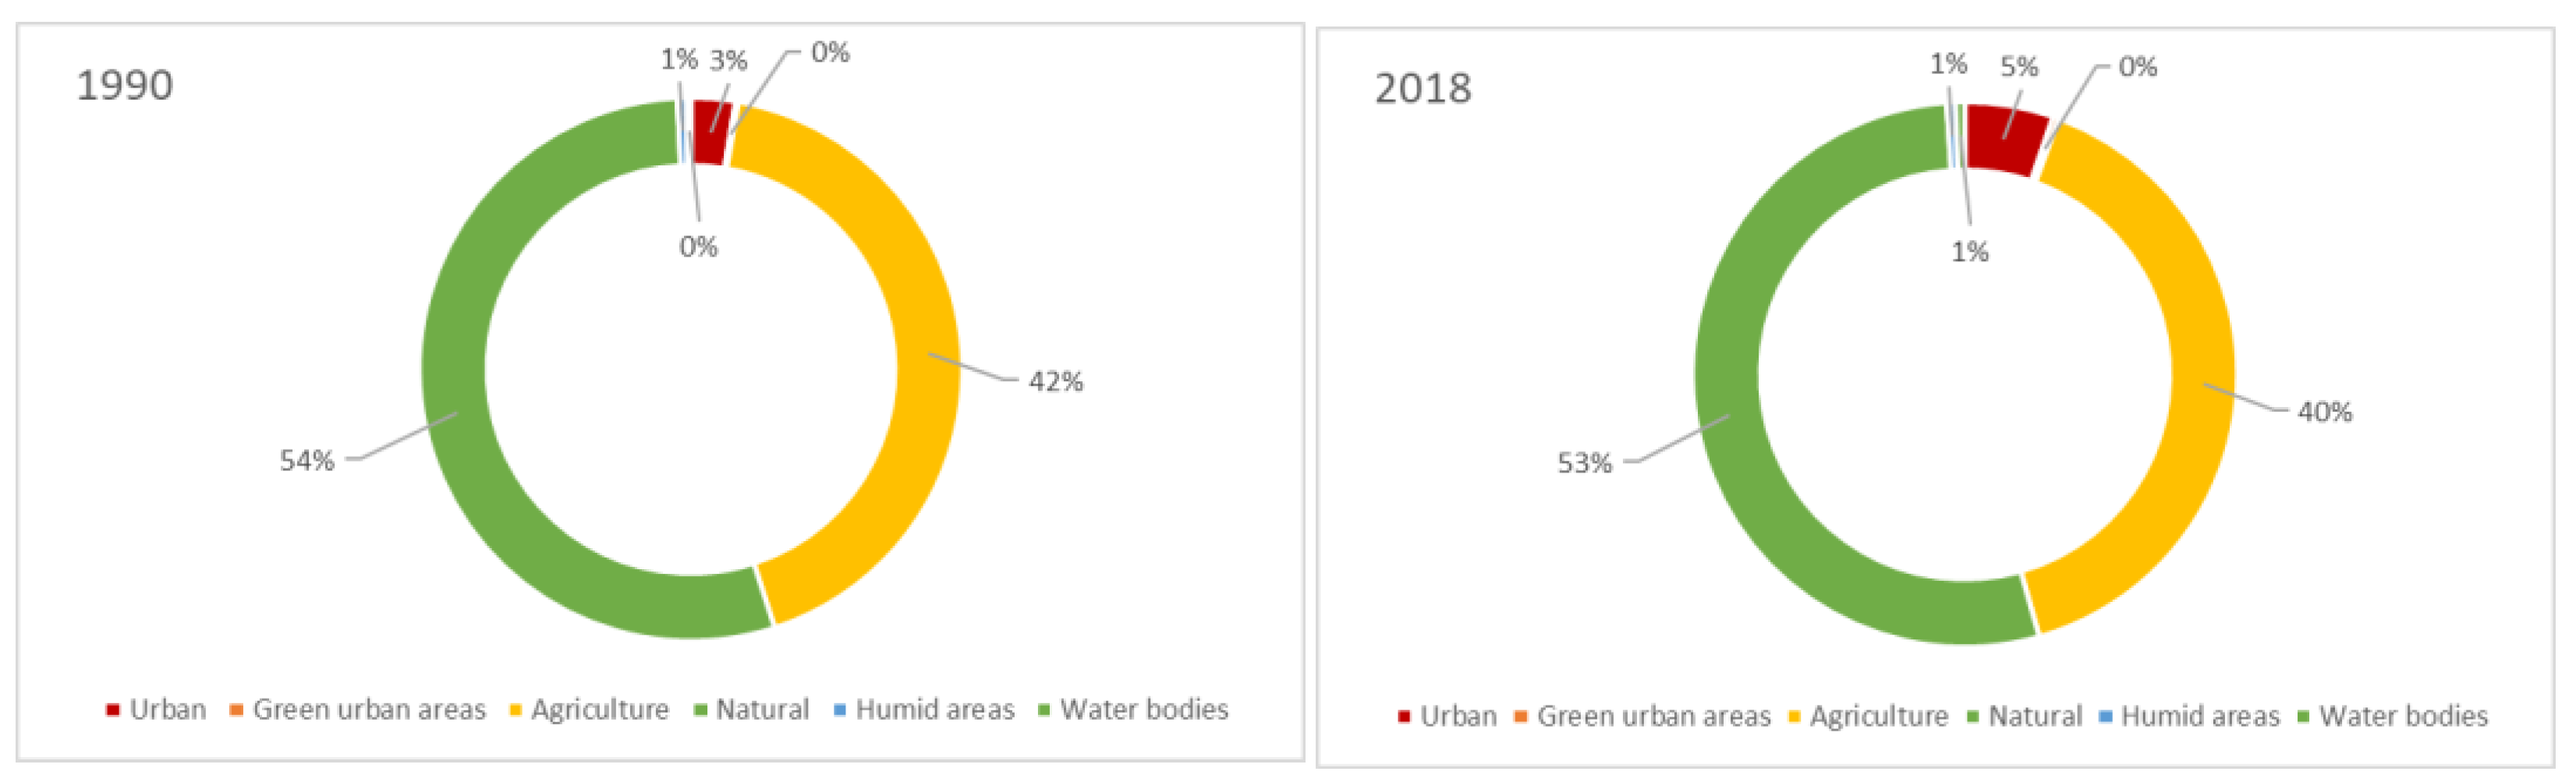
Figure 5.
Classification of the land use/land cover.

Figure 6.
Classification of the soil hydraulic conductivity.

Figure 7.
InVEST flood mitigation model input parameter table.
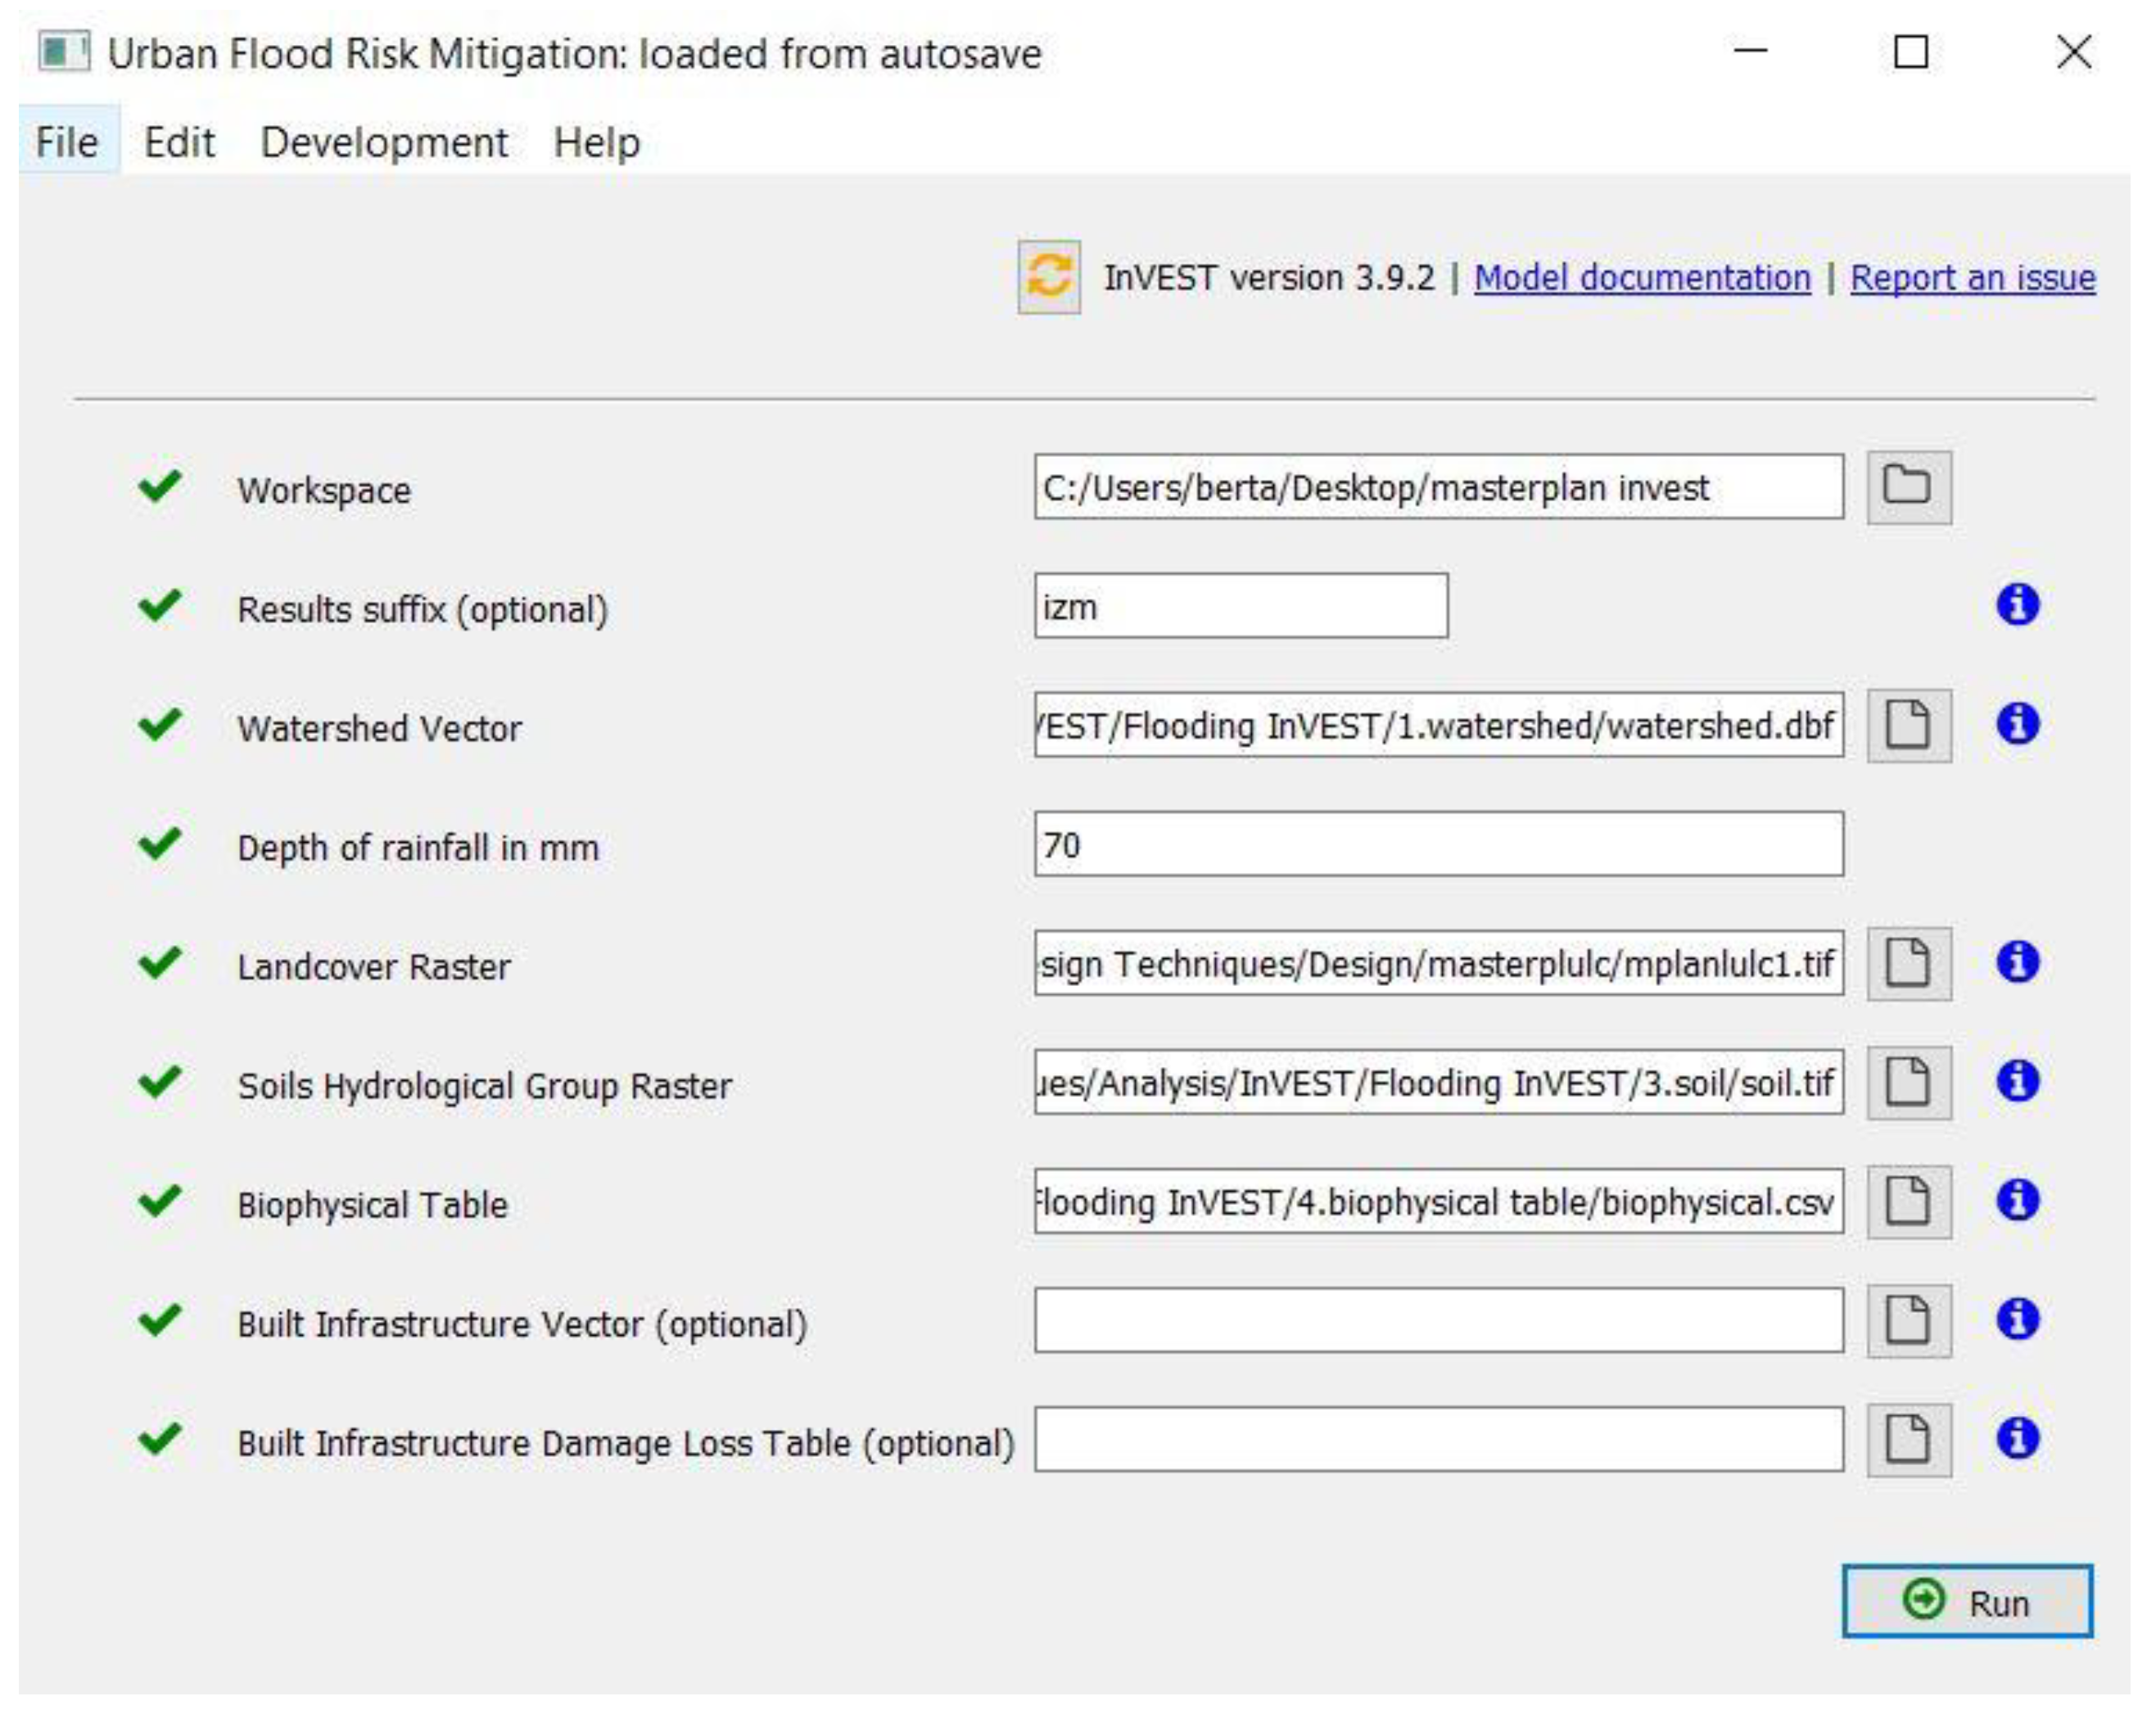
Figure 8.
Run-off retention index.

Figure 9.
Distribution of the steams (with threshold flow accumulation set at 200).
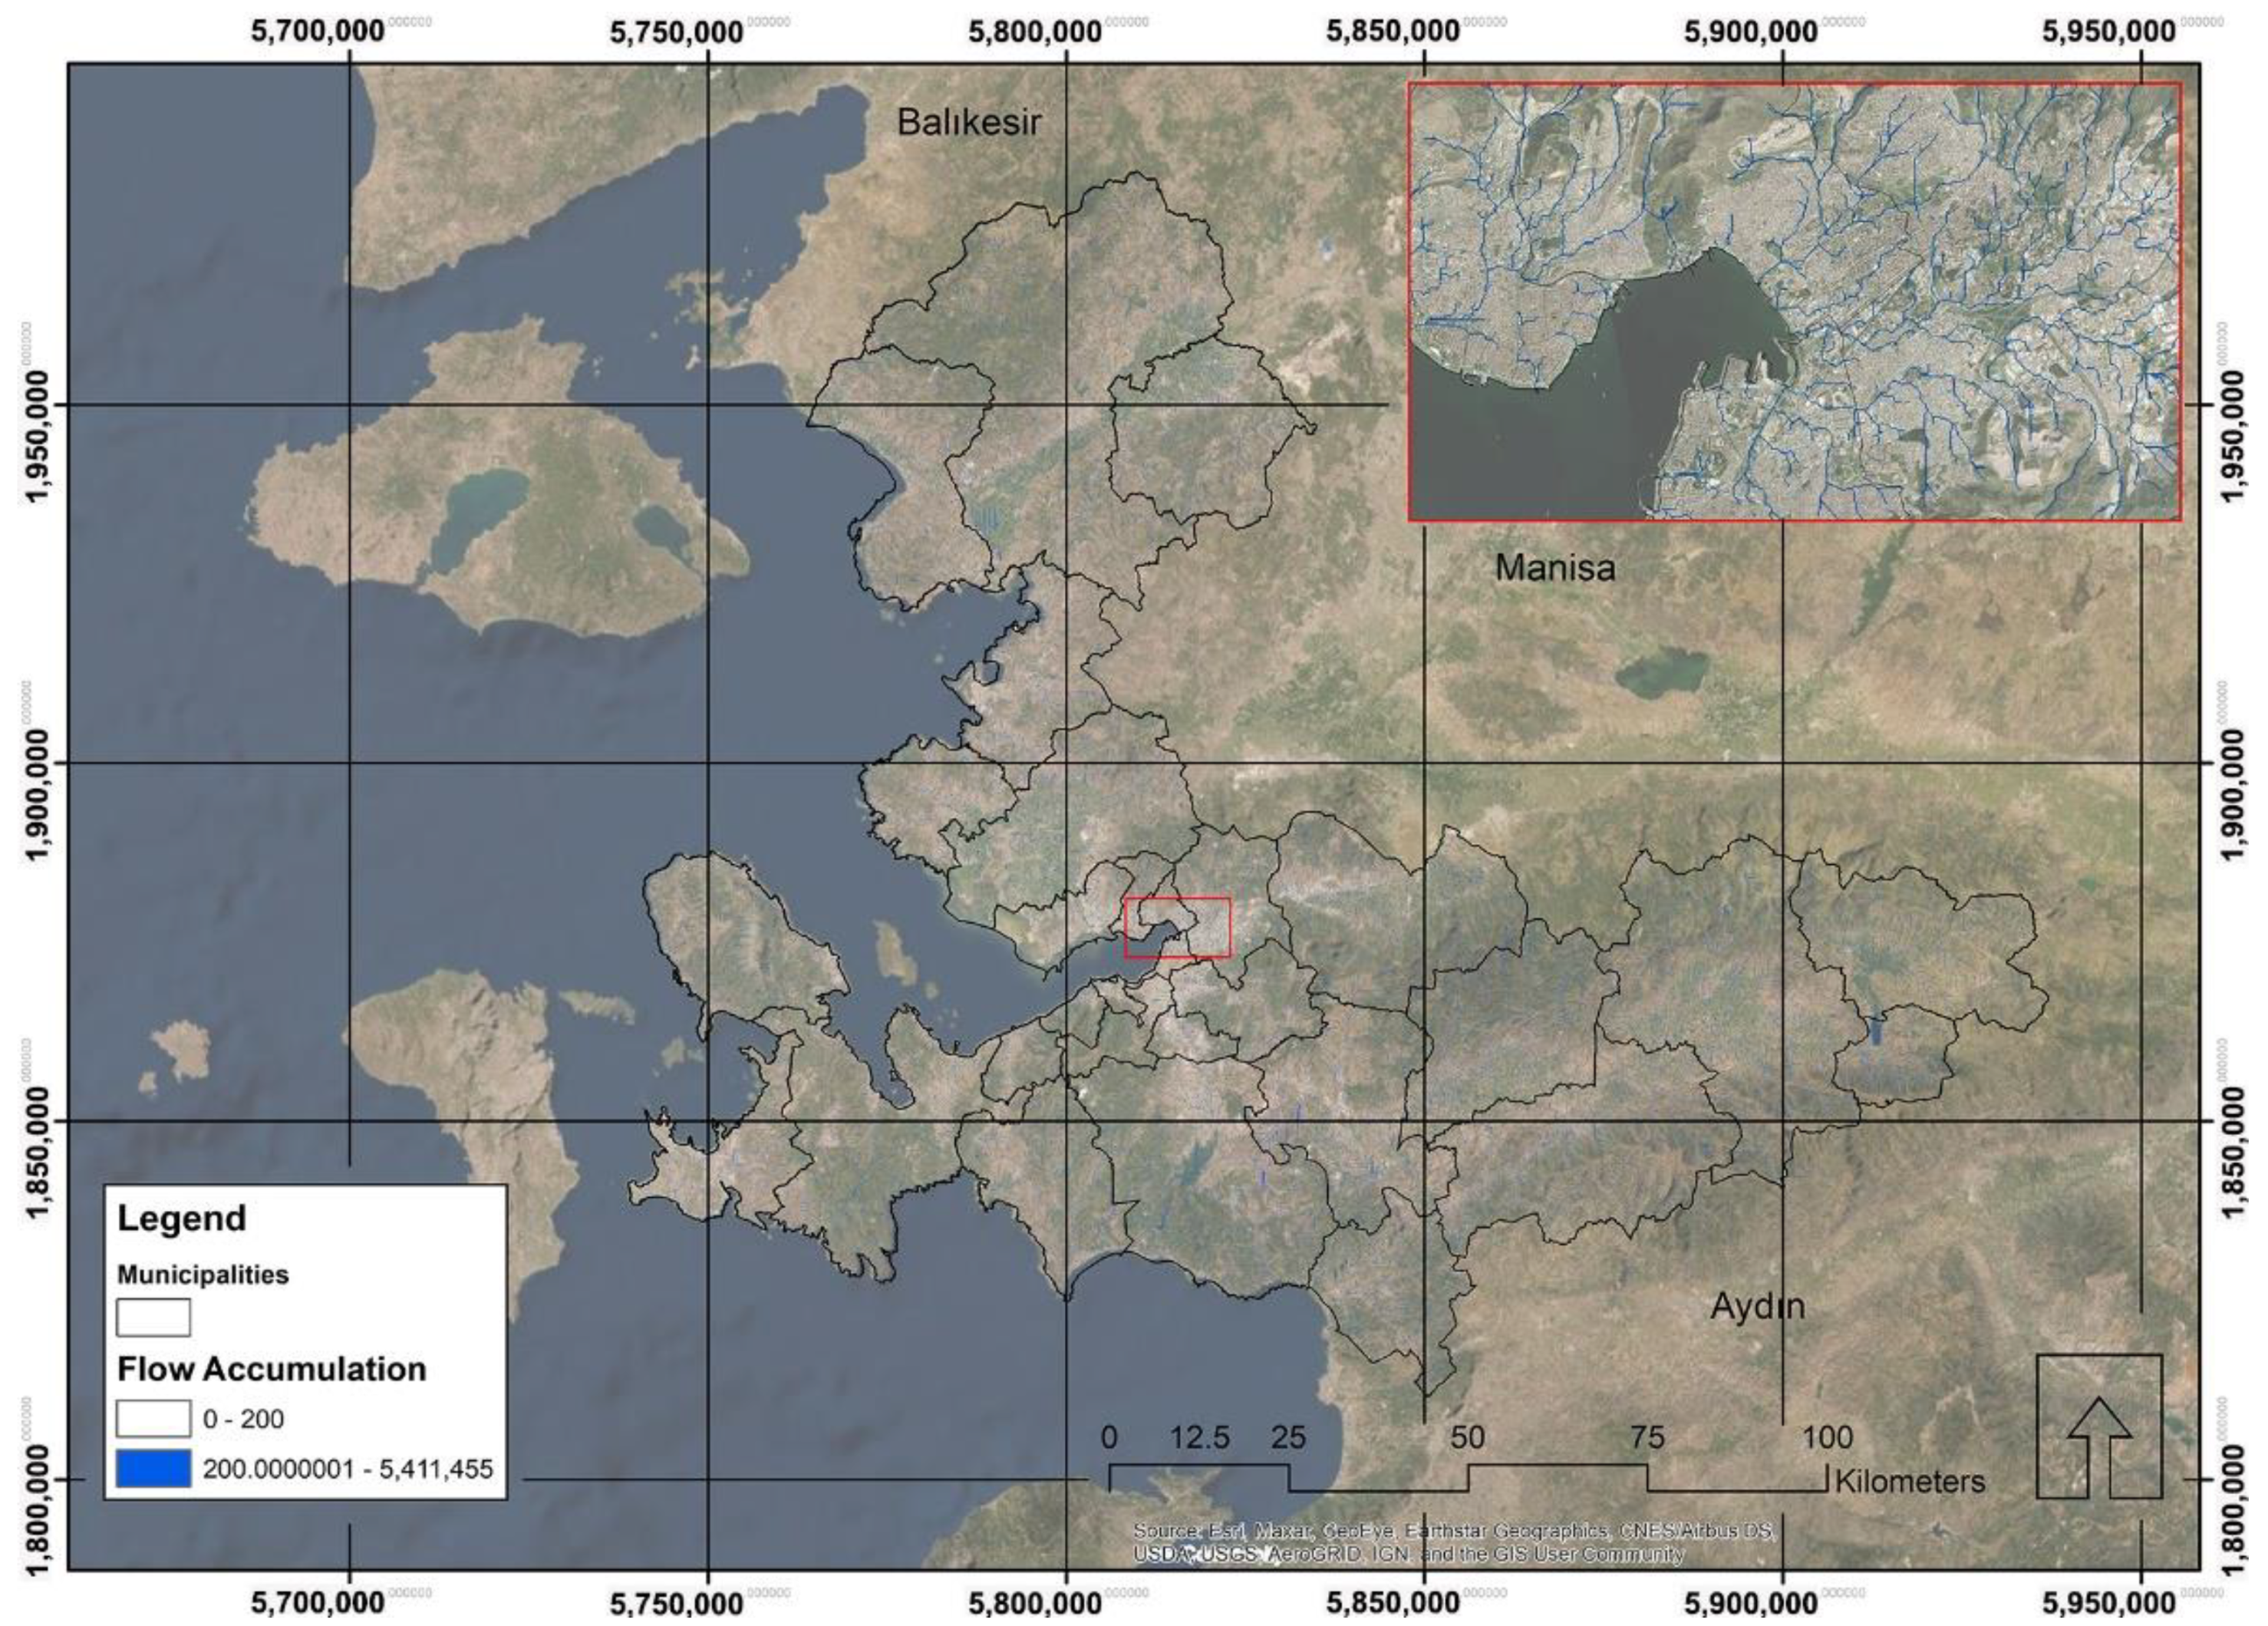
Figure 10.
Distribution of the flood vulnerability.

Figure 11.
The average vulnerability index in the İzmir central districts.

Figure 12.
Present-future comparison of the run-off retention index.

Figure 13.
Conceptual map of green spaces of the study. Source: Authors elaboration.
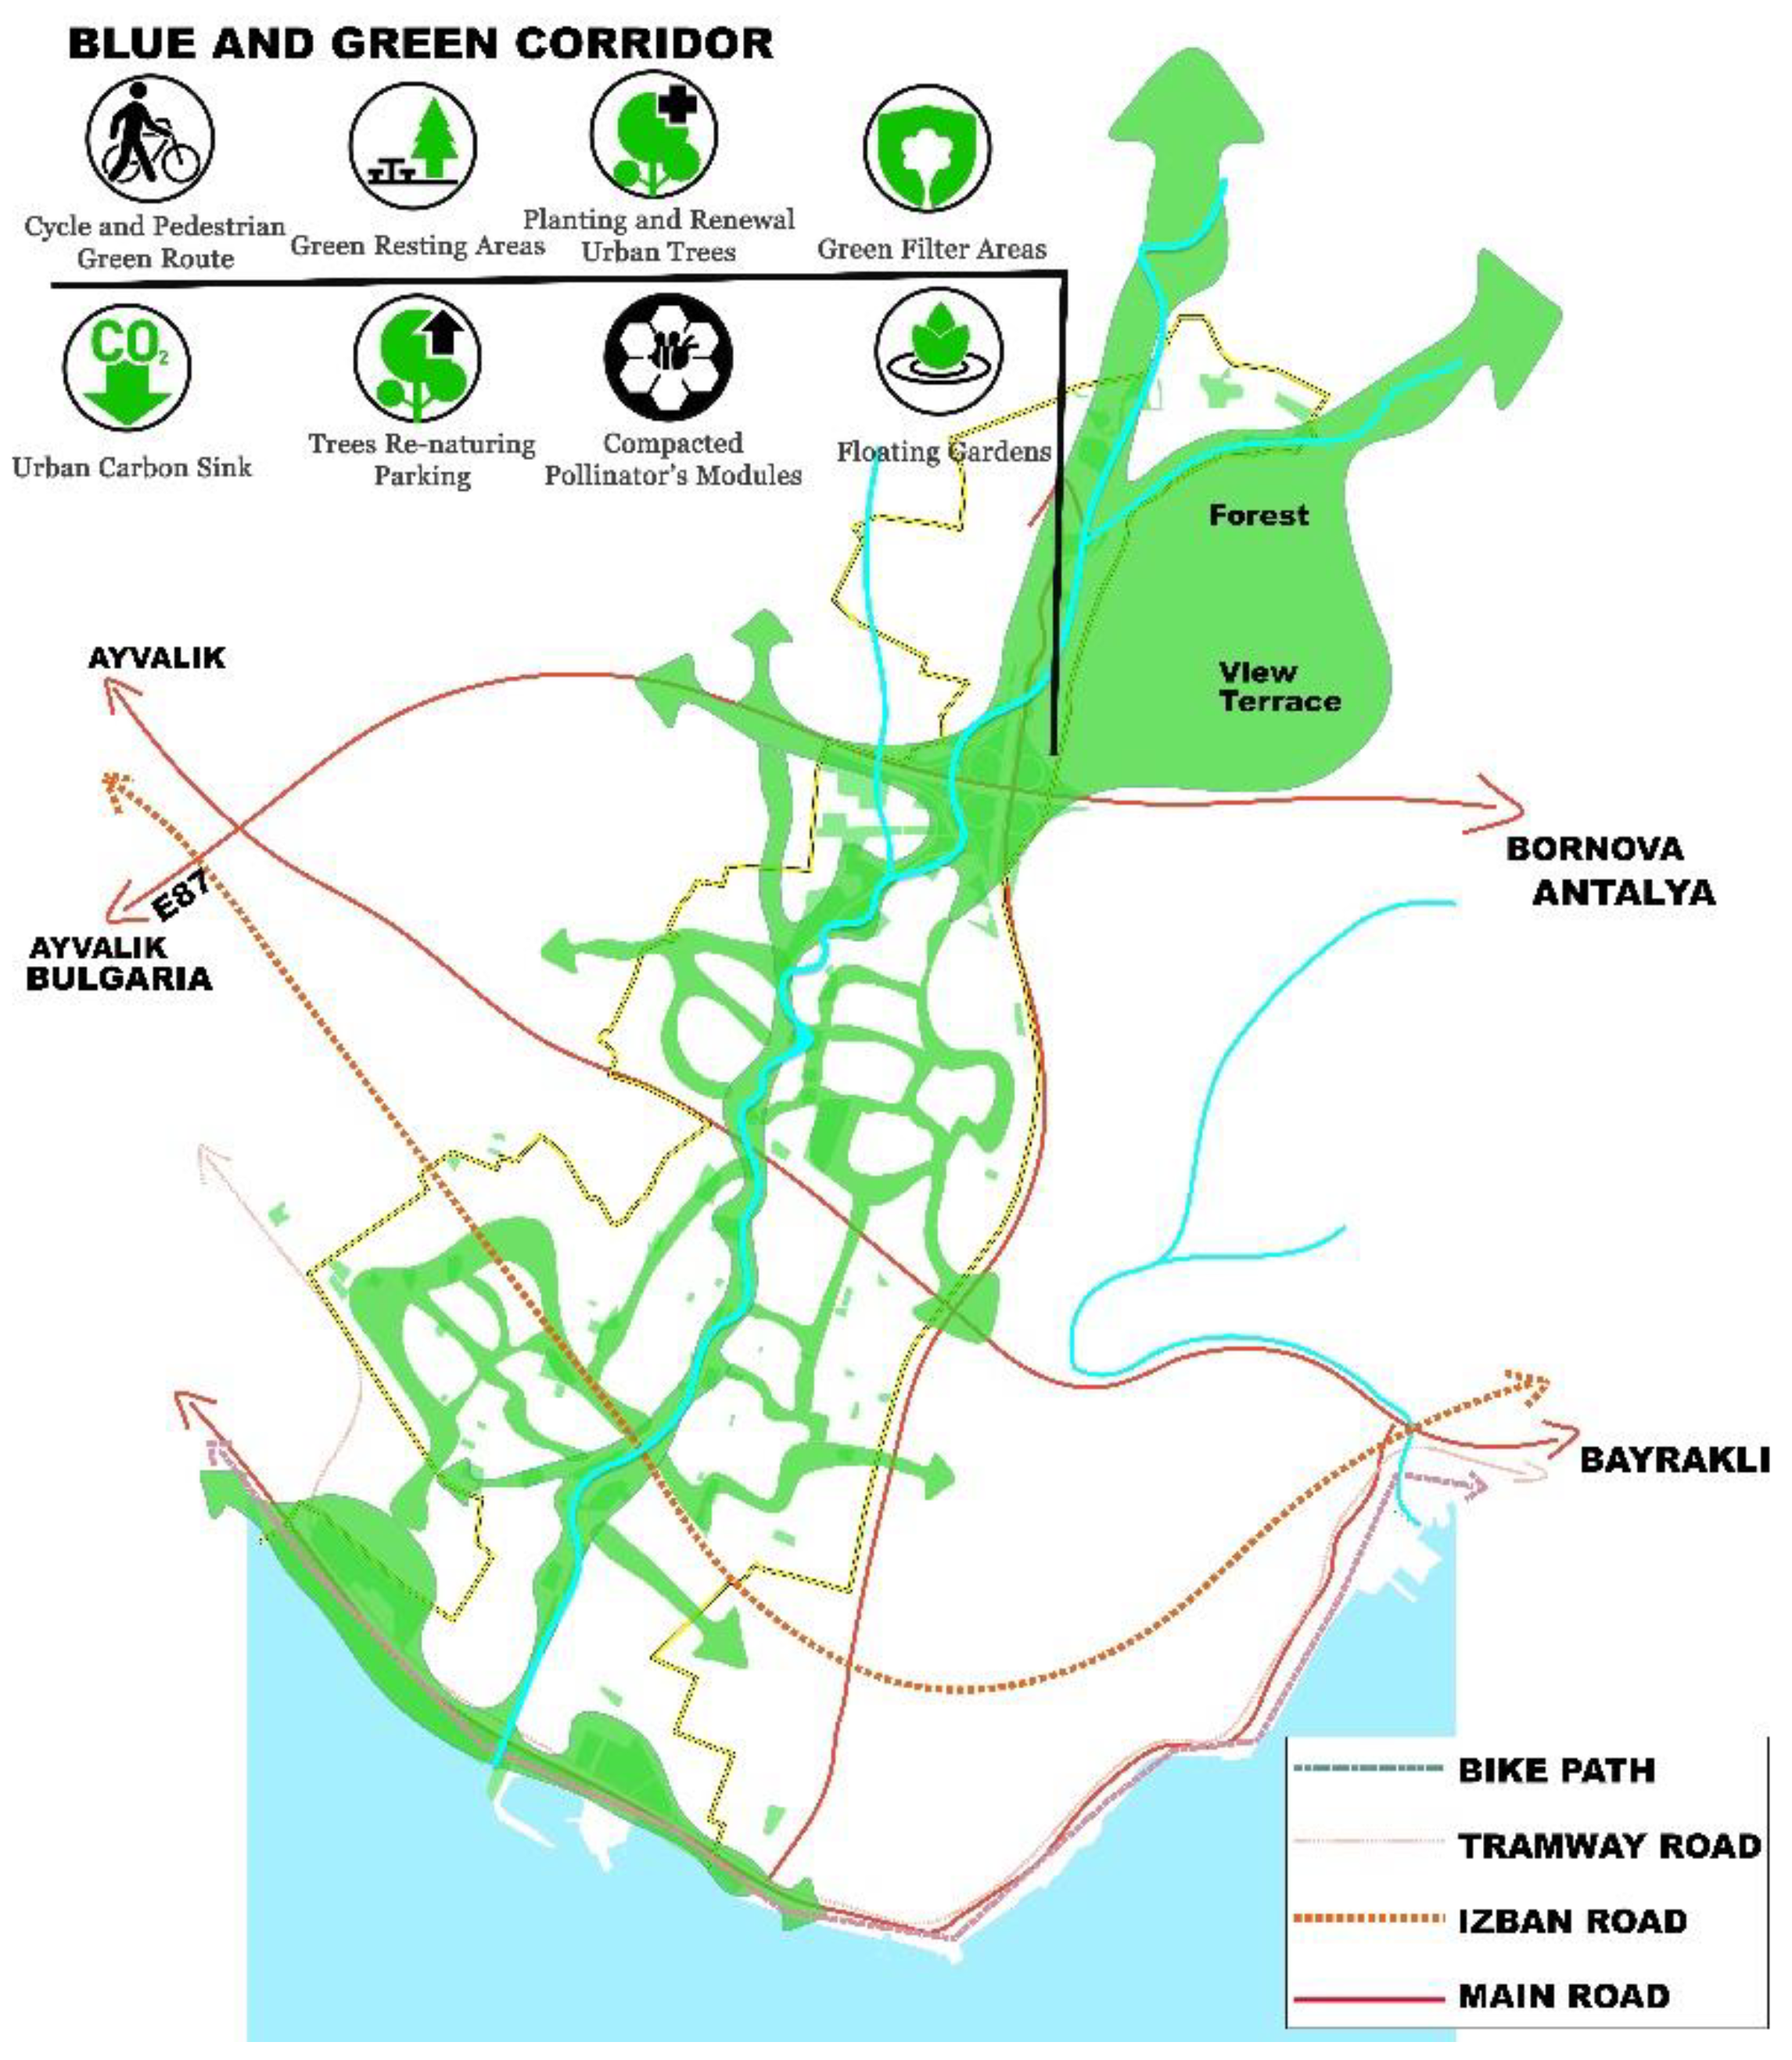
Figure 14.
Master plan area (purple) of the study area (yellow).

Figure 15.
Karşıyaka sponge district master plan.
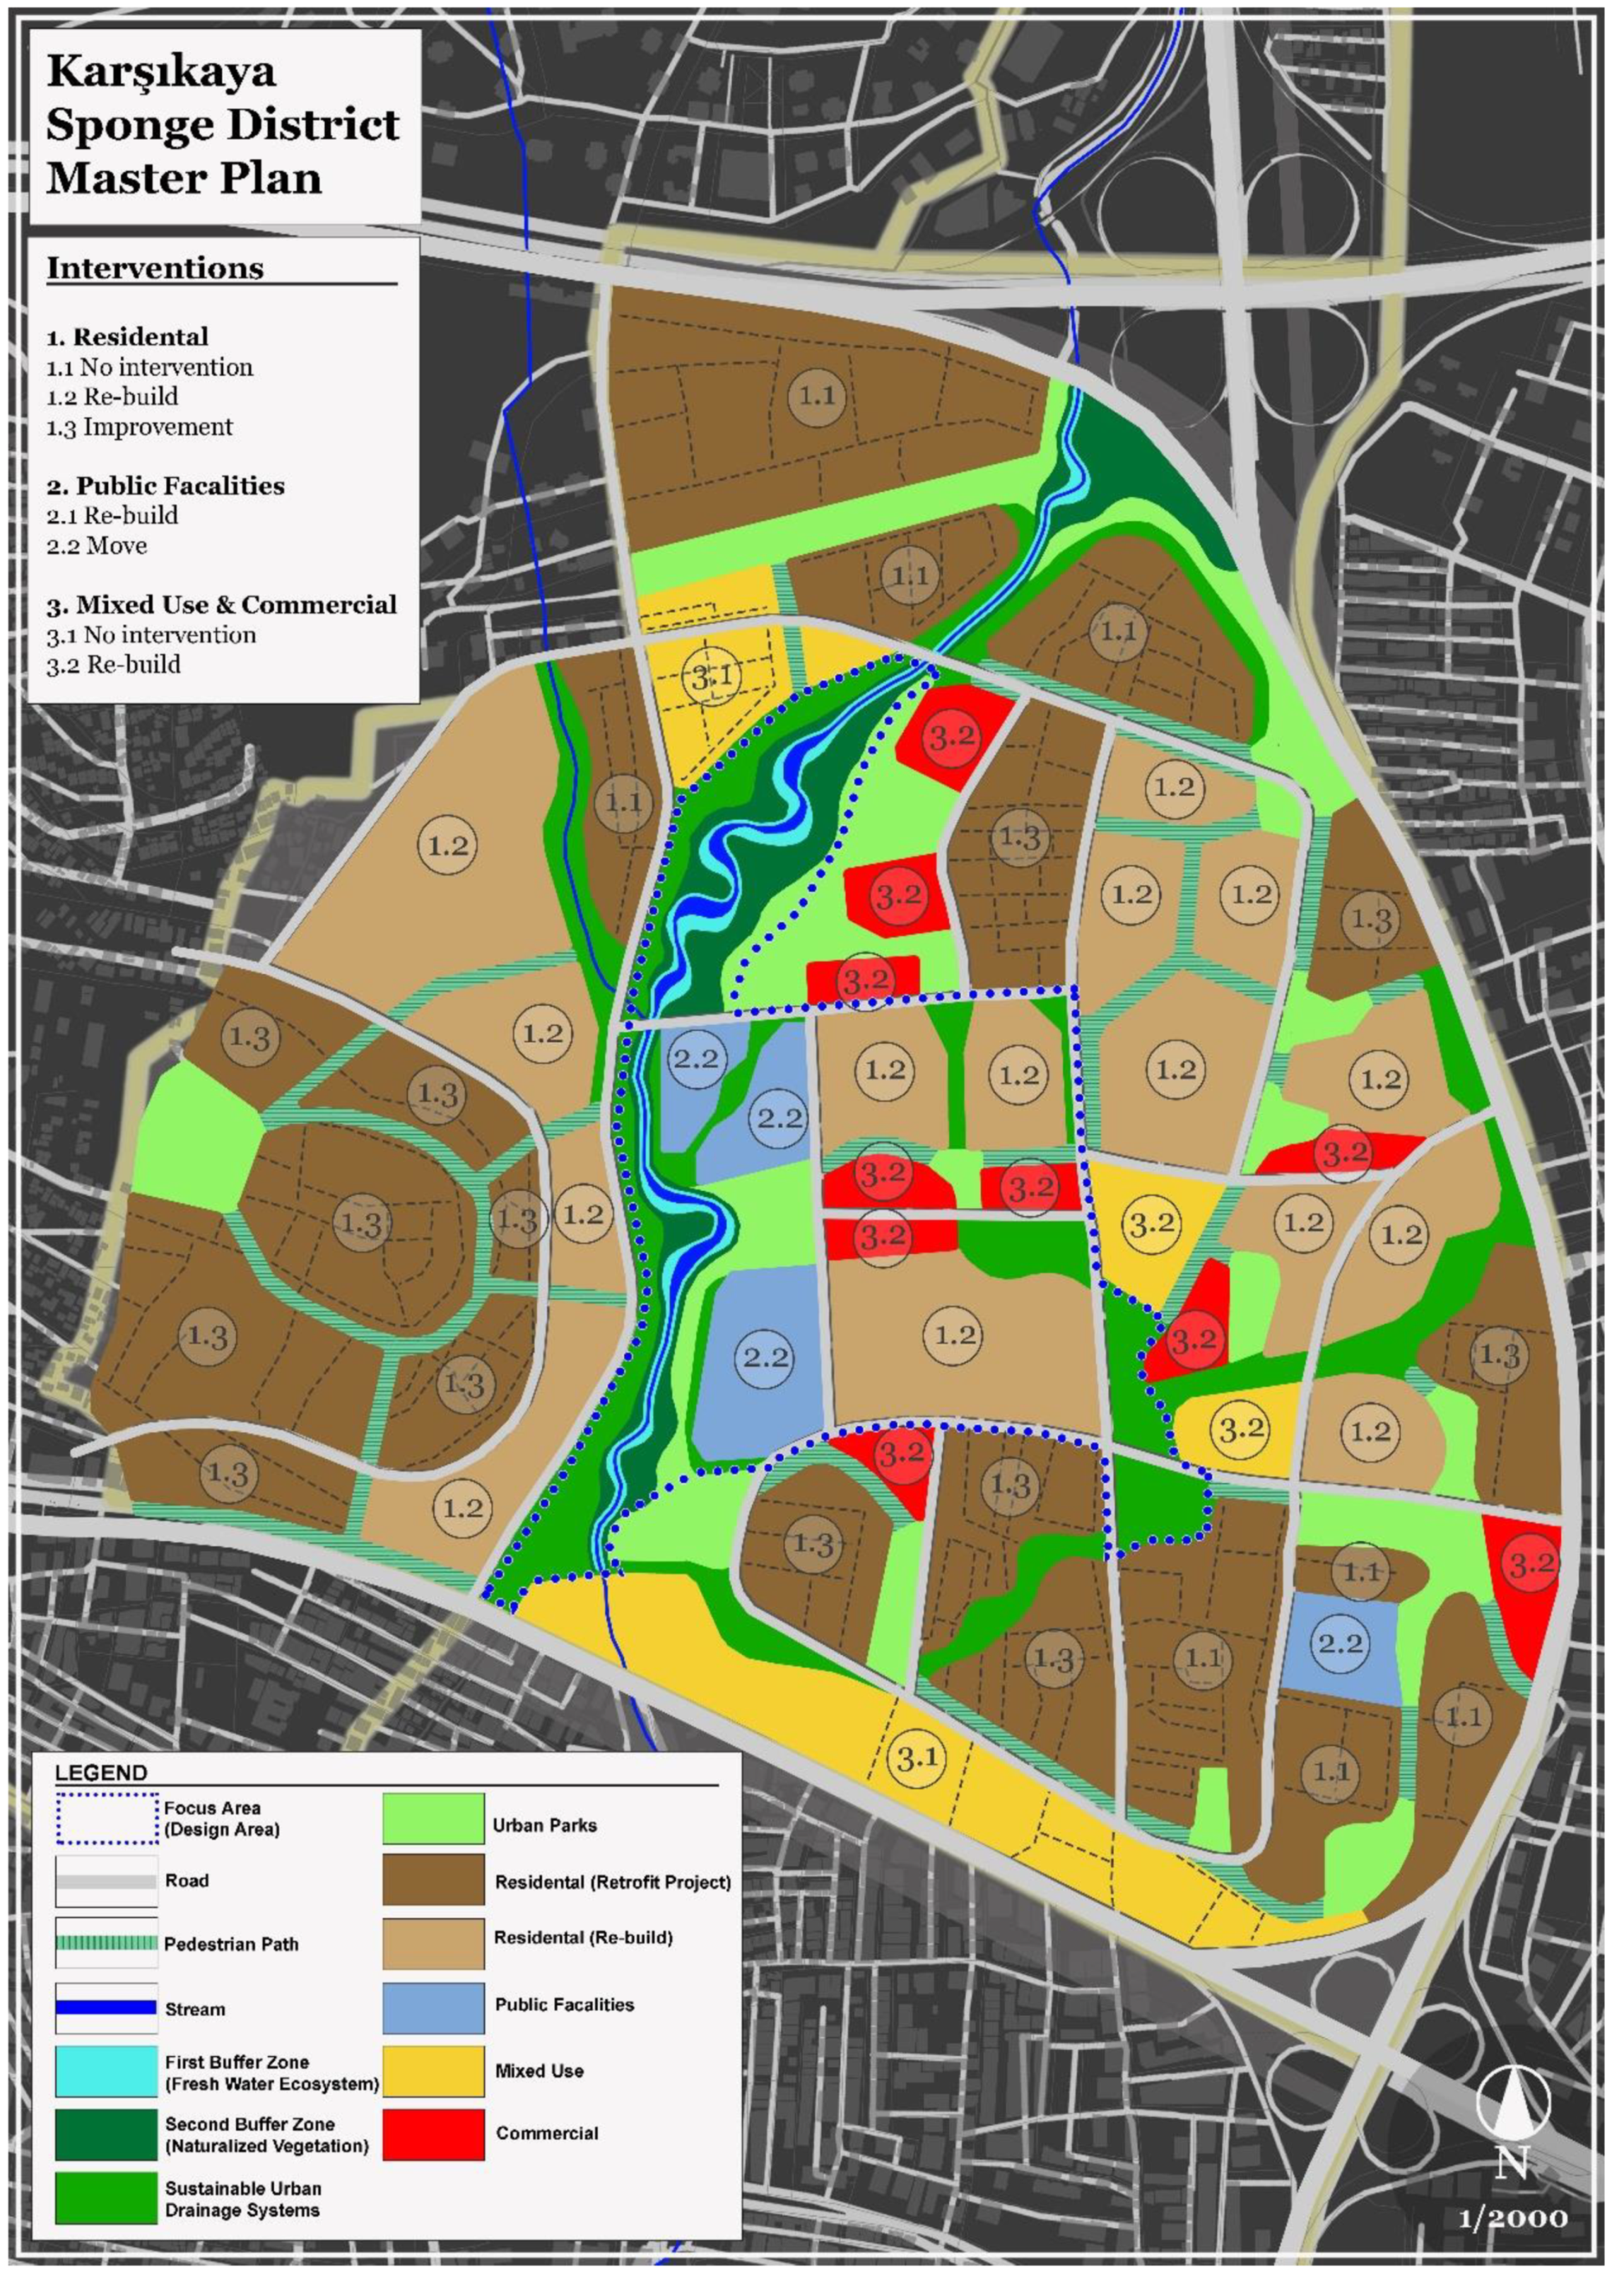
Figure 16.
The final master plan.


Table 1.
Average imperviousness value in the different land uses.
| CODE | LABEL Corine Land Cover | Imperviousness (Mean) (%) | Standard Deviation |
|---|---|---|---|
| 11 | Continuous urban fabric | 75.09 | 33.06 |
| 112 | Discontinuous urban fabric | 34.27 | 37.83 |
| 121 | Industrial or commercial units | 44.38 | 45.40 |
| 122 | Road and rail networks and associated land | 21.82 | 34.94 |
| 123 | Port areas | 50.08 | 47.26 |
| 124 | Airports | 15.70 | 33.51 |
| 131 | Mineral extraction sites | 3.71 | 17.75 |
| 132 | Dumpsites | 10.92 | 29.23 |
| 133 | Construction sites | 7.17 | 23.11 |
| 141 | Green urban areas | 2.74 | 13.86 |
| 142 | Sport and leisure facilities | 14.19 | 25.88 |
| 211 | Non-irrigated arable land | 0.73 | 7.42 |
| 212 | Permanently irrigated land | 0.61 | 6.94 |
| 221 | Vineyards | 0.39 | 5.34 |
| 222 | Fruit trees and berry plantations | 0.80 | 7.85 |
| 223 | Olive groves | 0.44 | 5.69 |
| 231 | Pastures | 0.55 | 6.48 |
| 242 | Complex cultivation patterns | 1.50 | 10.33 |
| 243 | Agriculture with natural vegetation | 0.26 | 4.17 |
| 311 | Broad-leaved forest | 0.01 | 0.95 |
| 312 | Coniferous forest | 0.05 | 1.88 |
| 313 | Mixed forest | 0.03 | 1.46 |
| 321 | Natural grasslands | 0.26 | 4.44 |
| 323 | Sclerophyllous vegetation | 0.19 | 3.72 |
| 324 | Transitional woodland-shrub | 0.13 | 3.16 |
| 331 | Beaches, dunes, sands | 1.30 | 10.45 |
| 332 | Bare rocks | 0.21 | 4.49 |
| 333 | Sparsely vegetated areas | 0.20 | 4.07 |
| 411 | Inland marshes | 0.04 | 1.42 |
| 421 | Salt marshes | 0.09 | 2.34 |
| 422 | Saline | 0.24 | 4.54 |
| 511 | Watercourses | - | - |
| 512 | Water bodies | 0.08 | 2.64 |
| 521 | Coastal lagoons | - | - |
| 522 | Estuaries | - | - |
| 523 | Sea and ocean | 0.97 | 9.17 |
Table 2.
Association between LULC classes and RCN. Source: United States Department of Agriculture (1986). Urban hydrology for small watersheds. Technical Release 55 (TR-55) (Second ed.). Natural Resources Conservation Service, Conservation Engineering Division.
Table 2.
Association between LULC classes and RCN. Source: United States Department of Agriculture (1986). Urban hydrology for small watersheds. Technical Release 55 (TR-55) (Second ed.). Natural Resources Conservation Service, Conservation Engineering Division.
| Cover Description | Curve Numbers for Hydrologic Soil Group | LUCODE | ||||
|---|---|---|---|---|---|---|
| A | B | C | D | |||
| Open space (lawns, parks, golf courses, cemeteries, etc.) | Poor condition (grass cover < 50%) | 68 | 79 | 86 | 89 | 10 |
| Good condition (grass cover > 75%) | 39 | 61 | 74 | 80 | 11 | |
| Impervious areas | Paved parking lots, roofs, driveways, etc. (excluding right of way) | 98 | 98 | 98 | 98 | 9 |
| Urban districts | Commercial and business (85% imp.) | 89 | 92 | 94 | 95 | 8 |
| Industrial (72% imp.) | 81 | 88 | 91 | 93 | 7 | |
| Residential districts by average lot size | 1⁄8 acre or less (town houses) (65% imp.) | 77 | 85 | 90 | 92 | 6 |
| 1⁄4 acre (38% imp.) | 61 | 75 | 83 | 87 | 5 | |
| 1⁄3 acre (30% imp.) | 57 | 72 | 81 | 86 | 4 | |
| 1⁄2 acre (25% imp.) | 54 | 70 | 80 | 85 | 3 | |
| 1 acre (20% imp.) | 51 | 68 | 79 | 84 | 2 | |
| 2 acres (12% imp.) | 46 | 65 | 77 | 82 | 1 | |
| Row crops | Straight row (SR) | Poor | 72 | 81 | 88 | 12 |
| Pasture, grassland, or range—continuous forage for grazing. A | Fair | 49 | 69 | 79 | 84 | 13 |
| Woods. no | Poor | 45 | 66 | 77 | 83 | 14 |
| Fair | 36 | 60 | 73 | 79 | 15 | |
| Good | 30 | 55 | 70 | 77 | 16 | |
Table 3.
Soil hydraulic conductivity parameters. Source: InVEST User’s Guide available at: https://invest-userguide.readthedocs.io/en/latest/urban_flood_mitigation.html (accessed on 21 November 2021).
Table 3.
Soil hydraulic conductivity parameters. Source: InVEST User’s Guide available at: https://invest-userguide.readthedocs.io/en/latest/urban_flood_mitigation.html (accessed on 21 November 2021).
| Group A | Group B | Group C | Group D | |
|---|---|---|---|---|
| Saturated hydraulic conductivity of the least transmissive (soil depth 50 and 100 cm) | >40 m/s | [40;10] m/s | [10;1] m/s | <1 m/s |
Table 4.
Conversion table for hydrological soil classification.
| Geological Units | Hydrological Soil Groups |
|---|---|
| Clastic rocks | A |
| Lime soil | A |
| Sediment soil | A |
| Terrestrial clastic units | B |
| Terrestrial clastic units | B |
| Lacustrine limestone, marn, shale | D |
| Andesite, rhyolite, basalt, dacite | C |
| Pyroclastic units | D |
| Granitoid | D |
| Oligocene volcanic units | C |
| Volcano-sedimentary units | C |
| Flysch | D |
| Nautical limestone | B |
| Ophiolite-serpentinite-basalt | D |
| Marble, limestone | B |
| Neritic limestone | B |
| Carbonate, metamorphic and clastic units | B |
| Granitoid | D |
| Clastic and carbonate sedimentary units | B |
| Schist, quartzite, quartz-schist, phyllite | B |
| Carbonate and clastic units | C |
| Schist, marble, quartzite, quartz-schist, phyllite | D |
| Gneissoid, schist, migmatite | D |
| Meta-granitoid | D |
Table 5.
Biophysical output table with the run-off and retention parameters.
| Municipality | Run-Off Retention Index | Run-Off Retention (m3) | Flood Volume (m3) |
|---|---|---|---|
| Aliağa | 0.70 | 17,173,508.23 | 7,445,036.76 |
| Balçova | 0.63 | 920,932.20 | 539,120.95 |
| Bayındır | 0.81 | 32,146,939.00 | 7,504,043.92 |
| Bayraklı | 0.49 | 1,186,410.48 | 1,243,233.71 |
| Bergama | 0.73 | 79,583,587.02 | 29,190,154.92 |
| Beydağ | 0.68 | 8,032,429.95 | 3,693,976.89 |
| Bornova | 0.66 | 10,836,740.28 | 5,570,777.46 |
| Buca | 0.70 | 10,194,175.78 | 4,420,977.82 |
| Çeşme | 0.65 | 12,096,405.84 | 6,460,727.57 |
| Çiğli | 0.75 | 7,034,433.31 | 2,395,672.43 |
| Dikili | 0.73 | 2,5816,567.86 | 9,527,504.64 |
| Foça | 0.68 | 10,748,412.06 | 5,094,393.57 |
| Gaziemir | 0.63 | 2,748,811.78 | 1,644,017.36 |
| Güzelbahçe | 0.76 | 4,474,773.62 | 1,397,883.67 |
| Karabağlar | 0.64 | 4,475,143.90 | 2,563,685.84 |
| Karaburun | 0.77 | 21,247,082.42 | 6,335,984.49 |
| Karşıyaka | 0.58 | 2,057,939.97 | 1,510,016.29 |
| Kemalpaşa | 0.84 | 38,472,376.20 | 7,244,207.49 |
| Kınık | 0.79 | 27,883,205.59 | 7,207,772.85 |
| Kiraz | 0.67 | 25,887,204.19 | 12,589,072.30 |
| Konak | 0.28 | 460,533.59 | 1,201,959.60 |
| Menderes | 0.79 | 43,733,870.88 | 11,767,459.95 |
| Menemen | 0.76 | 30,891,183.57 | 9,712,214.58 |
| Narlıdere | 0.76 | 2,420,437.15 | 751,970.18 |
| Ödemiş | 0.75 | 53,831,011.16 | 17,482,136.18 |
| Seferihisar | 0.75 | 20,012,923.72 | 6,783,987.76 |
| Selçuk | 0.81 | 19,723,677.33 | 4,580,217.88 |
| Tire | 0.76 | 41,076,490.26 | 12,727,152.97 |
| Torbalı | 0.80 | 31,240,248.61 | 8,050,377.81 |
| Urla | 0.78 | 36,038,690.17 | 10,438,909.74 |
Table 6.
Average vulnerability values of different land use in soil class 4 (worst hydraulic conductibility).
Table 6.
Average vulnerability values of different land use in soil class 4 (worst hydraulic conductibility).
| Land Use | Vulnerability (Average) | Average District Size | Imperviousness (Average) | Forest (Average) | Pop/ha |
|---|---|---|---|---|---|
| Airports | 0.20 | 1,022,491.82 | 30.09 | 2.58 | - |
| Arable land (annual crops) | 0.16 | 312,838.00 | 2.51 | 10.16 | 2.01 |
| Complex and mixed cultivation patterns | 0.25 | 93,845.99 | 1.06 | 20.22 | - |
| Construction sites | 0.33 | 35,815.19 | 20.76 | 0.82 | - |
| Continuous urban fabric (S.L.: >80%) | 0.78 | 4244.60 | 89.29 | 0.37 | 350.79 |
| Discontinuous dense urban fabric (S.L.: 50–80%) | 0.56 | 8846.49 | 61.42 | 3.08 | 211.05 |
| Discontinuous low-density urban fabric (S.L.: 10–30%) | 0.29 | 13,878.40 | 25.00 | 6.51 | 60.20 |
| Discontinuous medium density urban fabric (S.L.: 30–50%) | 0.39 | 12,887.26 | 40.88 | 5.40 | 98.06 |
| Discontinuous very-low-density urban fabric (S.L.: <10%) | 0.22 | 10,004.88 | 9.83 | 8.21 | 30.15 |
| Fast transit roads and associated land | 0.36 | 181,461.71 | 34.48 | 1.43 | - |
| Forests | 0.21 | 342,492.43 | 0.16 | 56.22 | - |
| Green urban areas | 0.32 | 14,102.58 | 20.66 | 19.10 | - |
| Herbaceous vegetation associations (natural grassland, moors, etc.) | 0.26 | 311,558.56 | 2.24 | 29.78 | - |
| Industrial, commercial, public, military, and private units | 0.40 | 21,761.79 | 43.44 | 3.32 | 28.88 |
| Isolated structures | 0.15 | 4728.27 | 2.28 | 14.89 | 48.16 |
| Land without current use | 0.37 | 10,960.48 | 28.06 | 4.50 | - |
| Mineral extraction and dump sites | 0.31 | 52,556.34 | 11.15 | 2.20 | - |
| Open spaces with little or no vegetation (beaches, dunes, bare rocks, glaciers) | 0.20 | 64,715.20 | 2.04 | 6.25 | - |
| Other roads and associated land | 0.40 | 262,561.67 | 16.67 | 10.23 | - |
| Pastures | 0.23 | 67,119.48 | 1.51 | 10.59 | 3.85 |
| Permanent crops (vineyards, fruit trees, olive groves) | 0.17 | 144,370.54 | 1.02 | 22.53 | 1.85 |
| Port areas | 0.47 | 11,270.88 | 48.10 | 3.12 | 681.99 |
| Railways and associated land | 0.37 | 63,622.48 | 40.75 | 2.95 | - |
| Sports and leisure facilities | 0.35 | 25,422.58 | 29.90 | 9.14 | 14.15 |
| Water | 0.18 | 238,742.25 | 9.65 | 9.47 | - |
| Wetlands | 0.12 | 449,345.63 | 1.78 | 10.46 | - |
Table 7.
Results of the sponge district concept application.
| Time | Run-Off Retention Index | Run-Off Retention Volume (m3) | Flood Volume (m3) | Run-Off Retention Volume (m3) |
|---|---|---|---|---|
| Present | 0.38 | 265,623.49 | 298,282.55 | 265,623.49 |
| Future | 0.60 | 323,006.89 | 240,941.14 | 323,006.89 |
Table 8.
Interventions used in the master plan.
| Interventions | Nature-Based Solution Implementations | Residential Areas | Public Facilities | Mixed and Commercial Areas | Urban Green System | |||||||
|---|---|---|---|---|---|---|---|---|---|---|---|---|
| 1.1 | 1.2 | 1.3 | 2.1 | 2.2 | 3.1 | 3.2 | 4.1 | 4.2 | 4.3 | 4.4 | ||
| No intervention | The current state of these areas with good construction status will be preserved. | X | X | X | ||||||||
| Re-build | Buildings in poor condition will be demolished and rebuilt according to new construction conditions. | X | ||||||||||
| A green facade will be applied in buildings with four floors or more. | X | X | ||||||||||
| Green roof applications will be made in buildings with less than four floors. | X | |||||||||||
| Green pedestrian circulation compatible with water movements will be constructed inside the building blocks. | X | |||||||||||
| Rainwater collection tanks will be located under the structures with a floor area of 200 m2 and above. | X | |||||||||||
| With the slope of the road, the water will be filtered and directed to the storage areas. | X | |||||||||||
| Improvement | The buildings and their surroundings will be changed from gray to green with retrofit projects. | X | ||||||||||
| Move | Relocalization of public services. | X | ||||||||||
| The same capacity and nature-friendly construction will be provided at the new location. | X | |||||||||||
| Walking Path | Seasonal channels in the form of walkways to direct the water will be placed. | X | ||||||||||
| Recreational Facilities | Pop-up gardens, parks, pavilions, amphitheater, pounds, and recreational uses, etc., that do not put pressure on nature will be created. | X | ||||||||||
| Active Green | Green areas, which are strengthened with sustainable urban drainage systems, will be designed for the use of urban residents integrated with nature. | X | ||||||||||
| Passive Green | Green areas without active use will be designed to help regulate the carbon cycle and drain water. | X | ||||||||||
Publisher’s Note: MDPI stays neutral with regard to jurisdictional claims in published maps and institutional affiliations. |
© 2022 by the authors. Licensee MDPI, Basel, Switzerland. This article is an open access article distributed under the terms and conditions of the Creative Commons Attribution (CC BY) license (https://creativecommons.org/licenses/by/4.0/).
Share and Cite
MDPI and ACS Style
Salata, S.; Arslan, B. Designing with Ecosystem Modelling: The Sponge District Application in İzmir, Turkey. Sustainability 2022, 14, 3420. https://doi.org/10.3390/su14063420
AMA Style
Salata S, Arslan B. Designing with Ecosystem Modelling: The Sponge District Application in İzmir, Turkey. Sustainability. 2022; 14(6):3420. https://doi.org/10.3390/su14063420
Chicago/Turabian StyleSalata, Stefano, and Bertan Arslan. 2022. "Designing with Ecosystem Modelling: The Sponge District Application in İzmir, Turkey" Sustainability 14, no. 6: 3420. https://doi.org/10.3390/su14063420
Note that from the first issue of 2016, this journal uses article numbers instead of page numbers. See further details here.