1. Introduction
Cultivated land is a natural resource on which humans rely for survival, and the strict protection of cultivated land is critical for food security and socio-economic stability [
1,
2,
3]. However, disorderly expansion of urban areas and excessive use of chemical fertilizer has destroyed the ecological environment of cultivated land, which has affected its spatial structure and quality [
4,
5] as well as the sustainability of natural elements adjacent to the cultivated land. Optimizing and configuring the spatial layout of cultivated land has long-term and strategic significance.
The research of cultivated land protection mainly focuses on basic cultivated land optimization layout based on the cultivated land-quality evaluation. Some studies focused on the quantity, quality, and ecological perspective and constructed a theoretical system of cultivated land-quality evaluation to provide a scientific basis for the improvement of cultivated land quality [
6,
7,
8,
9,
10,
11]. For instance, Huang et al. used entropy weight, comprehensive index method, spatial analysis, and obstacle degree model to explore the spatio-temporal characteristics and obstacle factors of cultivated land resources in quantity, quality, and ecological security [
12]; Wang et al. built a theoretical framework for the spatial zoning of cultivated land based on the trinity of quantity, quality, and ecology and formed an indicator system for the spatial zoning of cultivated land based on these three elements [
13]. Based on the existing research, experts proposed methods and approaches for the optimization of basic cultivated land layout based on the comprehensive evaluation of regional cultivated land quality [
14,
15,
16]. Studies used GIS spatial analysis and multifactor comprehensive evaluation methods to evaluate the cultivated land quality [
17,
18]. However, more in-depth perspectives and frameworks are expected to precisely direct the optimization of the cultivated land layout.
In the Third Plenary Session of the 18th Communist Party of China Central Committee in 2013, General Secretary Xi pointed out that the country’s mountains, water, forestland, cultivated land and lake form a community of shared life. Huang et al. then put forward “orderly ecological systems for mountain, water, forestland, cultivated land, and lake” and innovative ways to regulate the use of natural resources [
19]. In 2017, Xi proposed the basic concept of constructing a community of shared life, which considered the coordinated development of mountains, water, forestland, cultivated land, lake, and grassland (life community hereinafter) in the report of the Communist Party of China’s 19th National Congress. He pointed out that the protection of cultivated land should be based on the dimensions of quantity, quality, and ecology in this context [
20]. Studies exploring the issue of cultivated land protection from the perspective of the life community have attracted attention. Li et al. (2018) found that the protection and management of the life community is an important measure to improve the service function of the terrestrial ecosystem and ensure the harmonious coexistence between humans and nature [
21]. Cultivated land protection considers the cultivated land and the other natural elements in the surrounding environment, which is an important manifestation of the systematic view of the life community. Wang et al. (2018) analyzed the connotation, characteristics, and practice paths of the life community, which provided empirical support for the life community theory [
22]. However, few studies focused on the quantitative analysis and spatial layout optimization of cultivated land based on the perspective of the life community.
This study aimed to quantitatively analyze the quality of cultivated land, clarify the relationship between cultivated land quality and other natural elements, and provide a spatial layout optimization for cultivated land protection from the perspective of the life community. The indicators impacting cultivated land were quantitatively analyzed using a comprehensive ecological niche suitability model and Geographical Information Science (GIS) methods. The path analysis was used to determine the contribution rate of various ecological factors to cultivated land from 2000 to 2020, and the land conversion rules for the ecological optimization scenario were developed accordingly. Additionally, GeoSOS-FLUS model was used to simulate land use in 2040 under two scenarios: natural and ecological optimization.
2. Study Area and Data Sources
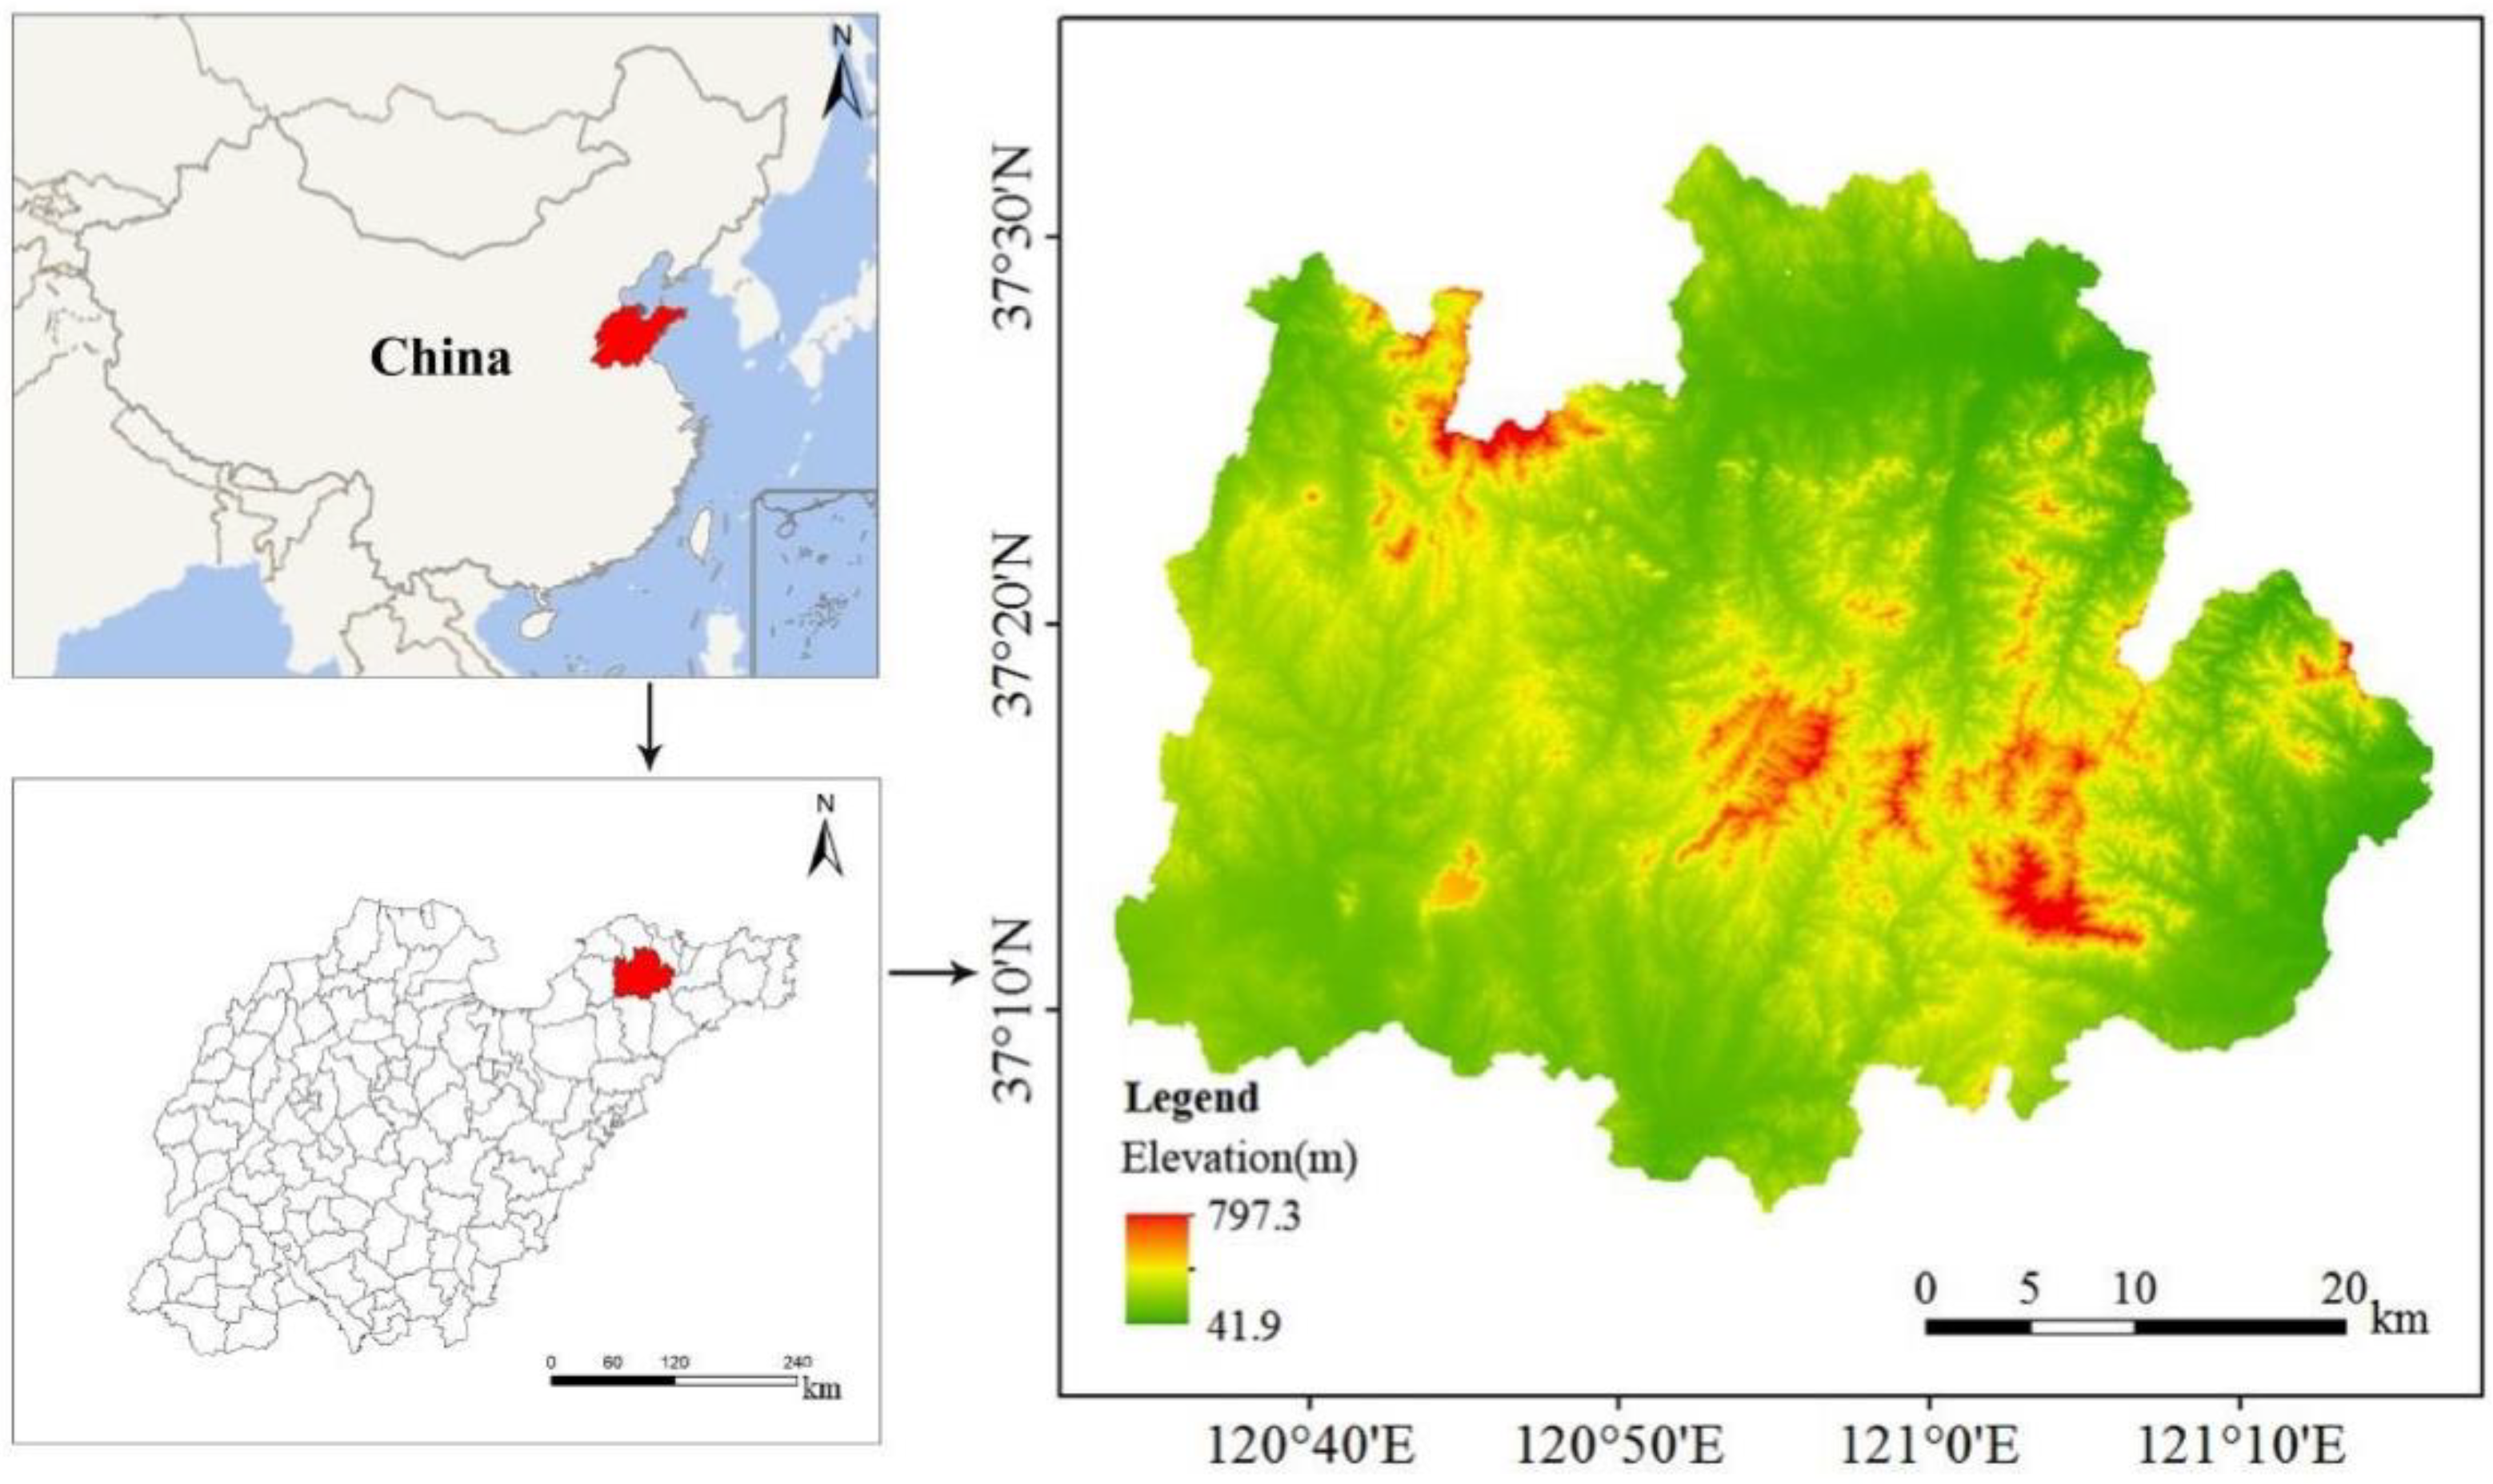
Qixia is located in the eastern Shandong Province, China (120°33′–121°15′ E, 37°05′–37°32′ N) with a total area of 2016.7 km
2 (
Figure 1). The climate in the study area is warm and semi-humid, the average annual temperature is 11.6 °C, the average annual precipitation is 743.1 mm, and the total annual sunshine hours is 2631 h. The territory is 41.9–797.3 m above sea level, with undulating mountains, continuous hills, and complex terrain. It is a typical mountainous and hilly area in China, with more than 2500 peaks. The rich and diverse types of land resources, the multi-level basin system formed by the vertical differentiation of mountains, and the slope land-use pattern provide a typical study case.
In this study, 1:100,000 land-use type maps obtained from Landsat 5 TM (2000) and Landsat 8 OLI (2020) remote sensing images (
http:/www.gscloud.cn/ (accessed on 10 July 2021)) were used. The land-use types are classified into six categories by using the SVM method based on LUCC classification criteria and the land-use status in the study area: cultivated land, forest land, orchard land, construction land, water, and grassland. Ten 400 × 400 pixel verification zones were randomly selected on the 2000 and 2020 images, respectively, and the manual interpretation results of the verification zones were employed as ground truth references to measure the accuracies of the SVM classification. The overall classification accuracy, including user’s and producer’s accuracies and the kappa coefficients, were computed. The classification accuracies were all higher than 0.85, and the kappa coefficients were both more than 0.80.
National Basic Geographic Information Center provided the GDEM elevation map (30 m resolution). A total of 1399 points was established based on the principle of covering the study area’s topography, cover, and soil types in 2008. Field observation, sampling, and laboratory analysis were used to discern the soil layer thickness, soil texture, and soil nutrients of sampling points as well as perform Kriging interpolation on the data. To create a rainfall spatial distribution map, we converted the multi-year average rainfall of meteorological stations into point data and performed a Kriging interpolation on them. WGS 1984 UTM zone 51N is the projection coordinate system used in this study.
3. Methods
The workflow of this study is shown in
Figure 2. The main steps included (1) developing an index system for evaluating ecological niche suitability of cultivated land based on ecological niche suitability theory, quantitatively evaluating ecological niche suitability of cultivated land and grading in the study area; (2) using the path analysis method to obtain the contribution rate of various natural elements to the cultivated land from 2000 to 2020 based on the proposed method; and (3) using the GeoSOS-FLUS model to develop land-conversion rules under the ecological optimization scenario based on path analysis results, simulating land use in 2040 under the natural scenario and ecological optimization scenario, and conducting a comprehensive analysis the proportion of different suitability grades of the study area’s cultivated land in 2000, 2020, and 2040.
3.1. Evaluating Ecological Niche Suitability of Cultivated Land
3.1.1. Ecological Niche Theory
The ecological niche is a total collection of living conditions of a biological unit (individual, population, or species). If each measurable living condition is given as a coordinate in an
N-dimensional space, then the ecological niche of a biological unit can be defined as an area in the
N-dimensional space [
23,
24]. The matching and compatibility of resources requirements and conditions are emphasized in the ecological niche theory [
25]. The term ecological niche suitability is used to describe the degree of matching between the region’s multi-dimensional spatial resource conditions and the resource demand requirements of each land-use type. Areas with high ecological niche suitability should be protected, while areas with low ecological niche suitability should have other land-use types introduced to strengthen or enrich the idle ecological niche, improve resource utilization, and improve the ecosystem’s function and structure. This study used this theory to analyze the degree of matching between the multi-dimensional spatial resource conditions provided by the region and the resource demand conditions of the cultivated land and reveal the suitability of the regional conditions to the cultivated land.
3.1.2. Construction of Index System for Evaluating Ecological Niche Suitability of Cultivated Land
An index system for evaluating the ecological niche suitability of cultivated land was established based on the three dimensions of soil-quality conditions, ecological conditions, and environmental conditions. According to the actual situation of the study area, referring to the existing cultivated land-quality evaluation research [
26], we selected nine relevant evaluation indicators, i.e., soil thickness; soil texture; soil erodibility; soil organic matter; topographic index; irrigation conditions; the influence of farmers’ center; road accessibility; and tillage radius (
Table 1).
Soil Erodibility
In this study, the estimation of soil erodibility factor
K values developed by Williams in the EPIC (Erosion-Productivity Impact Calculation) model was used [
27]. The specific calculation formula is as follows:
where
K is the soil erodibility factor, which represents the amount of soil loss per unit area formed by the erosivity of rainfall per unit;
mc,
msilt,
ms, and
orgC are clay particles (<0.002 mm) and powder particles (0.002–0.05 mm), sand (0.05–2 mm), and the percentage of organic carbon (%), respectively. Soil texture data, the spatial distribution map of soil type data, and the GIS spatial analysis method were used to obtain the spatial distribution of
K value with soil genus as the basic unit.
Topographic Index
The topographic index model (Formula (2)) synthesizes the elevation and slope, which can comprehensively reflect the terrain conditions.
where
T is the topographic index;
E and
represent the elevation value of the spatial grid and the average elevation value of the study area;
S and
represent the slope value of the spatial grid and the average slope value of the study area. The topographic index model is used to express the vertical characteristics and influence of the regional land-use pattern [
28]. The larger the topographic index, the greater the elevation and slope, and the less suitable for farming.
Humidity Index
The humidity index [
29] and the river distribution are superimposed and analyzed to express irrigation water conditions. The basic index for evaluating extreme dry and humid climatic conditions is the humidity index, and the calculation method is the ratio of precipitation to potential evapotranspiration:
where
H is the annual humidity index;
P is the annual precipitation;
ET0 is the annual potential evapotranspiration. In this study, the modified Hargreaves method was used to estimate the potential evapotranspiration, which is calculated as follows.
where
ET0 is the potential evapotranspiration;
Taverage is the average temperature;
TD is the difference between the maximum and minimum temperatures;
RA is the astronomical radiation;
P is the precipitation.
In this study, the weights of the participating indicators were determined by the entropy value method [
30], and the ecological niche suitability values of each indicator were quantitatively determined by assigning values (
Table 1), thus realizing the construction evaluation index system for the ecological niche suitability of cultivated land. The quantitative analysis of each evaluated indicator and the spatial distribution map of ecological niche suitability were completed on this basis.
3.1.3. Comprehensive Evaluation of Ecological Niches Suitability of Cultivated Land
The comprehensive ecological niche suitability evaluation model (Formula (5)) was used to obtain the Comprehensive Ecological Niche Suitability of Cultivated Land (CENSCL).
where
Xj is the CENSCL of grid
j;
Xij is ecological niche suitability of the
ith evaluated indicator of grid
j;
Wi is the weight of the
ith evaluated indicator;
n is the number of evaluated indicators.
CENSCL was statistically analyzed by frequency histogram, and the frequency mutation points were used as the main basis for the rank classification (
Table 2).
3.2. Path Analysis
Path analysis is a multivariate statistical method that can express the correlation coefficient between the variable and the dependent variable as the direct and indirect effects between the variables [
31,
32].
where
represents the determination coefficient of the independent variable
X on the dependent variable
Y. When
> 0, it represents that the independent variable has a positive effect on the dependent variable, and the effect is synergy. The independent variable, on the other hand, has a negative effect on the dependent variable, and the effect is restricted.
is the direct path coefficient of the independent variable
X on the dependent variable
Y;
is the correlation coefficient between independent variable
X and dependent variable
Y. Using the method of path analysis, we analyzed the contribution rate of various elements to the change of cultivated land quality and discussed the relationship between the change in cultivated land quality and changes in other natural elements. The contribution rate results are used as one of the foundations for setting the conversion rules of natural elements in the layout-optimization model.
3.3. GeoSOS-FLUS Model
The GeoSOS-FLUS model is an effective tool based on the principles of the FLUS model for geospatial simulation, participation in spatial optimization, and decision-making assistance [
33,
34]. The model first trains and estimates the likelihood of various forms of land use using an artificial neural network algorithm (ANN), then couples top-down system dynamics (SD) model with a bottom-up cellular automatons (CA) model to simulate land-use change. On a national/regional scale, the SD model is used to anticipate demand for land-use scenarios under diverse socio-economic and natural environmental variables. When several land-use types undergo mutual modification under the combined effect of natural and human activities, the CA model introduces an inertial adaptive competition mechanism to deal with the complexity and unpredictability. The close coupling of the SD and CA models can improve the model’s applicability and make it more dependable when simulating long-term land-use change.
Land use in 2000 was used to calculate the chance of each land-use type occurring in the study area, using diverse driving factors, such as human activity and natural influences. The base map for simulation was the land-use spatial distribution in 2000. Probability of occurrence, simulation parameters, conversion procedures, and driving data were among the other inputs. After running the GeoSOS-FLUS model, a simulated land-use map for 2020 was created, which was then verified by comparing it to the expert-classified land-use map for 2020. The simulation’s accuracy was measured using the kappa and FOM coefficients. When the kappa value is larger than 0.7, the simulation result is credible.
Based on the land-use situation in 2020, the GeoSOS-FLUS model was used to simulate the spatial layout of the study area’s cultivated land in 2040 by setting two models: a natural scenario and an ecological optimization scenario.
4. Results
4.1. Ecological Niche Suitability of Cultivated Land
A grid of 30 m × 30 m was utilized as the assessment unit to quantify the ecological niche suitability of the cultivated land in the study area.
Figure 3 depicts each evaluated indicator’s ecological niche suitability spatial distribution map. Except for a few isolated spots in the western portion of the study area, the soil layer thickness is not adequate for cultivation, and in other parts, the soil layer thickness is greater than 40 cm, allowing for the use of cultivated land (
Figure 3a). The ecological niche appropriateness of soil texture (
Figure 3b) and soil erodibility (
Figure 3c) are very comparable, with higher regions in the western, southern, and northern sections of the research area and lower areas in the middle and eastern parts. Most of the city’s soil organic matter content is medium, with only the southern section and scattered parts having low levels (
Figure 3d). The topographic index (
Figure 3e) reflects the mountain element in the life community. In the southern and northern parts of the study area, the topography is generally moderate; however, in the center and eastern parts of the study area, the topography is steeper.
Figure 3e shows that the northern and southwestern areas of the study area are better for farming (similar to soil erodibility and texture (
Figure 3b,c)). The irrigation conditions indicator’s ecological niche suitability is higher in the southeastern part of the study area and lower in the northwestern section (
Figure 3f). The ecological niche suitability of the farmers’ center and or tillage radius is higher the closer they are to the center of major towns or rural residential areas (
Figure 3g,i). Only the higher altitude locations in the east have poor road accessibility (
Figure 3h), indicating that the study area has improved overall traffic conditions.
Figure 4 depicts the grade geographical distribution map based on CENSCL. Unsuitable grades are mostly found at high altitudes in the northwest and east of the study area; low-suitability grades are mostly found in the middle and upper part of the mountains in the east and northwest; moderate-suitability grades are mostly found in the middle and lower part of the low hills and the outer edge of the river floodplains; and High-suitability grades are mainly in the northeast, southwest, and other areas with a gentle topography; extreme-suitability grades are distributed in the pre-hill plains and inter-river depressions of the northeast, southwest, and southeast, where the topography is mild, the soil layer is deep, and the organic matter content is high.
4.2. Comprehensive Analysis of the Different Suitability Grades of Cultivated Land in 2000 and 2020
The grade spatial distribution map based on CENSCL in the study area was spatially overlaid with the 2000 cultivated land map and the 2020 cultivated land map, respectively, using the spatial analysis function. Reduction in cultivated land area in the extreme-suitability and high-suitability zone occurred by about 3883.26 hm
2 and 4066.86 hm
2, respectively, over the past 20 years, owing primarily to the increase of orchard; and the area of cultivated land in the moderate-suitability zone decreased by about 4213.04 hm
2, with most of the reduced cultivated land being converted into orchard land and construction land; the area of cultivated land in the low-suitability zone decreased by about 3902.51 hm
2; and the area of cultivated land in the unsuitability zone decreased by about 1487.31 hm
2, mainly due to the return of cultivated land to forestland (
Table 3).
4.3. Spatial Distribution Evolution
Using ArcGIS hydrological analysis capabilities, the study area was separated into sub-basins as study units based on DEM data. The sub-basin scale has a gradient for mountain, water, forestland, cultivated land, construction land, and grassland, and each sub-basin covers 2–4 grades based on CENSCL. The change in the sum of CENSCL of each sub-basin’s cultivated land and the change in each element of the life community of each sub-basin were statistically analyzed between 2000 and 2020, and then, the contribution of each land-use change to the quality of cultivated land was explored using path analysis.
The results of the path analysis (
Table 4) demonstrated that the cultivated land had the highest direct path coefficients and the greatest correlation. Following the direct path coefficient of forest land of 0.0266, which ranks second and has a positive direct effect on the quality of cultivated land, a negative indirect effect through construction land, and a positive indirect effect through other natural elements; combined with the spatial analysis of ecological niche suitability areas, cultivated land in unsuitable areas was converted to forest land based on returning cultivated land to forest, resulting in the reduction of cultivated land to forest land. With a direct path coefficient of −0.0088, the water creates a direct negative influence, a negative indirect effect through cultivated land, and a positive indirect effect through other natural elements. Construction land has an indirect negative influence through forest land, with a direct path coefficient of −0.0579, and the association between construction land and cultivated land quality is relatively large. Grassland has a −0.0610 direct path coefficient, which has a positive indirect effect on other natural elements. Orchard land has the least direct path coefficient, −0.0623, and the highest negative direct effect, which is in line with the actual growth of the local orchard planting industry and generates positive indirect effects through other natural elements.
The decision coefficient is the most important metric in path analysis since it ranks the combined effect of independent variables on dependent variables. Cultivated land, orchard land, forestland, construction land, grassland, and water is the integrated ranking of the influence of changes in each natural element on the area and quality of cultivated land. When the decision coefficients were combined with the spatial pattern analysis, it can be found that orchard land in the extreme- and high-suitability zones as well as forest land in the unsuitable zone contributed the most to the change in cultivated land area and quality, followed by orchard land and construction land in the moderate-suitability zones, while grassland and water contributed the least. The contribution rate results are used as one of the foundations for setting the conversion rules of natural elements in the layout-optimization model. (See
Table 4).
4.4. Optimization Results of Cultivated Land Layout
The nature scenario follows the inertial evolution of land-use structure from 2000 to 2020. The conversion rules of the ecological optimization scenario were set based on the concept of life community and the principle of ecological niches. The conversion rules are:
- (1)
Restrict the conversion of cultivated land in extreme-suitability areas, and convert orchard land in extreme-suitability areas to cultivated land.
- (2)
To resolve the contradiction between agricultural and ecological space, all cultivated land in unsuitable zones and ecological red-line protection areas should be converted to forest land.
- (3)
Part of the cultivated land in low- and moderate-suitability areas is allowed to be transferred to construction land to reserve space for urban development.
- (4)
Within the 50 m buffer zone of the basin, grassland and forest land are maintained as they are, and their transfer is restricted to fulfill their ecological function of purifying and protecting the water element.
- (5)
Land other than construction land should be converted to grassland at crucial sites, such as the outlet of a small basin, to minimize the spread of surface source pollution from agricultural land.
- (6)
The simulation rules for the rest of the space follow the inertia pattern of the previous 20 years.
The natural scenario simulation shows that construction land and orchard land continue to expand, with an increase of 2372.26 hm
2 and 1456.30 hm
2, respectively, and the water area increases by 352.76 hm
2; the scale of forest land and grassland decreases, and the cultivated land area decreases by 2895.13 hm
2 (
Table 5).
The ecological optimization scenario’s simulation showed that cultivated land area increased by 3790.42 hm
2; construction and forest land increased by about 2114.97 hm
2 and 9440.28 hm
2, respectively; the water area increased by about 400.19 hm
2; and orchard land declined by 159,00.84 hm
2 (
Table 5).
The simulation of ecological optimization scenario was compared with that of the natural scenario, and the changes of cultivated land area in each suitability zone were as follows (
Table 6): the proportion of cultivated land in the extreme-suitability zone increased from 14.59% to 19.43%, the proportion of cultivated land in the high-suitability zone increased from 27.62% to 30.64%, the proportion of cultivated land in the moderate-suitability zone increased from 31.64% to 33.63%, and the cultivated land area in all above three zones increased compared with 2020. The proportion of cultivated land area in the low-suitability zone decreased from 21.36% to 16.30%, and the proportion of cultivated land in the unsuitable zone was 0. In the study area, the overall ecological niche suitability of cultivated land improved. Cultivated land distributed in unsuitable areas will be converted to forest land to accomplish its ecological function of soil and water conservation; some orchard land in extreme-suitability areas will be converted to cultivated land, increasing the concentration of flat cultivated land; the expansion of construction land will primarily occur in moderate- and low-suitability areas, protecting high-quality cultivated land. The ecological niche suitability tends to be optimized when the coordination between cultivated land and all other elements of the biological community improves.
5. Discussions
This study examined spatial layout-optimization methods for cultivated land protection based on the life community theory. The comprehensive ecological niche suitability evaluation model, path analysis method, GeoSOS-FLUS model, and GIS analytic methodologies were used to quantitatively analyze the Comprehensive Ecological Niche Suitability of Cultivated Land (CENSCL), clarify the relationship between cultivated land quality and other elements of the life community, and simulate land use in 2040 under natural and ecological optimization scenarios. The results found that the study area demonstrated varied patterns and can be classified into five grades based on the CENSCL. The evolution of orchard land in the extreme- and high-suitability zones and forestland in the unsuitability zone contributed the most to the change of cultivated land from 2000 to 2020. The simulation results of the ecological optimization scenario in 2040 increased the area of cultivated land and improved the ecological niche suitability and the coordination between cultivated land and other natural elements compared with the results of the natural scenario.
Compared to existing cultivated land-protection studies, this study employed the life community and ecological niche theory and constructed a new index system to evaluate the ecological niche suitability of cultivated land. Based on the current actuality, two scenarios were used to find the optimization ways of cultivated land layout. To resolve the contradiction between agricultural and ecological space, the following management measures are recommended: restrict the conversion of cultivated land in extreme-suitability areas; orchard land in extreme-suitability areas should be converted to cultivated land; all cultivated land in unsuitability zones and ecological red-line protection areas should be converted to forestland; part of the cultivated land in low- and moderate-suitability areas are allowed to be transferred to construction land to reserve space for urban development. The results found that the simulated and optimized layout meets local demand for cultivated land; helps to improve the coupling of land system elements; deepens the exploration and research on the elements, structure, function, and pattern of life community; and strengthens the overall ecological function. This methodology can reflect the planning concept in the spatial layout of simulation prediction, examine the planning concept’s viability, and enrich the application of system theory and ecological niche principle in various fields. Ecological optimization scenario can help to construct ecological security patterns and reduce ecological risk in key areas of each basin.
This study selected a typical mountainous and hilly area in China to conduct the experiment. Mountainous and hilly areas are complex ecological systems dominated by topography and landforms with concentrated environmental gradients and high heterogeneity [
35]. The spatial contradictions of cultivated land and other natural elements in the mountainous and hilly areas of China are tense, and the conflict between cultivated land and other natural elements is more manifested in mountainous and hilly areas [
36,
37]. The method used in this study sought a balance between ecology and interests to maximize the total value of cultivated land layout, which is beneficial to strengthen the synergy between cultivated land and other natural elements. The findings of the study have both theoretical and practical implications. As more than two-thirds of the areas in China are mountainous and hilly regions, the findings in this study are representative and can be used as a reference for further studies.
Though the living community theory and multi-models were applicable in the exploration of cultivated land optimization, this study has limitations. Ecosystem services, such as soil conservation and water conservation, were not taken into account in the indicators system for the evolution of the ecological niche suitability of cultivated land. More reliable data are expected to be obtained to further monitor the ecological niche suitability of cultivated land. In addition, the GeoSOS-FLUS model’s layout conversion rules did not consider the change of policy and planning. How to better realize the optimization of the spatial layout of natural elements, including cultivated land from the systematic view of the community of life, is the direction of future research.
6. Conclusions
Based on the concept of life community and the principle of ecological niche, this study quantitatively explored the relationship between the spatial evolution of cultivated land and other natural elements based on the accurate evaluation of the niche suitability of cultivated land in a mountainous and hilly area. The results found that the study area demonstrated varied patterns and can be classified into five grades based on the computation results of ecological niche suitability. The evolution of orchard land in the extreme- and high-suitability zone and forestland in the unsuitability zone contributed the most to the change of cultivated land from 2000 to 2020. The ecological optimization scenario in 2040 can increase the area of cultivated land and improve the ecological niche suitability and the coordination between cultivated land and other natural elements, which is applicable in the study area.
Author Contributions
Conceptualization, W.Q. and X.Y.; methodology, M.W.; software, Q.S.; validation, P.D.; investigation, Q.S.; writing—original draft, Q.S. and X.Y.; writing—review and editing, X.Y. and W.Q. All authors have read and agreed to the published version of the manuscript.
Funding
This research was funded by the National space optimization model establishment, grant number 381181/140; and the Remote sensing monitoring of cultivated land and establishment of its benchmark land prices, grant number 381180/010. The funders have no role in study design, data collection, and analysis, decision to publish, or preparation of the manuscript.
Institutional Review Board Statement
Not applicable.
Informed Consent Statement
Not applicable.
Data Availability Statement
The data used to support the findings of this study are available from the corresponding author upon request.
Acknowledgments
The authors would like to thank the editors and reviewers for their helpful comments.
Conflicts of Interest
The authors declare no conflict of interest.
References
- Foley, J.A.; Ramankutty, N.; Brauman, K.A.; Cassidy, E.S.; Gerber, J.S.; Johnston, M.; Mueller, N.D.; O’Connell, C.; Ray, D.K.; West, P.C. Solutions for a cultivated planet. Nature 2011, 478, 337–342. [Google Scholar] [CrossRef] [Green Version]
- Francis, C.A.; Hansen, T.E.; Fox, A.A.; Hesje, P.J.; Nelson, H.E.; Lawseth, A.E.; English, A. Farmland conversion to non-agricultural uses in the US and Canada: Current impacts and concerns for the future. Int. J. Agric. Sustain. 2012, 10, 8–24. [Google Scholar] [CrossRef]
- Chai, J.; Wang, Z.; Yang, J.; Zhang, L. Analysis for spatial-temporal changes of grain production and farmland resource: Evidence from Hubei Province, central China. J. Clean. Prod. 2019, 207, 474–482. [Google Scholar] [CrossRef]
- Zu Jian, H.J.; Li, C. Analysis on trinity connotation and approach to protect quantity, quality and ecology of cultivated land. J. China Agric. Univ. 2018, 23, 84–95. [Google Scholar]
- Hong-bin, L.I.U.; Shun-ting, L.I.; Meng-Yao, W.U.; Fu-jun, S.U.N.; Qiu-bing, W.A.N.G.; Xiu-ru, D.O.N.G. Current Situation and Perspectives of Black Soil Protection from the Integrated Angle of Quantity, Quality, and Ecology in Northeast China. Chin. J. Soil Sci. 2021, 52, 544–552. [Google Scholar]
- Wen, L.Y.; Kong, X.B.; Zhang, B.B.; Sun, X.B.; Xin, Y.N.; Zhang, Q.P. Construction and application of arable land quality evaluation system based on sustainable development demand. Trans. Chin. Soc. Agric. Eng. 2019, 35, 234–242. [Google Scholar]
- Kuang, L.H.; Ye, Y.C.; Zhao, X.M.; Guo, X. Evaluation and obstacle factor diagnosis of cultivated land system security in Yingtan City based on the improved TOPSIS method. J. Nat. Resour. 2018, 33, 1627–1641. [Google Scholar]
- Kong, X.; Zhang, B.; Wen, L.; Hu, Y.; Lei, M.; Yao, J.; Xin, Y. Theoretical framework and research trends of cultivated land quality based on elements-process-function. China Land Sci. 2018, 32, 14–20. [Google Scholar]
- Li, X.L.; Wu, K.N.; Chu, X.X.; Yang, Q.J.; Zhang, X.D.; Hao, S.H. Research progress and prospects for cultivated land productivity evalutaion. China Land Sci. 2019, 33, 91–100. [Google Scholar]
- Song, G.; Yang, X.X.; Gao, J.; University, N. Study on the distribution patterns and characteristics of paddy cropland in the typical area of sanjiang plain. China Land Sci. 2017, 31, 61–68. [Google Scholar]
- Liu, J.; Jin, X.; Xu, W.; Sun, R.; Han, B.; Yang, X.; Gu, Z.; Xu, C.; Sui, X.; Zhou, Y. Influential factors and classification of cultivated land fragmentation, and implications for future land consolidation: A case study of Jiangsu Province in eastern China. Land Use Policy 2019, 88, 104185. [Google Scholar] [CrossRef]
- Huang, L.; Feng, Y.; Zhang, B.; Hu, W. Spatio-Temporal Characteristics and Obstacle Factors of Cultivated Land Resources Security. Sustainability 2021, 13, 8498. [Google Scholar] [CrossRef]
- Wang, N.; Zu, J.; Li, M.; Zhang, J.; Hao, J. Spatial Zoning of Cultivated Land in Shandong Province Based on the Trinity of Quantity, Quality and Ecology. Sustainability 2020, 12, 1849. [Google Scholar] [CrossRef] [Green Version]
- Wang, Y.J.; Liu, Q.; Ou, M.H. Optimization of prime farmland layout on basis of geological environment suitability. Trans. Chin. Soc. Agric. Eng. 2019, 35, 252–260. [Google Scholar]
- Peijia, L.; Kening, W.; Huafu, Z. Spatial allocation optimization of prime farmland based on cultivated land comprehensive quality: A case study of Wen County, Hennan Province. China Land Sci. 2015, 29, 54–59. [Google Scholar]
- Feng, T.; Zhang, F.; Li, C.; Qu, Y.; Zhu, F. Spatial distribution of prime farmland based on cultivated land quality comprehensive evaluation at county scale. Trans. Chin. Soc. Agric. Eng. 2014, 30, 200–210. [Google Scholar]
- Tan, Y.; Chen, H.; Lian, K.; Yu, Z. Comprehensive evaluation of cultivated land quality at county scale: A case study of Shengzhou, Zhejiang Province, China. Int. J. Environ. Res. Public Health 2020, 17, 1169. [Google Scholar] [CrossRef] [Green Version]
- Zhao, C.; Zhou, Y.; Li, X.; Xiao, P.; Jiang, J. Assessment of cultivated land productivity and its spatial differentiation in dongting lake region: A case study of yuanjiang city, hunan province. Sustainability 2018, 10, 3616. [Google Scholar] [CrossRef] [Green Version]
- Huang, X.J.; Yang, D.Y. Orderly ecological system for mountains, rivers, forest, farmland and lakes, and innovation path of purpose regulation of natural resources. Shanghai Land Resour. 2016, 37, 1–4. [Google Scholar]
- Xi, J.P. Winning the great victory of building a moderately prosperous society in all respects and winning the great victory of socialism with Chinese characteristics for a new era-report to the 19th national congress of the communist party of China. J. New Long March. 2017, 11, 4–25. [Google Scholar]
- Li, D.J.; Zhang, S.H.; Liu, B.; Zhang, H.; Wang, H.; Yan, F. The connotation, problems and innovation of life community of mountains, rivers, forests, farmlands, lakes, grasslands and human. Chin. J. Agric. Resour. Reg. Plan. 2018, 39, 1–5. [Google Scholar]
- Wang, B.; Wang, X.; Zhang, X. Connotations, Characteristics and Practice Paths About the Idea of Taking our Mountains, Rivers, Forests, Farmlands, Lakes, and Grasslands as a Life Community Based on Chengde city in Hebei Province. Environ. Prot. 2018, 46, 60–63. [Google Scholar]
- Zizhen, L.; Hong, L. The niche-fitness model of crop population and its application. Ecol. Model. 1997, 104, 199–203. [Google Scholar] [CrossRef]
- Hutchinson, G.E.; Hutchinson, G.; Hutchinson, G.; Hutchinson, G. Concluding remarks, coldspring harbor symposium. Quant. Biol. 1957, 22, 239. [Google Scholar] [CrossRef]
- Qu, Y.; Zhang, F.; Jiang, G.; Guan, X.; Guo, L. Suitability evaluation and subarea control and regulation of rural residential land based on niche. Trans. Chin. Soc. Agric. Eng. 2010, 26, 290–296. [Google Scholar]
- Xin, Y.N.; Fan, S.Y.; Kong, X.B.; Zhang, B.; Wen, L.; Zhang, Q. Evaluation of cultivated land quality based on four quality dimensions. Resour. Sci. 2018, 40, 737–747. [Google Scholar]
- Williams, J.R. Epic-erosion/productivity impact calculator: 1. model documentation. Tech. Bull. United States Dep. Agric. 1990, 4, 206–207. [Google Scholar] [CrossRef]
- Si, J.; Qi, W.; Qu, Y.; Li, L. Distribution characteristics of land use pattern on terrain gradient in Jiaodong mountainous areas at county level. Chin. J. Appl. Ecol. 2009, 20, 679–685. [Google Scholar]
- Jia, Y.; Zhang, B. Spatio-temporal changes of the extreme drought and wet events in Northern China from 1960 to 2016. J. Nat. Resour. 2019, 34, 1543–1554. [Google Scholar]
- Yongdong, W.; Xuefei, W.; Fengmao, M. The intensive utilization evaluation of arable land in Yanchi County, Ningxia based on entropy value method. Chin. Agric. Sci. Bull. 2011, 27, 216–220. [Google Scholar]
- Du, J.; Li, M.; Yuan, Z.; Guo, M.; Song, J.; Xie, X.; Chen, Y. A decision analysis model for KEGG pathway analysis. BMC Bioinform. 2016, 17, 1–12. [Google Scholar] [CrossRef] [PubMed] [Green Version]
- Lian, J.; Zhao, X.Y.; Li, X.; Zhang, T.H.; Wang, S.K.; Luo, Y.Q.; Zhu, Y.C.; Feng, J. Detecting sustainability of desertification reversion: Vegetation trend analysis in part of the Agro-Pastoral Transitional Zone in Inner Mongolia, China. Sustainability 2017, 9, 211. [Google Scholar] [CrossRef] [Green Version]
- Liang, X.; Liu, X.; Li, X.; Chen, Y.; Tian, H.; Yao, Y. Delineating multi-scenario urban growth boundaries with a CA-based FLUS model and morphological method. Landsc. Urban Plan. 2018, 177, 47–63. [Google Scholar] [CrossRef]
- Liu, X.; Liang, X.; Li, X.; Xu, X.; Ou, J.; Chen, Y.; Li, S.; Wang, S.; Pei, F. A future land use simulation model (FLUS) for simulating multiple land use scenarios by coupling human and natural effects. Landsc. Urban Plan. 2017, 168, 94–116. [Google Scholar] [CrossRef]
- Guo, C.; Xu, Q.; Dong, X.; Li, W.; Ju, Y. Geohazard recognition and inventory mapping using airborne lidar data in complex mountainous areas. J. Earth Sci. 2021, 32, 1079–1091. [Google Scholar] [CrossRef]
- Han, J.; Dong, Y.; Zhang, M. Chemical fertilizer reduction with organic fertilizer effectively improve soil fertility and microbial community from newly cultivated land in the loess plateau of china. Appl. Soil Ecol. 2021, 165, 103966. [Google Scholar] [CrossRef]
- Yang, R.; Liu, F.; Yang, Z. Prediction and protection of cultivated land in china. Asian Agric. Res. 2021, 13, 5. [Google Scholar]
| Publisher’s Note: MDPI stays neutral with regard to jurisdictional claims in published maps and institutional affiliations. |
© 2022 by the authors. Licensee MDPI, Basel, Switzerland. This article is an open access article distributed under the terms and conditions of the Creative Commons Attribution (CC BY) license (https://creativecommons.org/licenses/by/4.0/).


