
Influence of Currents on the Breaking Wave Forces Acting on Monopiles over an Impermeable Slope

1
College of Civil Engineering and Architecture, Zhejiang Tongji Vocational College of Science and Technology, Hangzhou 311231, China
2
College of Civil Engineering and Architecture, Zhejiang University, Hangzhou 310058, China
*
Author to whom correspondence should be addressed.
Sustainability 2023, 15(1), 129; https://doi.org/10.3390/su15010129
Submission received: 4 October 2022
/
Revised: 16 December 2022
/
Accepted: 17 December 2022
/
Published: 22 December 2022
(This article belongs to the Special Issue Promoting Sustainable Marine Development: Geotechnical Engineering Problems and Environmental Guarantee Technology in Marine Space, Energy and Resource Development)
Abstract
:It is known that the wave breaking process is significantly affected by a current, but little attention has been paid to the effect of wave–current interaction on the breaking wave forces acting on a monopile. This study presented a total of 88 flume tests, among which solitary and regular breaking waves were generated with a following current. The waves propagated over an impermeable slope and induced impulsive loads on a vertical monopile. The moments on the monopile were measured utilizing a high-precision load cell, and the effect of current velocities on the peak moment was analyzed. Test results indicate that there was an obvious nonlinear effect between breaking waves and a following current. For solitary waves, a following current accelerated the breaking process, leading to an increase by 274.21% at maximum in breaking wave forces. However, for regular waves, both the wave heights and the reversing flow were restricted with the increasing velocity of a following current, delaying the wave breaking process; under the regular test conditions, the moment on the pile decreased by 65.25% at maximum.
1. Introduction
To date, the monopile is the most popular choice for the foundations of offshore wind turbines (OWTs). More than 80% of OWTs in Europe have adopted monopile foundations, especially in shallow water zones [1]. While a wave is propagating shoreward, its wave height increases and wavelength decreases, ultimately leading to wave breaking. Compared with non-breaking waves, breaking waves can impose extra slamming forces on monopiles [2]. This leads to a design challenge, since the wave load is the major component of overall loads acting on OWTs.
There have been considerable studies related to breaking wave forces over the past decades. Wienke et al. [2] conducted large scale experiments and found that the pile-up effect must be considered for the calculation of breaking wave impact. Then, the effect of cylinder inclination was examined by Wienke and Oumeraci [3] experimentally. Mo et al. [4] developed a LES model and illustrated the runup of plunging solitary waves on a vertical cylinder. Xiao and Huang [5] discussed the variations in breaking wave forces with the elevation of a pile, based on a RANS numerical wave model. Alagan Chella et al. [6] utilized CFD model REEF3D to investigate the significance of the relative distance between breaking points and a cylinder on the breaking solitary wave forces. Vested et al. [7] presented the experimental measurements of the force distribution on a vertical cylinder exposed to shoaling regular waves. However, in these studies, waves were always generated under still-water conditions, which means the effect of currents on breaking wave forces is inherently ignored.
In fact, waves coexist with currents in natural ocean environments. For instance, the extreme wave loads caused by a storm surge can seriously threaten the structural safety of OWT foundations in the typhoon season, while currents simultaneously reach their maximum velocities. It is known that the energy transfer and breaking of waves can be significantly affected by currents [8], and some studies related to the effect of currents on wave–monopile interaction have been conducted [9,10,11,12,13,14,15,16,17]. Miles et al. [10] undertook laboratory measurements to study the wave and current velocities in the vicinity of a monopile foundation. Chen et al. [11] investigated the complex interactions between a combined wave–current flow and a vertical surface, and the characteristics of harmonic forces under various wave–current conditions were analyzed numerically. Chen et al. [12] investigated the pore-water pressures around a partially embedded monopile under the combined action of regular waves and a following current. Furthermore, studies also revealed that the combined waves and currents can significantly affect the local scour around a monopile [18,19,20,21,22,23,24,25]. However, extreme cases where waves can break have not been considered in these studies, and the breaking wave forces acting on a monopile have not been experimentally obtained when wave–current interaction occurs. This gap of knowledge could cause the overestimation of monopile capacity under severe weather conditions, resulting in potential economic losses. As a result, the effect of currents on wave breaking needs to be thoroughly studied.
In this paper, a total of 88 flume experiments were conducted to investigate the breaking wave loads on a vertical cylinder over an impermeable slope with and without a following current. The impermeable slope was introduced to model common submarine topography and induce waves breaking. Following currents with various velocities were superimposed on the solitary and regular waves. Then, moments on the cylinder contributed by the waves under the combined wave–current conditions were experimentally measured. The effects of the following currents on wave loads have been discussed.
2. Laboratory Experiments
2.1. Experimental Setup
As shown in Figure 1, the flume was 75 m long, 1.8 m wide, and 2.0 m deep, and could generate bidirectional currents and unidirectional waves. An impermeable slope (7.31 m in length, 1.2 m in width, and the slope angle of 5.1°) was constructed in the middle of the flume. The model pile had a diameter of 0.10 m or 0.20 m and a length of 1.80 m. It was installed vertically at the top of the slope, with a 2.4 m long horizontal plank around it. The slope and the pedestal of the pile were mounted on the flume bottom. A load cell KISTLER 9317C and a stainless spindle were installed on the top and bottom of the pile, respectively, as detailed in Figure 2. In this way, the model pile was allowed to produce a relative rotation tendency around the spindle. Based on the moment equilibrium equation about the axis of the spindle, the moment M acting on the pile about the spindle, which is caused by wave loads, can be calculated by
where Fw is the wave force; Lw is the acting height of the wave force; Fm is the force measured by the load cell; Lm is the vertical distance between the centers of the load cell and the spindle (1800 mm in this study), as shown in Figure 2. Because the height of the spindle is negligible, the calculated moment could also be regarded as the pile moment acting at the level of the flat seabed. The sampling frequency of the load cell was set to 2000 Hz to capture the high-frequency components of breaking wave loads. The high sampling frequency also introduces significant digital noise, so an extra data smoothing process is required when interpreting the measured data.
Both solitary and regular waves were generated by a piston-type wave maker, which supports active-wave absorption. A sponge-type wave absorber was used to absorb the wave reflections at the downstream end. A circulating current generation system that was independent of the wave maker could produce a steady current with a flow rate of up to 0.8 m3/s, and the current velocity precision was less than 0.03 m/s. In every test, a following current was generated first, whose direction was same as the wave propagation direction. After stabilization of the current, the wave maker was started. Due to an intrinsic feature of the load cell, only dynamic responses can be sampled, which means the recorded Fm reflects pure wave loads whether with or without the following current (i.e., subtracting a constant current load from the combined wave–current load). Furthermore, two wave gauges (WG, model number: YWH200-D) were used to measure the wave heights with a sampling frequency of 100 Hz, while the surface velocities were measured by acoustic Doppler velocimetry (ADV, model number: Vectrino Plus) with the same frequency.
The conventional experimental setup related to breaking waves suggests using a slope whose width is same as that of the flume [26,27,28,29,30,31,32,33,34,35,36,37,38], which is unachievable when the currents are introduced. The width of the slope has to be smaller than that of the flume in this study, in order to not only allow the current to pass by easily, but also generate the breaking waves. To validate the range of the unintentional 3D effect caused by the gaps between the slope and flume boundaries, a preliminary numerical simulation was performed using computational fluid dynamics software OpenFOAM (version 4.1). The olaFlow solver was adopted to solve the Reynolds-averaged Navier–Stokes (RANS) equations. The turbulence was modeled by the k-ω SST model. All boundary conditions and initial conditions were the same as those in the experimental flume tests. The origin O of the numerical Cartesian coordinates is illustrated in Figure 1. Note that only the slope was simulated for simplicity, as shown in Figure 3a. Typical simulated results are illustrated in Figure 3b, where the variations of free surface elevations on three cross sections of the slope (i.e., x = 3.5 m, 5.5 m, 7.0 m) were measured at different distances from the slope edges (i.e., y = 0.0 m, 0.5 m, 0.6 m). It was found that the surface elevations at different locations within a width of 1.0 m on the slope were almost identical. The maximum discrepancy between the peak free surface elevations measured in front of the pile (x = 7.0 m, y = 0.0 m) and above the slope edge (x = 7.0 m, y = 0.6 m) was about 16%. In addition, the velocity components Uy (not drawn here for brevity) in all y-directions on the center line of the slope surface were found to be close to zero, implying a simple two-dimensional flow around this region. In summary, the unintentional 3D effect caused by the gaps was negligible in the experimental tests.
2.2. Test Conditions
The tests were performed for varying water depths, current velocities, and wave conditions. The extreme parameters considered in the flume tests were scaled according to the measured hydrological conditions in the Zhoushan Sea Area, Zhejiang Province, China, with the Froude similitude kept between the prototype and model scale, as given in Table 1. The water depths ranged from 65 cm to 80 cm and current velocities from 0 cm/s to 25.8 cm/s. Both solitary waves and regular waves were tested, whose wave heights varied from 5 cm to 15 cm. For regular waves with a height of 10 cm, five wave periods were considered. Detailed conditions are summarized in Table 2. S0 and ξ in Table 2 are dimensionless parameters to predict the breaking types of solitary waves and regular waves, respectively, whose detailed definitions are given in Section 3.
It is worth mentioning that the water depths were measured under still-water conditions. The current velocity measurements were performed 0.05 cm below the free surface before waves were generated. The wave parameters and output power of the wave maker were calibrated under wave-only conditions in preliminary tests, then, these wave-making data were adopted in the formal tests to make sure the wave heights were still equivalent under different current velocities. Figure 4 illustrates the wave height signals measured by WG1 under two typical wave conditions in the formal tests. It is evident that the measured wave heights were in good agreement with the input wave parameters. In addition, it was found that the difference between the wave heights recorded by WG1 and WG2 was negligible, so the data from WG2 are not reported here for brevity.
2.3. Post-Processing
The force measurements were calibrated between every two formal tests using a spring-type dynamometer (model number: NK-100). Linear relationships between the input forces and output forces were obtained, and the coefficient of determination was always more than 0.99. In order to eliminate the effect of natural frequency, a low-pass filter was introduced to filter the data, whose cut-off frequency of 10 Hz was obviously lower than the natural frequency of the measurement system (about 47 Hz). Note that all of the results analyzed in this paper were calibrated and filtered. Furthermore, data from the repeated tests showed that the relative error of the measured peak moments was less than 5%, indicting a good repeatability of the test results.
3. Results and Discussion
3.1. Solitary Waves
Grilli et al. [39] introduced a dimensionless parameter S0 to predict the types of wave breaking as
where s is the slope gradient and H’ = H/h is the relative wave height [40]. Here, the values of S0 for the solitary wave tests with h = 65 cm were 0.283, 0.346, and 0.489, corresponding to the plunging breaker, surging breaker, and non-breaking wave, respectively. However, actual breaking types could be slightly different to the predicted ones due to the influence of the horizontal plank. Experimental observations showed the breaking points of all broken solitary waves were located at the downstream side of the pile.
Figure 5 shows the effect of a following current with various velocities on the normalized peak moment on the pile under different water depths and solitary wave heights. Usually, the term ρgD3 is used for normalized wave forces, so the moment was normalized by ρgD3h in this study to further consider the change in the force-arm length caused by various water depths. It was not surprising to see that the peak moment increased with wave heights, since the impact area was directly proportional to the wave heights. Furthermore, with various water depths, higher following current velocities always led to greater peak moments acting on the pile. As previously described, the force measured by the load cell reflects the pure wave loads. Thus, the increase in the measured loads reflects the nonlinear effects between the solitary waves and the following current since the predefined wave parameters remained the same.
It was also evident that the peak moment with H = 10 cm or 15 cm increased significantly and then remained relatively stable as the current velocities increased in the shallower water (h = 65 cm). A similar tendency was observed when h = 70 cm and H = 15 cm. However, when the wave height was the smallest (H = 5 cm), or the water depth was deeper (h = 75 cm and 80 cm), there was no moment plateau, and the moment continued increasing. Finally, the maximum peak moment appeared at the maximum current velocity of 25.8 cm/s. In other words, the effect of the following current could reach a plateau in shallower water, indicating an upper limit of the breaking wave force that could be mobilized. The reasons for these variation features can be explained from Figure 6.
Figure 6 presents the snapshots of the free surface around the pile when the solitary wave gained the maximum run-up with different following current velocities. Note that the incident wave heights are always 15 cm. Free surfaces around the pile were detected by edge detection algorithms provided by MATLAB (version R2021a). As mentioned before, the waves with h = 65 cm and H = 15 cm can be regarded as plunging breakers according to Equation (2), and their breaking points were downstream from the pile, whereas the waves with h = 80 cm and H = 15 cm should be non-breaking waves in view of the slope angle changing downstream from the pile. Because waves do not entirely break before impacting on the pile, the profiles of free surfaces around the pile mainly reflect the breaking intensity of waves above the impermeable slope. It can be seen that the increase in the current velocity results in two kinds of main changes (i.e., the wave shape steepening for breaking waves in the shallow water (h = 65 cm) shown in Figure 6a–c and the elevation of wave run-up rising for non-breaking waves in the relatively deep water (h = 80 cm) shown in Figure 6d–f). These changes illustrate that the breaking intensity of the solitary waves was enhanced by applying the following current under different water depths. As a result, the breaking points of the solitary waves would shift toward deep-water zones and be closer to the pile. Previous studies have shown that waves that break exactly on the front surface of a pile can produce the maximum breaking wave force [2,6]. This is the reason why the solitary wave loads increased with the increase in current velocities. Meanwhile, it was found that the moment on the pile could be qualitatively indicated by the maximum wave run-up. In shallow water, the wave run-up reached the maximum value when the velocity of the following current was relatively low. Then, the backwater started to collapse with the current velocity increasing consistently, and the wave run-up remained stable, as shown evidently in Figure 6c. However, the wave run-up kept increasing as the current velocity increased from 12.9 cm/s to 25.8 cm/s, when water depth h was 80 cm. This variation feature of the maximum wave run-up is consistent with the changing trend in the peak pile moment, which is shown in Figure 5d. Under the solitary wave test conditions, the peak moment on the pile increased by 274.21% at the maximum because of the following current (h = 70 cm, H = 5 cm, v = 25.8 cm/s).
Furthermore, Figure 5d also presents the normalized peak moment on the pile with a diameter of 20 cm. In terms of the absolute value of the pile moment, the increase in the pile diameter resulted in the increase in the pile moments. However, because the pile diameter plays an important role in moment normalizations, the normalized moments of D = 20 cm pile are significantly smaller than those of the D = 10 cm pile. The growth rate of the pile moment, which is caused by the pile diameter increasing from 10 cm to 20 cm, is given in Figure 7. Its maximum growth rate was 102.9%, very close to the growth rate of the pile diameter. A linear relationship can be used to describe the increase rate of the pile moment when the wave height is relatively small. However, the wave with a height of 15 cm showed a different trend in Figure 7 because it showed the most significant breaking tendency. Therefore, Figure 7 highlights the importance of investigating the effect of the current on breaking wave forces, instead of simply assuming a linear relationship between them.
3.2. Regular Waves
Generally, wave run-up can be characterized by the Iribarren number ξ [41], which can be expressed as:
where H is the incident wave height at the toe of the slope, and L is the deep-water wavelength. Utilizing the Iribarren number and the criteria regarding breaker types presented by Galvin [42], the breaker types of the regular wave cases are shown in Table 2. Although two cases were predicted as the spilling waves, they were observed as plunging waves during the experiments. As for the breaking location, the breaking points of case no. 19 and no. 22 were around the pile. The breaking points of case no. 16, no. 20, and no. 21 were downstream from the pile. Others were upstream from the pile.
Unlike solitary waves, regular waves require extra time to stabilize at the beginning of each test. After the wave shapes became stable, 10 peak forces measured by the load cell were averaged to obtain the representative peak value for analysis in this paper. Although the impact forces can vary between successive periods due to the stochastic nature of breaking waves, their average values are able to reflect the general level of the wave loads accurately. Figure 8 illustrates the relationship between peak moments on the pile and the following current velocities under regular waves with different wave heights and wave periods. Similar to what has been found for solitary waves, there were significant nonlinear effects between the regular waves and following currents. The existence of the following current decreased the pile moments caused by wave loads. When current velocities increased from 0 cm/s to 6.5 cm/s, the pile moments with higher regular wave heights showed greater attenuation, as given in Figure 8a. However, this attenuation tendency became insignificant as the wave periods changed from 1.8 s to the others in Figure 8b. The reason is that the regular wave with H = 10 cm, T = 1.8 s, and v = 0 cm/s broke nearest the pile, providing a larger moment acting on the pile. Because breaking wave forces are sensitive to the change in breaking-point positions, the most significant attenuation can be observed in this case.
Previous theoretical and experimental investigations have proven that the wave height decreases significantly as the velocity of a following current increases [21]. This can be seen from the free surface profiles when regular waves impacted on the pile under specific conditions, as given in Figure 9. Because an impermeable slope was adopted, broken regular waves can produce a strong reversing flow, which would interact with the next wave. When the following current existed, this reversing flow also met the following current before the next wave impacted on the pile. Significant spindrift appeared at the meeting point. Then, the intensity of the reversing flow and the following current reached a dynamic equilibrium around a balance point. Thus, the position of this balance point suggests the extent of the influence of the reversing flow. As the following current velocity increases, the balance point transferred from the frontal side to the lee side of the pile, indicated by the spindrift in Figure 9(d1–d3). Thus, the mechanism of how following currents affect the wave breaking could be explained as follows: on one hand, when following currents exist, the wave height decreases, leading to the decrease in the wave loads. In terms of impermeable slopes, the reversing flow volume is proportional to the corresponding wave height. Hence, this means that the volume of the reversing flow will decrease because of the following currents. This process happens before the waves run-up the slope seabed. On the other hand, the flow intensity of the reversing flow depends on how violently the waves break. It is an inherent attribute of breaking waves. Due to the existence of the following currents, the velocity and the flow distance of the reversing flow are restricted, indicating the waves’ breaking trend weakening during the wave run-up process. Under regular wave test conditions in this study, the peak moment on the pile decreased by 65.25% at maximum due to the influence of the following current (h = 80 cm, H = 10 cm, T = 1.8 s, v = 25.8 cm/s).
4. Conclusions
This study investigated the effect of the following currents on the breaking wave forces acting on a vertical monopile. A total of 88 flume tests were conducted, among which solitary waves and regular waves were generated with or without a following current. The moments on the pile were measured and calculated using a high-precision load cell. Furthermore, the relationship between the peak moments acting on the pile and current velocities was presented and analyzed. It was found that there were obvious nonlinear effects between the waves and following currents. The main conclusions can be drawn as follows:
(1) The breaking intensity of solitary waves under different water depths is enhanced by a following current, leading to steeper wave shapes, higher wave run-up, and the acceleration of breaking processes. The effect of the following current could reach a plateau in shallower water, indicating an upper limit of the breaking wave force that could be mobilized.
(2) The reversing flow generated by broken regular waves over an impermeable slope can be suppressed by a following current (i.e., both the velocity and flow distance of the reversing flow are restricted). This results in the delay of wave breaking processes and the corresponding decrease in wave loads, especially for waves with higher wave heights.
(3) For solitary waves, the enhancement effect of a following current on wave loads can occur more significantly with a low current velocity in shallower water. An increase by 274.21% at maximum in the breaking wave forces on a monopile was observed with the increase in the following current velocities under the test conditions. For practical design, an extra safety factor is required when breaking wave loads and current loads are calculated independently under such situations.
In terms of regular waves, as the following current velocity increases, corresponding breaking wave forces decrease obviously. However, the effect of the following current on waves with varying periods is generally insignificant. The peak moment on the pile decreased by 65.25% at the maximum with the existence of a following current.
The measured nonlinear feature of breaking wave loads under the action of a following current highlights the importance of investigating the combined effect of breaking waves and currents over a realistic permeable seabed in the future. Further studies are also needed to investigate the effect of slope angles and provide more recommendations for design practices.
Author Contributions
Conceptualization, S.L.; Methodology, Z.L.; Software, Z.L.; Validation, S.L.; Formal analysis, S.L.; Investigation, S.L.; Writing—original draft preparation, S.L. and Z.L.; Writing—review and editing, Z.L.; Funding acquisition, S.L. All authors have read and agreed to the published version of the manuscript.
Funding
This research was funded by the Science and Technology Project of Water Resources Department of Zhejiang Province, grant number RC2230.
Institutional Review Board Statement
Not applicable.
Informed Consent Statement
Not applicable.
Data Availability Statement
The data presented in this study are available on request.
Acknowledgments
The authors would like to thank Yilong Li and Xin Hua, who helped conduct a large number of experiments.
Conflicts of Interest
The authors declare no conflict of interest.
References
- Komušanac, I. Wind Energy in Europe in 2018; Wind Europe: Brussels, Belgium, 2018. [Google Scholar] [CrossRef]
- Wienke, J.; Sparboom, U.; Oumeraci, H. Breaking Wave Impact on a Slender Cylinder. In Proceedings of the Coastal Engineering 2000, Sydney, Australia, 16–21 July 2000; American Society of Civil Engineers: Sydney, Australia, 23 March 2001; pp. 1787–1798. [Google Scholar]
- Wienke, J.; Oumeraci, H. Breaking wave impact force on a vertical and inclined slender pile—Theoretical and large-scale model investigations. Coast. Eng. 2005, 52, 435–462. [Google Scholar] [CrossRef]
- Mo, W.; Jensen, A.; Liu, P.L.-F. Plunging solitary wave and its interaction with a slender cylinder on a sloping beach. Ocean Eng. 2013, 74, 48–60. [Google Scholar] [CrossRef]
- Xiao, H.; Huang, W. Three-Dimensional Numerical Modeling of Solitary Wave Breaking and Force on a Cylinder Pile in a Coastal Surf Zone. J. Eng. Mech. 2015, 141, A4014001. [Google Scholar] [CrossRef]
- Chella, M.A.; Bihs, H.; Myrhaug, D.; Muskulus, M. Breaking solitary waves and breaking wave forces on a vertically mounted slender cylinder over an impermeable sloping seabed. J. Ocean Eng. Mar. Energy 2016, 3, 1–19. [Google Scholar] [CrossRef]
- Vested, M.H.; Carstensen, S.; Christensen, E.D. Experimental study of wave kinematics and wave load distribution on a vertical circular cylinder. Coast. Eng. 2020, 157, 103660. [Google Scholar] [CrossRef]
- Chiapponi, L.; Addona, F.; Díaz-Carrasco, P.; Losada, M.; Longo, S. Statistical analysis of the interaction between wind-waves and currents during early wave generation. Coast. Eng. 2020, 159, 103672. [Google Scholar] [CrossRef]
- Tu, Z.; Yao, J.; Huang, M.; Lou, W. Investigation of Coupling Effects of Wave, Current, and Wind on a Pile Foundation. Sustainability 2022, 14, 14272. [Google Scholar] [CrossRef]
- Miles, J.; Martin, T.; Goddard, L. Current and wave effects around windfarm monopile foundations. Coast. Eng. 2017, 121, 167–178. [Google Scholar] [CrossRef] [Green Version]
- Chen, L.; Stagonas, D.; Santo, H.; Buldakov, E.; Simons, R.; Taylor, P.; Zang, J. Numerical modelling of interactions of waves and sheared currents with a surface piercing vertical cylinder. Coast. Eng. 2019, 145, 65–83. [Google Scholar] [CrossRef]
- Chen, L.; Zhai, H.; Wang, P.; Jeng, D.-S.; Zhang, Q.; Wang, S.; Duan, L.; Liu, Y. Physical modeling of combined waves and current propagating around a partially embedded monopile in a porous seabed. Ocean Eng. 2020, 205, 107307. [Google Scholar] [CrossRef]
- Chen, L.; Yang, X.; Li, L.; Wu, W.; El Naggar, M.H.; Wang, K.; Chen, J. Numerical Analysis of the Deformation Performance of Monopile under Wave and Current Load. Energies 2020, 13, 6431. [Google Scholar] [CrossRef]
- Roy, S.; Debnath, K.; Mazumder, B.S. Distribution of turbulent eddies behind a monopile for vortex lock-on condition due to wave current combined flow. Coast. Eng. 2018, 131, 70–87. [Google Scholar] [CrossRef]
- Buljac, A.; Kozmar, H.; Yang, W.; Kareem, A. Concurrent wind, wave and current loads on a monopile-supported offshore wind turbine. Eng. Struct. 2022, 255, 113950. [Google Scholar] [CrossRef]
- Zhang, B.; Li, J.; Liu, W.; Zhang, H.; Shi, P.; Fu, X. Experimental study on dynamic characteristics of a monopile foundation based on local scour in combined waves and current. Ocean Eng. 2022, 266, 113003. [Google Scholar] [CrossRef]
- Lin, J.; Zhang, J.-S.; Sun, K.; Wei, X.-L.; Guo, Y.-K. Numerical analysis of seabed dynamic response in vicinity of mono-pile under wave-current loading. Water Sci. Eng. 2020, 13, 74–82. [Google Scholar] [CrossRef]
- Li, J.; Zhang, B.; Shen, C.; Fu, X.; Li, W. Experimental Study on Local Scour Depth around Monopile Foundation in Combined Waves and Current. Sustainability 2021, 13, 13614. [Google Scholar] [CrossRef]
- Basack, S.; Goswami, G.; Dai, Z.-H.; Baruah, P. Failure-Mechanism and Design Techniques of Offshore Wind Turbine Pile Foundation: Review and Research Directions. Sustainability 2022, 14, 12666. [Google Scholar] [CrossRef]
- Chen, B.; Li, S. Experimental Study of Local Scour around a Vertical Cylinder under Wave-Only and Combined Wave-Current Conditions in a Large-Scale Flume. J. Hydraul. Eng. 2018, 144, 04018058. [Google Scholar] [CrossRef]
- Qi, W.-G.; Li, C.-F.; Jeng, D.-S.; Gao, F.-P.; Liang, Z. Combined wave-current induced excess pore-pressure in a sandy seabed: Flume observations and comparisons with theoretical models. Coast. Eng. 2019, 147, 89–98. [Google Scholar] [CrossRef]
- Qi, W.; Gao, F. Equilibrium scour depth at offshore monopile foundation in combined waves and current. Sci. China Technol. Sci. 2014, 57, 1030–1039. [Google Scholar] [CrossRef] [Green Version]
- Sumer, B.M.; Fredsøe, J. Scour around Pile in Combined Waves and Current. J. Hydraul. Eng. 2001, 127, 403–411. [Google Scholar] [CrossRef]
- Welzel, M.; Schendel, A.; Hildebrandt, A.; Schlurmann, T. Scour development around a jacket structure in combined waves and current conditions compared to monopile foundations. Coast. Eng. 2019, 152, 103515. [Google Scholar] [CrossRef]
- Wu, M.; De Vos, L.; Chavez, C.E.A.; Stratigaki, V.; Fazeres-Ferradosa, T.; Rosa-Santos, P.; Taveira-Pinto, F.; Troch, P. Large Scale Experimental Study of the Scour Protection Damage around a Monopile Foundation under Combined Wave and Current Conditions. J. Mar. Sci. Eng. 2020, 8, 417. [Google Scholar] [CrossRef]
- Zhu, J.; Gao, Y.; Wang, L.; Li, W. Experimental investigation of breaking regular and irregular waves slamming on an offshore monopile wind turbine. Mar. Struct. 2022, 86, 103270. [Google Scholar] [CrossRef]
- Irschik, K.; Sparboom, U.; Oumeraci, H. Breaking Wave Loads on a Slender Pile in Shallow Water. In Proceedings of the Coastal Engineering 2004, Lisbon, Portugal, 19–24 September 2004; World Scientific Publishing Company: Singapore, 2005; pp. 568–580. [Google Scholar]
- Kamath, A.; Chella, M.A.; Bihs, H.; Arntsen, Ø.A. Breaking wave interaction with a vertical cylinder and the effect of breaker location. Ocean Eng. 2016, 128, 105–115. [Google Scholar] [CrossRef]
- Lara, J.L.; Losada, I.; Liu, P. Breaking waves over a mild gravel slope: Experimental and numerical analysis. J. Geophys. Res. Earth Surf. 2006, 111, C11019. [Google Scholar] [CrossRef]
- Goda, Y.; Morinobu, K. Breaking Wave Heights on Horizontal Bed Affected by Approach Slope. Coast. Eng. J. 1998, 40, 307–326. [Google Scholar] [CrossRef]
- Kirkgöz, M. Breaking wave impact on vertical and sloping coastal structures. Ocean Eng. 1995, 22, 35–48. [Google Scholar] [CrossRef]
- Allsop, N.W.H.; Durand, N.; Hurdle, D.P. Influence of Steep Seabed Slopes on Breaking Waves for Structure Design. In Proceedings of the Coastal Engineering 1998, Copenhagen, Denmark, 22–26 June 1998; American Society of Civil Engineers: Copenhagen, Denmark, 1999; pp. 906–919. [Google Scholar]
- Zeng, X.; Shi, W.; Michailides, C.; Zhang, S.; Li, X. Numerical and experimental investigation of breaking wave forces on a monopile-type offshore wind turbine. Renew. Energy 2021, 175, 501–519. [Google Scholar] [CrossRef]
- Bredmose, H.; Slabiak, P.; Sahlberg-Nielsen, L.; Schlütter, F. Dynamic Excitation of Monopiles by Steep and Breaking Waves: Experimental and Numerical Study. In Proceedings of the Volume 8: Ocean Renewable Energy, Washington, DC, USA, 7 June 1981; American Society of Mechanical Engineers: Nantes, France, 2013; p. V008T09A062. [Google Scholar]
- Chella, M.A.; Tørum, A.; Myrhaug, D. An Overview of Wave Impact Forces on Offshore Wind Turbine Substructures. Energy Procedia 2012, 20, 217–226. [Google Scholar] [CrossRef] [Green Version]
- Yang, H.; Guo, Z.; Wang, L.; Dou, Y.; Liu, Z. Experimental study on wave-induced seabed response and force on the pipeline shallowly buried in a submerged sandy slope. Ocean Eng. 2022, 251, 111153. [Google Scholar] [CrossRef]
- Dou, Y.; Guo, Z.; Gao, Y.; Wang, L.; Yang, H.; Liu, Z. Experimental investigations on the stability of clayey sloping seabed under wave actions. Ocean Eng. 2021, 239, 109805. [Google Scholar] [CrossRef]
- Yang, H.; Guo, Z.; Wang, L.; Qi, W. Peak uplift resistance of offshore slender structures shallowly buried in the sloping seabed considering wave actions. Appl. Ocean Res. 2022, 129, 103388. [Google Scholar] [CrossRef]
- Grilli, S.T.; Svendsen, I.A.; Subramanya, R. Breaking Criterion and Characteristics for Solitary Waves on Slopes. J. Waterw. Port, Coastal, Ocean Eng. 1997, 123, 102–112. [Google Scholar] [CrossRef] [Green Version]
- He, F.; Zhang, H.; Huang, C.; Liu, M. Numerical investigation of the solitary wave breaking over a slope by using the finite particle method. Coast. Eng. 2019, 156, 103617. [Google Scholar] [CrossRef]
- Battjes, J.A. Computation of Set-Up, Longshore Currents, Run-up and Overtopping Due to Wind-Generated Waves; TU Delft: Delft, The Netherland, 1974. [Google Scholar]
- Galvin, C.J. Breaker type classification on three laboratory beaches. J. Geophys. Res. Atmos. 1968, 73, 3651–3659. [Google Scholar] [CrossRef]
Figure 1.
Flume test setup.

Figure 2.
Schematic diagram of the load cell measurements and free body diagram of the pile.
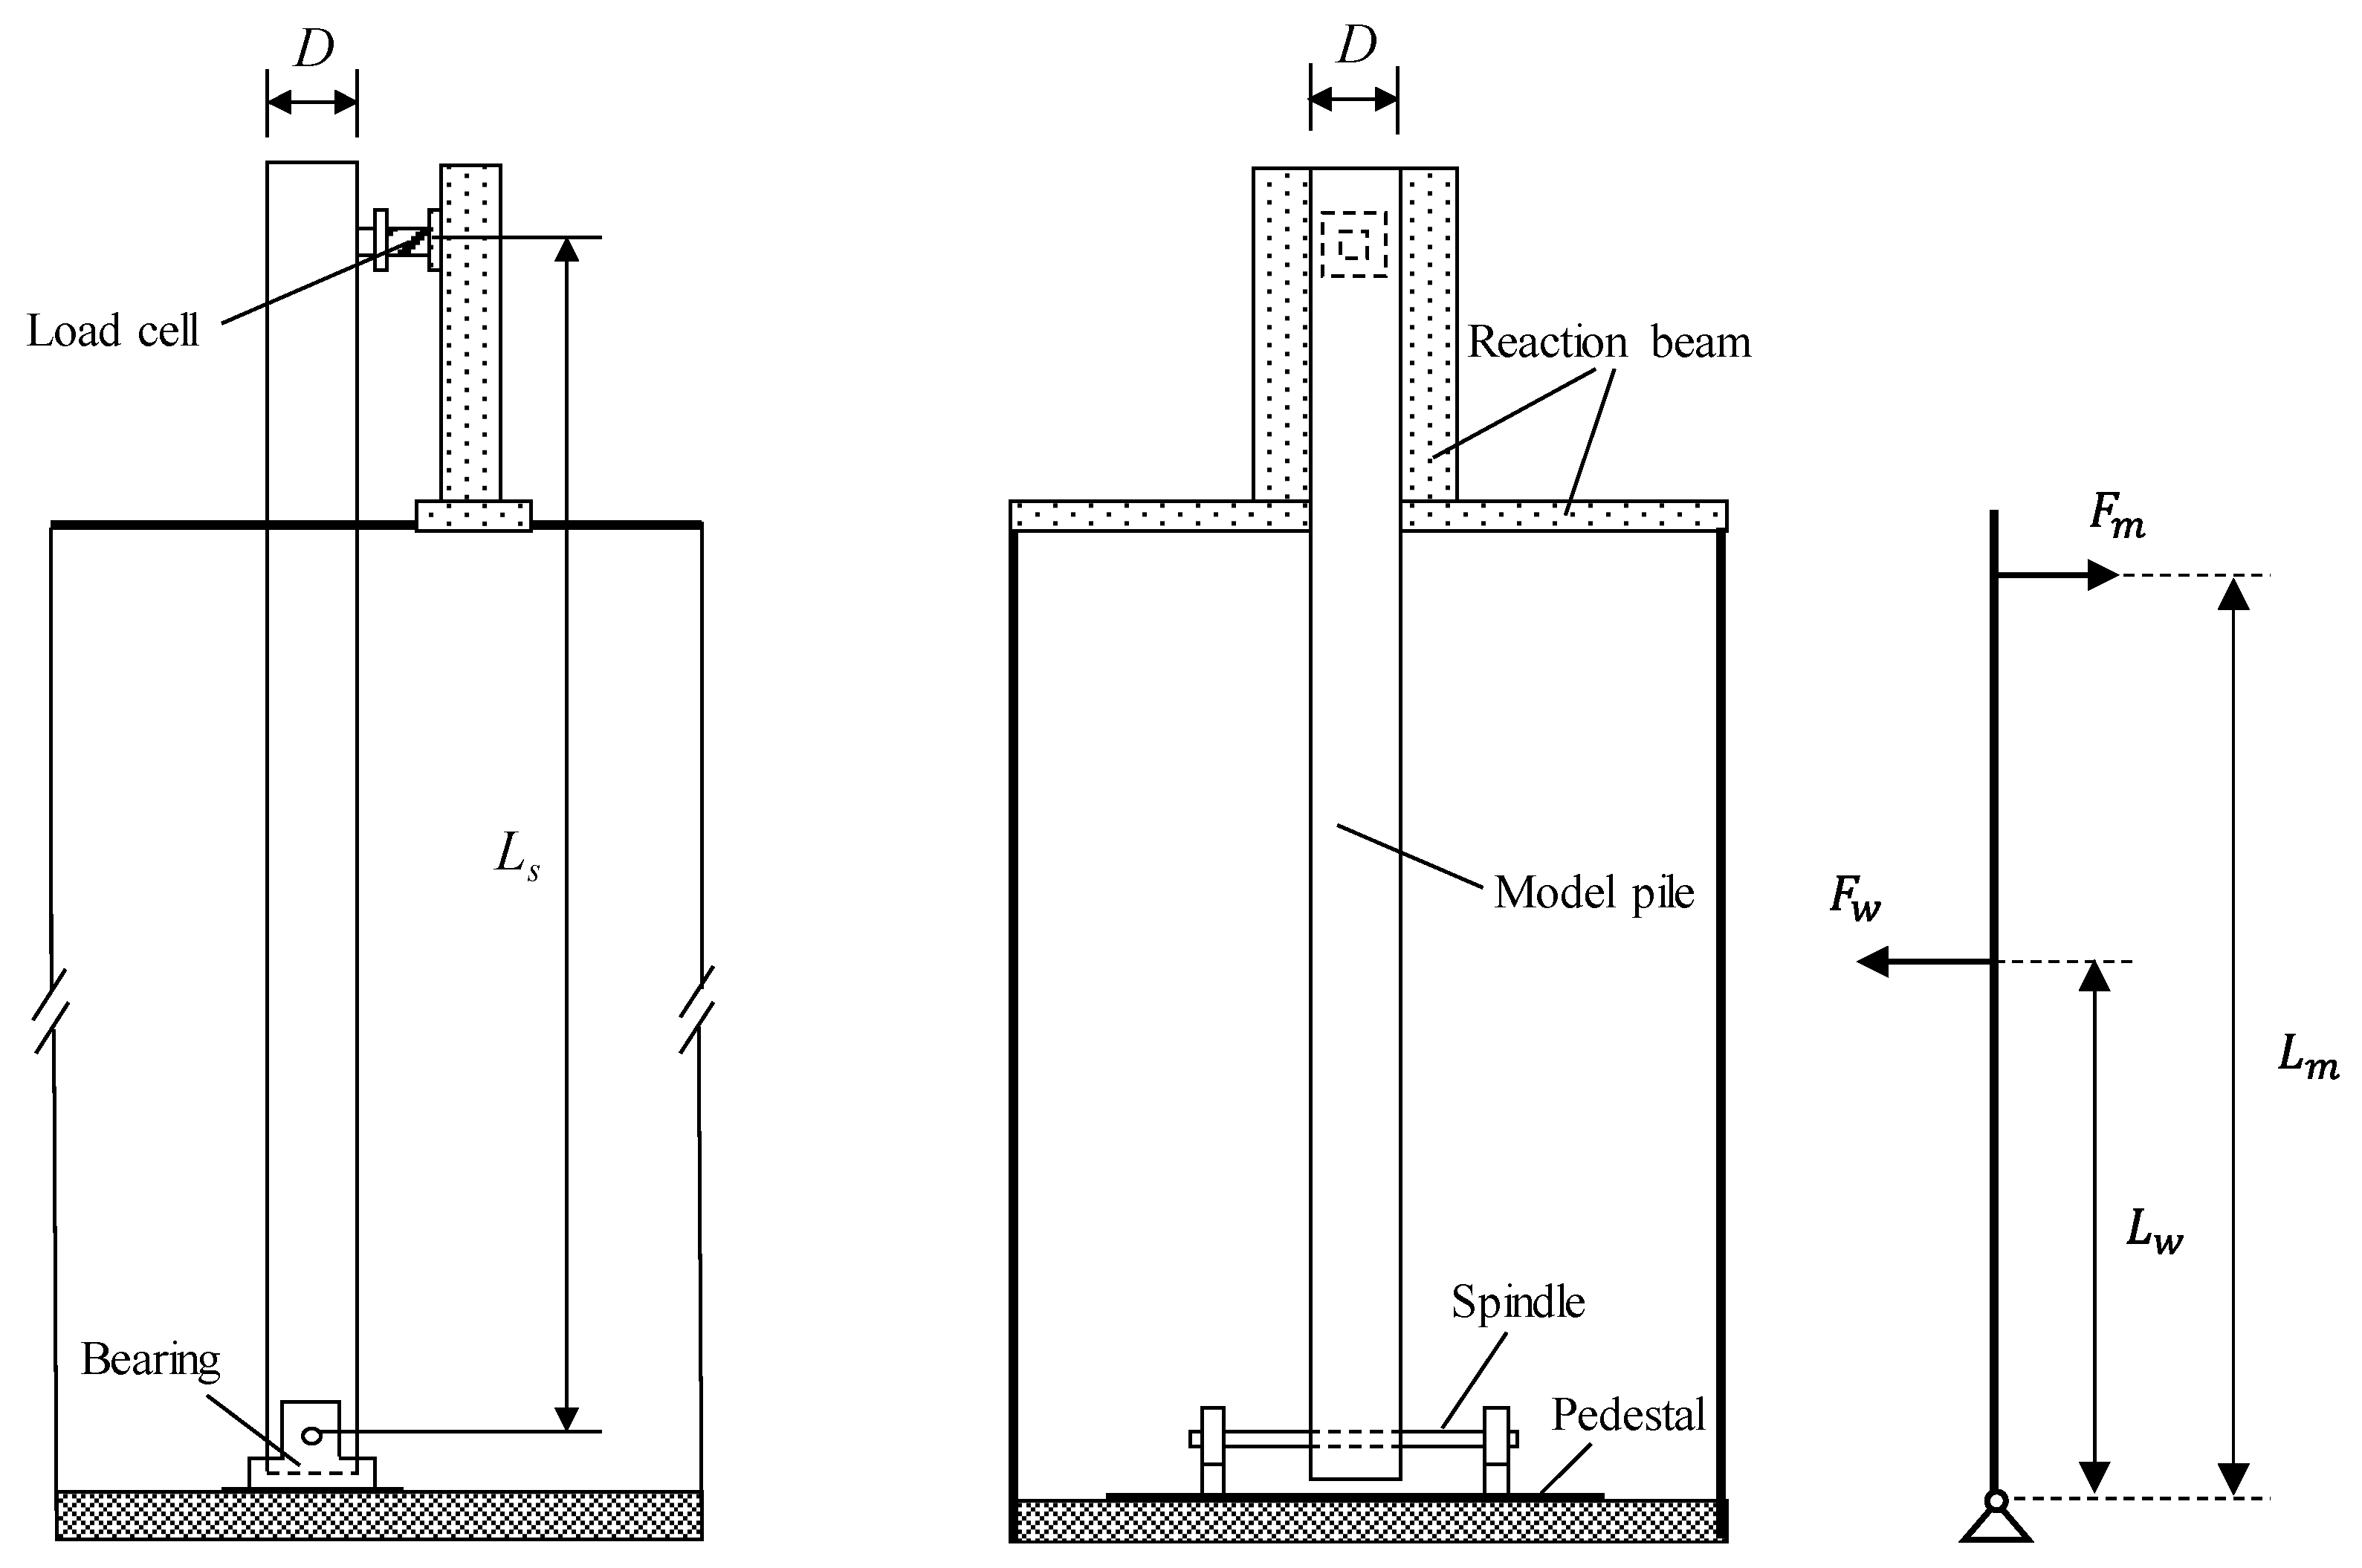
Figure 3.
Typical simulated results (solitary wave, h = 65 cm, H = 5 cm, and v = 0 cm/s): (a) Wave surface pressure, (b) variations in the free surface elevations at different coordinates (x, y).
Figure 3.
Typical simulated results (solitary wave, h = 65 cm, H = 5 cm, and v = 0 cm/s): (a) Wave surface pressure, (b) variations in the free surface elevations at different coordinates (x, y).

Figure 4.
Wave heights measured by WG1 under two typical wave conditions: (a) Solitary waves with h = 80 cm and H = 10 cm; (b) regular waves with h = 80 cm, H = 10 cm, and T = 1.8 s, for different current velocities.
Figure 4.
Wave heights measured by WG1 under two typical wave conditions: (a) Solitary waves with h = 80 cm and H = 10 cm; (b) regular waves with h = 80 cm, H = 10 cm, and T = 1.8 s, for different current velocities.
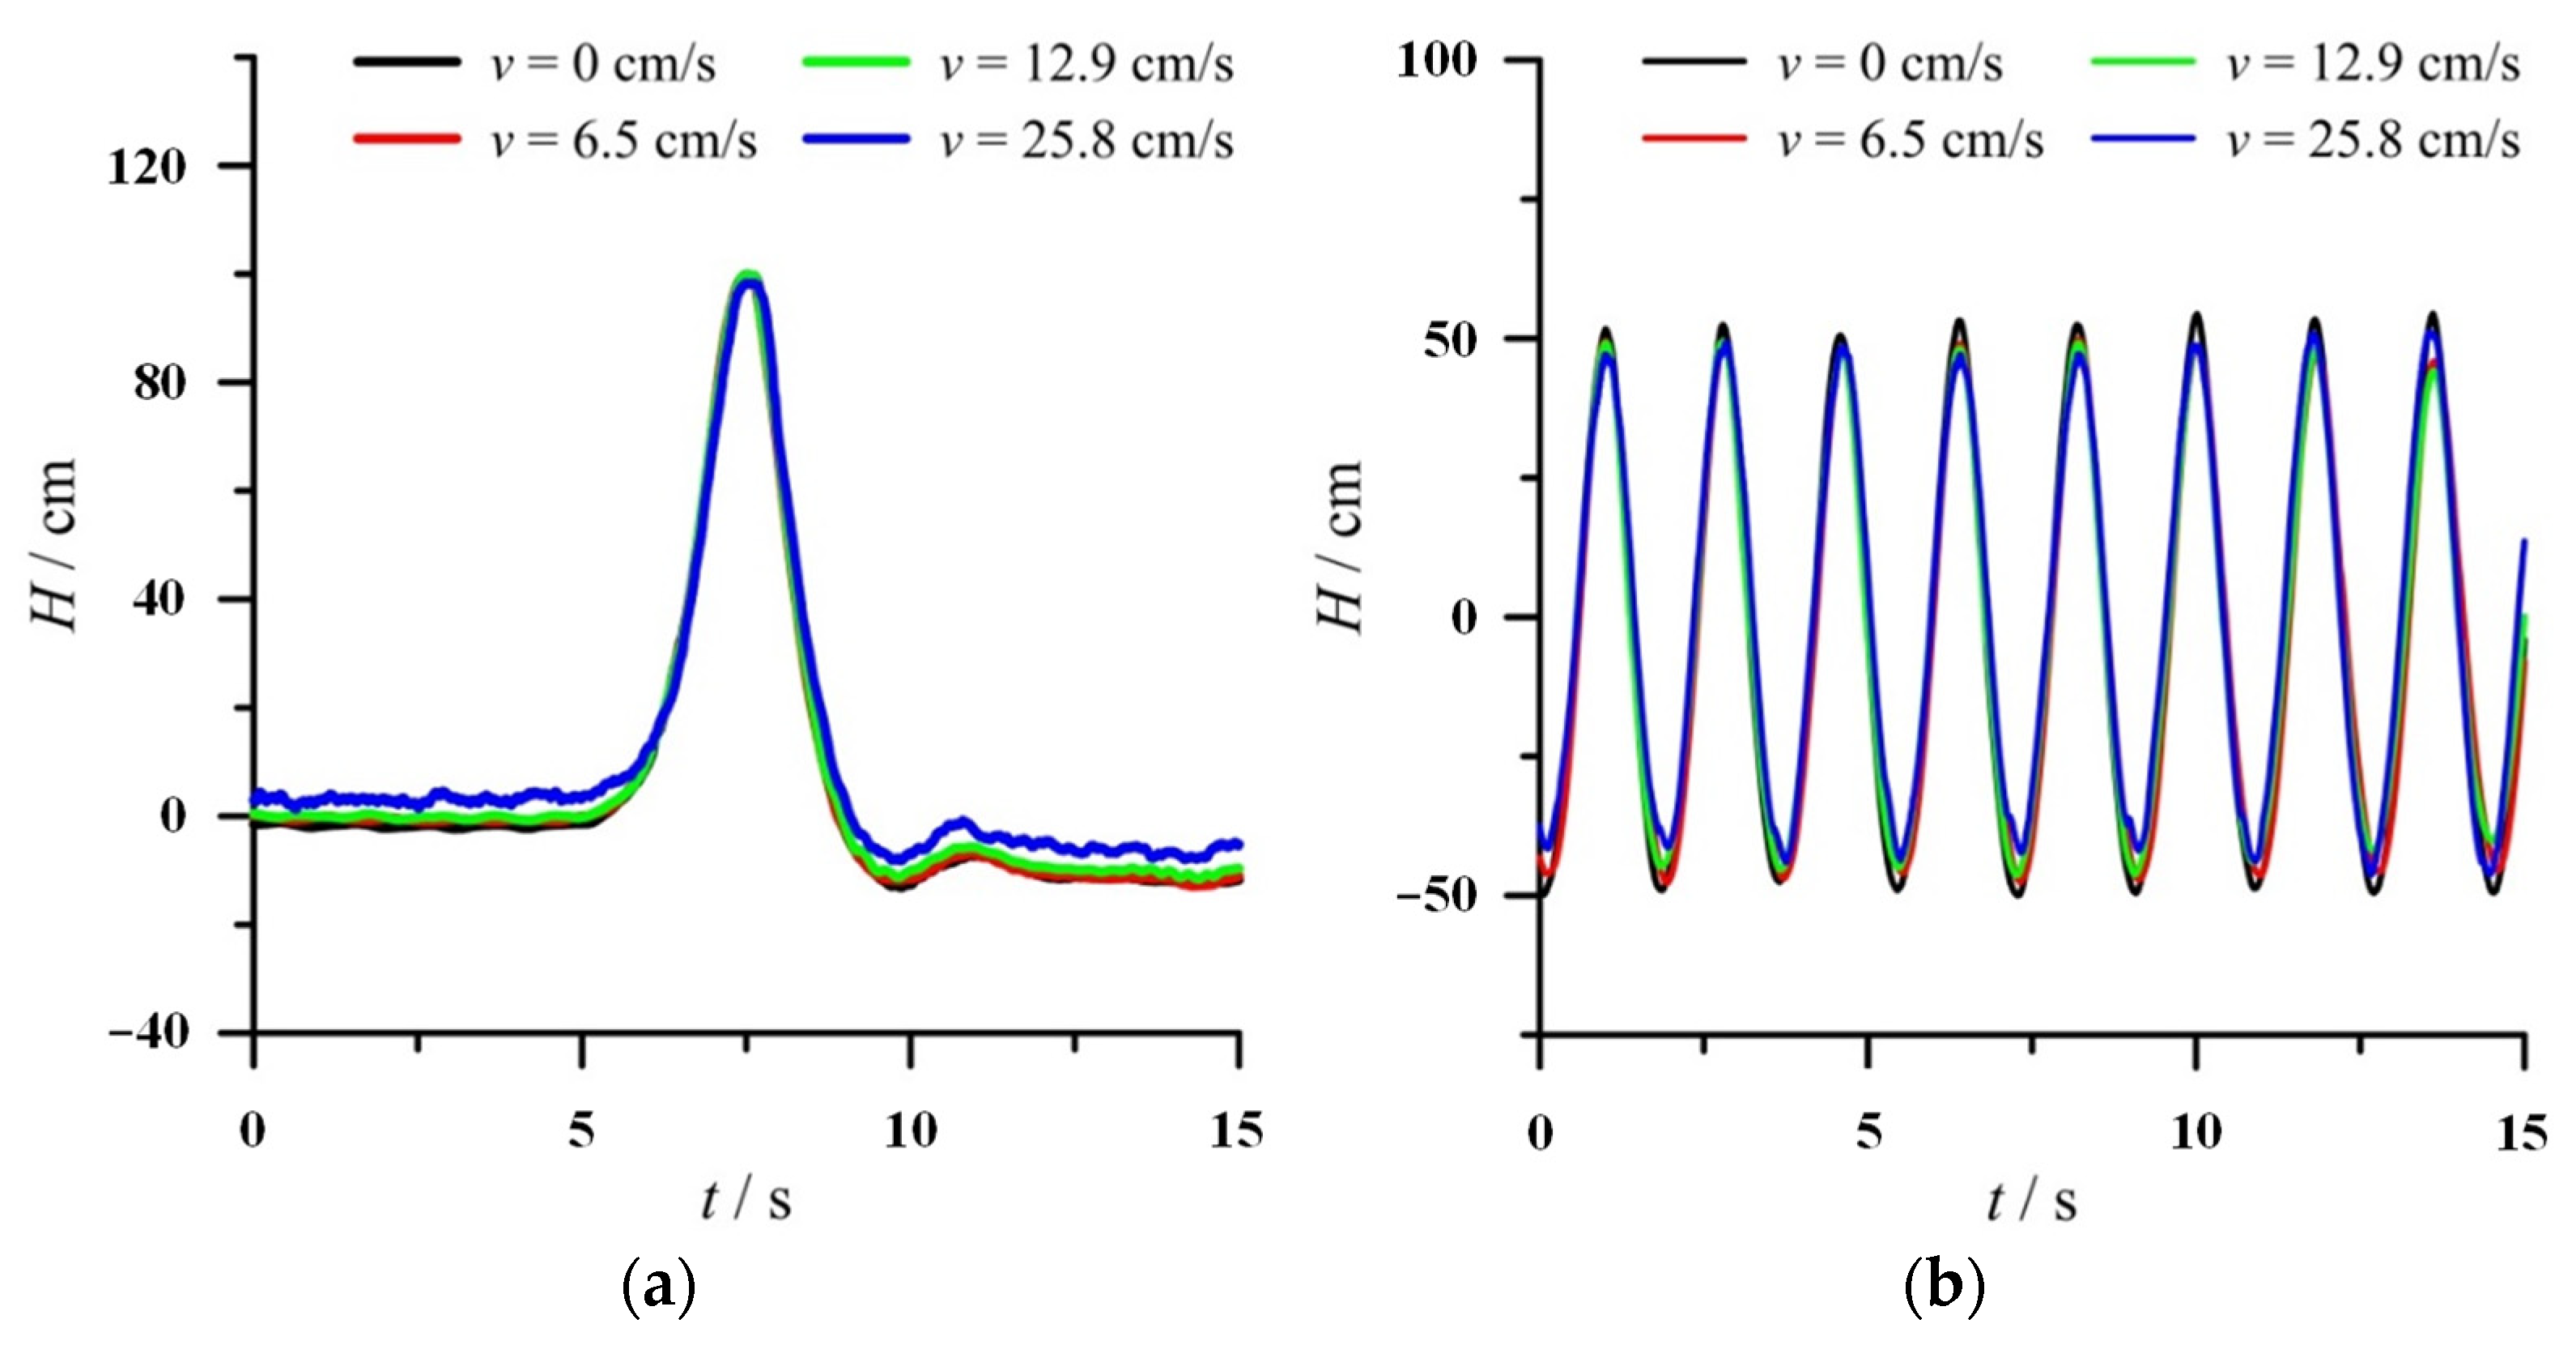
Figure 5.
Effect of the following currents with various velocities on the normalized peak moment on the pile with different water depths and solitary wave heights.
Figure 5.
Effect of the following currents with various velocities on the normalized peak moment on the pile with different water depths and solitary wave heights.

Figure 6.
Snapshots of the free surface around the pile when the solitary wave gained the maximum run-up with different following current velocities (H = 15 cm), where solid lines indicate the edges of the free surface.
Figure 6.
Snapshots of the free surface around the pile when the solitary wave gained the maximum run-up with different following current velocities (H = 15 cm), where solid lines indicate the edges of the free surface.
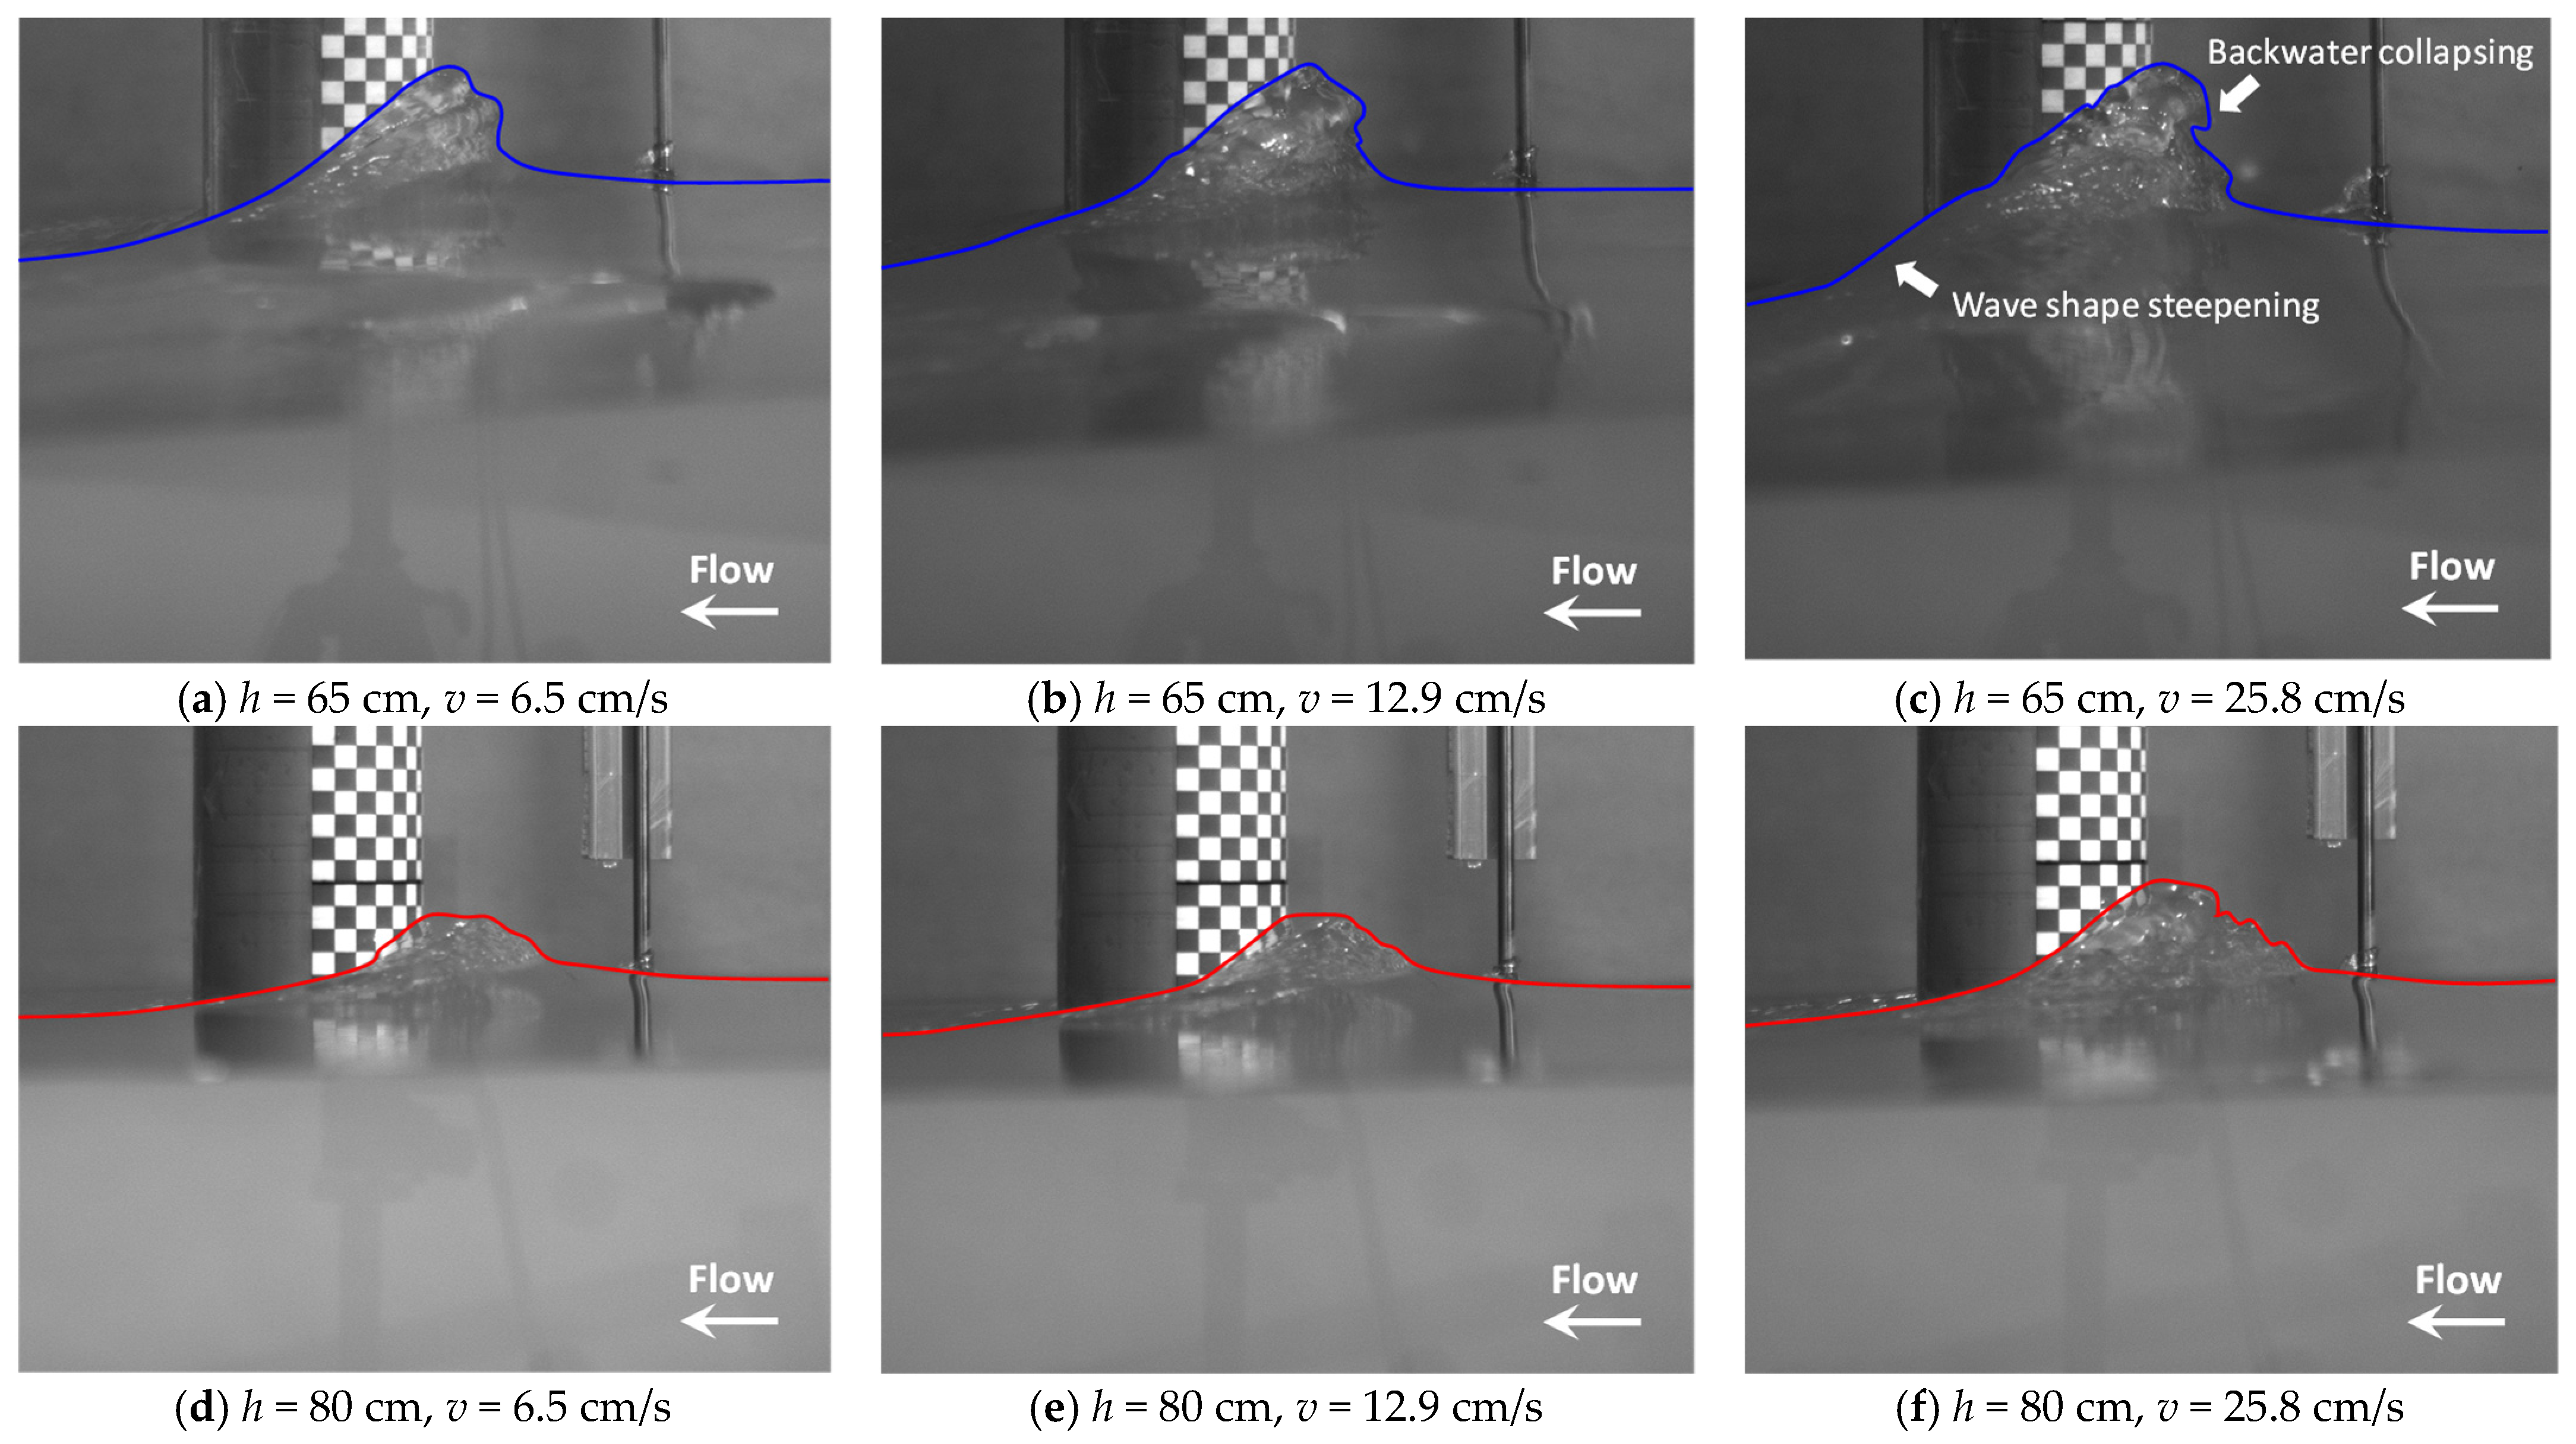
Figure 7.
The growth rate of the pile moment with the pile diameter increasing from 10 cm to 20 cm (solitary waves: h = 80 cm).
Figure 7.
The growth rate of the pile moment with the pile diameter increasing from 10 cm to 20 cm (solitary waves: h = 80 cm).

Figure 8.
Effect of the following current with various velocities on the normalized peak moment on the pile with different (a) regular wave heights and (b) regular wave periods.
Figure 8.
Effect of the following current with various velocities on the normalized peak moment on the pile with different (a) regular wave heights and (b) regular wave periods.
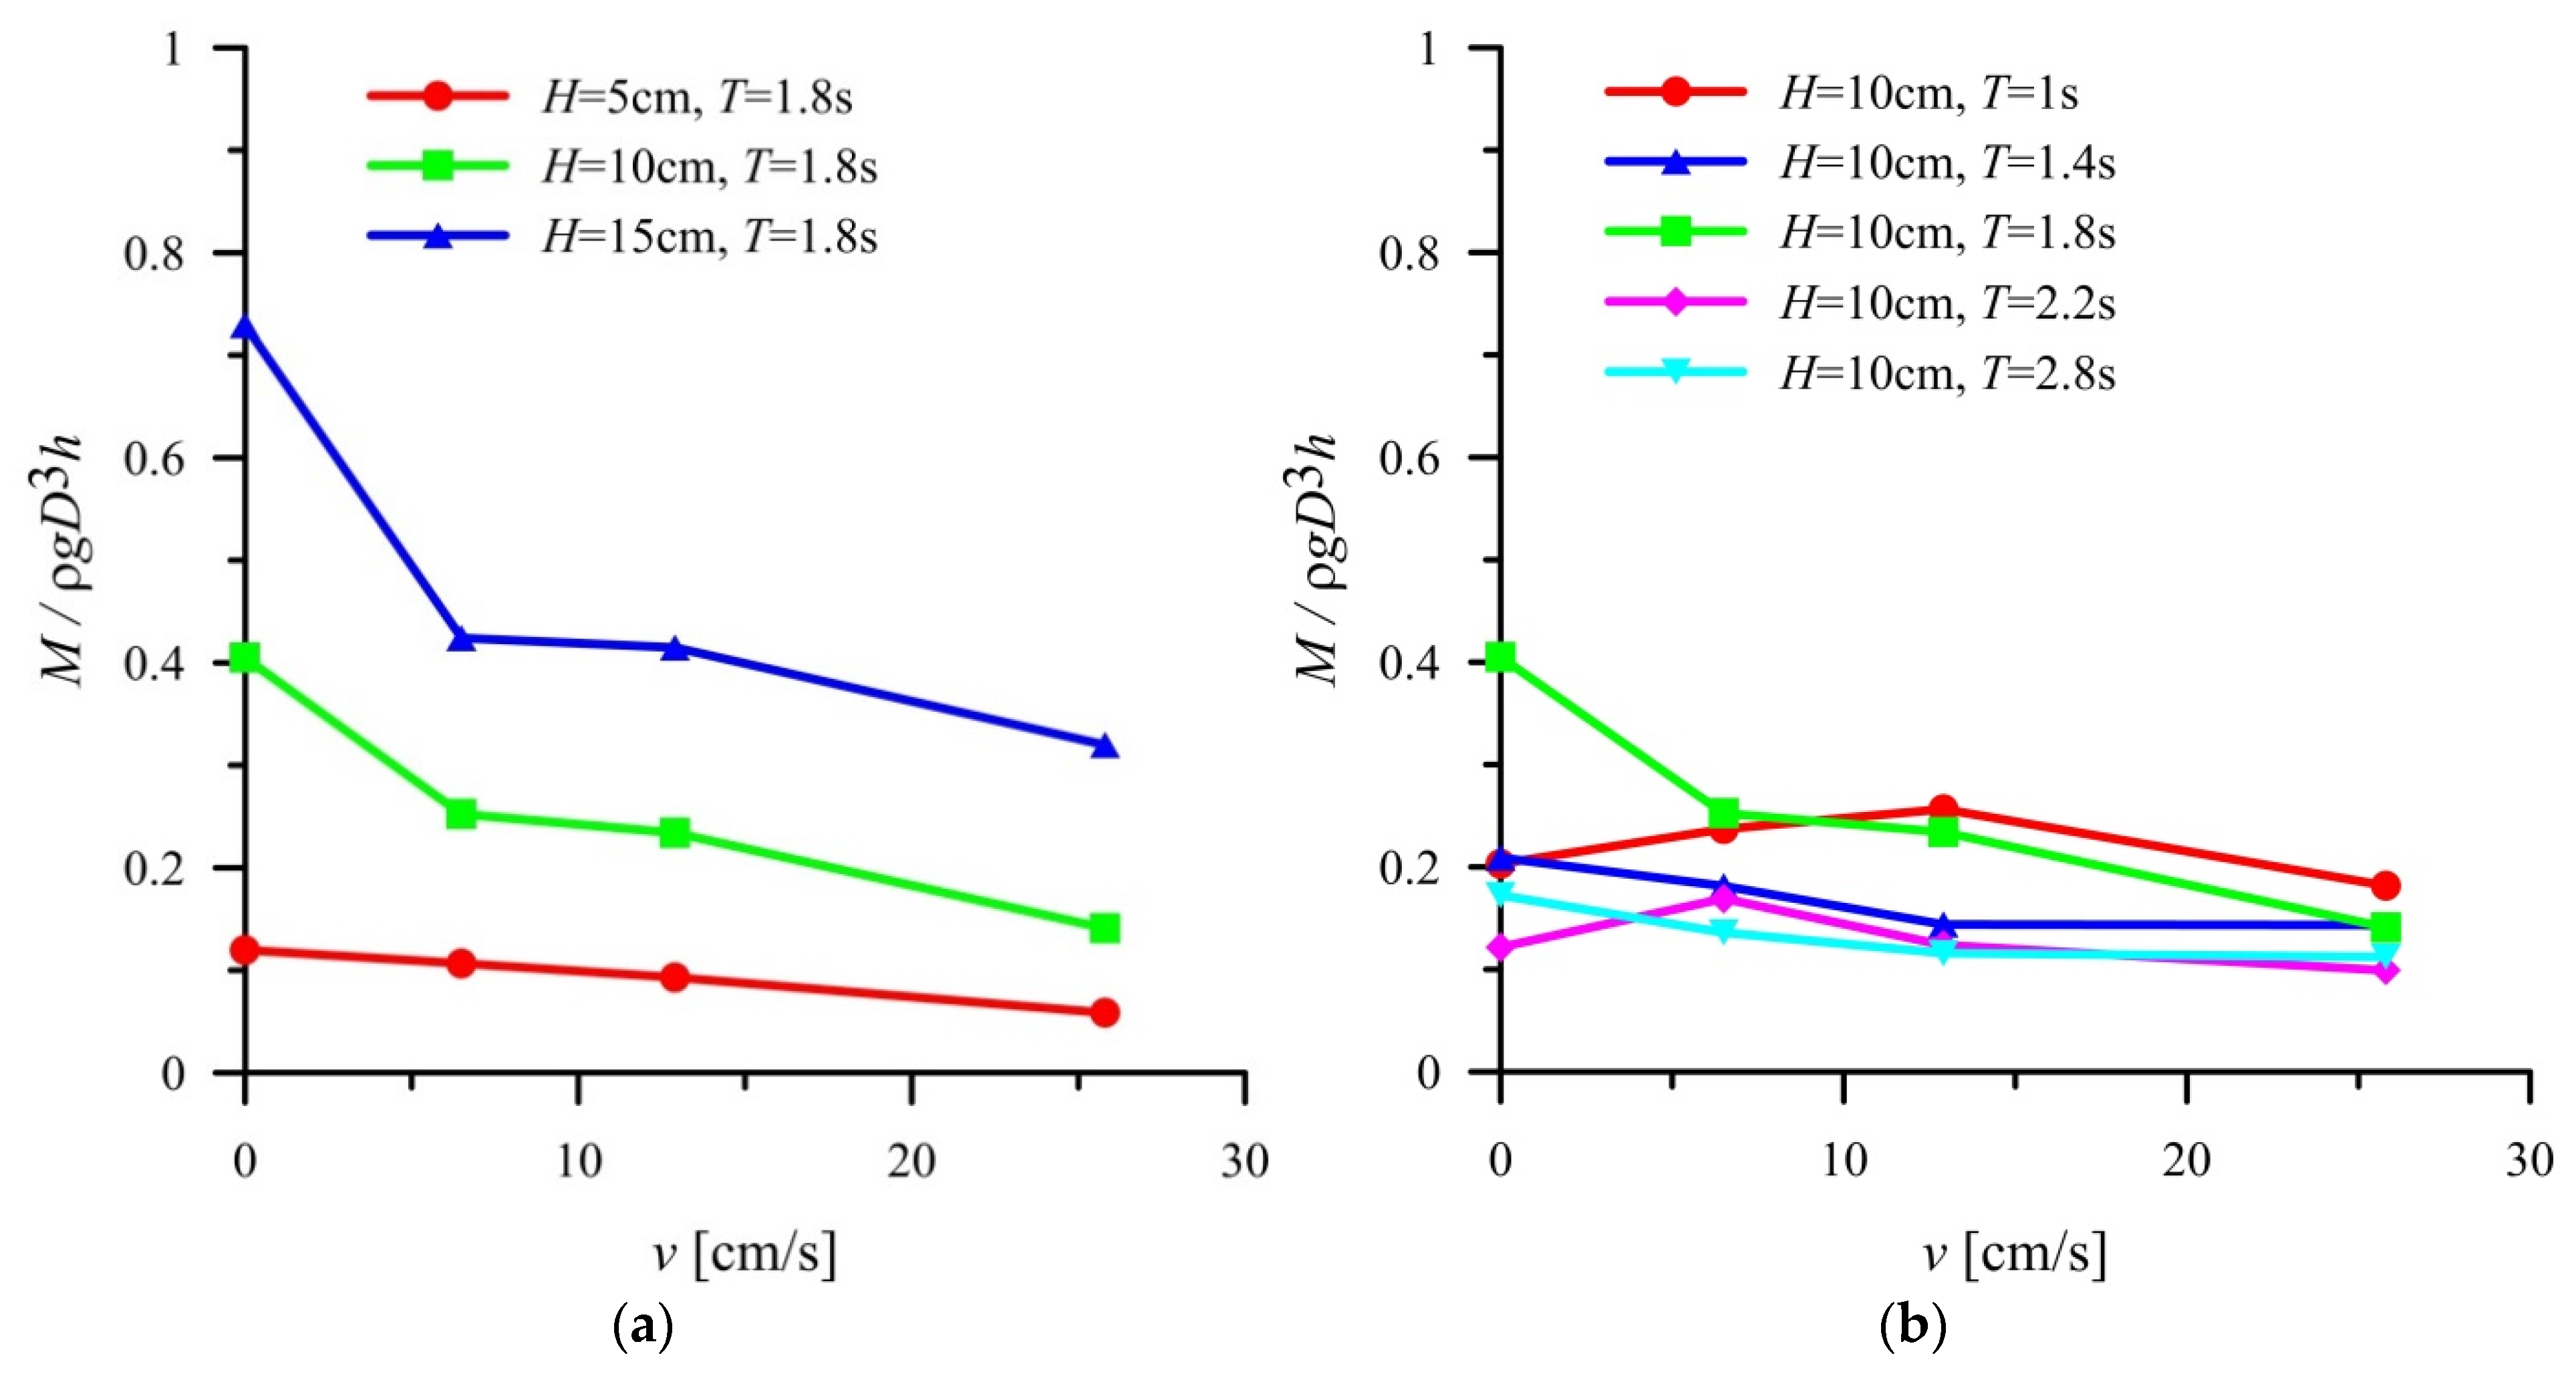
Figure 9.
Snapshots of the free surface around the pile when the regular wave impacted on the pile with different following current velocities (h = 80 cm, H = 10 cm, T = 1.8 s).
Figure 9.
Snapshots of the free surface around the pile when the regular wave impacted on the pile with different following current velocities (h = 80 cm, H = 10 cm, T = 1.8 s).


Table 1.
Parameters at the prototype and model (geometry scale: 1:60).
| Parameter | Prototype Scale | Model Scale |
|---|---|---|
| Pile diameter D | 6 m/12 m | 10 cm/20 cm |
| Maximum water depth h | 48 m | 80 cm |
| Maximum wave height H | 9 m | 15 cm |
| Mean surface current velocity | 1 m/s | 12.9 cm/s |
| Maximum surface current velocity vm | 2 m/s | 25.8 cm/s |
Table 2.
Test conditions for the breaking wave loads with different following current velocities on an impermeable slope.
Table 2.
Test conditions for the breaking wave loads with different following current velocities on an impermeable slope.
| Test No. | Wave Type | Pile Diameter | Water Depth | Wave Height | Wave Period | Wave Length | BreakingIndex | Breaker Type | Current Velocity |
|---|---|---|---|---|---|---|---|---|---|
| D [cm] | h [cm] | H [cm] | T [s] | L [m] | S0/ξ | - | v [cm/s] | ||
| 1 | solitary | 10 | 65 | 5 | - | - | 0.49 | Non-breaking | 0/6.5/12.9/25.8 |
| 2 | solitary | 10 | 65 | 10 | - | - | 0.35 | Surging | 0/6.5/12.9/25.8 |
| 3 | solitary | 10 | 65 | 15 | - | - | 0.28 | Plunging | 0 */6.5/12.9/25.8 |
| 4 | solitary | 10 | 70 | 5 | - | - | 0.51 | Non-breaking | 0/6.5/12.9/25.8 |
| 5 | solitary | 10 | 70 | 10 | - | - | 0.36 | Surging | 0/6.5/12.9/25.8 |
| 6 | solitary | 10 | 70 | 15 | - | - | 0.29 | Plunging | 0/6.5/12.9/25.8 |
| 7 | solitary | 10 | 75 | 5 | - | - | 0.53 | Non-breaking | 0/6.5/12.9/25.8 |
| 8 | solitary | 10 | 75 | 10 | - | - | 0.37 | Surging | 0/6.5/12.9/25.8 |
| 9 | solitary | 10 | 75 | 15 | - | - | 0.30 | Plunging | 0/6.5/12.9/25.8 |
| 10 | solitary | 10 | 80 | 5 | - | - | 0.54 | Non-breaking | 0/6.5/12.9/25.8 |
| 11 | solitary | 10 | 80 | 10 | - | - | 0.38 | Non-breaking | 0/6.5/12.9/25.8 |
| 12 | solitary | 10 | 80 | 15 | - | - | 0.31 | Surging | 0/6.5 */12.9/25.8 * |
| 13 | solitary | 20 | 80 | 5 | - | - | 0.54 | Non-breaking | 0/6.5/12.9/25.8 |
| 14 | solitary | 20 | 80 | 10 | - | - | 0.38 | Non-breaking | 0/6.5/12.9/25.8 |
| 15 | solitary | 20 | 80 | 15 | - | - | 0.31 | Surging | 0 */6.5/12.9/25.8 * |
| 16 | regular | 20 | 80 | 5 | 1.8 | 5.06 | 0.90 | Plunging | 0/6.5/12.9/25.8 |
| 17 | regular | 20 | 80 | 10 | 1 | 1.56 | 0.35 | Spilling | 0/6.5/12.9/25.8 |
| 18 | regular | 20 | 80 | 10 | 1.4 | 3.06 | 0.49 | Spilling | 0/6.5/12.9/25.8 |
| 19 | regular | 20 | 80 | 10 | 1.8 | 5.06 | 0.63 | Plunging | 0/6.5/12.9/25.8 |
| 20 | regular | 20 | 80 | 10 | 2.2 | 7.56 | 0.78 | Plunging | 0/6.5/12.9/25.8 |
| 21 | regular | 20 | 80 | 10 | 2.6 | 10.55 | 0.92 | Plunging | 0/6.5/12.9/25.8 |
| 22 | regular | 20 | 80 | 15 | 1.8 | 5.06 | 0.52 | Plunging | 0 */6.5/12.9/25.8 |
* Several typical test conditions, marked with an asterisk, were repeated five times to verify the repeatability of the results.
Disclaimer/Publisher’s Note: The statements, opinions and data contained in all publications are solely those of the individual author(s) and contributor(s) and not of MDPI and/or the editor(s). MDPI and/or the editor(s) disclaim responsibility for any injury to people or property resulting from any ideas, methods, instructions or products referred to in the content. |
© 2022 by the authors. Licensee MDPI, Basel, Switzerland. This article is an open access article distributed under the terms and conditions of the Creative Commons Attribution (CC BY) license (https://creativecommons.org/licenses/by/4.0/).
Share and Cite
MDPI and ACS Style
Liu, S.; Liu, Z. Influence of Currents on the Breaking Wave Forces Acting on Monopiles over an Impermeable Slope. Sustainability 2023, 15, 129. https://doi.org/10.3390/su15010129
AMA Style
Liu S, Liu Z. Influence of Currents on the Breaking Wave Forces Acting on Monopiles over an Impermeable Slope. Sustainability. 2023; 15(1):129. https://doi.org/10.3390/su15010129
Chicago/Turabian StyleLiu, Shan, and Zhenyu Liu. 2023. "Influence of Currents on the Breaking Wave Forces Acting on Monopiles over an Impermeable Slope" Sustainability 15, no. 1: 129. https://doi.org/10.3390/su15010129
Note that from the first issue of 2016, this journal uses article numbers instead of page numbers. See further details here.