
Finite Element Analysis of Different Infill Patterns for 3D Printed Tidal Turbine Blade
by
 and
and
Glecelyn M. Galvez
,
Karl Andrie M. Olivar
,
Francis Rey G. Tolentino
,
Louis Angelo M. Danao
* and
and
Binoe E. Abuan
Department of Mechanical Engineering, University of the Philippines Diliman, Quezon City 1101, Philippines
*
Author to whom correspondence should be addressed.
Sustainability 2023, 15(1), 713; https://doi.org/10.3390/su15010713
Submission received: 15 November 2022
/
Revised: 20 December 2022
/
Accepted: 27 December 2022
/
Published: 30 December 2022
(This article belongs to the Special Issue Ocean and Hydropower)
Abstract
:The fabrication route for tidal turbine blades has been compounded with the appearance of additive manufacturing; with the use of infill patterns, improvement of mechanical strength and material reduction for 3D printed parts can be obtained. Through finite element analysis and three-point bend tests, the optimal infill lattice pattern, and the viability of the shell–infill turbine blade model as an alternative to the conventional shell-spar model was determined. Out of a selection of infills, the best infill pattern was determined as the hexagonal infill pattern oriented in-plane. A representative volume element was modeled in ANSYS Material Designer, resulting in the homogenized properties of the in-plane hexagonal lattice. After validation, the homogenized properties were applied to the tidal turbine blade. The shell–infill model was based on the volume of the final shell-spar model which had a blade deflection of 9.720% of the blade length. The difference in the deflection between the homogenized infill and the spar cross-section was 0.00125% with a maximum stress of 170.3 MPa which was within the tensile strength and flexure strength of the carbon fiber with onyx base material. Conclusively, the homogenized infill was determined as a suitable alternative to the spar cross-section. The best orientation of the infill relative to the horizontal orientation of the blade was 0 degrees; however, the lack of trend made it inconclusive whether 0 degrees was the absolute optimal infill orientation.
1. Introduction
The Department of Energy (DoE) of the Philippines developed the National Renewable Energy Program (NREP) that projected the country’s renewable energy capacity to be 15,304 MW [1] by year 2030. Experts of renewable energy are encouraged to design technologies to exploit the untapped energy potential for the country’s benefit. With the appearance of additive manufacturing in the present, the fabrication route for makers to produce horizontal axis wind and tidal turbines has compounded considering the reduced cost of production and assembling procedure it offers.
According to ISO/ASTM 52900:2021 [2], additive manufacturing (AM) is the process of manufacturing a physical object using a 3D model, slicing the model, and then fabricating it by combining or adding parts together, generally, layer by layer [3]. AM is mostly used in rapid prototyping of products rather than producing actual products for the market, since there are a lot of manufacturing inconsistencies in AM [4,5]. However, recent developments in AM suggest that the manufacturing of actual products are viable [5,6,7]. Researchers are drawn to investigate the potential of AM processes in meeting the strength capabilities that traditionally manufactured products are favored with. Utilizing the ability of AM to produce complex geometries, lattice structures are incorporated into AM products with the primary goal to improve its mechanical strength while reducing material volume [4,5,7].
Engineering design iterations, performed on computer aided design (CAD) models of AM products, are subjected to finite element analysis (FEA) to predict product properties. However, inaccuracies in finite element modeling of 3D printed products appear due to manufacturing errors and inconsistencies of AM Products produced by different machines [5,6,8]. Meanwhile, recent research endeavors have validated the method of FEA on 3D printed products using experimental results [9], these studies reclaimed the validity of FEA on AM products. Their method can then be extended to predict the properties of complex geometric properties such as turbine blades [10,11].
The objective of this study was to fill the knowledge gap of applying additive manufacturing to horizontal axis tidal turbines (HATT), and to integrate infill patterns in an already existing HATT blade design that was tested using finite element analysis (FEA). The study investigated the effects of the infill pattern and its orientation on the turbine blade design by comparing the blade deflection and maximum stress results of the models using a homogenized modelling method. This study is first of its kind in showing the applicability of a representative volume element to simplify the modelling of complex internal structures, such as infill patterns commonly employed in 3D printing technologies to structural design and analysis of tidal turbine blades.
2. Review of Related Literature
2.1. Additive Manufacturing
Additive manufacturing (AM) is categorized based on the types of processes performed [5,7]. The common AM processes are: (1) fused deposition modelling (FDM) which fabricates products by layering thermal plastic based on a specified pattern, (2) laminated object manufacturing (LOM) that cuts sheets of material layer by layer using a laser, (3) stereolithography (SLA) which produced parts by curing material layer by layer with UV light and, lastly, (4) selective laser sintering (SLS) that heats up powdered material with a laser just before the sintering point to manufacture a part. These processes can work with different materials such as polymers, ceramics, metals, biomaterials, etc., allowing a wide selection of material without retrofitting the manufacturing device.
AM can manufacture complex geometries such as thin-walled products which are hard to produce with traditional manufacturing [4,5]. However, AM products are also characterized as having uncertain mechanical properties, poor surface quality, and dimensional accuracy [5,8] making it difficult to simulate 3D printed products’ properties through finite element analysis. Recent researchers proposed models that can only be applied to specific machines; hence, an optimal approach towards manufacturing the 3D printed part must be taken to accurately predict the model properties [5,6,8].
2.2. Infill and Lattice Structures
Each layer in the printing process consists of a shell and the infill. The shell is the outline perimeter of the part that can be modified to the desired thickness while the infill is printed inside the shell. The infill is usually represented in percentages which correspond to the amount of material that a solid model must be filled. Infills vary with geometry and percentage which dictates the 3D printed parts’ strength (Figure 1), manufacturing time and material [12].
Cho et al. [13] found out that layer thickness had higher influence than infill patterns on the structural resilience of the part, this is supported by Luzanin et al. [14]. However, increasing the thickness of layers beyond the recommended setting can affect the resolution and fidelity of the 3D printed part which may lead to additional post processing steps. This can simply be avoided by modifying the infill pattern or increasing the infill density of the 3D printed part.
A study by Gurrala and Regalla showed that optimal strength occurs at the highest infill density [15]. Similarly, Alvarez et al. recommended a solid (100%) infill to achieve high mechanical resistance and fast printing compared to infill values between 50% to 98% [16]. Dudescu and Racz showed that the increase in specimen strength and infill percentage was non-linear, the same result was obtained when elastic modulus was tested against infill percentage [17]. The optimal infill percentage for maximizing the stiffness-to-mass ratio of 3D printed structural members is around 10 to 20% and that infill orientation has a negligible effect on flexural rigidity [18].
The ultimate strength, strains and failure behavior of the 3D printed part are functions of the infill pattern (Figure 2) [19]. Research showed that the triangle infill pattern gives the highest mechanical strength and ultimate tensile strength-to-weight ratio when compared to grid, zig-zag, rectilinear and hexagonal infill patterns with the same amount of material [13,20]. Meanwhile, the hexagonal infill pattern proved to have superior characteristics in terms of high ultimate strength and decent ability to resist fracture than specimens of rectangular and diamond infill patterns [13,19]. The improved strength at the strut joints of the hexagonal infill also contributes to its advantage [21].
In other studies, circle packing algorithms were used to generate a honeycomb-shape infill structure with small and dense hexagon patterns in a high-stress area and large and coarse hexagon patterns in a low-stress area for the design of horizontal axis wind turbine (HAWT) blades [22].

2.3. Finite Element Analysis of 3D Printed Parts
Despite the inaccuracies in parts fabricated through additive manufacturing, multiple studies have attempted to predict the material properties of 3D printed products incorporated with lattice structures. Their FEA results coincided with experimental results which validated their FEA methods.
Fernandez et al. assumed that the properties of the model were isotropic to simplify the determination of the elastic modulus of FDM products [9]. Their FEA results coincided with the experimental results, even though the anisotropic nature of the part was disregarded. This demonstrated the feasibility of performing FEA simulations in AM. From the concept of uniformity of the model, the method of homogenization was adapted by researchers, Bhandari and Lopez-Anido [24], to decrease the simulation time of AM products impregnated with lattice structures. The concept of homogenization is about modelling a volume-based lattice finite element model, in conjunction with the experimental data from the 3D printed samples, to generate the homogenized properties of the lattice which consists of Poisson’s ratio and Young’s modulus in different orientations. The homogenized properties are then used to determine the part’s properties.
In the study of Xia Zhou et al., the bending behavior of hybrid sandwich composite structures with 3D printed lattice cores were observed by experimentation and simulation [25]. They created an FEA model of the sandwich with an adhesive using the material properties from the tensile test and subjected it to a simulated three-point bend test. The FEA results followed the same trend as the experimental results. They were also able to obtain properties of the other lattice structures through FEA without performing further experimentations since they had already validated the FEA results and experimental results of the model. This process could be applied to further studies in predicting various 3D printed lattice behavior.
2.4. Horizontal Axis Tidal Turbines
A horizontal axis tidal turbine (HATT) is a tidal current machine that is oriented parallel to the direction of the tidal current. Turbine blades are considered the most critical component of modern wind and tidal turbines. Tidal turbine blades tend to be shorter and stronger compared to wind turbine blades since they are made to withstand higher hydrodynamic forces [26]. Failure analysis must be carried out to determine if the blade can withstand the static and dynamic load it experiences during its design service life [27].
The conventional design cross-section of a turbine blade is made up of an aeroshell and internal webs and the most widely used composite for long wind turbines is resin infusion technology [28]. A 3D printing application on an airfoil design was already tested in the study of Kalyani [10] and Kim [11,22]. A design methodology was included in Kim’s study where the density of the infill pattern was concentrated based on the stress profile from the computation of structural analysis. The optimized infill pattern density distribution in the airfoil was then subjected to static loading test by using different loads at different distances from the blade roots [10]. The same methodology was also applied to a wind turbine blade [29].
Bhandari and Lopez-Anido [24] conducted finite element modeling of 3D printed parts with cellular structures or infill pattern via the use of homogenized continuum finite element model to decrease the simulation time. The concept of homogenization was about representing a volume-based lattice finite element model which would be used to be able to determine the product properties from 3D printed parts. The volume-based lattice finite element was made using experimental data of 3D printed samples to obtain the Poisson’s ratio and Young’s modulus; these values were taken from past experiments. The FEM results were in accordance with the experimental results.
The geometric specifications of the HATT blade used in this study were based on the study of the design of a tidal turbine blade by Danao et al. [26]. The blade performance (Figure 3) and structural response due to hydrodynamic loading were tested using Qblade and ANSYS, respectively. The blade forces used were based on blade element momentum (BEM) simulation for 2 m/s and 5 m/s flow. The forces calculated were then used on the structural analysis of ANSYS to determine its stress and deformation.
The reviewed literature matrix (Table 1) summarizes the similarities and differences of this study to past research based on the given criteria. The row contains the studies while the column contains the criteria. The second column determines whether the study is about a HAWT/ HATT blade, the third whether the study involves 3D printing, the fourth whether the study involves infill pattern, the fifth whether it includes experimental bend test, and the last column whether it involves simulation of the blade. The study of Kim, S. et al. [22] involves topology optimization and simulation of a blade but it did not involve an experimental bend test of the specimen.
For this study, the conventional spar web cross-section of a HATT blade was replaced by an optimized infill. Different infill pattern geometries and orientations were also tested since each pattern had a different mechanical property which was orthotropic. The parameters of the infill used were based on previous studies which recommended an infill percentage within the range of 10–20% to maximize the value of mass-to-stiffness ratio of 3D printed parts. The utilization of hexagonal and triangular infill patterns was based on their better strength and stiffness characteristics relative to other infill patterns.
Due to time constraints and resource availability, finite element analysis with minimal physical experiments was adapted to apply infill patterns to horizontal tidal turbine blades which was also not done on the previous studies in Table 1. The concept of homogenized continuum finite element model was applied to the infill pattern to speed up the process of simulation which produced orthotropic properties. The tensile test was used to validate the FEA simulation results and to obtain the mechanical properties of the polylactic acid (PLA) material used in the simulation while the bend test was utilized for validating the homogenized 3D printed sample. These concepts were combined to be able to produce an FEA model of a turbine blade with varying lattice structures while significantly reducing simulation time.
3. Methodology
3.1. PLA Material Properties
Polylactic acid (PLA) plastic was chosen as the material for this study due to its price and availability. The material properties of 3D printed PLA were determined using ASTM D638-16 type V standard (Table 2, Figure 4) from the tensile test for simulating the elastic behavior of the PLA material [33]. The printed specimens were subjected to post-processing to refine their edges. The specimens were printed on a 45-degree angle with respect to the loading axis since it was an effective estimate of the anisotropy and material property of 3D printed plastics [34]. The specimens were then set up on the Instron 3366 electronic universal material testing machine for tensile testing (Figure 5). Based on the experimental results, the elastic modulus of the PLA material was calculated and used as a reference for validating a simulated PLA sample.
The simulation of the tensile test was then created using ANSYS static structural simulation, in which the CAD model of the specimen (Figure 6a) was given the PLA material properties from the experimental results and boundary conditions to simulate the necessary tensile loads. The simulation was limited to the elastic response of the model. The elastic modulus of PLA was fitted with the experimental data and was found to be 577.11 MPa. The comparison of tensile test and simulation results for the stress–strain curves of the 3D printed PLA samples were compared (Figure 6b). It was found that the simulated tensile stress–strain curve followed the trend of the experimental data quite well; the proposed model for 3D printed PLA can describe the tensile stress–strain behavior with good accuracy.
3.2. Lattice Core Design
The lattice core designs were based on the triangle infill and hexagonal infill since the triangle infill pattern yielded the highest mechanical strength while the hexagonal had the highest elastic modulus [13,20]. The design specifications for the infill patterns were calculated using Li’s method for designing 3D printed lattices [35]. The design was constrained to have 0.8 mm wall width and the relative density of the lattice structures was fixed to 15%, since it was recommended that the relative density of the lattice structures be 10–20% in maximizing the stiffness-to-mass ratio [18]. From the constraints, it was calculated that the side length of the triangle for the triangle infill was 7 mm while the hexagon had a side length of 4 mm. To determine the optimal lattice unit-cell configuration for the bending performance of 3D printed PLA infill pattern, eight sandwich models (Figure 7) with varying lattice orientations were prepared. The sample specimens were designed according to the ASTM C393 standards [36].
3.3. Lattice Sample Preparation and Mechanical Testing
For each of the tests conducted, three samples were prepared for each sandwich model. They were 3D printed with the same printer and filament used in the tensile tests. The Instron 3366 electronic universal testing machine (UTM) was then set up with the configuration specified by ASTM C393-16 test standards (Figure 8) and Instron software to gather the necessary data from the experiment. A clamp velocity of 5 mm/min in the downward direction was used in the bending test to avoid the viscoelastic response of the plastic material. The results were recorded for validating the infill via behavioral bending which was based on Xia Zhou and their group’s research; their simulated results had good correlation with their experimental results which were the foundation for simulating other infill patterns [25].
3.4. Bend Test Simulation and Homogenization Validation
To ease the computational process of simulating infill patterns for the turbine blade, the best lattice core design was homogenized as a representative volume element (RVE) for application to models with large volume [24]. ANSYS Material Designer was utilized to make the RVE of the chosen infill pattern. The mesh sizes used in the homogenization of the hexagonal lattice structure were successively refined for convergence. Based on the outputs of the Material Designer in ANSYS, the resulting mechanical properties have converged under the 0.5 mm mesh size within 5% error. The ASTM C393-16 sandwich model was simulated in ANSYS and was given the constant PLA material properties. The orthotropic results of the RVE were applied as material properties to the infill of the ASTM C393 model to make a homogenized model of the sandwich. Various mesh sizes were tested for the sandwich infill for mesh independence. It was subjected to the same bend test setup by applying the same load and specifications taken from the bend test experiment. A fixed support was applied to the contact region between the right pin and the beam, remote displacement was applied to the pins, and load was applied on the upper pin. The load vs. displacement data from the bend test simulation were recorded.
The CAD model of the chosen infill pattern was also subjected to the simulated bend test. (Figure 9). A fixed support was applied on the contact region between the right pin and the beam, remote displacement was applied to the pins, and load was applied on the upper pin. This led to three datasets for the bend test: the experimental bend results, CAD model results, and the homogenized CAD model results. The three datasets were compared to validate the results of calculated homogenization and simulation properties [24,25].
3.5. Turbine Blade Models and Simulation Setup
After obtaining the homogenized properties, it was implemented into the proposed blade design by Danao et al. [26] with the specifications stated (Table 3). The rotor design of their study had a good overall coefficient of performance at 0.44–0.45 at a tip speed ratio of 6.
The turbine blade design was simulated with the same boundary conditions as the study of Danao et al. [26]. A fixed support was applied to the blade root of the turbine blade and remote forces, which intersected the axis of twist, were applied on the cross-sections of the blade (Figure 10). The remote forces used on each section of the blade were derived from the tangential and normal forces computed using the blade force data of the BEM simulation (Table 4). The forces used were the load experienced by the blade at 2 m/s fluid speed. In addition to that, a rotational velocity of 6 rad/s was imposed to introduce the centrifugal effects in the simulation. The turbine blade should not exceed a maximum deflection of 10% of the blade span which was 0.16 m.
Three models representing the turbine blade design were created using the coordinate of each of the section’s hydrofoil and using the loft function to seamlessly connect each section to the adjacent ones to produce a continuous blade surface. These models were the solid blade model, shell-spar model, and the shell–infill model.
The first blade model, the solid blade model, was designed to have no space within the shell (Figure 11). It was a preliminary model that served as the basis of the suitability of the material used in the blade design to determine the minimum possible deflection of the material used. With the simulation of this model, it was found that PLA was not a suitable material for turbine blade design due to blade tip deflections exceeding 10% of the blade length.
The second model, shell-spar model, was created with a shell of the turbine blade and a spar (Figure 12) based on the original design. The original design used in the numerical simulations of Danao et al. [26] had a constant shell thickness of 2% of the highest chord length while the spar thickness was 8% of the highest chord length. Adjustments were made to the thickness of the shell to accommodate for the material used for simulating the blade loads. The final design iteration of the shell-spar blade was chosen on the criteria of a maximum blade tip deflection that was less than 0.16 m or 10% of the blade length. The maximum stress was calculated from the simulation of the shell-spar model.
The third model, the shell–infill model, was created with a shell of the turbine blade and was filled with an infill (Figure 13). The shell and infill dimensions were specified based on the volume of the second model. The volume of the third model was set to have an equal material volume with the second model to compare the effects of the infill pattern to the blade model; using the same amount of material, the differences in the geometry was expected to affect the structural behavior of the blade. The dimensions of the final shell–infill model were calculated iteratively and verified by inspecting the volume of both CAD models. Additionally, the maximum stress was calculated from the simulation.
3.6. Replacement of PLA with Carbon Fiber with Onyx Base
It was found that PLA material was not suitable for the loadings specified in the previous section. It was replaced with carbon fiber with an onyx base taken from the composite material data sheet from Markforged [37].
The onyx base is a material with a high quality surface finish, chemical resistivity, and heat tolerance while the carbon fiber reinforcement has a high strength-to-weight ratio and was used to replace material that used machined aluminum (Table 5). Together, the materials formed a composite with the Markforged 3D printer which could be laid on the printing platform together; this resulted in the carbon fiber being parallel to the build plate [37]. The solid blade model was simulated with the new material and yielded a result that was lower than 10% of the blade length.
3.7. Turbine Blade Infill Orientation
The infill has orthotropic properties which could affect the structural performance of the turbine blade based on its orientation. The orientation of the homogenized infill of the shell–infill blade model was set with respect to the horizontal (Figure 14). A variation study of infill orientation was conducted to investigate the effects of infill orientation relative to the blade. A unique global coordinate system for the infill body was created to rotate the infill. The infill body was then rotated along the y-axis of the global coordinate system created. Afterwards, the blade was subjected to the same blade loading conditions. The blade tip deflection was observed from −15° to 25° infill orientation. The zero degree orientation is shown in Figure 15.
4. Results and Discussion
4.1. Infill Pattern Selection
The experimental data from the bend tests were extracted from the Instron software and post-processed. The load-deflection curves from the bend tests, of the triangle and hexagonal infills with each having four different configurations, are plotted in Figure 16. These experimental data were the basis for the selection of the optimal infill configuration that was applied to the tidal turbine blade.
Based on these plots, the infill pattern and configuration that has the highest yield point was the in-plane hexagonal infill, oriented 90 degrees from the horizontal. Similar findings were found by Harpool’s study where the hexagonal infill configuration was proven to have superior characteristics in terms of high ultimate strength [12]. The in-plane direction of the infill was also supported by Eryildiz [21], reasoning that the strut joints of hexagonal infills contribute to the strength of the infill. Furthermore, the slight difference in performance of 0° and 90° oriented hexagonal infills can be related to the aspect ratio and orientation of the lattice core. Since the in-plane hexagonal infill (90-degree orientation) has the highest yield point, it was used as the basis for simulating the infill pattern.
A notable behavior in the load-displacement curve can be observed, particularly in Figure 16a, where there is an apparent fluctuation in the value of the load following the increase in displacement. This is the result of the layer-by-layer failure of the lattice structure, which results in a significant drop in load during the crushing of a particular layer. After the localized failure, the structure behaves as one elastic beam again, thus showing a gradual increase in the load as displacement increases.
4.2. Homogenized PLA Lattice
The RVE of the chosen hexagonal infill was designed in Material Designer from ANSYS with the following hexagonal pattern parameters: side length of 4 mm, an infill thickness of 0.8 mm, and relative density of 15%. The thickness of the infill was oriented perpendicular to the Z axis while two sides of the hexagon were oriented perpendicular to the X axis.
From the homogenized results, it was observed that the highest Young’s modulus was oriented in the Z direction while the moduli in the X and Y directions were approximately equal (Table 6). In essence, enough bearing load must be applied along the Z-axis to counter the maximum modulus. This agreed with the results of the flexure tests, as hexagonal infills oriented in-plane demonstrated a stiffer behavior than infills oriented out-of-plane.
4.3. Validation Study of Homogenized Lattice Structure
The simulations performed were limited to the elastic behavior of the bend tests since the experimental data of the material were also limited to the elastic behavior of the PLA. In consideration of the blade performance, it was crucial for the turbine blade to deform within the elastic region given that any plastic deformation of the turbine blade would gravely affect its hydrodynamic performance. A study by Park, S. [38] stated that a deformation of about 14 percent of the blade length decreased the power coefficient of the blade by 1.9%, which is important for accurate power predictions at the off-design stage. For this reason, the plasticity of the material was out of the scope of this research.
The elastic region of the bend test was plotted against each other and compared. The homogenized CAD model were simulated in three mesh sizes: default mesh size, 2 mm and 3 mm element size. The mesh independence study demonstrated that the homogenized properties converged at the default mesh size. Based on the plot in Figure 17, the CAD model and the homogenized CAD model results were almost identical, meaning that the FEA simulations were conclusive on their own. Simulations were validated and solidified by experimental results; however, the experimental load-deflection curve appears to be slightly deviated from the lattice and homogenized simulation load-deflection curve in Figure 17.
As can be seen from Figure 17, the convergence of results occurred in the default size of mesh. The standard deviation of the experimental, default size (0.5 mm), and 3 mm size mesh bend test was 449.79, 287.21, and 270.81. Hence, the standard deviation percentage difference of the experimental bend test with the default size and 3 mm size is 36.14% and 39.79%, respectively. The deviation was believed to be associated to the inconsistencies of AM, anisotropy, porosity and imperfections attributed to the 3D printed sandwich models, and the limitations of the splicing program used. These aspects affect the accuracy of the volume fraction and distribution of printed materials that directly contribute to the deflection behavior of the sandwich models [35]. The deviation was also believed to be associated to the lack of the elasto-mechanical constitutive characteristics of the 3D printed PLA materials which may be obtained using the Modified Mazars damage model that Zhou employed in his study [25].
Despite the slight deviation, the plot of the load–extension curves from the different modes were comparable. This showed that the developed FEA simulations for homogenization could be used to describe the linear elastic behavior of the sandwich structure in three-point bending tests with reasonable accuracy.
4.4. 3D Printing Material Replacement
A solid model of the tidal turbine blade was simulated with the PLA material and loading condition based on the research of Danao et al. [26]. From Figure 18, the computed maximum deflection occurred at the tip of the blade. The reported deflection was larger than the blade span itself apart from the fact that the solution did not converge. PLA was not suitable for the blade loading conditions subjected to it.
The carbon fiber with onyx base was chosen to replace PLA for the simulation of the tidal turbine blade. The Young’s modulus of the new material was 60 GPa while its Poisson’s ratio was 0.3061 [37]. The homogenization process was conducted again with the same geometric specifications of the hexagonal infill pattern that were used from the PLA setup. Table 7 shows the homogenized properties of the carbon fiber lattice.
The material had the highest values for the Young’s modulus in the Z direction, a low Poisson’s ratio on both the YZ and XZ direction, and high shear modulus also in the YZ and XZ direction. The results from the homogenized properties were in line with the results from the actual bending test of the beam where the material deformation has the lowest values in the in-plane orientations. The Z axis of the of the homogenized infill was the basis of the orientation of the infill in the turbine blade since it was the axis that had the highest value of the modulus of elasticity.
4.5. Turbine Blade Models Using Carbon Fiber with Onyx Base
In this section, the carbon fiber with onyx base material properties and homogenized properties were used for the blade shell and infill, respectively. A similar simulation setup was adopted from the previous PLA simulations performed. In Figure 19, the deformation of the solid blade model was reported to be 148.61 mm; this served as the minimum tip deflection that a carbon fiber with onyx base turbine can achieve.
The FEA results from the iterations of blade shell thickness for the shell-spar model are summarized in Table 8 which were based on the maximum chord length (MCL) of the blade. These simulations were conducted to determine the tip deflection for the corresponding blade thickness. The spar thickness used in all the shell-spar models was equal to 8% MCL (20 mm).
The original design for the shell-spar model has a tip deflection of 188.52 mm which was greater than the recommended tip deflection for tidal turbine blades. From several iterations, the final shell-spar model was set to a shell thickness equal to 3.5% of the maximum chord length. It had a deformation of 9.719375% which was less than 10% of the total length of the blade (Figure 20), and it became the basis for the geometric specification of the turbine blade with the homogenized infill by adjusting the shell thickness and homogenized infill volume of the turbine blade. The volume of the turbine blade shell-spar model with 3.5% MCL (7.5 mm) shell thickness was matched with the volume of the turbine blade with the homogenized infill. The resulting deformation of the shell–infill model was observed to be 9.720625% of the span (Figure 21), still well within 10% of the blade length.
The maximum stress for the shell-spar model was found to be 166.96 MPa (Figure 22) while the maximum stress for the shell–infill model was found to be 170.3 MPa (Figure 23). Both maximum stresses were located a third of the blade span with respect to the blade root which was similar to the results of Danao et al. [26], and the locations of the maximum stresses were attributed to the rapid change in blade thickness [26]. The maximum stress value was well within the tensile strength (760 MPa) and flexural strength of the material (540 MPa). This meant that the turbine blade would not fail under the given loads. The datasheet lacked a value for the yield point and thus it was inconclusive if the stress was still within the elastic region.
Based on the deflection along Z axis results and the equivalent stress results, the use of homogenized infill pattern can be used as an alternative to the spar cross-section of the blade due to the 0.00125% difference in the deflection and 2% difference in the maximum stress values.
4.6. Homogenized Infill Orientation
From the results of the infill orientation simulations, a dip in the deflection values was seen in the 0-degree infill orientation demonstrated in Figure 24a. At first glance, there was no discernable trend in varying the orientation of the infill pattern with respect to the horizontal. However, the variation of the deflection results relative to the blade span was minuscule, which ranges from 9.721–10.18%, that can easily be observed in Figure 24b. There is only a 0.46% difference between the maximum and the minimum value of the deflections for the different orientations.
The results are not sufficient to say that the 0-degree orientation was the most optimal orientation to achieve the lowest tip deflection. This was attributed to the complex geometry of the turbine blade model. The default orientation (0-degree) of the infill pattern was the best configuration of the different infill angles. Assuming that the turbine blade was a simple beam with the blade span parallel to the length of the beam, the 0-degree orientation of the blade has a flatwise configuration defined in the study of Rajkumar. By rotating the blade with respect to the y-axis, it approached an edgewise configuration which had the lowest stiffness. The findings of Rajkumar’s study corresponded to the results of this study; as the infill orientation was rotated away from the flatwise configuration, the blade experienced lower modulus of elasticity and flexural strength [23].
5. Conclusions
This study addressed the knowledge gap of applying additive manufacturing to horizontal axis tidal turbines (HATT) through a numerical approach. The structural influence of infill patterns on tidal turbine blade designs was investigated which proved the viability of integrating infill patterns in tidal turbine blades as an alternative to the traditional design which was characterized by the blade shell and spar model.
Out of a selection of infills, the optimal infill pattern determined through the experiment was in-plane hexagonal infill, oriented 90° from the horizontal. The homogenized properties of the in-plane hexagonal infill (90°) impregnated with 3D printed materials were modeled and validated through finite element modelling and ASTM C393 bend test results. The slight deviations that occurred between the experimental results and the homogenization simulations were associated to the discrepancies of the simulation model and the 3D printed parts that were prone to anisotropy, porosity and imperfections. Despite these, the homogenized properties were in accordance with the experimental results and can be used with reasonable accuracy. The validated homogenized properties were then utilized in the static structural analysis of the tidal turbine blades with infill.
The initial findings of the FEA simulations showed that PLA was not qualified to be used in tidal turbine blades as it exceeded the blade deflection limit. The material was replaced with carbon fiber with onyx base which has significantly higher modulus of elasticity than PLA. The difference in the deflection between the homogenized infill and the spar cross-section was 0.00125% with a maximum stress of 170.3 MPa which was within tensile strength and flexure strength of the carbon fiber with onyx base material. This meant that the turbine blade would not fracture under the loading conditions. Due to the application of homogenized lattice structure, it is conclusive that the homogenized infill was considered as an alternative to the spar cross-section.
The variation study for the infill orientation revealed that the 0 degrees with respect to the horizontal orientation was the best infill orientation, resulting in the lowest deflection. Owing to the lack of observed trend among the infill orientation tested, it was not conclusive if the 0-degree configuration was the absolute optimal infill orientation.
Author Contributions
Conceptualization, G.M.G., K.A.M.O., F.R.G.T., L.A.M.D. and B.E.A.; methodology, G.M.G., K.A.M.O., F.R.G.T., L.A.M.D. and B.E.A.; software, G.M.G., K.A.M.O. and F.R.G.T.; validation, G.M.G., K.A.M.O. and F.R.G.T.; formal analysis, G.M.G., K.A.M.O., F.R.G.T. and B.E.A.; writing—original draft, G.M.G., K.A.M.O. and F.R.G.T.; writing—review and editing, L.A.M.D. and B.E.A.; visualization, G.M.G., K.A.M.O. and F.R.G.T.; supervision, L.A.M.D. and B.E.A.; funding acquisition, L.A.M.D. and B.E.A. All authors have read and agreed to the published version of the manuscript.
Funding
The APC was funded by the Department of Science and Technology through the Engineering Research and Development for Technology Program.
Institutional Review Board Statement
Not applicable.
Informed Consent Statement
Not applicable.
Data Availability Statement
Not applicable.
Conflicts of Interest
The authors declare no conflict of interest.
Nomenclature
| 3D | three dimensional |
| HAWT | horizontal axis wind turbine |
| AM | additive manufacturing |
| LOM | laminated object manufacturing |
| ASTM | American Society for Testing and Materials |
| MCL | maximum chord length |
| BEM | blade element momentum |
| PLA | polylactic acid |
| CAD | computer aided design |
| RVE | representative volume element |
| FDM | fused deposition modelling |
| SLA | stereolithography |
| FEA | finite element analysis |
| SLS | selective laser sintering |
| FEM | finite element method |
| UTM | universal testing machine |
| HATT | horizontal axis tidal turbine |
| UV | ultraviolet |
References
- Department of Energy. National Renewable Energy Program. Republic of the Philippines—Department of Energy. 2017. Available online: https://doe.gov.ph/national-renewable-energy-program (accessed on 24 April 2022).
- ISO/ASTM 52900:2021. 2021. Available online: https://www.iso.org/obp/ui/#iso:std:iso-astm:52900:ed-2:v1:en:ref:4 (accessed on 20 October 2021).
- Rouway, M.; Nachtane, M.; Tarfaoui, M.; Chakhchaoui, N.; Omari, L.E.H.; Fraija, F.; Cherkaoui, O. 3D printing: Rapid manufacturing of a new small-scale tidal turbine blade. Int. J. Adv. Manuf. Technol. 2021, 115, 61–76. [Google Scholar] [CrossRef]
- Pereira, T.; Kennedy, J.V.; Potgieter, J. A comparison of traditional manufacturing vs additive manufacturing, the best method for the job. Procedia Manuf. 2019, 30, 11–18. [Google Scholar] [CrossRef]
- Kumar, M.B.; Sathiya, P. Methods and materials for additive manufacturing: A critical review on advancements and challenges. Thin-Walled Struct. 2020, 159, 107228. [Google Scholar] [CrossRef]
- Abdulhameed, O.; Al-Ahmari, A.; Ameen, W.; Mian, S.H. Additive manufacturing: Challenges, trends, and applications. Adv. Mech. Eng. 2019, 11, 1687814018822880. [Google Scholar]
- Gibson, I.; Rosen, D.W.; Stucker, B. Development of additive manufacturing technologies. In Additive Manufacturing Technologies: Rapid Prototyping to Direct Digital Manufacturing; Springer: Berlin/Heidelberg, Germany, 2021; pp. 17–40. [Google Scholar]
- Bikas, H.; Stavropoulos, P.; Chryssolouris, G. Additive manufacturing methods and modelling approaches: A critical review. Int. J. Adv. Manuf. Technol. 2016, 83, 389–405. [Google Scholar] [CrossRef] [Green Version]
- Fernández, V.; García, A.; Camacho, A.M.; Claver, J.; Rodríguez, A.; Sebastián, M.A. Methodology to estimate the modulus of elasticity of parts manufactured by FFF/FDM combining finite element simulations and experimental tests. IOP Conf. Series: Mater. Sci. Eng. 2021, 1193, 012103. [Google Scholar] [CrossRef]
- Kalyani, K.; Shafee, S.; Rajasri, A.; SaiManichandra, V. Examination of Aerofoil Blade Fabricated by Additive Manufacturing Process. Int. J. Recent Technol. Eng. 2019, 2S11, 1–3. [Google Scholar]
- Kim, S.; Chen, X.; Dreifus, G.; Lindahl, J.; Kang, I.; Kim, J.H.; Selim, M.; Nuttall, D.; Messing, A.; Nycz, A.; et al. An Integrated Design Approach for Infill Patterning of Fused Deposition Modeling Ang Its Application to an Airfoil; Oak Ridge National Lab. (ORNL): Oak Ridge, TN, USA, 2017; pp. 2–5. [Google Scholar]
- Harpool, T.D. Observing the Effect of Infill Shapes on the Tensile Characteristics of 3D Printed Plastic Parts. Master’s Thesis, Wichita State University, Wichita, KS, USA, 2016; pp. 64–77. [Google Scholar]
- Cho, E.; Hein, H.; Lynn, Z.; Hla, S.; Tran, T. Investigation on Influence of Infill Pattern and Layer Thickness on Mechanical Strength of PLA Material in 3D Printing Technology. J. Eng. Sci. Res. 2019, 3, 27–37. [Google Scholar] [CrossRef]
- Luzanin, O.; Movrin, D.; Plancak, M. Effect of layer thickness, deposition angle, and infill on maximum flexural force in FDM-built specimens. J. Technol. Plast. 2014, 39, 52–56. [Google Scholar]
- Gurrala, P.K.; Regalla, S.P. Multi-objective optimisation of strength and volumetric shrinkage of FDM parts. Virtual Phys. Prototyp. 2014, 9, 127–138. [Google Scholar] [CrossRef]
- Álvarez, K.; Lagos, R.F.; Aizpun, M. Investigating the influence of infill percentage on the mechanical properties of fused deposition modelled ABS parts. Ing. E Investig. 2016, 36, 110. [Google Scholar] [CrossRef] [Green Version]
- Dudescu, C.; Racz, L. Effects of Raster Orientation, Infill Rate and Infill Pattern on the Mechanical Properties of 3D Printed Materials. Acta Univ. Cibiniensis 2017, 69, 23–30. [Google Scholar] [CrossRef] [Green Version]
- Porter, J.H.; Cain, T.M.; Fox, S.L.; Harvey, P.S. Influence of infill properties on flexural rigidity of 3D-printed structural members. Virtual Phys. Prototyp. 2018, 14, 148–159. [Google Scholar] [CrossRef]
- Adams, D.; Turner, C.J. An implicit slicing method for additive manufacturing processes. Virtual Phys. Prototyp. 2017, 13, 2–7. [Google Scholar] [CrossRef]
- XZhou, X.; Hsieh, S.-J.; Ting, C.-C. Modelling and estimation of tensile behaviour of polylactic acid parts manufactured by fused deposition modelling using finite element analysis and knowledge-based library. Virtual Phys. Prototyp. 2018, 13, 177–190. [Google Scholar] [CrossRef]
- Eryildiz, M. The effects of infill patterns on the mechanical properties of 3D printed PLA parts fabricated by FDM. Ukr. J. Mech. Eng. Mater. Sci. 2021, 7, 1–8. [Google Scholar] [CrossRef]
- Kim, S.; Dreifus, G.; Beard, B.; Glick, A.; Messing, A.; Hassen, A.A.; Lindahl, J.; Liu, P.; Smith, T.C.; Failla, J.; et al. Graded Infill Structure of Wind Turbine Blade Core Accounting For Internal Stress in Big Area Additive Manufacturing. In Proceedings of the CAMX Composite and Advanced Materials Expo, Dallas, TX, USA, 15–18 October 2018; pp. 5–6. [Google Scholar]
- Tanveer, Q.; Mishra, G.; Mishra, S.; Sharma, R. Effect of infill pattern and infill density on mechanical behaviour of FDM 3D printed Parts-a current review. Mater. Today: Proc. 2022, 62, 100–108. [Google Scholar] [CrossRef]
- Bhandari, S.; Lopez-Anido, R. Finite element modeling of 3D-printed part with cellular internal structure using homogenized properties. Prog. Addit. Manuf. 2018, 4, 143–154. [Google Scholar] [CrossRef]
- Zhou, X.; Li, J.; Qu, C.; Bu, W.; Liu, Z.; Fan, Y.; Bao, G. Bending behavior of hybrid sandwich composite structures containing 3D printed PLA lattice cores and magnesium alloy face sheets. J. Adhes. 2021, 98, 1–19. [Google Scholar] [CrossRef]
- Danao, L.; Abuan, B.; Howell, R. Design Analysis of a Horizontal Axis Tidal Turbine. In Proceedings of the Asian Wave and Tidal Conference 2016, Singapore, 24–28 October 2016; pp. 4–7. [Google Scholar]
- Malhotra, P.; Hyers, R.W.; Manwell, J.F.; McGowan, J.G. A review and Design Study of blade testing systems for Utitulity-scale wind turbines. Renew. Sustain. Energy 2012, 16, 284–292. [Google Scholar] [CrossRef]
- Kong, C.; Sugiyama, Y.; Lee, J.; Soutis, C. Full Scale Structural Experimental Investigation of an E-glass/ Epoxy Composite Wind Turbine Blade. Adv. Compos. Lett. 2002, 11, 096369350201100502. [Google Scholar] [CrossRef] [Green Version]
- Mishnaevsky, L.; Branner, K.; Petersen, H.N.; Beauson, J.; McGugan, M.; Sorensen, B.F. Materials for Wind Turbine: An overview. Materials 2017, 10, 1285. [Google Scholar] [CrossRef] [PubMed] [Green Version]
- Bahaj, A.S.; Batten, W.M.J.; McCann, G. Experimental verifications of numerical predictions for the hydrodynamic performance of horizontal axis marine current turbines. Renew. Energy 2007, 32, 2479–2490. [Google Scholar] [CrossRef]
- Noronha, N.; Munishamaiah, K. Design and analysis of micro horizontal wind turbine using MATLAB and Qblade. Int. J. Adv. Sci. Technol. 2020, 29, 8881–8882. [Google Scholar]
- Bassett, K.; Carriveau, R.; Ting, D.-K. 3D printed wind turbines part 1: Design considerations and rapid manufacture potential. Sustain. Energy Technol. Assessments 2015, 11, 186–193. [Google Scholar] [CrossRef]
- D638-14; Standard Test Method for Tensile Properties of Plastics. ASTM: West Conshohocken, PA, USA, 2020.
- Sarvestani, H.Y.; Akbarzadeh, A.; Niknam, H.; Hermenean, K. 3D printed architected polymeric sandwich panels: Energy absorption and structural performance. Compos. Struct. 2018, 200, 886–909. [Google Scholar] [CrossRef]
- Li, T.; Wang, L. Bending behavior of sandwich composite structures with tunable 3D-printed core materials. Compos. Struct. 2017, 175, 46–57. [Google Scholar] [CrossRef]
- C393/C393M-16; Standard Test Method for Flexural Properties of Sandwich Constructions. ASTM: West Conshohocken, PA, USA, 2016.
- Markforged. Material Data Sheet Composites. In Carbon Fiber with Onyx Base Data Sheet, pg 2, REV 5.0; Markforged, Inc.: Watertown, MA, USA, 2021; Available online: https://static.markforged.com/downloads/composites-data-sheet.pdf (accessed on 26 December 2022).
- Park, S.; Park, S.; Rhee, S. Influence of Blade Deformation and Yawed inflow on performance of a horizontal axis tidal turbine blade. Renew. Energy 2016, 92, 327–331. [Google Scholar] [CrossRef]
Figure 1.
Grid infill at different infill densities.
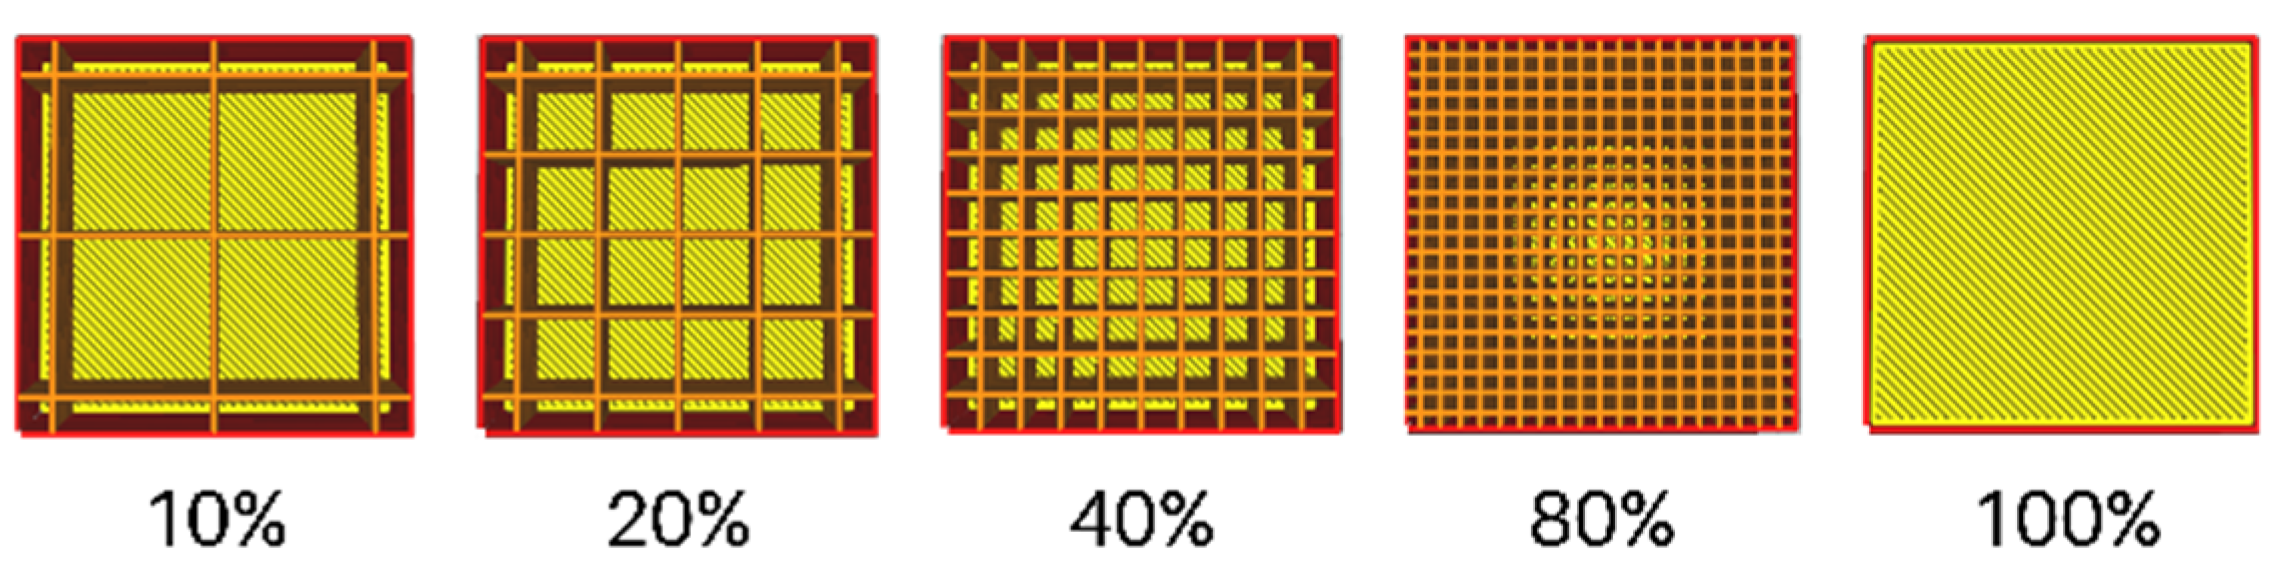
Figure 3.
BEM predicted power coefficient for the proposed blade design and old design adapted from [26,30].

Figure 4.
Specimen drawing: ASTMD638 type V standard [33].
Figure 4.
Specimen drawing: ASTMD638 type V standard [33].

Figure 5.
Tensile test experiment (a) before test, (b) failure after test.

Figure 6.
(a) Simulated tensile test experiment and (b) comparison of results.

Figure 7.
Sandwich models and printed samples with varying lattice structure configuration for 3-point bend test.
Figure 7.
Sandwich models and printed samples with varying lattice structure configuration for 3-point bend test.


Figure 8.
Experimental bending test setup.

Figure 9.
FEA bending test setup where point A is a pin connection to avoid rigid body motion, B and C are pin supports, E as the load pin with D as the remote force.
Figure 9.
FEA bending test setup where point A is a pin connection to avoid rigid body motion, B and C are pin supports, E as the load pin with D as the remote force.

Figure 10.
Simulation setup showing the blade with applied remote forces and fixed support.

Figure 11.
Solid blade model.

Figure 12.
Shell-Spar blade model.

Figure 13.
Shell–infill blade model.

Figure 14.
Turbine blade with infill orientation in ANSYS.

Figure 15.
Visual representation of blade turbine sections with 0-degree orientation.

Figure 16.
Load deflection curves from bend test. Triangle infill (a) out of plane, 0°, (b) out of plane, 90°, (c) in plane, 0°, (d) in plane, 90°. Hexagonal infill (e) out of plane, 0°, (f) out of plane, 90°, (g) in plane, 0°, (h) in plane, 90°.
Figure 16.
Load deflection curves from bend test. Triangle infill (a) out of plane, 0°, (b) out of plane, 90°, (c) in plane, 0°, (d) in plane, 90°. Hexagonal infill (e) out of plane, 0°, (f) out of plane, 90°, (g) in plane, 0°, (h) in plane, 90°.

Figure 17.
Load Deflection Curves from Bend Test.

Figure 18.
Solid blade model simulation with PLA.

Figure 19.
Solid blade model (carbon fiber with onyx base material).

Figure 20.
Directional deformation (mm) along the Z axis of the final shell-spar model (carbon fiber with onyx base material).
Figure 20.
Directional deformation (mm) along the Z axis of the final shell-spar model (carbon fiber with onyx base material).

Figure 21.
Directional deformation (mm) along the Z axis of shell–infill model (carbon fiber with onyx base material).
Figure 21.
Directional deformation (mm) along the Z axis of shell–infill model (carbon fiber with onyx base material).

Figure 22.
Von Mises stress (MPa) of shell-spar model (carbon fiber with onyx base material).
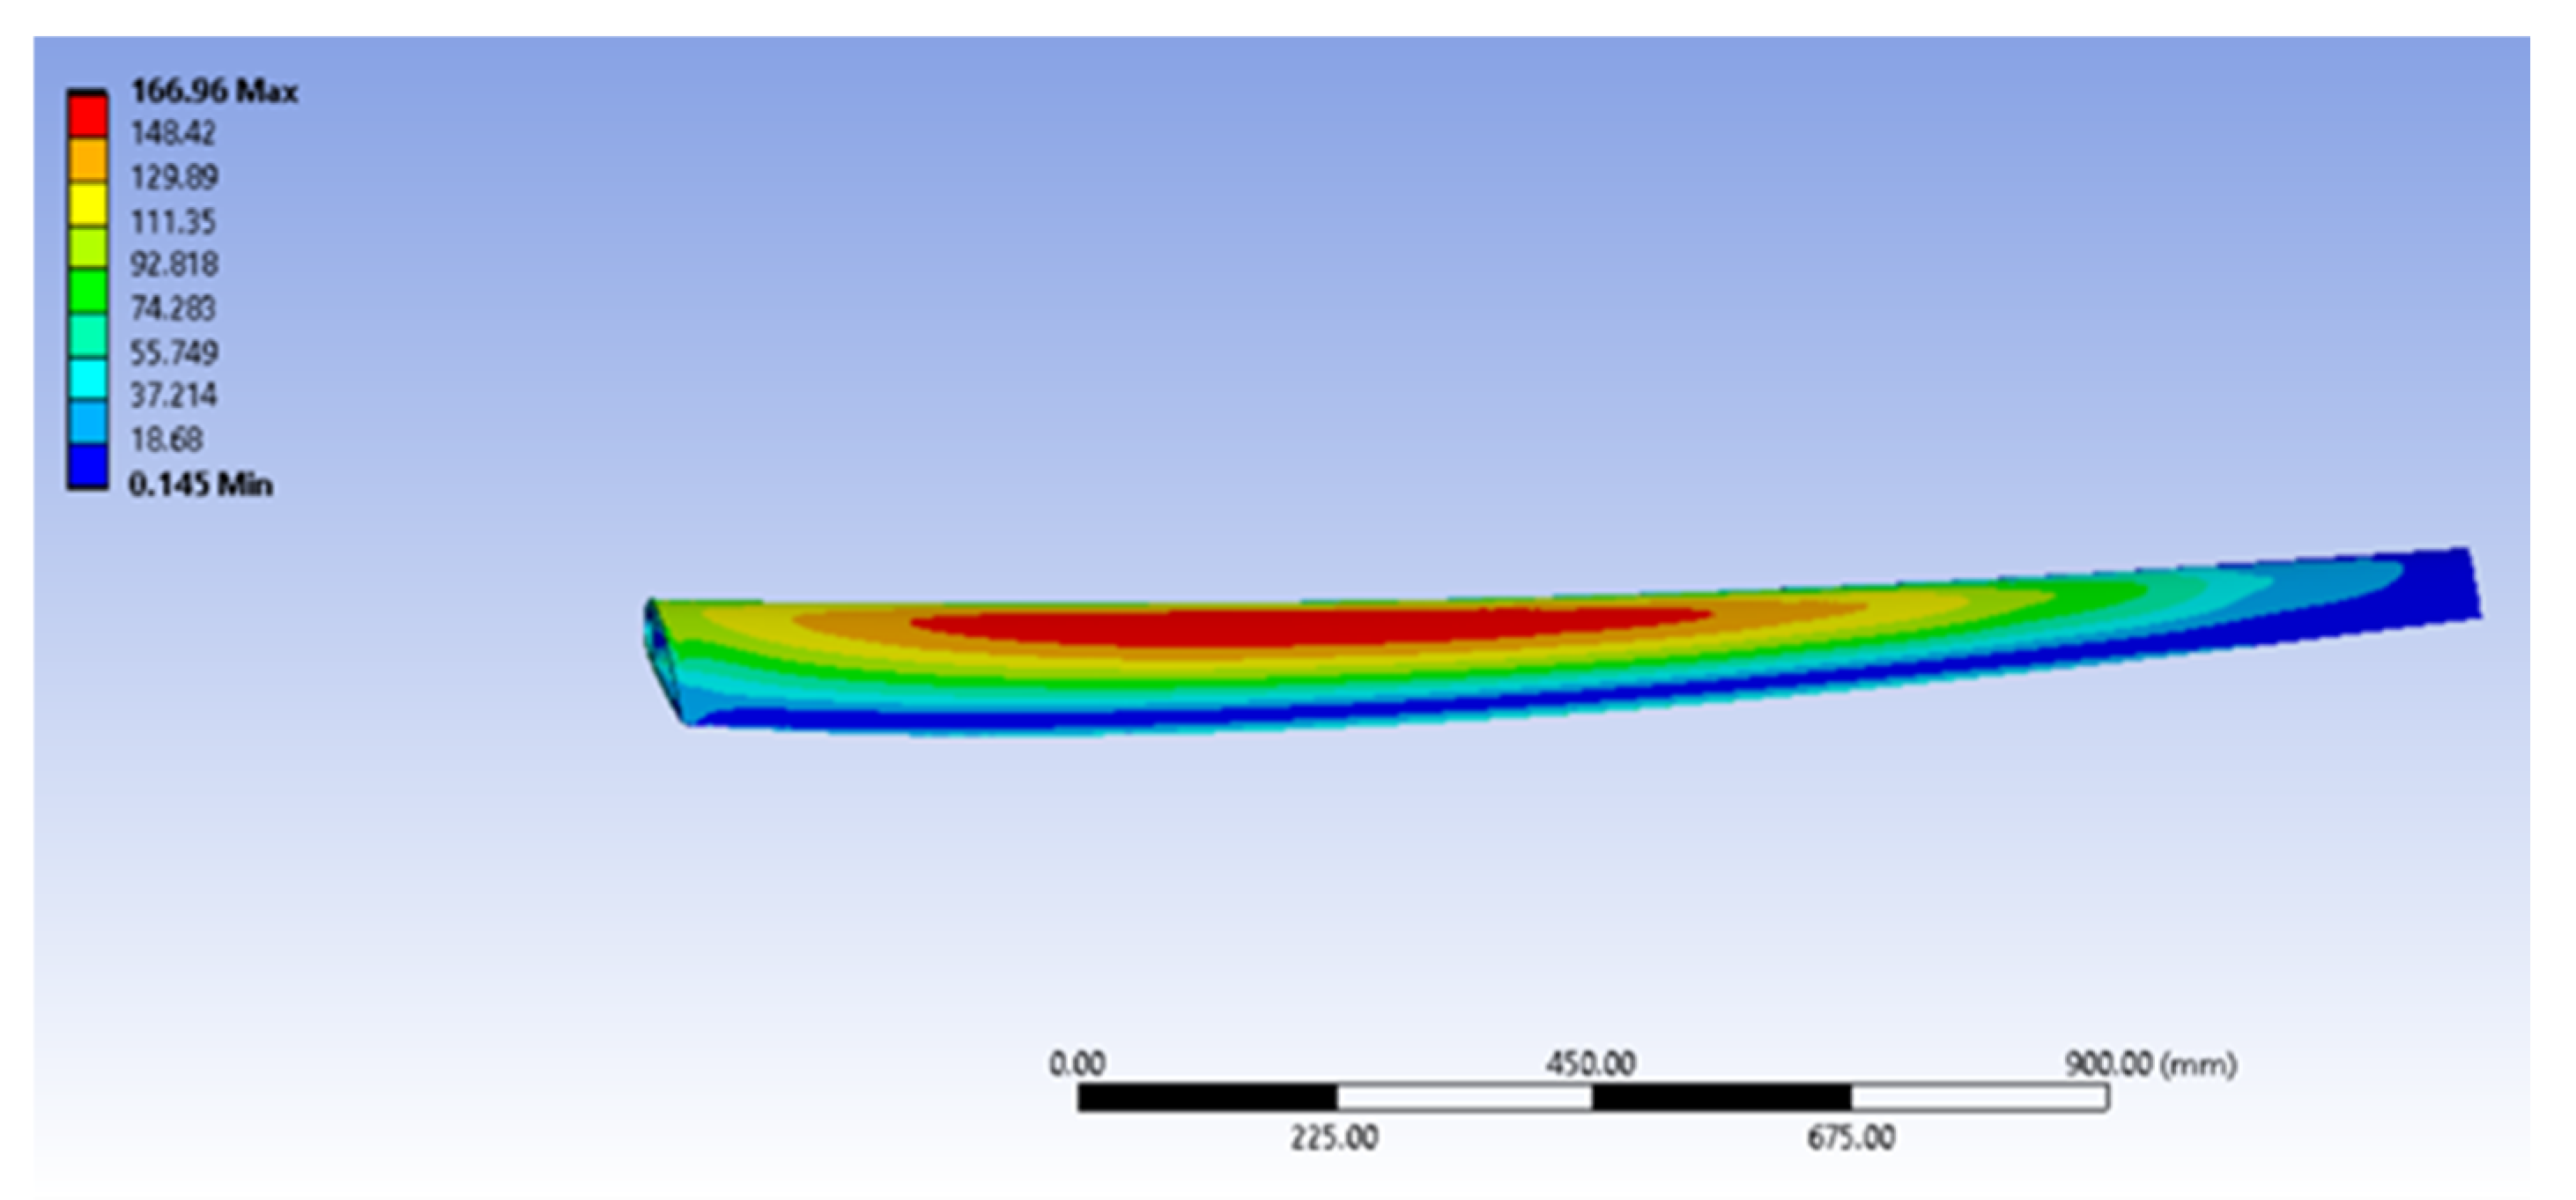
Figure 23.
Von Mises stress (MPa) of shell–infill model (carbon fiber with onyx base material).
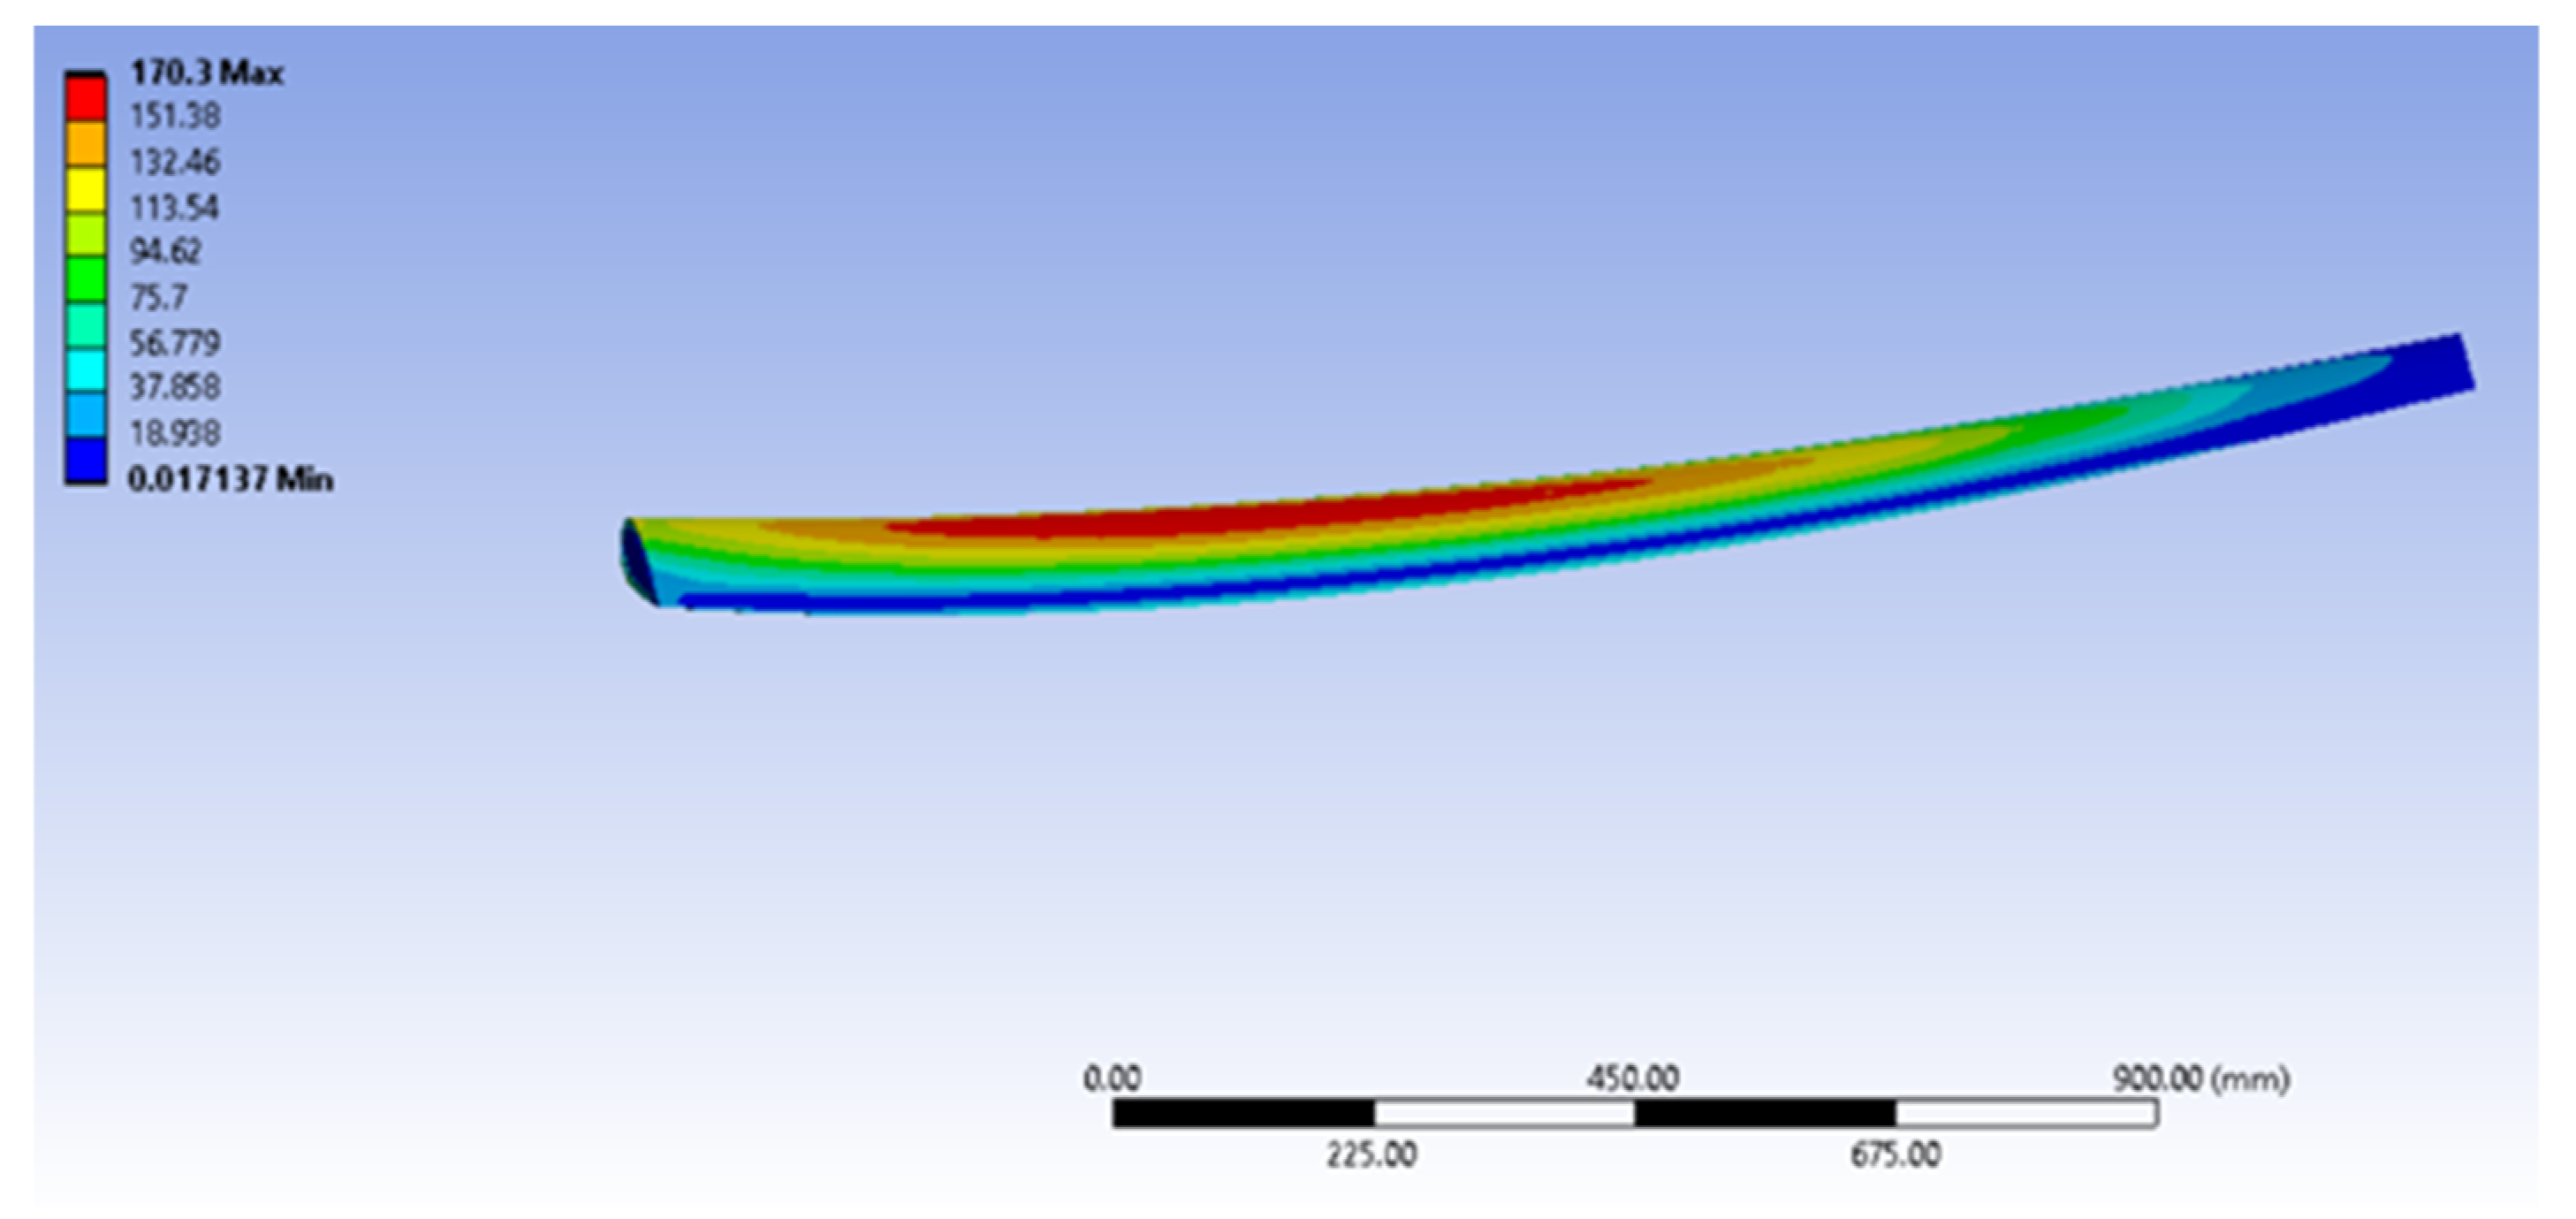
Figure 24.
Angle vs. deflection trend of the turbine blade with different infill orientations. (a) Reduced y-axis range plot and (b) enlarged y-axis range plot.
Figure 24.
Angle vs. deflection trend of the turbine blade with different infill orientations. (a) Reduced y-axis range plot and (b) enlarged y-axis range plot.


Table 1.
Reviewed literature matrix.
| Authors | HAWT/HATT | Additive Manufacturing | Infill Pattern | Flexure Testing | Simulation |
|---|---|---|---|---|---|
| Kim, S. et al. [22] | HAWT | Yes | Yes | No | Yes |
| Noronha, N. Munishamaiah, K. [31] | HAWT | No | No | No | Yes |
| Cho, P. et al. [13] | N/A | Yes | Yes | Yes | Yes |
| Kim, S. et al. [11] | N/A | Yes | Yes | Yes | Yes |
| Kalyani, K. et al. [10] | N/A | Yes | No | No | Yes |
| Bassett et al. [32] | HAWT | Yes | Yes | No | No |
| Danao et al. [26] | HATT | No | No | No | Yes |
| Bhandari, S. and Lopez-Anido, R [24] | N/A | Yes | Yes | Yes | Yes |
Table 2.
ASTMD638 type V standard.
| Dimensions | Type V (mm) | Tolerances |
|---|---|---|
| W—Width of narrow section | 3.18 | ±0.5 |
| L—Length of narrow section | 9.53 | ±0.5 |
| WO—Width overall, min | 9.53 | +3.18 |
| LO—Length overall, min | 63.5 | No max |
| G—Gage length | 7.62 | 0.25 |
| D—Distance between grips | 25.4 | ±5 |
Table 3.
Turbine blade specifications [26].
Table 3.
Turbine blade specifications [26].
| Radial Position (m) | Chord Length (m) | Twist (°) | Foil Profile |
|---|---|---|---|
| 0.4 | 0.250 | 20 | NACA 4424 |
| 0.6 | 0.2312 | 14.5 | NACA 4420 |
| 0.8 | 0.2126 | 11.1 | NACA 4418 |
| 1 | 0.1938 | 8.9 | NACA 4417 |
| 1.2 | 0.175 | 7.4 | NACA 4416 |
| 1.4 | 0.1562 | 6.5 | NACA 4415 |
| 1.6 | 0.1376 | 5.9 | NACA 4414 |
| 1.8 | 0.1188 | 5.4 | NACA 4413 |
| 2 | 0.1 | 5 | NACA 4412 |
Table 4.
Blade force data from BEM Simulation at 2 m/s flow speed adapted from [26].
Table 4.
Blade force data from BEM Simulation at 2 m/s flow speed adapted from [26].
| Radial Position (m) | Tangential Force (N) | Normal Force (N) | Resultant Force (N) |
|---|---|---|---|
| 2 | 36.072 | 418.441 | 419.933 |
| 1.8 | 121.475 | 1036.20 | 1043.30 |
| 1.6 | 142.404 | 1041.26 | 1050.95 |
| 1.4 | 151.03 | 969.055 | 980.754 |
| 1.2 | 154.613 | 860.287 | 874.07 |
| 1 | 155.63 | 724.558 | 741.084 |
| 0.8 | 151.657 | 568.066 | 587.962 |
| 0.6 | 134.533 | 393.101 | 415.485 |
| 0.4 | 40.06 | 103.387 | 110.877 |
Table 5.
Material properties of carbon fiber with onyx base [37].
Table 5.
Material properties of carbon fiber with onyx base [37].
| Property | Material Properties |
|---|---|
| Young’s modulus | 60 GPa |
| Poisson’s ratio | 0.3061 |
| Tensile strength | 760 MPa |
| Flexural strength | 540 MPa |
Table 6.
Homogenized properties of the PLA lattice.
| Property and Direction | Material Properties |
|---|---|
| Young’s Modulus X | 3.88631 MPa |
| Young’s Modulus Y | 3.88627 MPa |
| Young’s Modulus Z | 86.568 MPa |
| Poisson’s Ratio XY | 0.91915 |
| Poisson’s Ratio YZ | 0.014726 |
| Poisson’s Ratio XZ | 0.014725 |
| Shear Modulus XY | 1.0205 MPa |
| Shear Modulus YZ | 17.484 MPa |
| Shear Modulus XZ | 17.484 MPa |
Table 7.
Homogenized Properties of the Carbon Fiber lattice.
| Property and Direction | Material Properties |
|---|---|
| Young’s Modulus X | 0.37195 GPa |
| Young’s Modulus Y | 0.37199 GPa |
| Young’s Modulus Z | 9 GPa |
| Poisson’s Ratio XY | 0.92441 |
| Poisson’s Ratio YZ | 0.012399 |
| Poisson’s Ratio XZ | 0.012398 |
| Shear Modulus XY | 0.0966 GPa |
| Shear Modulus YZ | 1.8531 GPa |
| Shear Modulus XZ | 1.853 GPa |
Table 8.
Turbine blade configurations and deflection.
| Turbine Blade Model | Description | Deflection (mm) | Deflection (%) |
|---|---|---|---|
| Solid Blade model | Solid Body | 148.61 | 9.288125 |
| Shell-Spar model | 2% of MCL Shell Thickness (5 mm) | 188.52 | 11.7825 |
| Shell-Spar model | 3% of MCL Shell Thickness (7.5 mm) | 161.67 | 10.11 |
| Shell-Spar model | 3.5% of MCL (8.75 mm) | 155.51 | 9.719375 |
| Shell–infill model | 3.596% of MCL Shell Thickness (8.99 mm) + 15% Infill | 155.53 | 9.720625 |
Disclaimer/Publisher’s Note: The statements, opinions and data contained in all publications are solely those of the individual author(s) and contributor(s) and not of MDPI and/or the editor(s). MDPI and/or the editor(s) disclaim responsibility for any injury to people or property resulting from any ideas, methods, instructions or products referred to in the content. |
© 2022 by the authors. Licensee MDPI, Basel, Switzerland. This article is an open access article distributed under the terms and conditions of the Creative Commons Attribution (CC BY) license (https://creativecommons.org/licenses/by/4.0/).
Share and Cite
MDPI and ACS Style
Galvez, G.M.; Olivar, K.A.M.; Tolentino, F.R.G.; Danao, L.A.M.; Abuan, B.E. Finite Element Analysis of Different Infill Patterns for 3D Printed Tidal Turbine Blade. Sustainability 2023, 15, 713. https://doi.org/10.3390/su15010713
AMA Style
Galvez GM, Olivar KAM, Tolentino FRG, Danao LAM, Abuan BE. Finite Element Analysis of Different Infill Patterns for 3D Printed Tidal Turbine Blade. Sustainability. 2023; 15(1):713. https://doi.org/10.3390/su15010713
Chicago/Turabian StyleGalvez, Glecelyn M., Karl Andrie M. Olivar, Francis Rey G. Tolentino, Louis Angelo M. Danao, and Binoe E. Abuan. 2023. "Finite Element Analysis of Different Infill Patterns for 3D Printed Tidal Turbine Blade" Sustainability 15, no. 1: 713. https://doi.org/10.3390/su15010713
Note that from the first issue of 2016, this journal uses article numbers instead of page numbers. See further details here.