

Land Surface Temperature Variation in Response to Land Use Modes Changes: The Case of Mefou River Sub-Basin (Southern Cameroon)


1
Department of Geography, University of Yaounde 1, Yaounde P.O. Box 755, Cameroon
2
International Joint Laboratory DYCOFAC, IRGM-UY1-IRD, Yaounde P.O. Box 4110, Cameroon
Sustainability 2023, 15(1), 864; https://doi.org/10.3390/su15010864
Submission received: 31 October 2022
/
Revised: 8 December 2022
/
Accepted: 12 December 2022
/
Published: 3 January 2023
(This article belongs to the Section Sustainability in Geographic Science)
Abstract
:Land surface temperature (LST) estimation at the river sub-basin level is crucial for developing land use planning at the basin scale and beyond. The main goal of this study was to analyze LST variations in response to land use mode (LUM) changes in the Mefou River sub-basin (Southern Cameroon) using geospatial techniques. To achieve this goal, we used Landsat 7 Enhanced Thematic Mapper Plus (2000 and 2010) and Landsat 8 Operational Land Imager (OLI)/Thermal Infrared Sensor (TIRS) data for 2020. We also used air surface temperature data from the Climatic Research Unit (CRU) to validate the LST. Our results reveal that between 2000 and 2020, the Mefou watershed recorded significant changes in LUMs, which were mainly manifested by an increase in impervious areas (IAs) (buildings and roads (+10%); bare soils and farmlands (+204.9%)) and forest reduction (−31.2). This decrease in the forest was also reflected by a reduction in NDVI values, the maximum of which went from 0.47 in 2000 to 0.39 in 2020. Contrary to the forest area and the NDVI values, the LSTs of the investigated basin increased over the period studied. There is a strong negative correlation between LST and NDVI. In general, high LSTs correspond to low NDVI values. For the years 2000, 2010 and 2020, the links between these two variables are materialized by respective correlation coefficients of −0.66, −0.74 and −0.85. This study could contribute to understanding the impact of LUM changes on the local climate, and could further provide assistance to policymakers in regard to land use planning and climate change mitigation strategies.
1. Introduction
The combined effect of rapid population growth and the overexploitation of natural resources increases the problem of LUM changes [1,2,3]. Changes in LUM have been shown to significantly influence climate systems in general [4,5,6,7,8], and local climate in particular [9].
The exploitation of natural resources and increases in human activities have contributed to increases in the LST, which in turn worsen the dynamics of LUMs [4,10]. LST is determined by the types of land elements and the rate of radiated energy emitted from the ground surface [11]. LST represents the cumulative effects of LUM changes, rainfall variations, and socio-economic development [12]. Anthropogenic activities have a large share of responsibility in the deterioration of the environment. For example, the study by Gemes et al. [13] revealed that environmental degradation has been a major environmental problem since agricultural activities began [13]. In developing countries such as Cameroon, overgrazing, deforestation and unplanned human settlements are some major environmental issues that significantly affect sustainable development.
Substantial research works have been conducted by several authors [4,7], indicating the effects of LUM changes on LST. Feng et al. [4] showed that LST has been increasing and warming areas have been expanding since 1996, especially in the Su–Xi–Chang urban agglomeration. The mean LST in Su–Xi–Chang has increased from less than 30 °C in 1996 to greater than 31 °C in 2004, rising to about 33 °C in 2016. The projection suggests that LST will reach about 35 °C in 2026. Their results also suggest that mean LST increased by 2 °C per decade in this highly urbanized area between 1996 and 2026. In the study of Wang et al. [7], the LST response to LUM changes was comparatively evaluated using micrometeorological observations from a cropland site, a mixed forest site, a shrubland site, and adjacent bare land sites in the Heihe River Basin, Northwest China. The surface temperature changes were divided into contributions from changes in radiative forcing, heat resistance, evapotranspiration, soil heat flux, and air temperature based on the intrinsic biophysical mechanism (IBM) and the two-resistance mechanism (TRM). The results indicate that the IBM attribution method is more applicable than the TRM method in these arid ecosystems; the influence of different types of vegetation cover on the surface temperature exhibits temporal variance in the diurnal and seasonal time scales. The dominant biophysical components in the daytime of the growing season are evaporative cooling in the cropland paired sites and heat resistance change in the mixed forest paired sites, but these two components are both at a moderate level in the shrubland paired sites.
Although a significant number of studies have been conducted globally, knowledge related to LST in Central Africa is limited [14].
Previously, many studies [15,16] have been conducted on the impact of LUM changes on the environment in general, and on LST in particular. The majority of early studies focused on the urban center while marginalizing the rural area. Moreover, the effects of LUM changes on the LST at the sub-basin level are still unknown and require more studies. Tracking LST in response to LUM changes is crucial for informing policymakers of mitigation strategies. A clear understanding and knowledge of the impact of LUM changes on LST can be of great importance for environmental planning and management. The availability of reliable and up-to-date information on LUM changes in relation to LST is crucial for sustainable land use planning in general and microclimate change mitigation in particular. In addition, the dissemination of information on the impact of LUM changes on LST at the sub-basin level can be helpful for conservation decision-making bodies. Thus, the present study aims to quantify LST variation in response to LUM changes. The objective of this study is to evaluate the effects of LUM changes on LST in the Mefou River sub-basin for the period of 2000–2020.
2. Materials and Methods
2.1. Study Area
The study focuses on the Mefou watershed (428 km2). This basin is located in South Cameroon, within the Central African sub-region, between latitudes 3°43′ N and 3°58′ N and longitudes 11°21′ E and 11°35′ E (Figure 1). It belongs to the sub-equatorial domain, with abundant annual precipitation (around 1600 mm/year) spread over four seasons of unequal importance. Two of them are dry (summer and winter) and two are rainy (spring and autumn). The studied basins are dissected by deep gullies cut into hills with convex slopes and wide marshy valleys. Their geological substratum is made up of a granito–gneissic base on which ferralitic soils (on the summits and slopes) and hydromorphic soils (in the shallows) develop. The vegetation in the area is a dense semi-deciduous forest with Sterculiaceae and Ulmaceae, and is subject to anthropogenic pressure [17].
2.2. Data Sources
This study used Landsat 7 Enhanced Thematic Mapper Plus (2000 and 2010) and Landsat 8 Operational Land Imager (OLI)/Thermal Infrared Sensor (TIRS) data from 2020. These Landsat images were obtained from the United States Geological Survey (https://www.usgs.gov/products/data-and-tools/realtime-data/remote-land-sensing-and Landsat; accessed on 12 July 2022) during the dry season (January and December) and are cloud-free (Table 1). All data were projected to UTM (Zone 32) and WGS 84 data. The study area lies within the 185 Path and 57 Row reference system. The acquired data were used for LUM classification. The data and their sources are presented in Table 1.
The maximum and minimum air temperature data used in this study are from the CRU (Climate Research Unit) of the University of East Anglia in the United Kingdom. These data have been available since 1901 via the site https://climexp.knmi.nl/selectfield_obs2.cgi?id=2833fad3fef1bedc6761d5cba64775f0/, accessed on 12 July 2022, in NetCDF format with monthly time steps at a spatial resolution of 0.25° × 0.25°. Precipitation and temperature data from the CRU have been used to validate CMIP models in the Logone basin, which is a sub-basin of the Lake Chad basin [18].
2.3. Land Use/Land Cover Classification
Landsat images were classified using supervised maximum likelihood classification and Sentinel Application Platform (SNAP) software, which is made available to the general public for free by the European Space Agency (ESA) via the site https://step.esa.int/main/download/snap-download/, accessed on 12 July 2022. This enabled us to perform a diachronic analysis of the evolution of land-use in the studied basin. This operation was preceded by operations of preprocessing and the recognition of objects in the field by photography and GPS (global positioning system). Satellite image preprocessing refers to all the processes applied to raw data to correct geometric and radiometric errors that characterize certain satellite images. These errors are generally due to technical problems with the satellites and interactions between outgoing electromagnetic radiation and atmospheric aerosols, also called “atmospheric noise”. The atmospheric disturbances are influenced by various factors that are present on the day of acquisition, including weather, fires, and other human activities. They affect all the images acquired by passive satellites including Landsat 4-5-7 and 8. As the downloaded Landsat images were orthorectified, the preprocessing involved atmospheric correction of the images and reprojection into the local system (WGS_84_UTM_Zone_32N). For this, neo-channels were created to increase the readability of the data by enhancing certain properties that were less obvious in the original image, thus showing more clearly the elements of the scene. Three indices are therefore created, namely, the Normalized Difference Vegetation Index (NDVI, Equation (1)), the Brightness Index (BI, Equation (2)), and the Normalized Difference Water Index (NDWI, Equation (3)) [19,20]. These indices highlight vegetated surfaces and sterile (non-chlorophyllin) elements such as urban areas and water bodies, respectively. The formulae used in creating these indices are as follows:
where NIR is the ground reflectance of the surface in the near-infrared channel; R is the ground reflectance of the surface in the red channel; and MWIR is the ground reflectance of the surface in the mid-wave infrared channel. The use of Google Earth, as well as the spaces sampled from the GPS, made it possible to identify with certainty the impervious areas (buildings, savannas, bare soils, and crops), water bodies (large rivers, lakes and ponds) and forest (secondary, degraded, non-degraded and swampy) of each mosaic. Before the classification, the separability of the spectral signatures of the sampled objects to avoid interclass confusion was assessed by calculating the “transformed divergence” index. The value of this index is between 0 and 2. A value > 1.8 indicates a good separability between two given classes. The different classes used in this study show good separability between them, irrespective of the image considered, with indices > 1.9. The validation of the classifications obtained was carried out using the confusion matrix, making it possible to obtain treatment details to validate the choice of training plots. After validating the land use/land cover maps, the statistical and spatial differences of each class between the studied periods were evaluated.
2.4. LST Retrieval
LST is influenced by topography, landscape composition, land cover, urbanization, and global change [4,21]. It is affected by albedo, vegetation cover, and soil moisture [22]. The ETM + and TIRS thermal band calibration constants in this study are presented in Table 2. LST has been calculated [22] in many steps using Landsat ETM+ and the Landsat 8 Operational Land Imager.
2.4.1. Step I: Conversion of the Digital Number (DN) into Spectral Radiance (L)
In the present study, digital numbers were converted to at-sensor radiance values prior to calculating brightness temperature. The ETM + DN values range between 0 and 255 (Equation (4)).
where is the quantized calibrated pixel value in digital number (DN), is the spectral radiance that is scaled to in (Wm2ster−1μm−1), is the spectral radiance that is scaled to in (Wm2ster−1μm−1), is the minimum quantized calibrated pixel value corresponding to in DN, and is the maximum quantized calibrated pixel value corresponding to in DN = 255.
At first, digital numbers were converted from the Landsat 8 Operational Land Imager to spectral radiance, then brightness temperature was extracted from thermal remote sensing data (TRSD) [10]. In the Landsat 8 data from the radiance multiplier (ML) and radiance add (AL), the thermal infrared (TIR) band was converted into spectral radiance Lγ using the approach provided by Chander and Markhan [23] and used by Chibuike et al. [22], as indicated in (Equation (5)).
where Lγ is the top of the atmosphere spectral radiance (Wm2ster−1μm−1), is the band-specific multiplicative rescaling factor from the metadata (RADIANCE_MULT_ BAND_x, where x is the band number), is the band-specific additive rescaling factor from the metadata (RADIANCE_ ADD_BAND_x, where x is the band number) and is the quantized and calibrated standard product pixel values (DN).
2.4.2. Step II: Conversion to Brightness Temperature
Brightness temperature and average atmospheric temperature were used to calculate LST based on land surface emissivity (Chibuike et al. [22]). The specific formula for the mono-window algorithm for retrieving LST was used (Chibuike et al. [22]). The black body temperature was obtained from the spectral radiance using Plank’s inverse function. Spectral radiance values for bands 6 and 10 were converted to radiant surface temperature under assumptions of uniform emissivity using pre-launch calibration constants (Chibuike et al. [22]). The Landsat satellite images were converted from spectral radiance to a more physically useful variable. The conversion formula is presented in (Equation (6)).
where is effective at satellite temperature in Kelvin, is the calibration constant 2, is the calibration constant 1, and is the spectral radiance in Wm2ster−1 μm−1.
2.4.3. Step III: Land Surface Emissivity Estimation
The land surface emissivity estimation was performed (Chibuike et al. [22]) and computed using Equation (7).
where is the vegetation proportion obtained (Carlson and Ripley [24]) using Equation (8).
In this study, the calculated radiant surface temperature was corrected for emissivity (Chibuike et al. [22]) using Equation (9).
where is land surface temperature (in Kelvin), is the radiant surface temperature (in Kelvin), is the wavelength of emitted radiance (10.8 μm), is h∗c/σ(1.438∗10−1 mK), h is Planck’s constant (6.26∗1010–34 Js), c is the velocity of light (2.998∗108 m/s), σ is Stefan Boltzmann’s constant (1.38∗10−23 J K−1), and is land surface emissivity.
Finally, the LST results from Landsat ETM+ and OLI/TIRS in Kelvin degrees were converted into Celsius degrees by subtracting 273.15. (Equation (6)).
2.5. Analysis of Annual Maximum and Minimum Air Temperatures
The Mann–Kendall test at the 95% significance level was used to analyze the mean annual maximum and minimum air temperatures. This test is based on the test statistic “S”, defined as follows:
where xj represents the sequential data values, n is the length of the data set, and sgn = (θ) if θ > 1, 0 if θ = 0, and −1 if θ < 0. There is no significant trend in the series analyzed when the calculated p-value is above the chosen significance level.
3. Results and Discussion
3.1. Changes in Land Use Modes
A diachronic analysis of the classifications carried out from the processing of Landsat satellite images from three dates (2000, 2010 and 2020) shows a significant change in land use modes in the Mefou watershed (Figure 2). These changes are essentially reflected in an increase in IAs to the detriment of the forest towards the northwest of the basin (Figure 3). Between 2000 and 2020, buildings and bare soils increased by +10% and +204.9%, respectively (Table 3). Most of these changes occurred between 2000 and 2010. Over this interval, buildings and bare soils increased by +7.6% and +101.8%, respectively. Their increases between 2010 and 2020 were less. They are +2.3% and +51.1%, respectively (Table 3). In the case of forests and water bodies, the decreases noted are −31.2% and −14.6%, respectively (Table 3). Concerning the forest, the rates of decrease recorded between 2000 and 2010 (−16.5%) and between 2010 and 2020 (−17.6%) are very similar. For water bodies, on the other hand, most of the decline observed over the entire period studied occurred between 2010 and 2020 (Table 3). Some authors in Central Africa [25,26,27,28], West Africa [29,30] and elsewhere [31,32] have made similar observations relating to changes in land use modes in these sub-regions.
3.2. Normalized Difference Vegetation Index (NDVI) Analysis
The spatial analysis of the NDVI results shows that the NDVI values considerably decreased between 1990 and 2020 in the investigated basin (Figure 4). During the years 2000, 2010 and 2020, the maximum values of NDVI were 0.47, 0.44 and 0.39, respectively (Figure 4). These figures reflect the reduction in green spaces in the basin. Yang et al. [33] made a similar observation in their study in China. The results relating to the NDVI values during the years studied show that the forest which covered the surroundings of Yaounde city (Mbankomo, Mfou and Nsimalen) in 2000 have been gradually replaced by buildings, roads, bare soils, and crops (Figure 2).
The Landsat image analysis indicates that NDVI and LST have a strong relationship. Low NDVI values correspond to high LSTs. Statistical correlation analysis demonstrates that NDVI has a strong negative correlation with “r” values of −0.66, −0.74, and −0.85 for the years 2000, 2010, and 2020 (Figure 5). Some authors [16,34] made similar observations. According to them, the vegetation land cover class has the potential to cool the environment and is very effective in climate change mitigation strategies. Vegetation coverage could decrease the surface and air temperature by providing shade, which saves land surfaces from the direct heat of sunlight [34,35]. Conversely, built areas, roads, farmland, and bare soils have high LSTs.
3.3. LST Variation in Response to LUM Dynamics
LST increased in the Mefou watershed over the interval studied (Figure 6). During the years 2000, 2010, and 2020, the maximum LSTs values were 34 °C, 49 °C, and 54 °C, respectively. The minimum LSTs values were 17 °C, 18 °C, and 45 °C (Figure 6). For the maximum LST, the increases noted between 2000 and 2020 were +20 °C. Most of this increase took place between 2000 and 2010 (+15 °C). In the case of minimum LST, the increase noted between 2000 and 2020 was +28 °C. This increase mainly occurred between 2010 and 2020.
In general, low LST is observed in forested areas and high LST is observed in areas covered by buildings and bare soils. In 2000, 2010, and 2020, for example, 94%, 91%, and 98.7% of the lowest LSTs (17–22 °C, 18–21 °C, and 45–47 °C, respectively) were observed in areas covered by forest. During these same years, 81.6%, 87.5%, and 88.4% of the highest LSTs (28–34 °C, 27–49 °C, and 51–55 °C, respectively) were observed in the spaces covered by buildings (Table 4). Other studies [36,37] have already shown that the highest and lowest LSTs are generally observed in bare spaces and spaces covered with vegetation, respectively.
3.4. LST Validation Results with Respect to Air Temperature
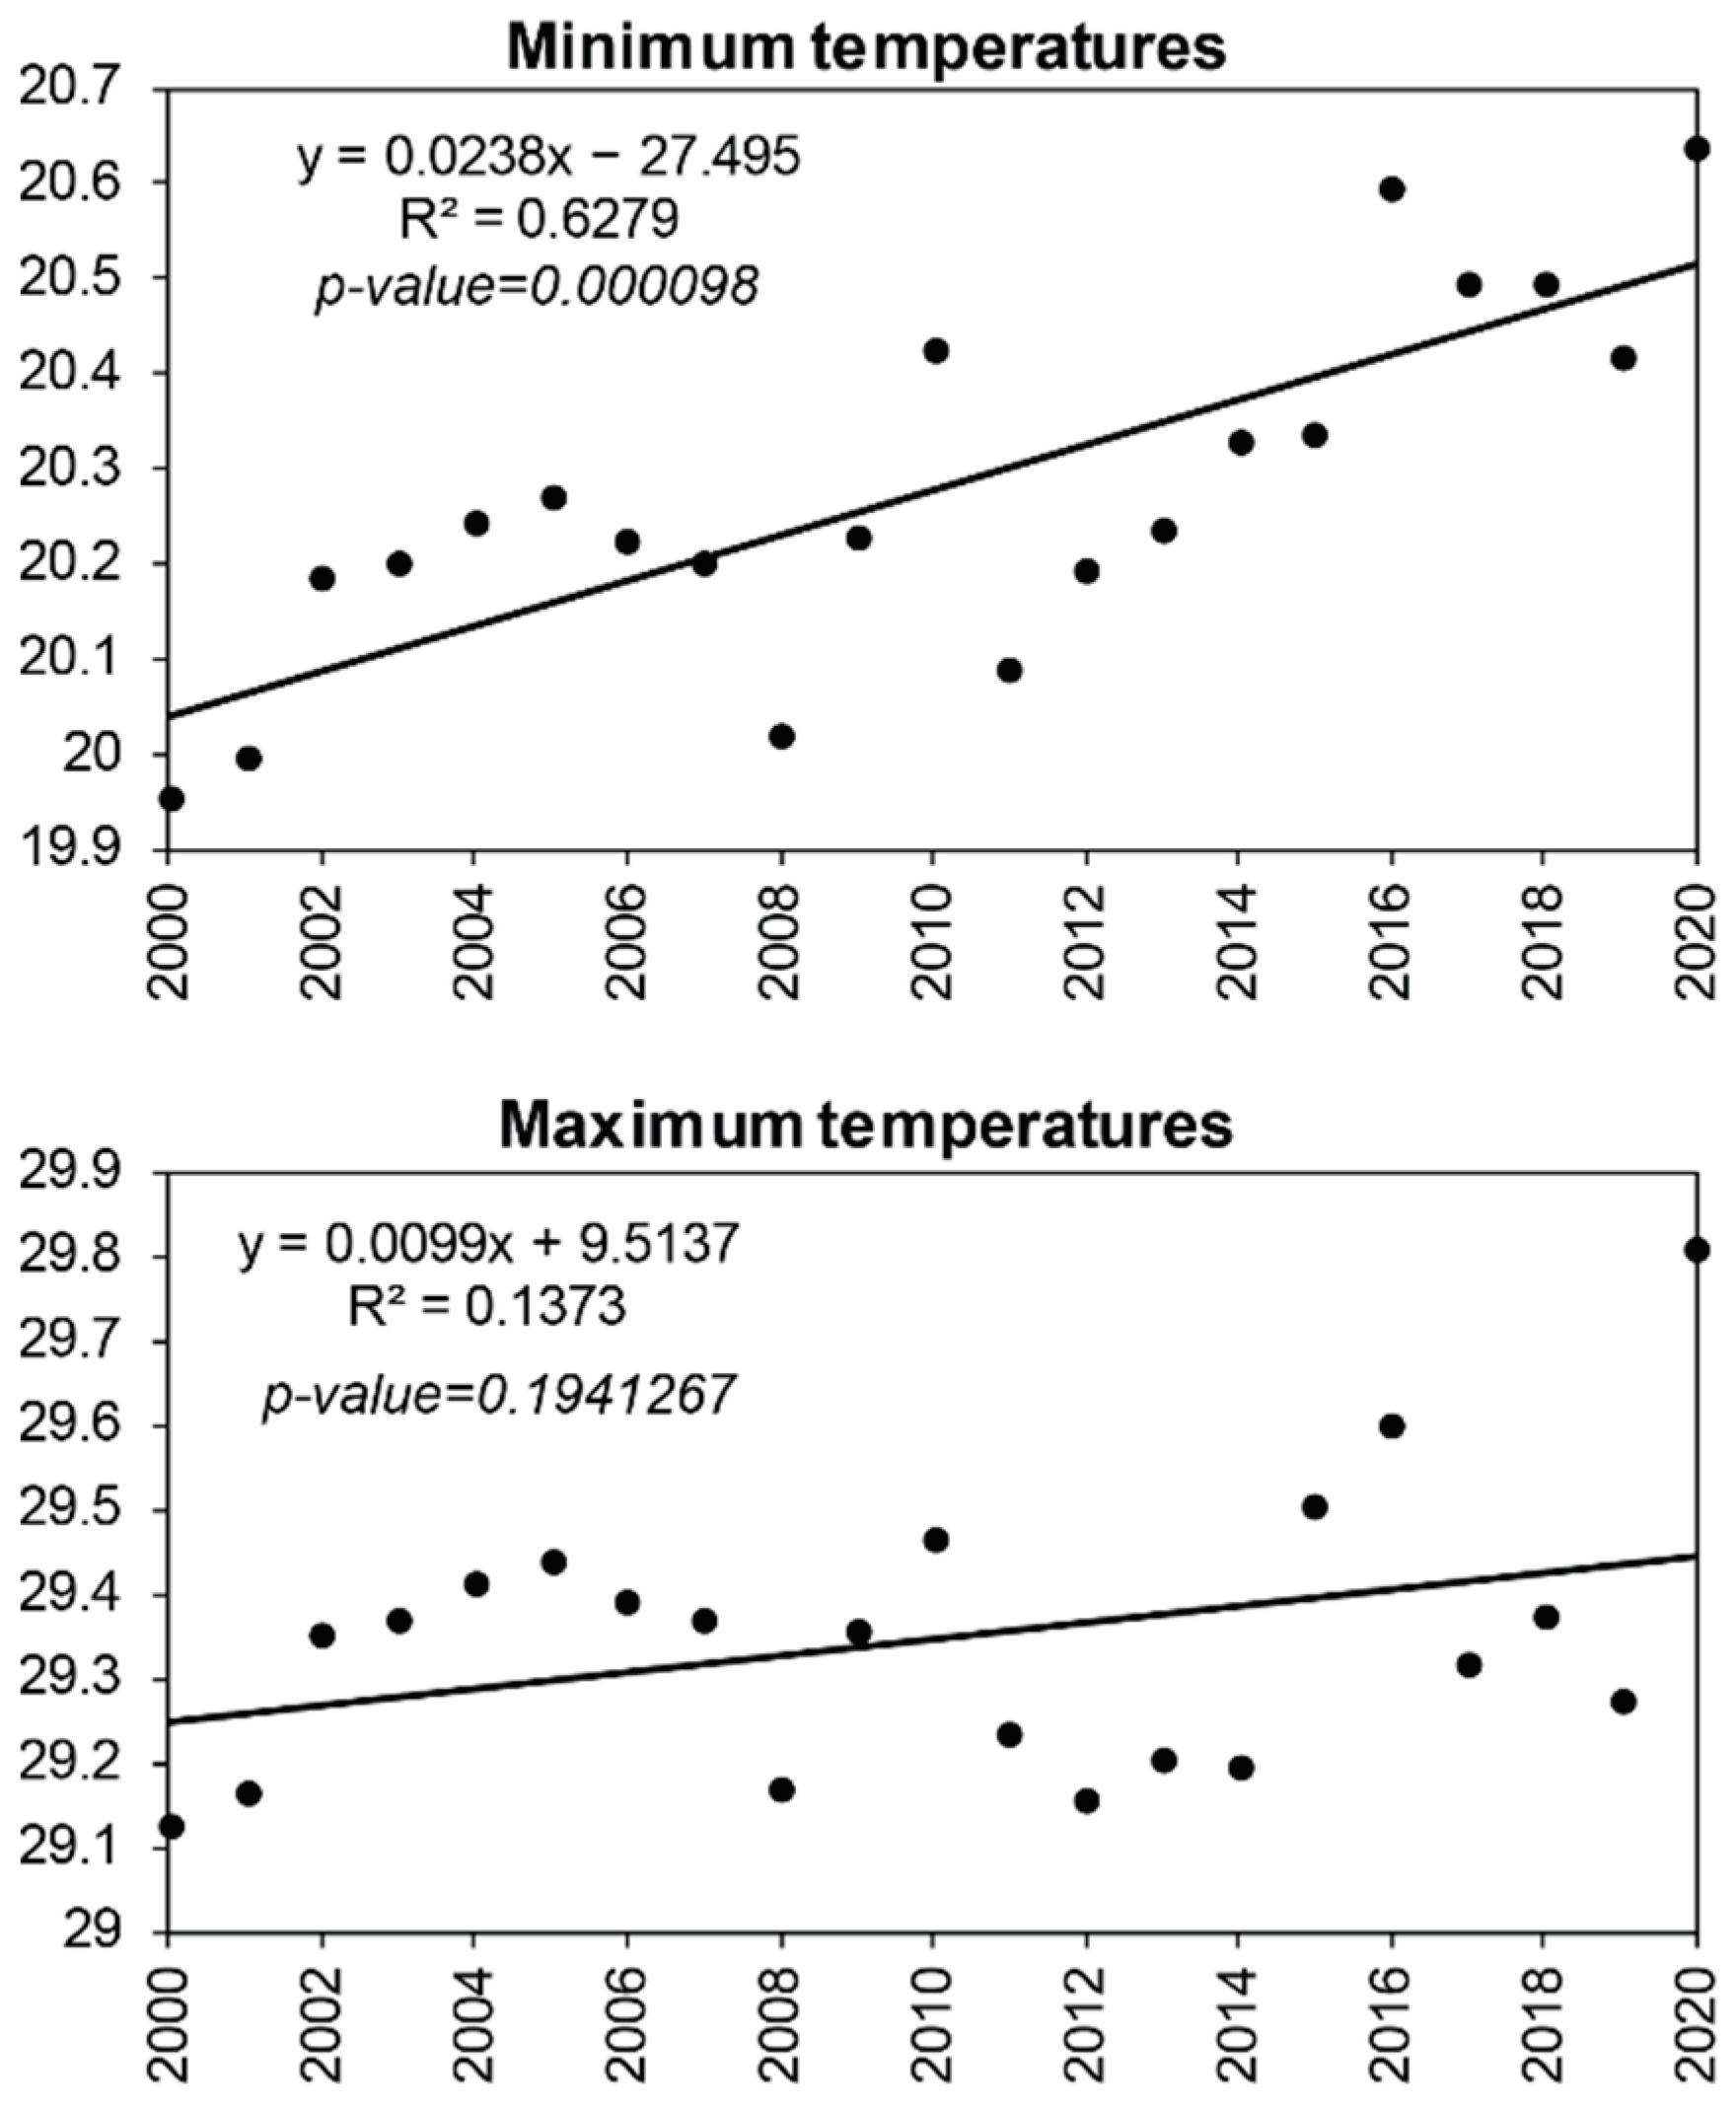
Minimum and maximum air temperatures increased in the Mefou watershed between 2000 and 2020. This increase is statistically significant for minimum temperature, with a p-value below the significance level of 0.05 (Figure 7). This implies that the increase noted for the minimum temperature is greater than that of the maximum temperature. We also note that the increase in minimum temperature is greater over the period 2010–2020 (Figure 7).
There is a strong concordance in the evolution of LST and air temperature in the Mefou watershed, which suggests that there is a link between them. We note in both cases an increase in maximum and minimum temperatures, a greater increase in minimum temperature compared to maximum temperature, and a greater increase in minimum temperature during the period 2000–2010. A similar finding was reported by Tafesse and Suryabhagavan [16] around the Adama Zuria district in Ethiopia.
4. Conclusions
The goal of this study was to analyze LST variations in response to LUM dynamics in the Mefou River sub-basin using geospatial techniques (Southern Cameroon). For this, we used Landsat satellite images and CRU air temperature data. Between 2000 and 2020, the Mefou watershed recorded significant changes in LUM, which were mainly manifested by an increase in IAs (buildings and roads (+10%); bare soils and farmlands (+204.9%)) and forest reduction (−31.2). This decrease in the forest is also reflected in a reduction in NDVI values, whose maximum values went from 0.47 in 2000 to 0.39 in 2020. Contrary to the forest area and the NDVI values, the LST of the investigated basin increased over the period studied. The maximum and minimum values increased from 34 °C to 54 °C and from 17 °C to 45 °C, respectively. There is a strong negative correlation between LST and NDVI. In general, high LSTs correspond to low NDVI values. For the years 2000, 2010, and 2020, the links between these two variables are materialized by the respective correlation coefficients of −0.66, −0.74, and −0.85. Based on our results, it is recommended to increase the campaigns of afforestation and reforestation programs to minimize unexpected increases in LST in the study area and beyond. Further studies should be conducted, incorporating additional factors for a better understanding of the effects of LUM dynamics on LST for mitigation strategies.
Funding
This research received no external funding.
Institutional Review Board Statement
Not applicable.
Informed Consent Statement
Not applicable.
Data Availability Statement
All relevant data are included in the paper.
Conflicts of Interest
The author declares no conflict of interest.
References
- Abebe, M.S.; Derebew, K.T.; Gemeda, D.O. Exploiting temporal-spatial patterns of informal settlements using GIS and remote sensing technique: A case study of Jimma city, Southwestern Ethiopia. Environ. Syst. Res. 2019, 8, 6. [Google Scholar] [CrossRef] [Green Version]
- Negassa, M.D.; Mallie, D.T.; Gemeda, D.O. Forest covers change detection using Geographic Information Systems and remote sensing techniques: A spatio temporal study on Komto Protected Forest priority area, East Wollega Zone Ethiopia. Environ. Syst. Res. 2020, 9, 1. [Google Scholar] [CrossRef] [Green Version]
- Negash, D.A.; Moisa, M.B.; Merga, B.B.; Sedeta, F.; Gemeda, D.O. Soil erosion risk assessment for prioritization of sub-watershed: The case of Chogo Watershed, Horo Guduru Wollega, Ethiopia. Environ. Earth. Sci. 2021, 80, 589. [Google Scholar] [CrossRef]
- Feng, Y.; Li, H.; Tong, X.; Chen, L.; Liu, Y. Projections of land surface temperature considering the effects of future land change in the Taihu Lake Basin of China. Glob. Planet Change 2018, 167, 24–34. [Google Scholar] [CrossRef]
- Das, N.; Mondal, P.; Sutradhar, S.; Ghosh, R. Assessment of variation of land use /land cover and its impact on land surface temperature of Asansol subdivision. Egypt J. Remote Sens. Space Sci. 2020, 24, 131–149. [Google Scholar] [CrossRef]
- Deng, X.Z.; Huang, J.K.; Han, J.Z.; Rozelle, S.; Zhang, J.P.; Li, Z.H. Impact of urbanization on cultivated land changes in China. Land Use Policy 2015, 45, 1–7. [Google Scholar] [CrossRef]
- Wang, L.; Tian, F.; Wang, X.; Yang, Y.; Wei, Z. Attribution of the land surface temperature response to land-use conversions from bare land. Glob. Planet. Change 2020, 193, 103268. [Google Scholar] [CrossRef]
- Gemeda, D.O.; Korecha, D.; Garedew, W. Evidences of climate change presences in the wettest parts of Southwest Ethiopia. Heliyon 2020, 7, e08009. [Google Scholar] [CrossRef]
- Kiswanto, T.S.; Mardiany, S. Completing yearly land cover maps for accurately describing annual changes of tropical landscapes. Glob. Ecol. Conserv. 2018, 13, e00384. [Google Scholar] [CrossRef]
- Kayet, N.; Pathak, K.; Chakrabarty, A.; Sahoo, S. Spatial impact of land use/land cover change on surface temperature distribution in Saranda Forest, Jharkhand. Modell. Earth Syst. Environ. 2016, 2, 127. [Google Scholar] [CrossRef]
- Aires, F.; Prigent, C.; Rossow, W.B.; Rothstein, M. A new neural network approach including first guess for retrieval of atmospheric water vapor, cloud liquid water path, surface temperature, and emissivity over land from satellite microwave observations. J. Geophys. Res. 2001, 106, 14887–14907. [Google Scholar] [CrossRef]
- James, M.M.; Mundia, C.N. Dynamism of land use changes on surface temperature in Kenya: A case study of Nairobi City. Int. J. Sci. Res. 2014, 3, 38–41. [Google Scholar]
- Gemes, O.; Tobak, Z.; Van Leeuwen, B. Satellite based analysis of surface Urban Heat Intensity. J. Environ. Geogr. 2016, 9, 23–30. [Google Scholar] [CrossRef] [Green Version]
- Okinyemi, F.O.; Ikanyeng, M.; Muro, J. Land cover change effects on land surface temperature trends in an African Urbanizing dryland region. City Environ. Interact. 2019, 4, 100029. [Google Scholar] [CrossRef]
- Dissanayake, D.; Morimoto, T.; Murayama, Y.; Ranagalag, M. Impact of landscape structure on the variation of Land Surface Temperature in Sub-Saharan Region. A case Study of Addis Ababa using Landsat Data (1986–2016). Sustainability 2019, 11, 2257. [Google Scholar] [CrossRef] [Green Version]
- Tafesse, B.; Suryabhagavan, K.V. Systematic modelling of impacts of land-use and land-cover changes on land surface temperature in Adama Zuria District, Ethiopia. Model. Earth Syst. Environ. 2019, 5, 805–817. [Google Scholar] [CrossRef]
- Letouzey, R. Notice de la Carte Phytogéographique du Cameroun au 1/500,000; Institut de la Carte Internationale de la Végétation: Toulouse, France, 1985. [Google Scholar]
- Nkiaka, E.; Nawaz, R.; Lovett, J.C. Assessing the reliability and uncertainties of projected changes in precipitation and temperature in Coupled Model Intercomparison Project phase 5 models over the Lake Chad basin. Int. J. Climatol. 2018, 38, 5136–5152. [Google Scholar] [CrossRef] [Green Version]
- Ebodé, V.B.; Mahé, G.; Dzana, J.G.; Amougou, J.A. Anthropization and Climate Change: Impact on the Discharges of Forest Watersheds in Central Africa. Water 2020, 12, 2718. [Google Scholar] [CrossRef]
- Ebodé, V.B.; Dzana, J.G.; Nkiaka, E.; Nka, N.B.; Braun, J.J.; Riotte, J. Effects of climate and anthropogenic changes on current and future variability in flows in the So’o River Basin (South of Cameroon). Hydrol. Res. 2022, 53, 1203–1220. [Google Scholar] [CrossRef]
- Hamstead, Z.A.; Kremer, P.; Larondelle, N.; McPhearson, T.; Haase, D. Classification of the heterogenous structure of urban landscapes (STURLA) as an indicator of landscape functions applied to surface temperature in New York City. Ecol. Indic. 2015, 70 (Suppl. C), 574–585. [Google Scholar] [CrossRef]
- Chibuike, E.M.; Ibukun, A.O.; Kunda, J.J.; Abbas, A. Assessment of green parks cooling effects on Abuja urban microclimate using geospatial techniques. Remote Sens. Appl. 2018, 11, 11–21. [Google Scholar] [CrossRef]
- Chander, G.; Markham, B. Revised landsat-5 TM radiometrie calibration procedures and post-calibration dynamic ranges. IEEE Trans Geosci Remote Sens. 2003, 41, 2674–2677. [Google Scholar] [CrossRef] [Green Version]
- Carlson, T.N.; Riziley, D.A. On the relation between NDVI, fractional vegetation cover, and leaf area index. Remote Sens. Environ. 1997, 62, 241–252. [Google Scholar] [CrossRef]
- Ewane, E.B.; Lee, H.H. Assessing land use/land cover change impacts on the hydrology of Nyong River Basin, Cameroon. J. Mt. Sci. 2020, 17, 50–67. [Google Scholar] [CrossRef]
- Ebodé, V.B.; Mahé, G.; Amoussou, E. Impact de la variabilité climatique et de l’anthropisation sur les écoulements de la Bénoué (nord Cameroun). Proc. IAHS 2021, 384, 261–267. [Google Scholar] [CrossRef]
- Ebodé, V.B.; Braun, J.J.; Nnomo, B.N.; Mahé, G.; Nkiaka, E.; Riotte, J. Impact of Rainfall Variability and Land Use Change on River Discharge in South Cameroon. Water 2022, 14, 941. [Google Scholar] [CrossRef]
- Ebodé, V.B. Impact of rainfall variability and land-use changes on river discharge in Sanaga catchment (forest–savannah transition zone in Central Africa). Hydrol. Res. 2022, 53, 1017–1030. [Google Scholar] [CrossRef]
- Leblanc, M.; Favreau, G.; Massuel, S.; Tweed, S.; Loireau, M.; Cappelaere, B. Land clearance and hydrological change in the Sahel: South-west Niger. Glob. Planet Change 2008, 61, 49–62. [Google Scholar] [CrossRef]
- Amogu, O.; Descroix, L.; Yéro, K.S.; Le Breton, E.; Mamadou, I.; Ali, A.; Vischel, T.; Bader, J.-C.; Moussa, I.B.; Gautier, E.; et al. Increasing river flows in Sahel? Water 2010, 2, 170–199. [Google Scholar] [CrossRef] [Green Version]
- Gebrelibanos, T.; Assen, M. Land use/land cover dynamics and their driving forces in the Hirmi watershed and its adjacent agro-ecosystem, highlands of Northern Ethiopia. J. Land Use Sci. 2015, 10, 81–94. [Google Scholar] [CrossRef]
- Belay, T.; Mengistu, D.A. Land use and land cover dynamics and drivers in the Muga watershed, Upper Blue Nile basin, Ethiopia. Remote Sens. Appl. Soc. Environ. 2019, 15, 100249. [Google Scholar] [CrossRef]
- Yang, J.; Sun, J.; Ge, Q.; Li, X. Assessing the impacts of urbanization—Associated green space on urban land surface temperature: A case study of Dalian, China. Urban For. Urban Green. 2017, 22, 1–10. [Google Scholar] [CrossRef]
- Weng, Q.; Lu, D.; Schubring, J. Estimation of land surface temperature- vegetation abundance relationship for urban heat island studies. Remote Sens. Environ. 2004, 89, 467–483. [Google Scholar] [CrossRef]
- Zhou, W.; Huang, G.; Cadenasso, M.L. Does spatial configuration matter? Understanding the effects of land cover pattern on land surface temperature in urban landscapes. Landsc. Urban Plan 2011, 102, 54–63. [Google Scholar] [CrossRef]
- Worku, G. Modeling land surface temperature from satellite data, the case of Addis Ababa. In Proceedings of the ES RI, Eastern Africa Education GIS Conference, Africa Hall, United Nations Conference Centre, Addis Ababa, Ethiopia, 23–24 September 2016. [Google Scholar]
- Workaye, S.; Suryabhagavan, K.V.; Belliethathan, S. Urban green areas to mitigate urban heat island effect: The case of Addis Ababa, Ethiopia. Int. J. Ecol. Environ. Sci. 2018, 44, 353–367. [Google Scholar]
Figure 1.
Location map of Mefou watershed at Nsimalen outlet.
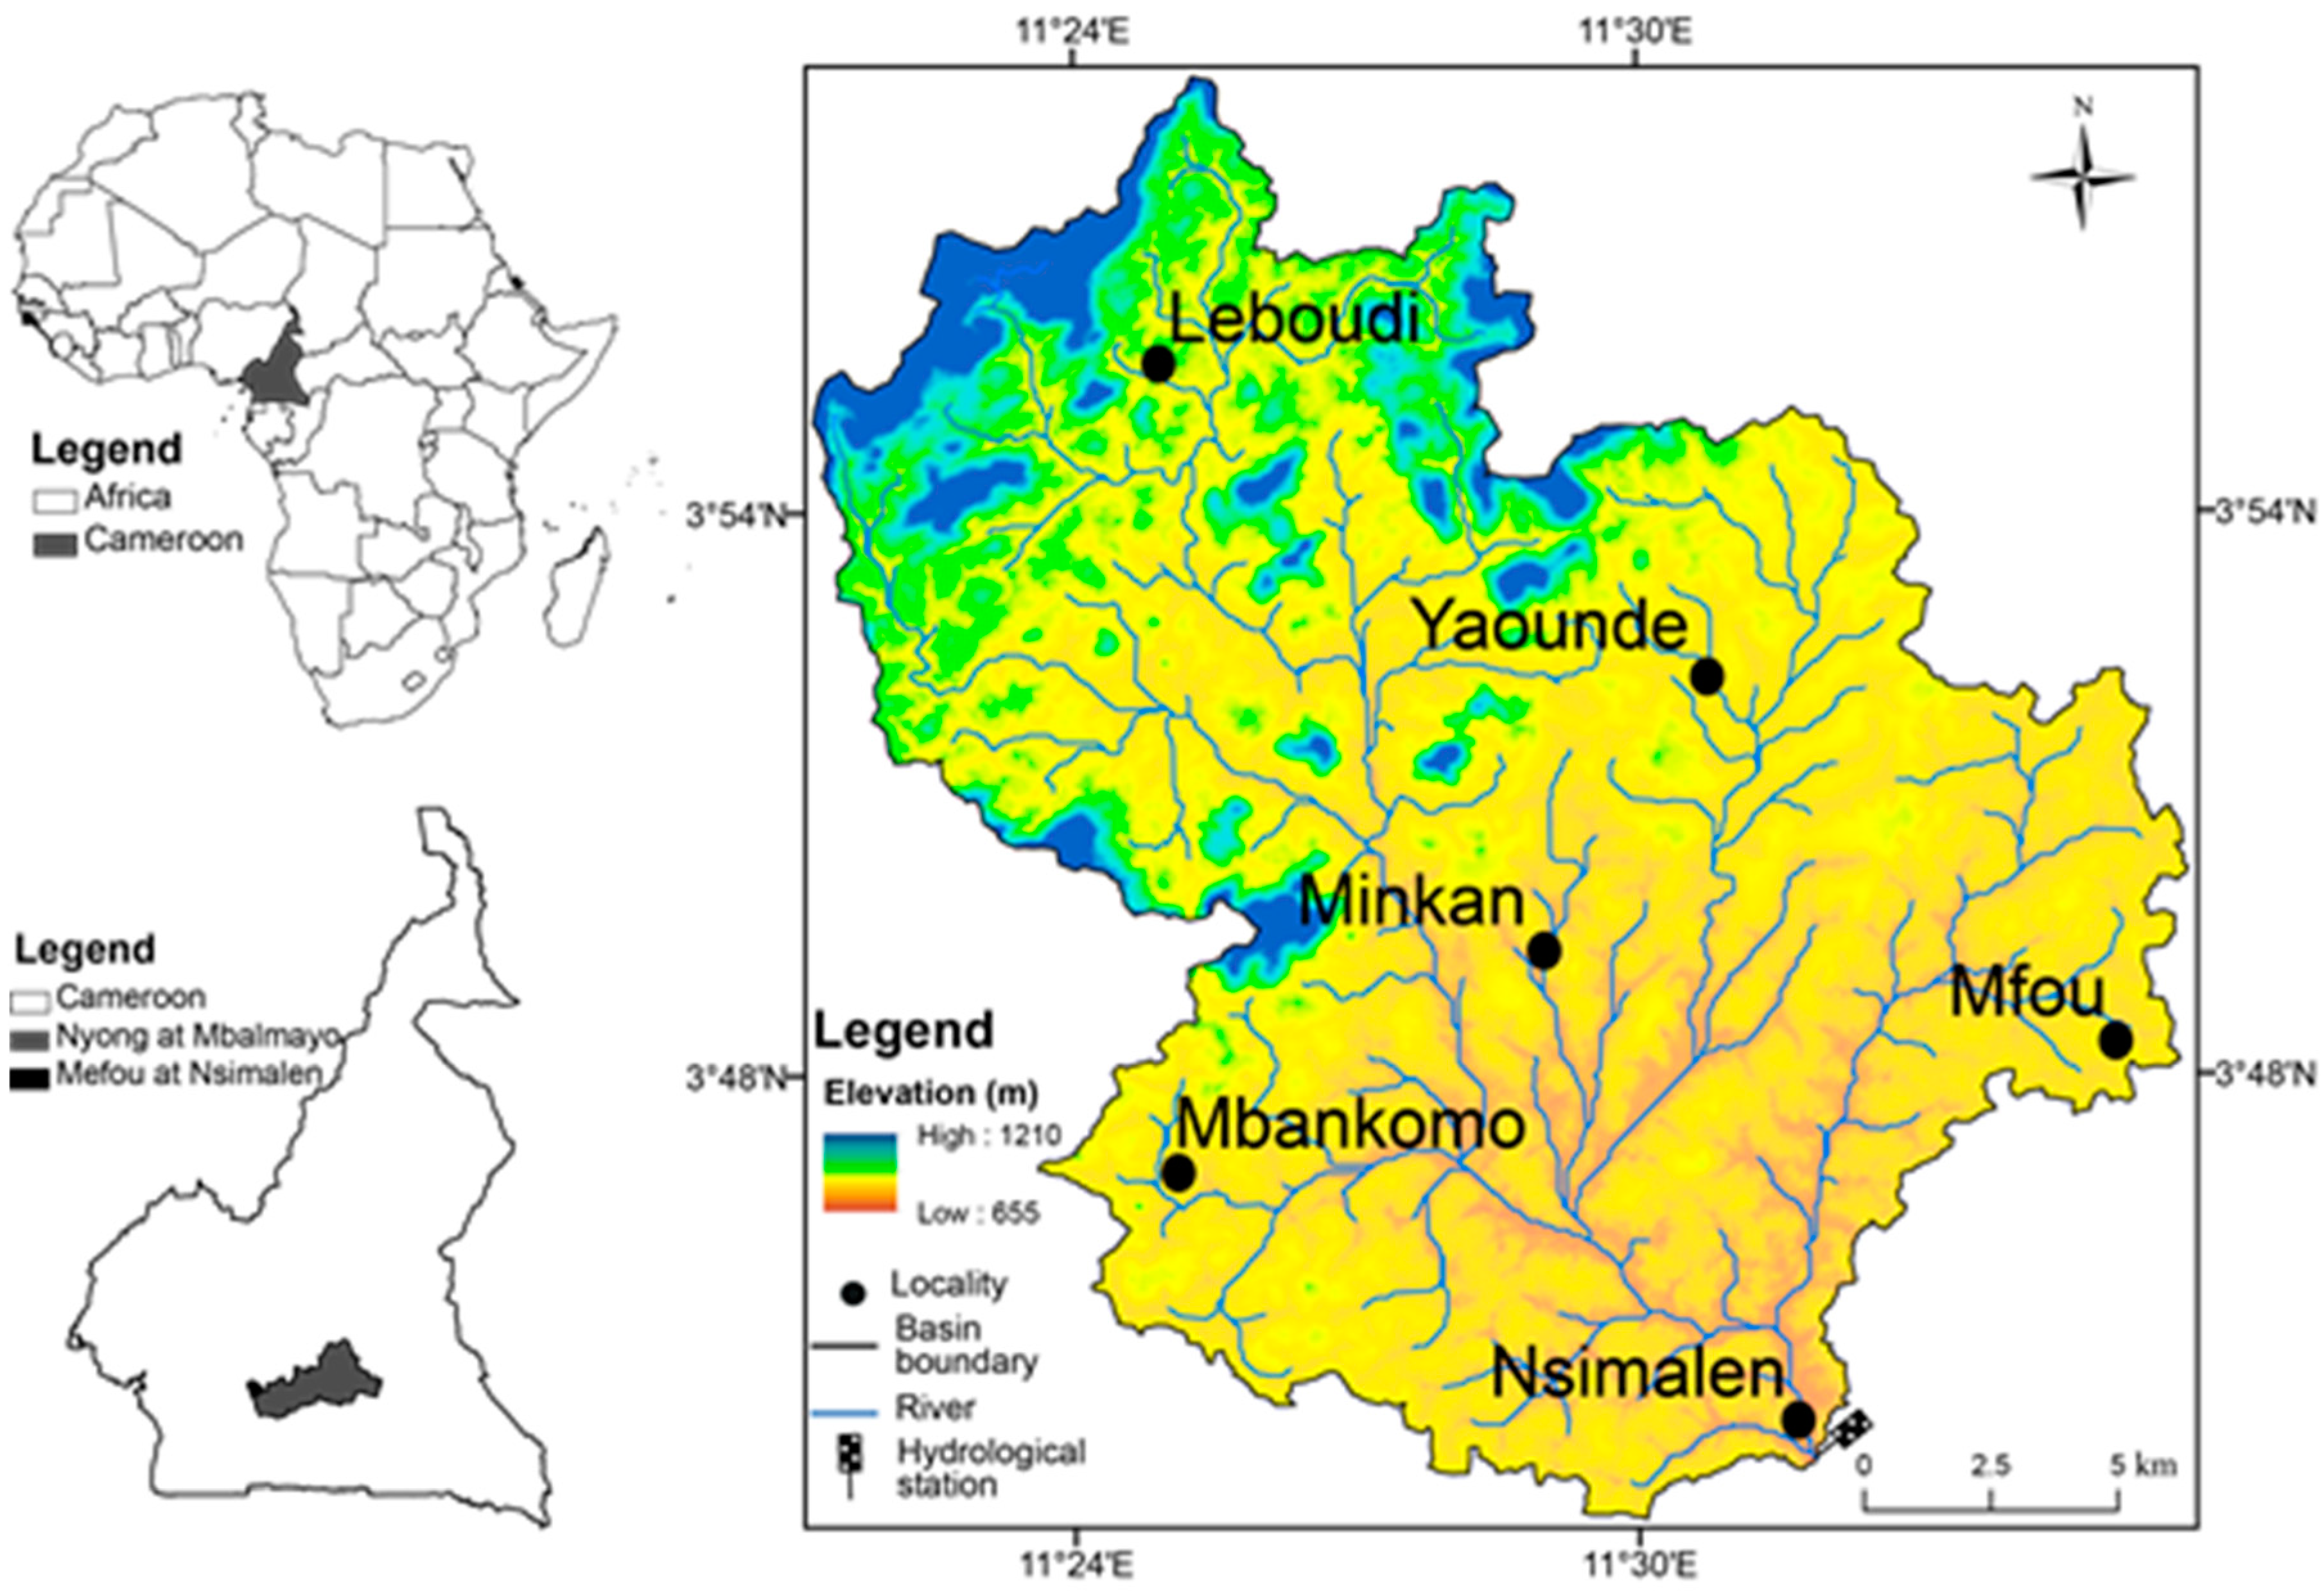
Figure 2.
Changes in the spatial distribution of the main land use modes in the Mefou basin between 2000 and 2020.
Figure 2.
Changes in the spatial distribution of the main land use modes in the Mefou basin between 2000 and 2020.

Figure 3.
Evolution of impervious areas (IAs) in the Mefou basin between 2000 and 2020. IAs include built areas, roads, bare soils and farmlands.
Figure 3.
Evolution of impervious areas (IAs) in the Mefou basin between 2000 and 2020. IAs include built areas, roads, bare soils and farmlands.
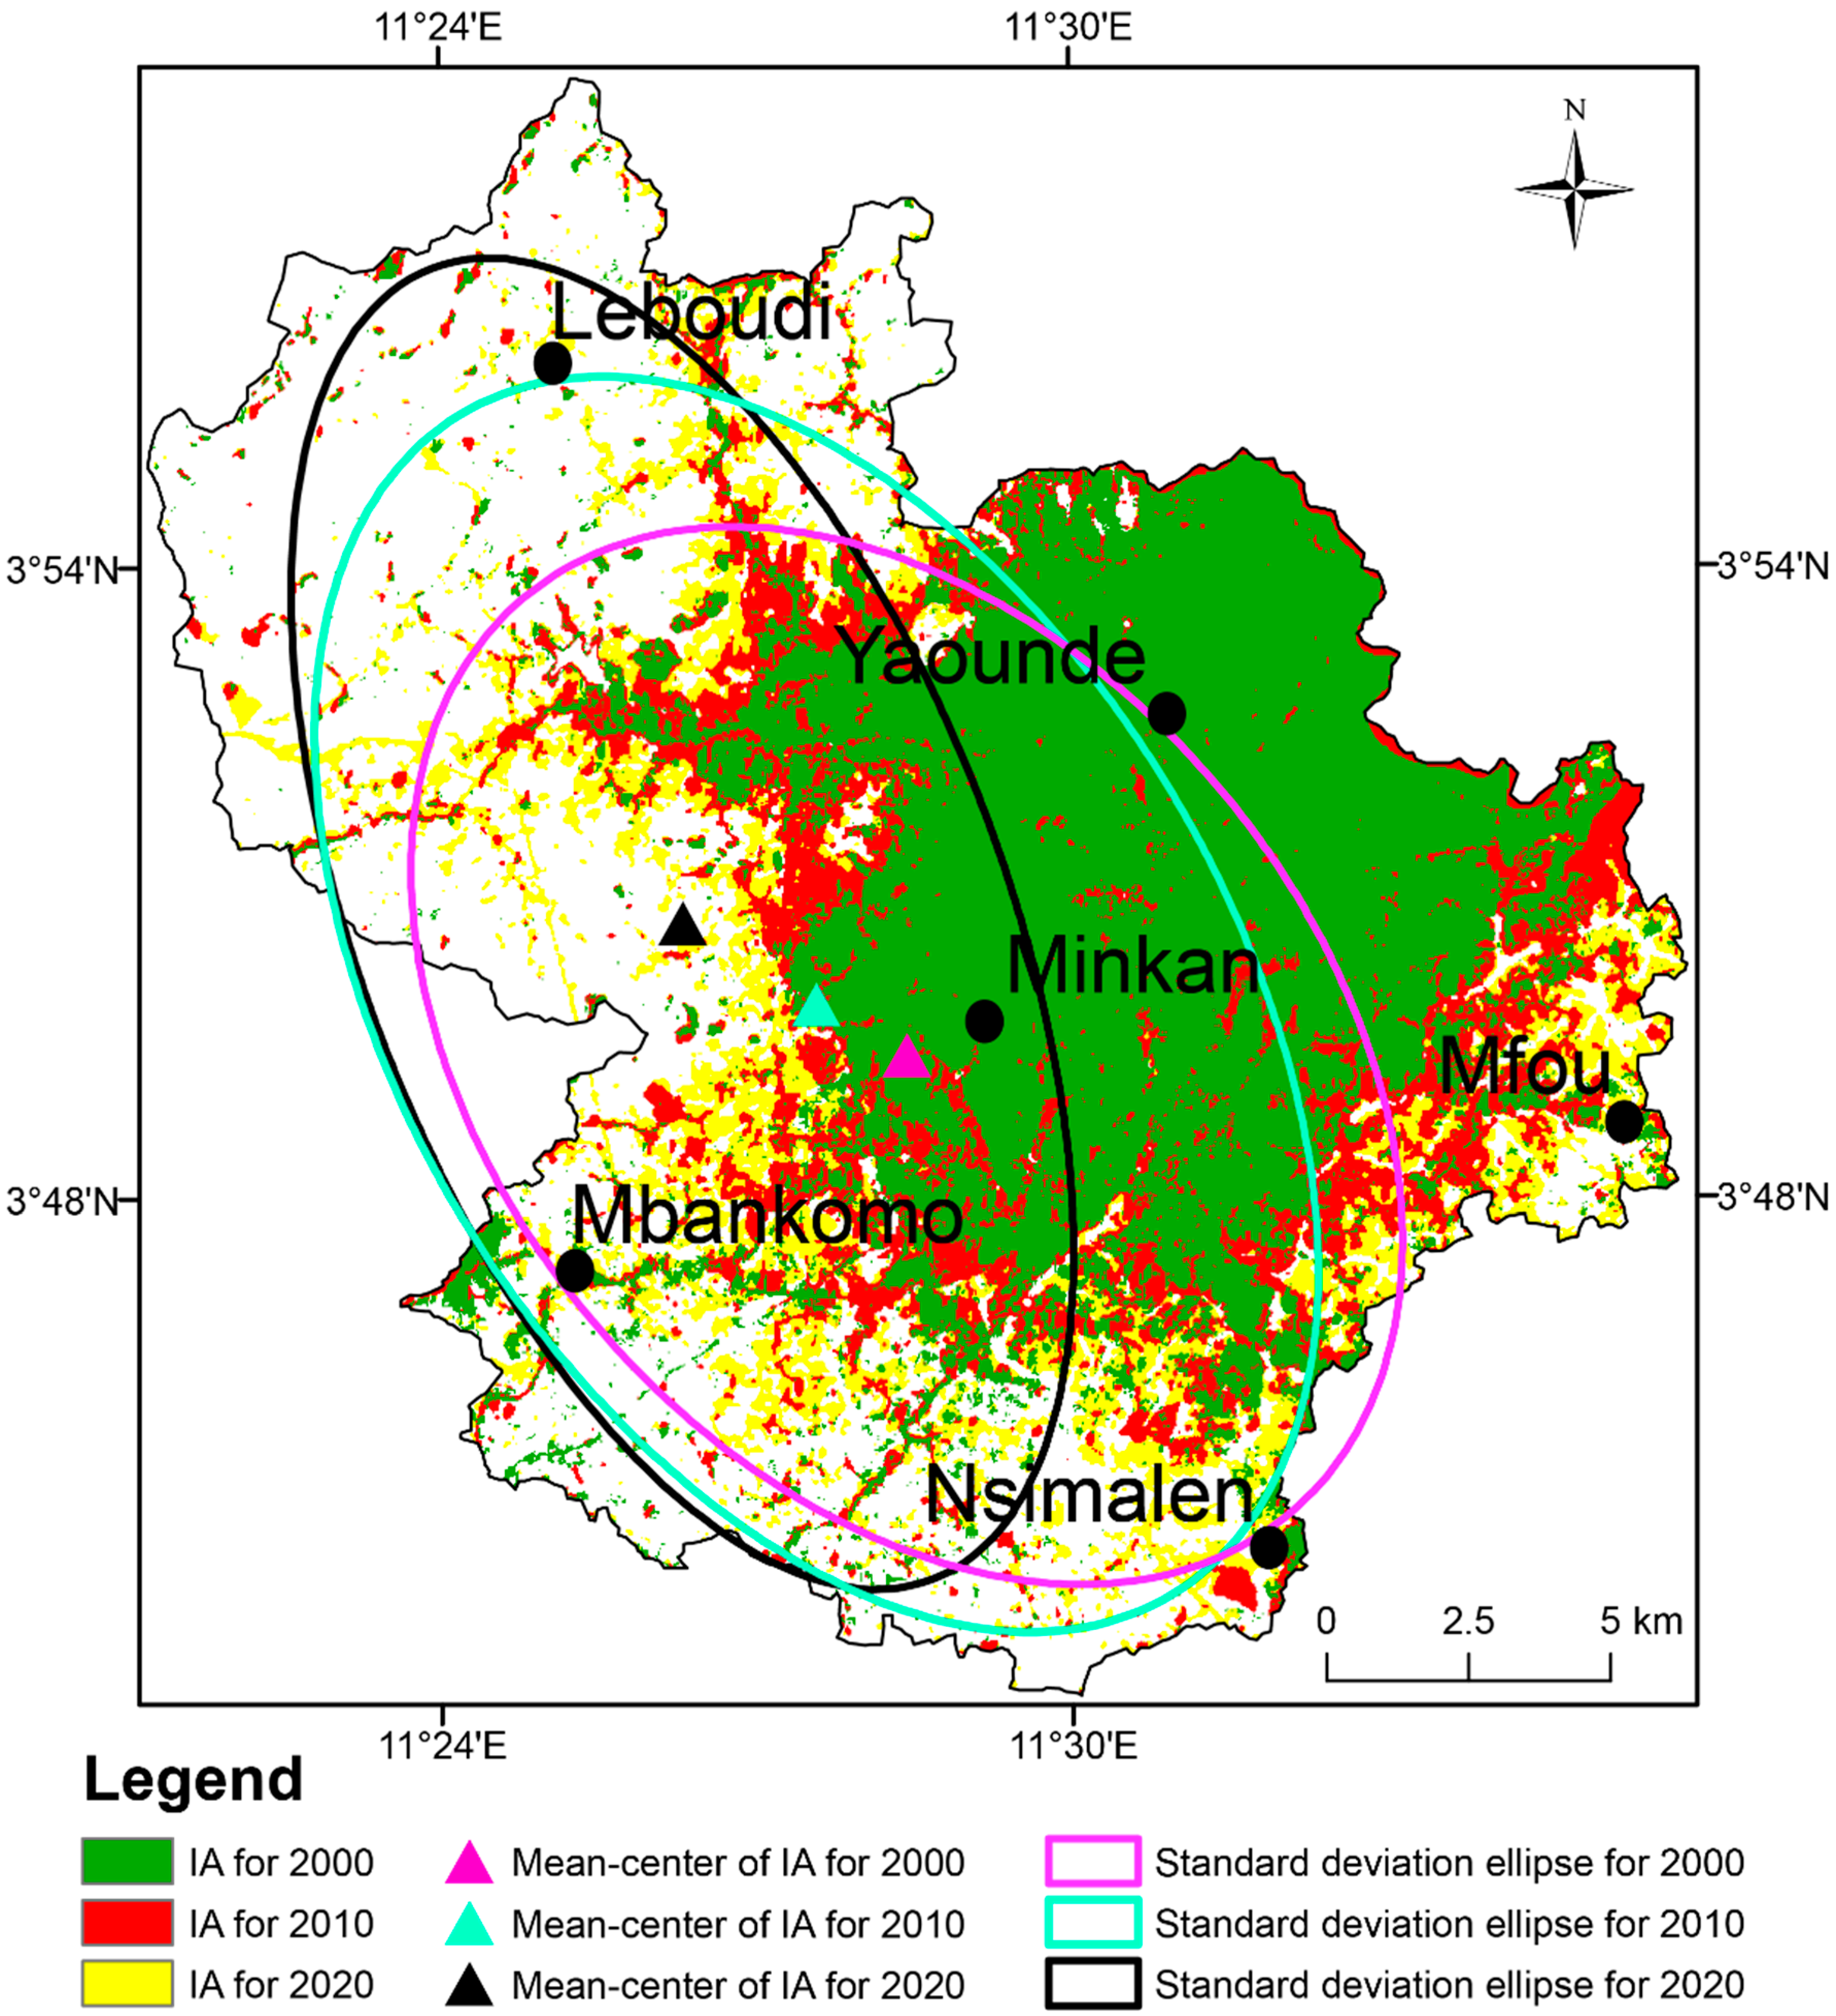
Figure 4.
NDVI maps from 2000 to 2020.

Figure 5.
Linear regression scatter plot of LST and NDVI in 2000, 2010, and 2020.

Figure 6.
LST maps from 2000 to 2020.

Figure 7.
Evolution of minimum and maximum air temperatures between 2000 and 2020.

Table 1.
Remote sensing images.
| Images | Path | Row | Pixel Size | Acquisition Date | Sources |
|---|---|---|---|---|---|
| Landsat ETM+ of 2000 | 185 | 57 | 30 × 30 | January 2000 | U.S. Geological Survey |
| Landsat ETM + of 2010 | 185 | 57 | 30 × 30 | December 2010 | U.S. Geological Survey |
| Landsat OLI/TIRS of 2020 | 185 | 57 | 30 × 30 | January 2020 | U.S. Geological Survey |
Table 2.
ETM + and TIRS thermal band calibration constants.
| Constant 1-K1 Watts/(m2∗ster∗μm) | Constant 2-K2 Kelvin | |
|---|---|---|
| Landsat 7 | 666.09 | 1282.71 |
| Landsat 8 | 774.8853 | 1321.0789 |
Table 3.
Evolution of the main land use modes in the Mefou watershed during the study period.
| Land Use Modes | Area Occupied in the Basin (km2) | 2000–2010 | 2010–2020 | 2000–2020 | |||||
|---|---|---|---|---|---|---|---|---|---|
| 2000 | 2010 | 2020 | km2 | % | km2 | % | km2 | % | |
| Built and roads | 118.1 | 127.1 | 130 | 9.0 | 7.6 | 2.9 | 2.3 | 11.9 | 10 |
| Forest | 273.3 | 228.1 | 188 | −45.2 | −16.5 | −40.1 | −17.6 | −85.3 | −31.2 |
| Water | 0.8 | 0.8 | 0.7 | 0.0 | −2.4 | −0.1 | −12.5 | −0.1 | −14.6 |
| Bare soils and farm lands | 35.7 | 72.1 | 109 | 36.3 | 101.8 | 36.8 | 51.1 | 73.2 | 204.9 |
Table 4.
Statistical links between LST and LUM.
| LST Year | Area | % of LST Class Observed in Each LUM (%) | |||||
|---|---|---|---|---|---|---|---|
| LST Classes | km2 | % | Built and Roads | Forest | Water | Bare Soils and Farm Lands | |
| 2000 | 17–22 | 96.6 | 22.6 | 5.1 | 94 | 0.5 | 0.4 |
| 23–24 | 161.0 | 37.6 | 12.8 | 83.9 | 0.2 | 3.1 | |
| 25–25 | 94.2 | 22.0 | 41.7 | 44.3 | 0 | 14 | |
| 26–27 | 55.7 | 13.0 | 73.2 | 11.1 | 0 | 15.6 | |
| 28–34 | 20.6 | 4.8 | 81.6 | 3.9 | 0 | 14.6 | |
| 2010 | 18–21 | 67.8 | 15.8 | 6.5 | 91.7 | 0 | 1.8 |
| 23–24 | 152.6 | 35.7 | 7.5 | 83.1 | 0.2 | 9.2 | |
| 24–24 | 93.5 | 21.8 | 25.2 | 41.8 | 0 | 32.9 | |
| 25–26 | 69.9 | 16.3 | 64.9 | 6.9 | 0 | 28.2 | |
| 27–49 | 44.1 | 10.3 | 87.5 | 0.9 | 0 | 11.6 | |
| 2020 | 45–47 | 76.6 | 17.9 | 0 | 98.7 | 0.9 | 0.4 |
| 48–48 | 99.2 | 23.2 | 1.3 | 86.7 | 0 | 12 | |
| 49–49 | 94.2 | 22.0 | 17.8 | 27.3 | 0 | 54.9 | |
| 50–50 | 101.1 | 23.6 | 61.3 | 1.6 | 0 | 37.1 | |
| 51–55 | 56.9 | 13.3 | 88.4 | 0 | 0 | 11.6 | |
Disclaimer/Publisher’s Note: The statements, opinions and data contained in all publications are solely those of the individual author(s) and contributor(s) and not of MDPI and/or the editor(s). MDPI and/or the editor(s) disclaim responsibility for any injury to people or property resulting from any ideas, methods, instructions or products referred to in the content. |
© 2023 by the author. Licensee MDPI, Basel, Switzerland. This article is an open access article distributed under the terms and conditions of the Creative Commons Attribution (CC BY) license (https://creativecommons.org/licenses/by/4.0/).
Share and Cite
MDPI and ACS Style
Ebodé, V.B. Land Surface Temperature Variation in Response to Land Use Modes Changes: The Case of Mefou River Sub-Basin (Southern Cameroon). Sustainability 2023, 15, 864. https://doi.org/10.3390/su15010864
AMA Style
Ebodé VB. Land Surface Temperature Variation in Response to Land Use Modes Changes: The Case of Mefou River Sub-Basin (Southern Cameroon). Sustainability. 2023; 15(1):864. https://doi.org/10.3390/su15010864
Chicago/Turabian StyleEbodé, Valentin Brice. 2023. "Land Surface Temperature Variation in Response to Land Use Modes Changes: The Case of Mefou River Sub-Basin (Southern Cameroon)" Sustainability 15, no. 1: 864. https://doi.org/10.3390/su15010864
Note that from the first issue of 2016, this journal uses article numbers instead of page numbers. See further details here.