Article

The Relationship between Concrete Strength and Classes of Resistance against Corrosion Induced by Carbonation: A Proposal for the Design of Extremely Durable Structures in Accordance with Eurocode 2

by
Luisa María Gil-Martín
,
Luisa Hdz-Gil
,
Emilio Molero
and
Enrique Hernández-Montes
*
School of Civil Engineers, University of Granada, 18012 Granada, Spain
*
Author to whom correspondence should be addressed.
Sustainability 2023, 15(10), 7976; https://doi.org/10.3390/su15107976
Submission received: 12 April 2023 / Revised: 10 May 2023 / Accepted: 10 May 2023 / Published: 13 May 2023
(This article belongs to the Special Issue Advanced Concrete and Construction Materials)

Abstract

:
The new Eurocode 2 provides valuable information on the required concrete cover to protect reinforcement against corrosion induced by carbonation, for two design service life values of 50 and 100 years. However, to design structures with an even longer service life and assess existing ones, additional tools are necessary. The ‘square root of time’ relationship is a well-established method for estimating the penetration of the carbonation front, making it useful for long-term design and assessment purposes. In this article, we propose a new function that adjusts the evolution of the carbonation front to the Eurocode 2 values. This function is a powerful tool for designing extremely durable structures and assessing existing ones. To demonstrate its effectiveness, we provide two examples of its application.

1. Introduction

There are several factors that cause damage to reinforced concrete (RC in what follows) structures, and the damage induced by the corrosion of reinforcement has a serious effect on durability [1,2,3,4] and on the loading capacity [5,6]. Corrosion is mainly caused by the action of chloride ions [7,8] and the penetration of carbon dioxide [9,10]. So, when the service life of RC structures is being considered [11], requirements such as cover thickness, concrete strength, type of cement, water–cement ratio, and environmental exposure must be taken into consideration [8]. Once corrosion starts, repairs are costly and difficult [12,13].
The increase in urban pollution [14] is just one of the factors that affects the durability of RC structures. The increase in carbon dioxide (CO2) emissions into the atmosphere affects carbonation depth, making concrete carbonation a serious problem [15]. The service life of a structure is the period of time between the construction of the structure and the moment in which its performance fails to meet the requirements of the users [16]. According to [7], service life is defined as the sum of the corrosion initiation time (or the time the pollutant takes to affect the thickness of the whole concrete cover), and the time needed for the propagation of the corrosion (which is the time between the initiation period and the moment when the level of corrosion degradation is unacceptable). However, regarding carbonation, damage usually occurs at the instant when the carbonation front comes into contact with the reinforcement [17,18]. So, when assessing service life, the period of time corresponding to the propagation of corrosion is not considered. This is supported by the fact that when the carbonation front reaches the reinforcing bar, the damage to the structure is of a significant level.
On site, carbonation depths are measured using the phenolphthalein method or other more sophisticated techniques such as thermogravimetric analysis. In the literature, there are several models that can be used to estimate carbonation depth, and these models can be used to make service life predictions [15,19,20,21], which is a major advance in how RC structures exposed to CO2 over time can be evaluated.
Some of the models used for determining carbonation depth [18,19,22] consider the influence of the different parameters involved in the carbonation process. These models can be difficult to apply in practice as obtaining all the input parameters [8] can be both time consuming and expensive.
Contrary to the analysis of chloride ingress in concrete structures [23], where simplified models can be inappropriate [24], there are models based on simplified equations [7] widely used to determine the carbonation depth [9].
Carbonation is mainly affected by environmental conditions (CO2 content, relative humidity, and temperature), exposure conditions (protection from the rain), concrete material (water/binder ratio (w/b), cement type, and content), the amount of CO2 in the environment, and pore size distribution [18,19,25,26,27].
The process of CO2 diffusion is usually modeled using Fick’s first law. So, the carbonation coefficient or carbonation rate constant, K, (mm/year0,5) is calculated using the ‘square root of time’ relationship, i.e., as the ratio between the attack penetration depth (mm) and the square root of the exposure time to CO2 (year) [7,28]. The square root model has been verified both in the laboratory and in the field [29].
Some authors [30] have indicated that it is impossible to consider all the parameters involved in the carbonation process as there are so many of them [28]. However, factors affecting carbonation can be intercorrelated. Statistical studies have proved that the water/binder ratio and the quantity of clinker in the binder have a direct relationship with the compressive strength of concrete [15]. In fact, a higher water-cement ratio makes the diffusion of CO2 into concrete easier, while, for a fixed water–cement ratio, the use of a higher cement content in the concrete mix improves concrete durability [31]. Moreover, compressive strength influences the porous structure of concrete, and so it is a key factor in the diffusion of carbon dioxide through the material, which also makes it a key factor in carbonation. Generally, a high compressive strength is associated with more compact concrete mixes and with concretes with a higher clinker content. Additionally, due to the chemical reactions during carbonation, the higher the clinker content, the slower the carbonation coefficient is [15].
However, according to [21], the factors which have the most significant effect on the carbonation coefficient K are: the exposure conditions, cement type, and the compressive strength of the concrete, and there is a strong correlation between compressive concrete strength and carbonation resistance [28,32].
Current standards (e.g., [33]) have established minimum cover requirements cmin,dur to protect reinforcement from corrosion. These cover values depend on the different classes of exposure and are defined for 50 and 100 years of design service life [32,34,35].
In the CEB Bulletin 34 [36], and in the Spanish and Portuguese standards [28,32,35], the minimum cover is obtained from the ‘square root of time’, with the time exposure to CO2 (year) or the time when corrosion starts. In the Spanish Structural Code [35] the apparent carbonation coefficient, Kapp,carb, is obtained as a function of the mean compressive strength of concrete and other factors, such as the amount of entrained air and the type of binder.
In prEN 1992 [34], the value of cmin,dur is tabulated by classifying a structure in two ways: exposure class (EC) and exposure resistance class (ERC). The minimum levels of concrete cover for durability needed that can withstand carbonation are presented in a tabular format for 50 and 100 years of design service life.
In this paper, a least square technique is used to adjust a square root model to the data proposed by prEN 1992 [34] for the minimum levels of concrete cover needed to withstand carbonation. The main assumption of the presented proposal is that the minimum cover value is presented as a function of compressive concrete strength for each of the exposure conditions considered. The adjustment is based on the formulation proposed in [35].

2. Materials and Methods

Steel is stable within concrete thanks to the fact that, when hydrated, cement generates an alkaline environment, pH > 12, in which the metal generates a protective film against corrosion which is called the passive film. This film is very thin, very stable—as long as the alkalinity is maintained—and very impermeable to metal ions. Thanks to the passive film, the steel is effectively protected against corrosion [37,38,39].
The passive film can be damaged or even disappear either because the alkalinity of the concrete is not maintained(pH < 9), mainly induced by the carbonation of the cover, or because of the presence of a high concentration of chlorides in the cover [37]. The time between concreting and the disappearance or damage of the passive film is called the initiation time, see Figure 1.

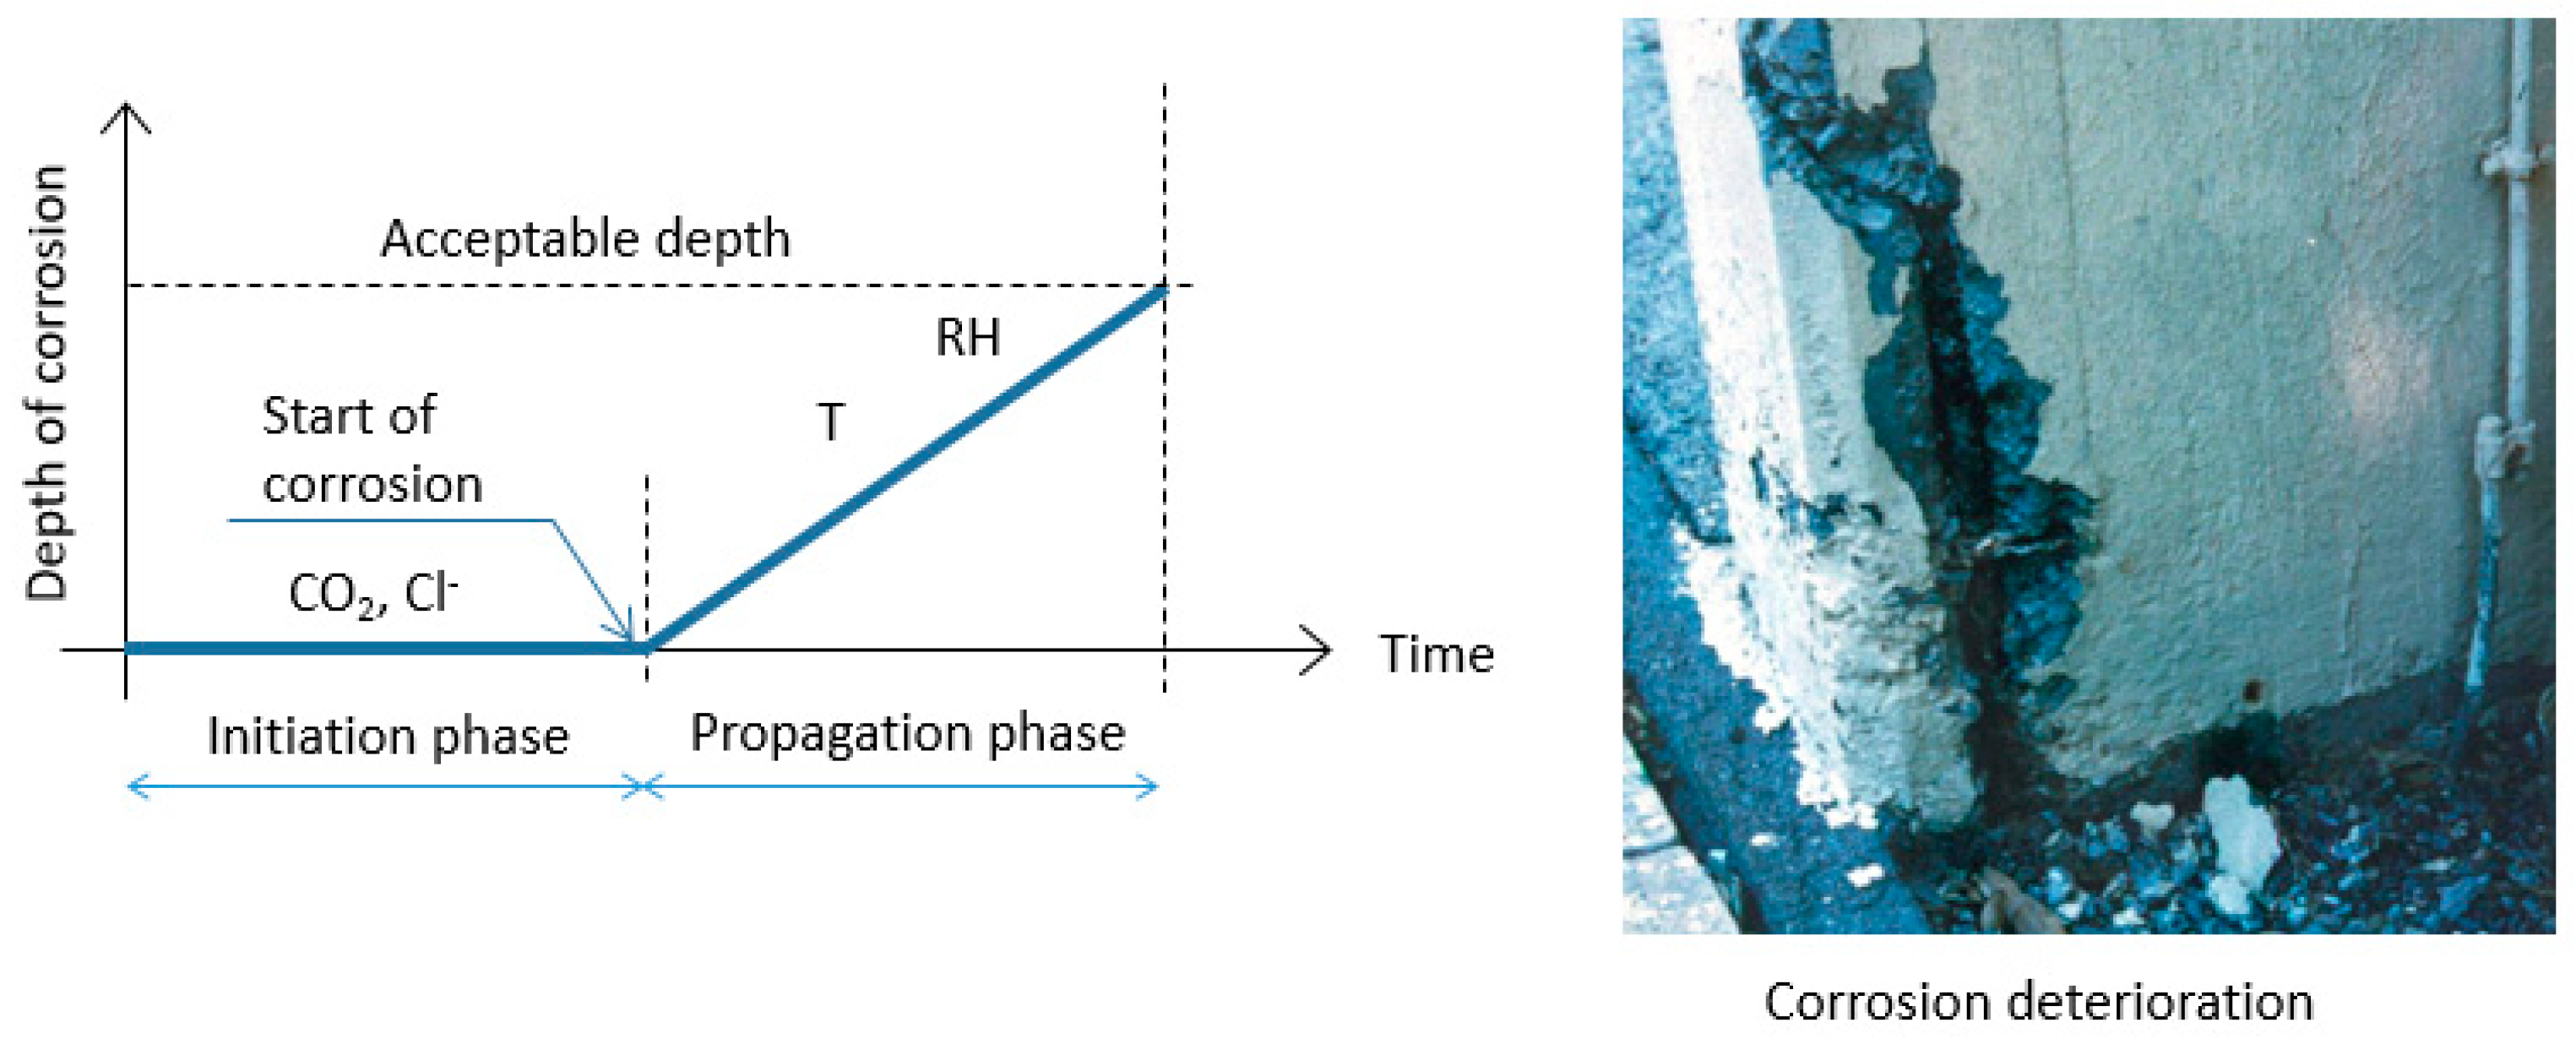
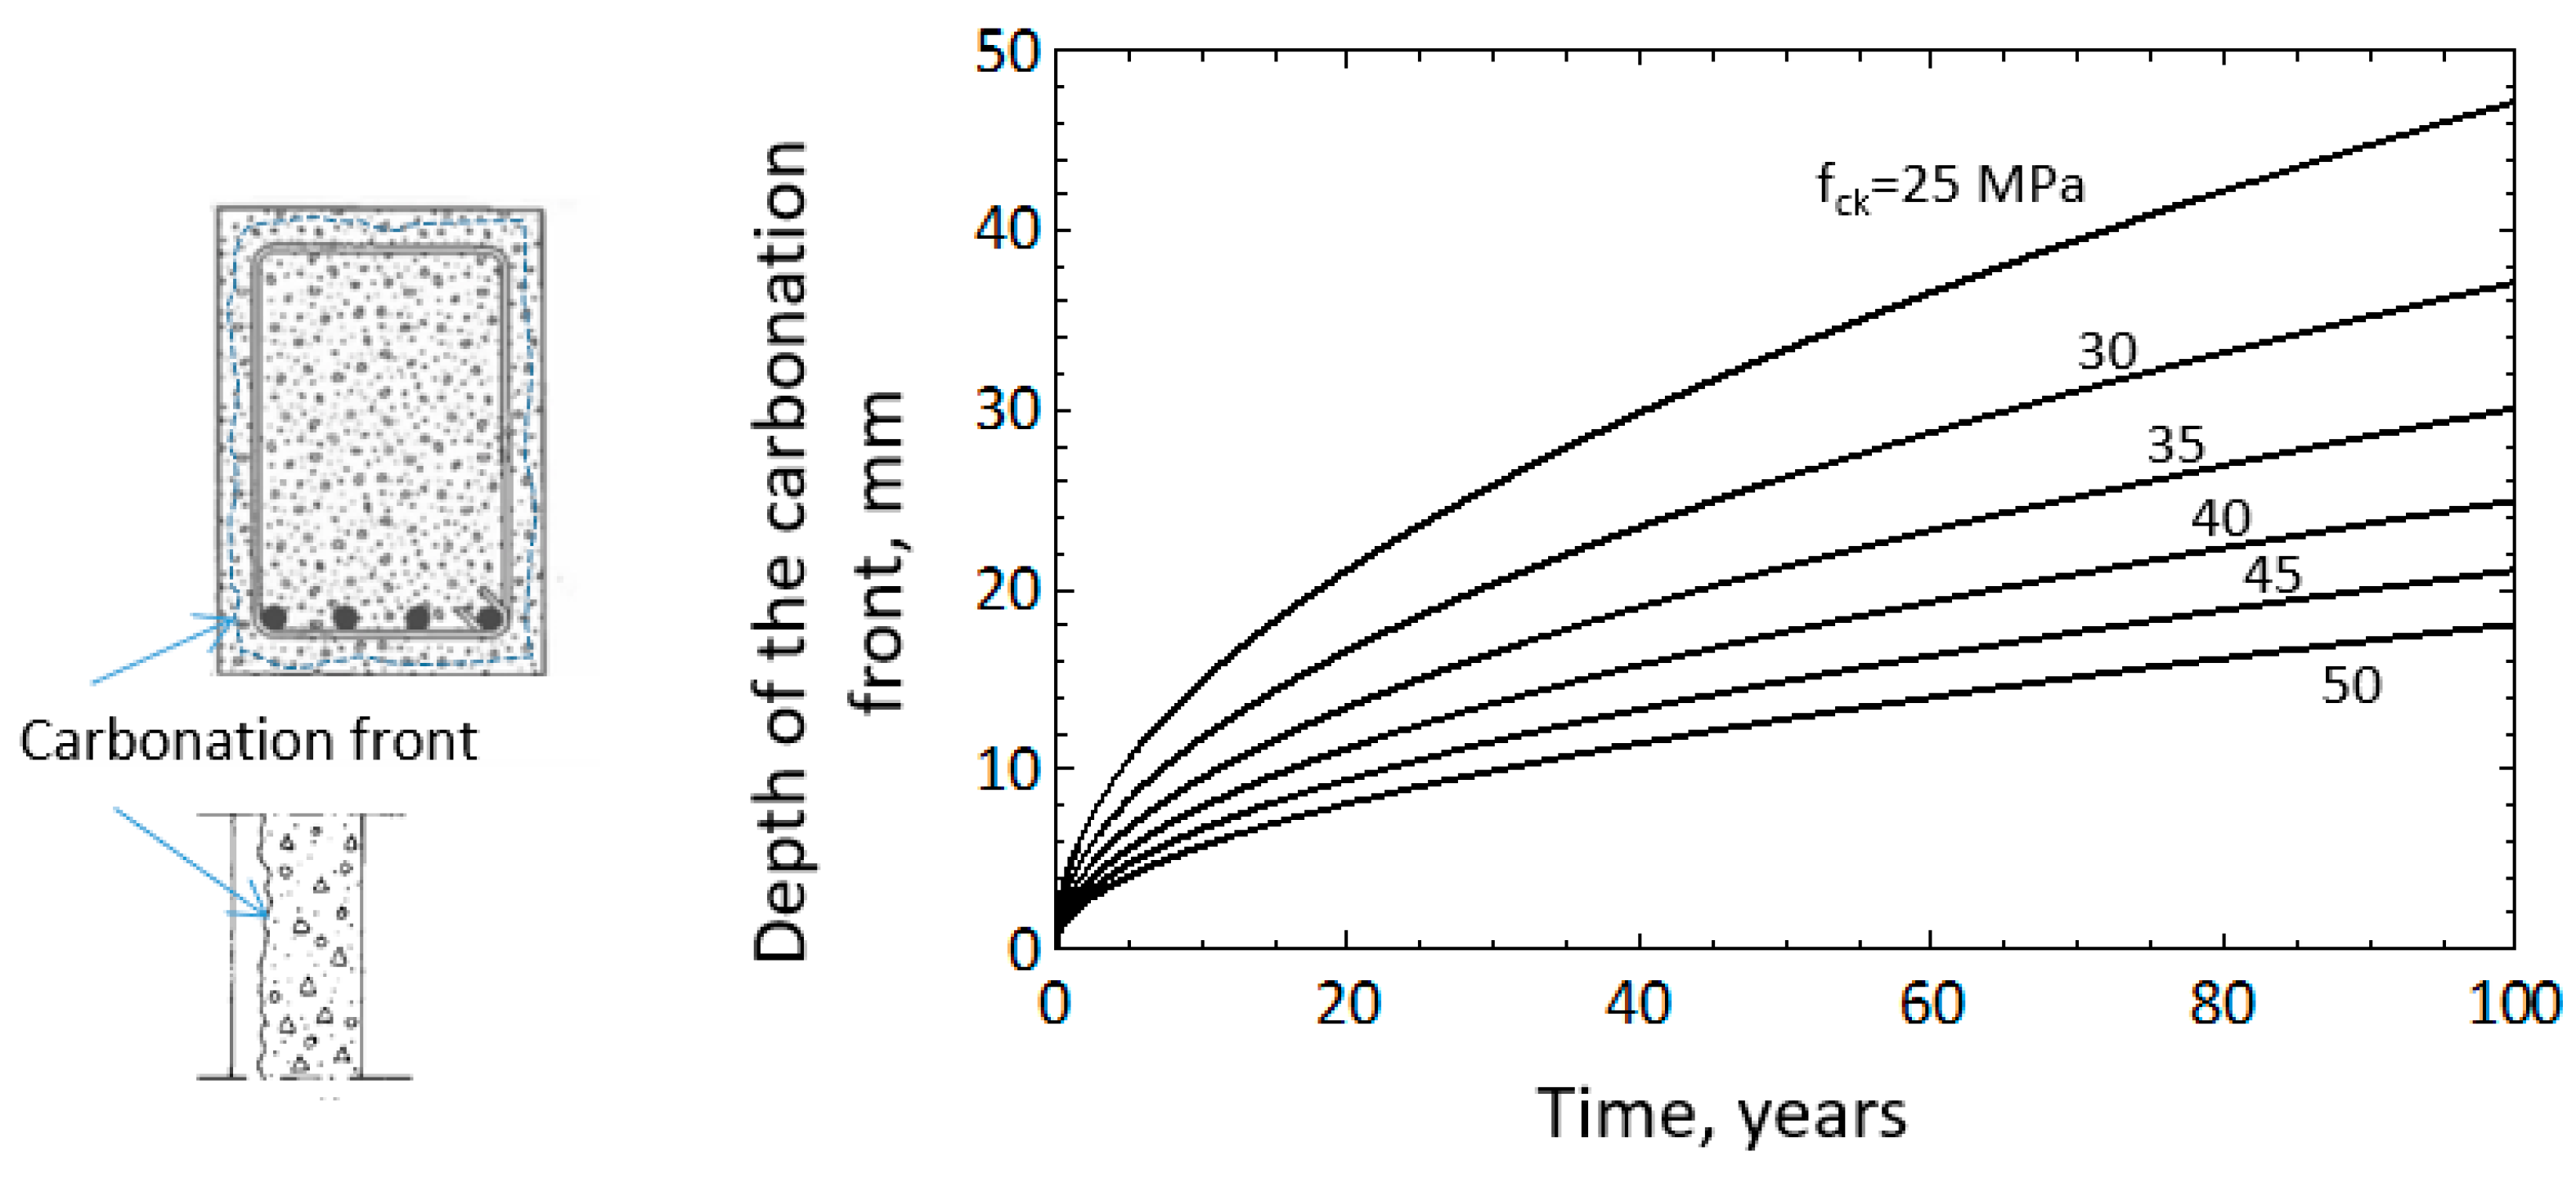
2.1. Carbonation Front, a Deterministic Point of View

Carbonation is the process through which the concrete cover loses its alkalinity, generating a front (carbonation front) that penetrates the RC element inwards.
The moderate solubility of calcium hydroxide (portlandite, Ca(OH)2) formed in the hydration process of cement generates an alkaline environment as a result of the OH ions that it generates in the presence of water [40]. Due to the porous nature of concrete, atmospheric CO2 slowly penetrates through the pores of the concrete and comes into contact with calcium hydroxide, with which it reacts and forms calcium carbonate (CaCO3), which causes a drop in the concrete pH. This reaction causes the high and low pH zones to be divided by the carbonation front (see Figure 2).
The depth of the carbonation front (i.e., the zone affected by low pH) can be approximated by [7]:
x = V CO 2 t
where x is the depth of the carbonation front, t is the time, and V CO 2 is the carbonation rate of the concrete, also called K. Coefficient K depends on environmental conditions (CO2 concentration, humidity, etc.) and concrete characteristics (w/c ratio, type of cement, etc.) and it varies significantly from one structure to another [28]. In [28], the mean compressive strength is used to estimate K using a regression analysis.
As alkalinity decreases, the carbonation front advances. When the carbonation front reaches the reinforcement, it makes the passive film disappear, and so the reinforcing steel is left unprotected against corrosion. In the carbonation process, the passive film completely disappears, and the probability of corrosion reactions occurring is the same at every point on the metal surface, which leads to uniform or generalized corrosion.
As in almost every chemical reaction, moisture must be present for carbonation to occur. However, when the pores are saturated with water, it is difficult for CO2 to penetrate the concrete as it is a gas. Therefore, the maximum carbonation rate is found at levels of intermediate humidity, and the most unfavorable scenarios are the wet–dry cycles. It is interesting to note that carbonation hardly occurs in either very dry concrete (because of the absence of water) or in completely saturated concrete (as CO2 cannot move through the pores that are full of water).
Several mathematical models have been created to describe the evolution of the carbonation front, such as [19]. The following expression (2), extracted from Annex 12 of the Spanish Structural Code [35], provides mean values of the evolution of the depth of the carbonation front over time:
x ( t ) = k ap , carb t               k ap , carb = c env   c air   a   ( f ck + 8 ) b
where kap,carb is the apparent carbonation coefficient in mm/year0.5 so x(t) is obtained in mm, cenv is a coefficient that depends on environmental conditions (see Table 1). cair is 1.0 if air-entrained concrete with less than 4.5% of entrained air (of the volume of the concrete) is used. If the amount of entrained air is greater than or equal to 4.5%, then cair = 0.7. In Equation (2), a and b are dimensionless parameters that depend on the type of binder (see Table 2).
Figure 3 shows the evolution of the carbonation front for Portland cement and for three types of environmental conditions defined by cenv (see Table 1) according to [35], Equation (2). In Figure 3, cair = 1 is considered.
Figure 3 shows that the compressive strength of concrete has a considerable influence on the depth of the carbonation front. From a comparison of the three surfaces in Figure 3, it is evident that when there is a higher risk of corrosion (i.e., for the higher value of cenv), the influence of concrete compressive strength is greater.
In Figure 4, Equation (2) for cenv = 1.0 (structure sheltered from the rain), cair = 1, Portland cement, and fck = 50 MPa is plotted, together with the carbonation depth obtained from the Portuguese standard [28] for equivalent conditions. Figure 4 corresponds to: c = 400 ppm of the environmental carbon dioxide concentration (adopted as a value of reference in prEN 1992 [34]), fck = 50 MPa, fcm = (fck + 8) MPa, k0 = 3 (standard test conditions), k2 = 1 (standard curing), and exposure class XC3 (moderate humidity, which corresponds to the external concrete sheltered from rain in prEN 1992 [34]). According to Eurocode 2, fck is the characteristic concrete cylinder compressive strength and fcm is the mean concrete cylinder compressive strength.
In Annex C of the CEB Bulletin 34 [36], the carbonation depth in uncracked concrete is presented as a function of the design service life (time), and three climatic parameters: the real value of the relative humidity of the carbonated layer (HRreal), the average number of rainy days per year with a volume of precipitation water that is over 25 mm (hNd), and the probability of driving rain obtained from the average distribution of the wind direction during rain events (psR). The two last parameters should be obtained from weather station data. In Figure 4 (shaded area), the range of values of the carbonation depth according to [36] when HRreal varies between 0 and 100% has also been represented for hNd = 182 days (half a year) and psR = 0 (horizontal structural element).
As can be seen in Figure 4, using both the Spanish and Portuguese standards leads to similar values of the evolution of the carbonation depth over time for the most common exposure class [28], and the values given by the Portuguese standard are slightly higher than those estimated by the Spanish Structural Code [35] for each period of time. Moreover, the carbonation depths obtained from both standards lie within the range defined by the CEB Bulletin 34 [36].

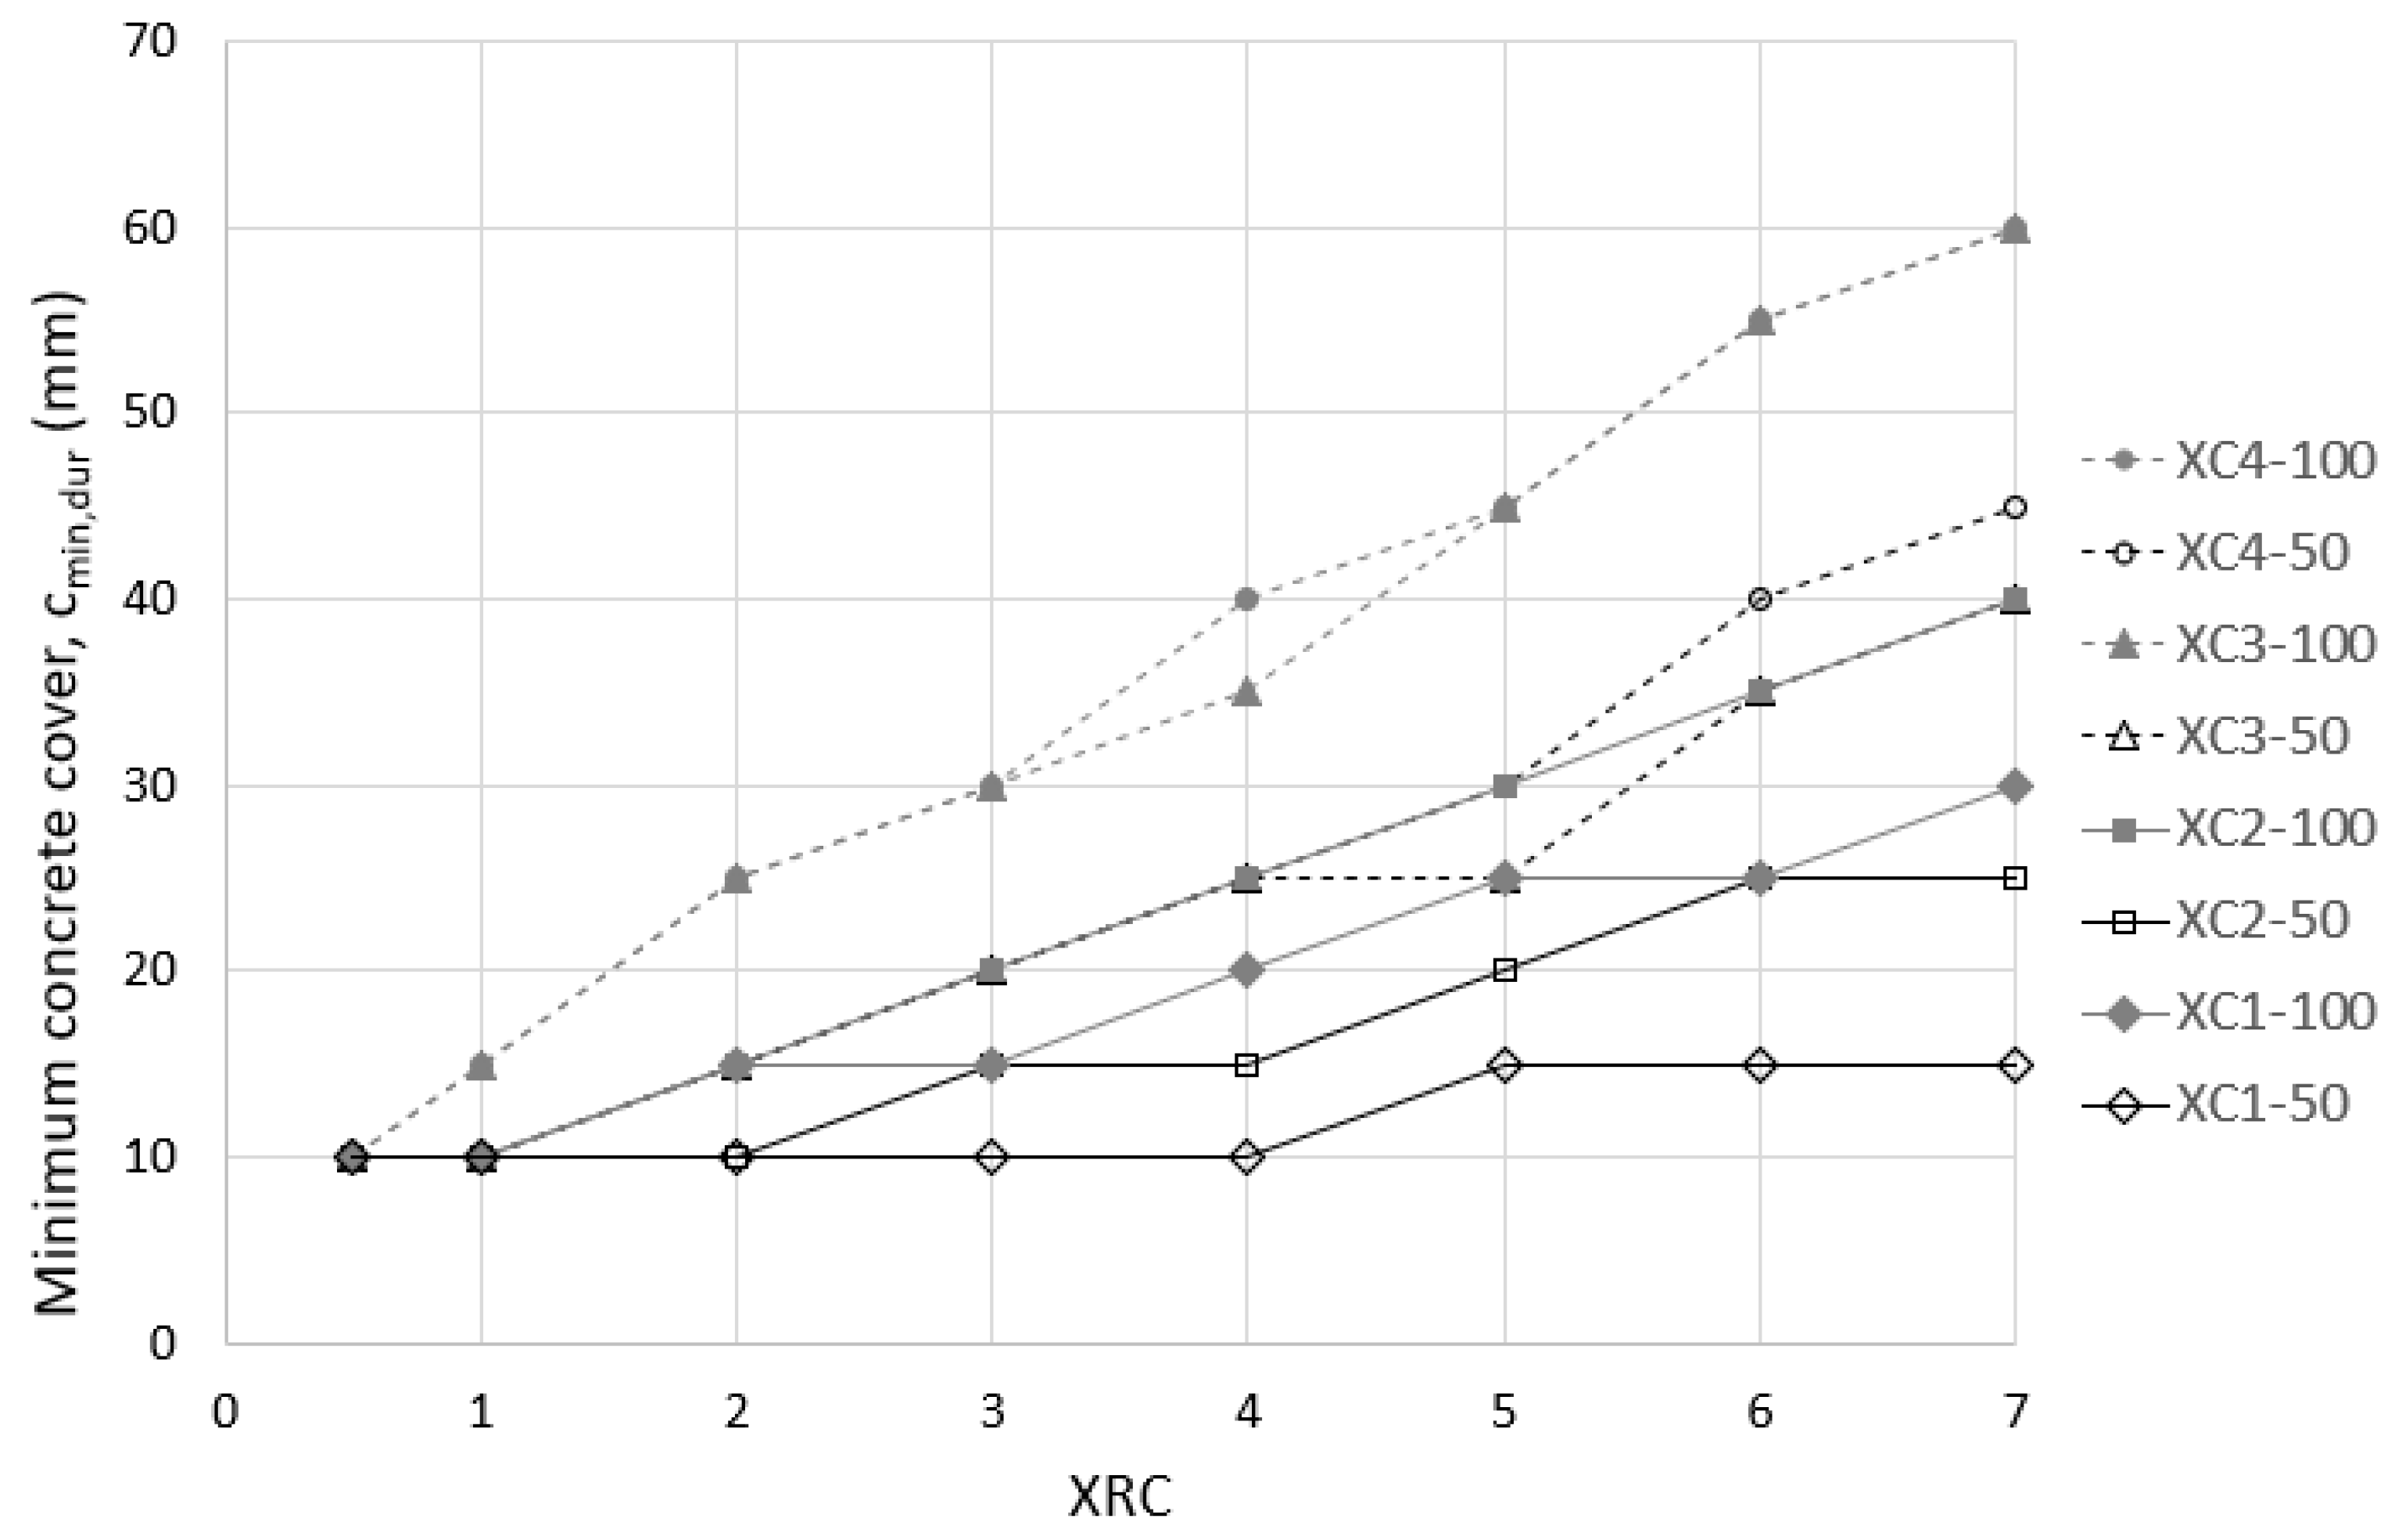
2.2. Minimum Cover Required for Protection against Carbonation in prEN 1992

In prEN 1992 [34], the minimum concrete cover (cmin,dur) for protection of the reinforcement against corrosion induced by carbonation depends on the design service life, the exposure class, and the exposure resistance class (ERC). Each ERC is identified as XRC followed by a number that corresponds to the carbonation rate (see Equation (1)) related to the 90% fractile of the depth of the carbonation front (in mm) after 50 years and under the following reference conditions: 400 ppm CO2 in a constant 65%-RH environment and at 20 °C.
Two design service life values are considered in prEN 1992 [34], 50 and 100 years, and the values of cmin,dur are presented in a tabular format. The values given by prEN 1992 are shown in Figure 5, where XC is the exposure class for carbonation and XRC is the resistance class against corrosion caused by carbonation. To facilitate the identification of the different exposure classes and service design lives, discrete values given by prEN 1992 [34] have been connected with lines in Figure 5.

3. Results

As can be seen in Figure 5, the minimum concrete cover for durability proposed by the European standard prEN 1992 [34] depends on the resistance class against corrosion induced by carbonation (XRC). However, the regulation does not explicitly define the recommended values for XRC.
Moreover, in order to carry out long-term structural designs (e.g., design for a service life of five centuries) or to evaluate the remaining design service life of existing structures, it would be useful to have an expression for the depth of the carbonation front as a function of time, as in [28,32,35].

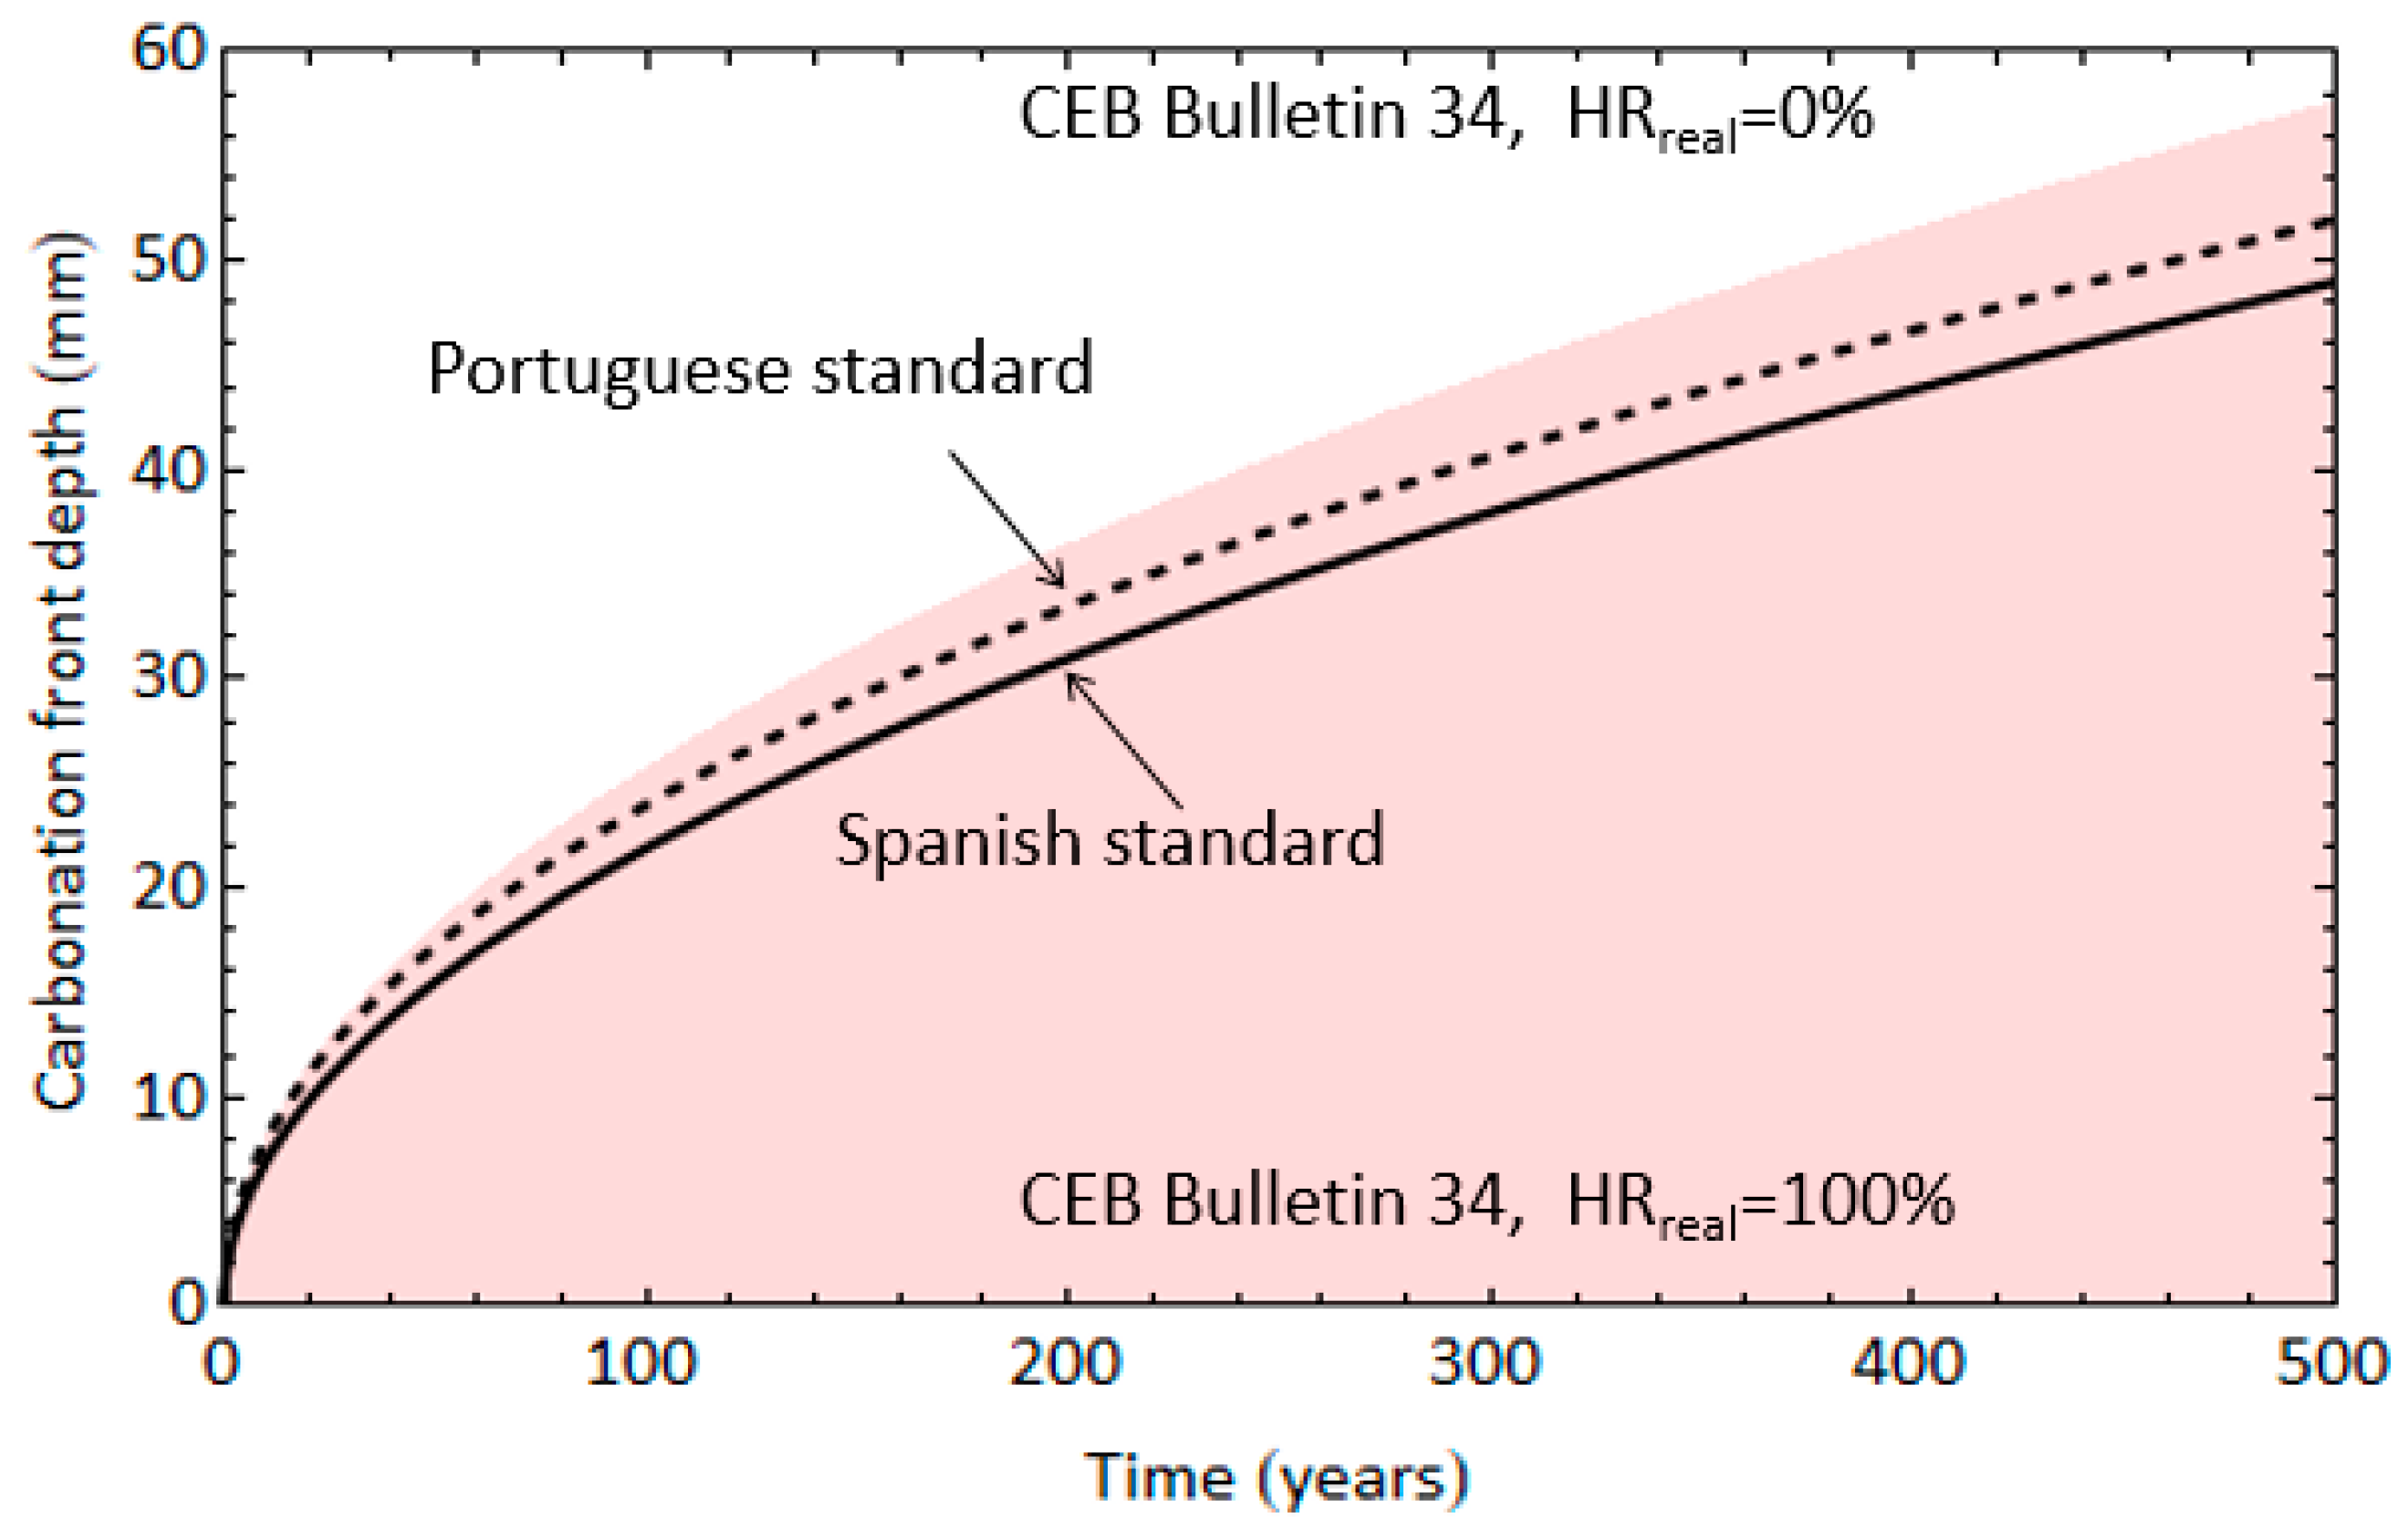
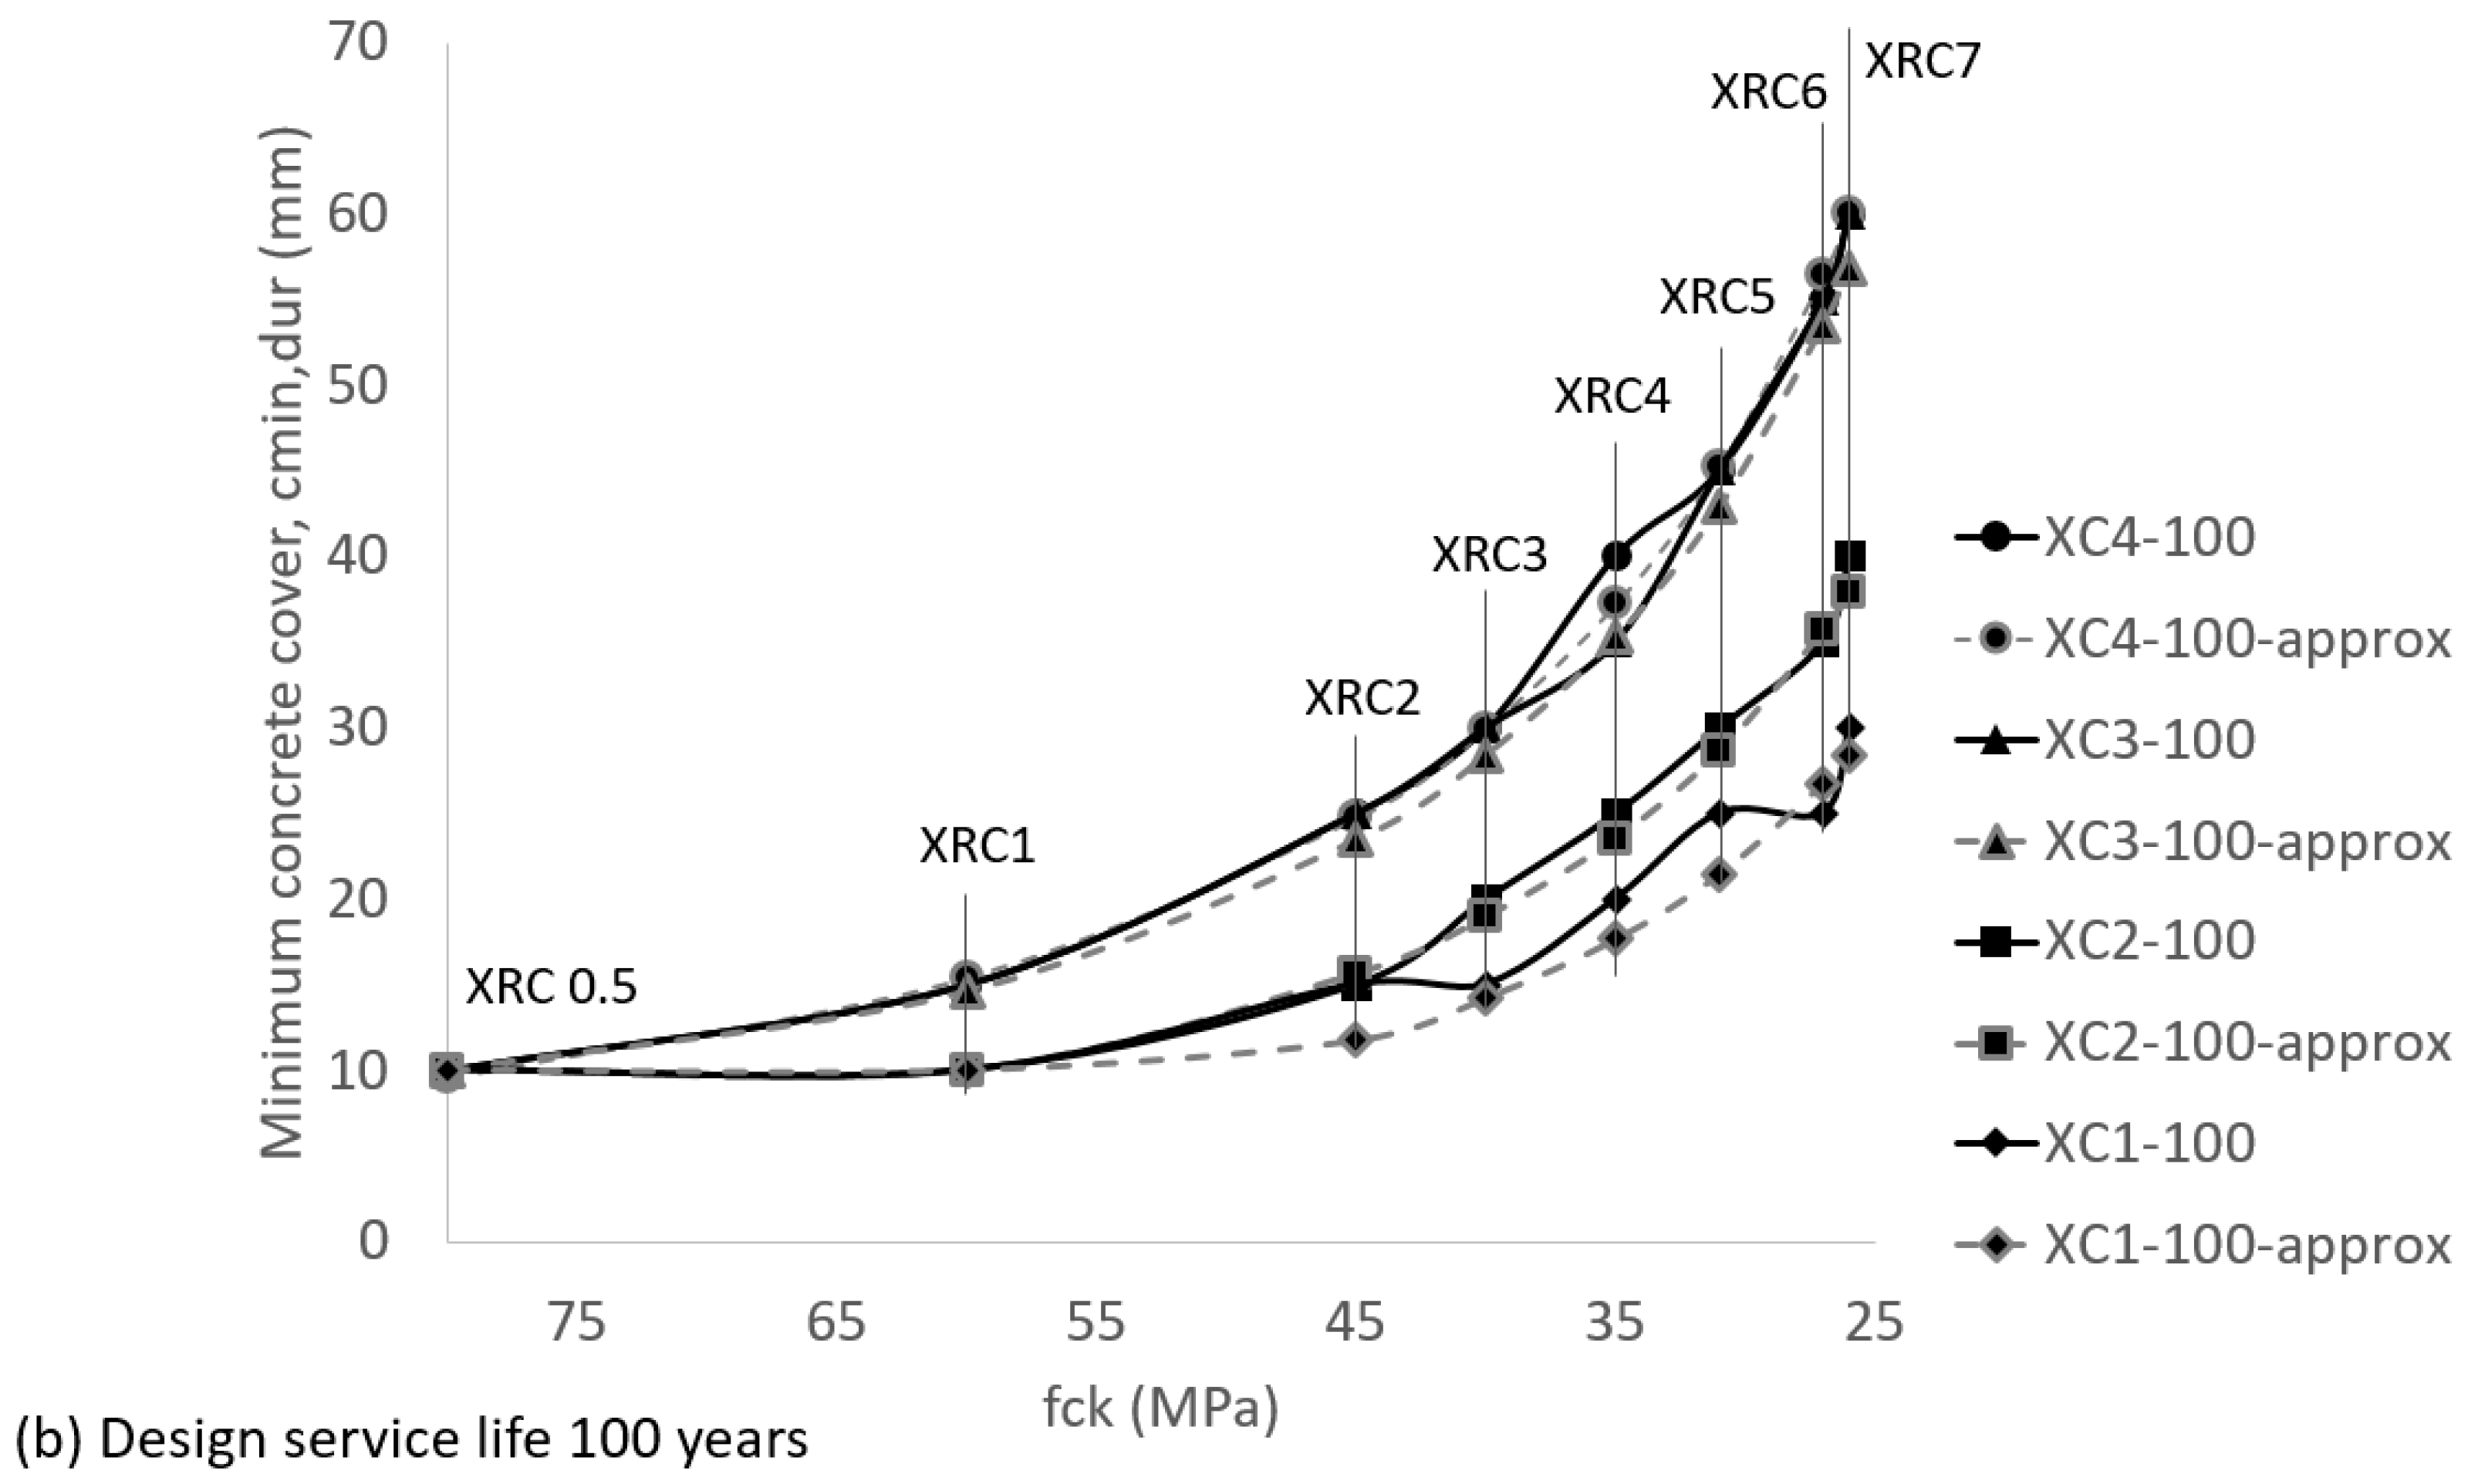
3.1. Continuous Formulation of the Carbonation front Based on Eurocode 2

This paper proposes, as a first approximation, a function similar to the one included in the Spanish Structural Code [35] and given in Equation (2) (Equation (3)). The expression proposed (Equation (3)) must give values that are as close as possible to those given by prEN 1992 [34] (Figure 5).
x ( t ) = k ap , carb * t               k ap , carb * = c env *   c air   a   ( f ck + 1.8 ) b
As can be seen in Equation (2), the term in brackets is the approximate mean compressive concrete strength for cases when not enough statistical data are available:
f cm = f ck + 8   [ MPa ]
with fck in [35] as the characteristic concrete strength, which corresponds to a confidence level of 95%. Equation (4) is also proposed by the European standard [33,41,42]. So, the first change to make in the new expression Equation (3) to fit prEN 1992 [34], is to obtain the compressive concrete strength corresponding to the 90% fractile. Assuming that the compressive strength of concrete follows a standard normal distribution, this value can be obtained by using basic statistical concepts from the following system of equations:
CDF NormalDistribution f ck + 8 ,   σ ,   f ck = 0.05 CDF NormalDistribution f ck + 8 ,   σ ,   f ck + δ = 0.01 Þ σ = 4.9 δ = 1.8
with CDF as the cumulative distribution function and σ as a standard deviation of the standard normal distribution followed by the concrete compressive strength. Solving the system of equations Equation (5), the 90% fractile of the compressive concrete strength is fck + 1.8, which is the value in brackets in Equation (3).
Using least square regression, the parameters c env * and fck in Equation (3) have been adjusted so that they match the values given by prEN 1992 [34], Figure 5. In this work, it has been assumed that each resistance class against corrosion induced by carbonation (XRC) corresponds to a value of the characteristic concrete cylinder compressive strength (fck) for each type of binder and entrained air content. By using this approach, the corrected environmental coefficient (c*env, see Table 1) in Equation (3) has been obtained from a least square regression for the case corresponding to the most common type of cement and with no entrained air (i.e.,: Portland cement and air-entrained concrete with less than 4.5% of entrained air, in volume of the concrete). So, according to [35] the following values for the parameters in Equation (3) are considered as: cair = 1.0, a = 1800, and b = −1.7; see Table 3.
The adjusted values of c*env for each exposure class in prEN 1992 [34] (XC) are summarized in Table 3.
Once the coefficients in Table 2 are known, each XRC class defined in prEN 1992 [34] can be associated with a value of characteristic concrete strength (fck). The corresponding values of characteristic concrete strength (fck), which are the unknown of the adjustment, are adjusted for each type of binder (i.e.,: Portland, Portland +28% fly ash, and Portland + 9% silica fume, see Table 2), and for the two cases related to the entrained air content (under or over 4.5% of entrained air of the volume of the concrete) in [35]. A least square regression has been used for the adjustment.
The adjustment has been carried out by simultaneously considering both of the design service life values in prEN 1992, 50 and 100 years, and the results are summarized in Table 4.
Figure 6 shows the results of the adjustment carried out for Portland cement with an entrained air volume of under 4.5% of the volume of the concrete. For the sake of comparison, the values of the minimum cover for carbonation (cmin,dur) for the four exposure classes, XC1 to XC4, given by prEN 1992 [34] (see Figure 5) are also represented, and they are linked by dashed straight lines in Figure 6, where the term “approx” identifies the adjusted curves. Figure 6a,b represents the design service lives of 50 and 100 years, respectively.
Figure 6 shows that the adjustment proposed is a good fit for the values proposed by prEN 1992 [34], especially for the two higher XC classes.
As can be seen in Figure 6, the concrete characteristic compressive strength and the minimum cover for carbonation proposed by prEN 1992 [34] correlate well, which confirms that, as proposed in this work, the value of fck could be suitable for obtaining a first approximation of the XRC class, as proposed in Table 4.
Other conditions have to be added to the results in Figure 6 if the limitations of the indicative strength classes stated in EN 206 [41] for each exposure class are considered; see Table 5.
Moreover, the ‘square root of time’ expression proposed, Equation (3), enables other design service lives (not only 50 and 100 years) to be studied, which is very useful, as the case studies below show.

3.2. Case Studies

In order to demonstrate the usefulness of the proposal, it will be applied to two case studies.

3.2.1. The Green Tunnel on the London–Birmingham High Speed Railway Line

The prerequisites for concrete strength and nominal cover given by the authority for the pre-cast tunnel known as the Green Tunnel for the high-speed railway line between London and Birmingham are summarized in Table 6.
As Figure 6 shows, there is almost no difference between the minimum cover against carbonation given by prEN 1992 [34] for classes XC3 and XC4. In this example, both exposure classes are considered by using Equation (3) with cair = 1.0 and c*env = 0.90 for XC3 class and c*env = 0.95 for XC4 (see Table 3).
Figure 7 represents the required minimum cover (i.e., the depth of the carbonation front) as a function of the design service life (time) for fck = 50 MPa and for these two exposure classes. Figure 7 shows that, as a first approximation, the life expectancy of the Green Tunnel is about 500 years. This result is based on the continuous approximation proposed in this work (Equation (3)), which is based on prEN1992 [34].

3.2.2. Camino de Ronda Street Buildings (Granada, Spain)

Camino de Ronda is the longest street in Granada, and it is also one of the most densely populated areas of the city. Along this street, reinforced concrete buildings of various ages can be found. As a preliminary approach, based on the regulations in force during the construction of the buildings, we have considered, as a working hypothesis, that the characteristic strength of concrete is 25 MPa in concrete manufactured up until 1970, and 30 MPa from 1970 onwards. The concrete cover in the exposed areas have been assumed to be 30 mm. The concrete cover in the internal areas have been assumed to be 15 mm for buildings from before 1970 and 25 mm for later ones. According to Equation (3), the initiation time is 25 years for pre-1970 buildings and 44 years for post-1970 buildings, see Figure 8. These premises are the worst-case scenario, given that a concrete structure is always protected from environmental factors, by plaster coatings, paint, bricks, etc.
After the initiation time, the remaining service life depends on the result of periodic inspections. Note that the appearance of cracks parallel to the reinforcement requires an exhaustive structural analysis to determine the bearing capacity of the structure.
The results obtained have been summarized in Figure 9, which indicate when periodic inspections for the buildings of Camino de Ronda are necessary based on the estimated end of the initiation times.

4. Limitations of the Study

The aim of the present study is to establish the relationship between XRC classes and concrete strength for regular concrete, and not to replace the XRC classes introduced by the new version of Eurocode 2. It should be noted that the presented formulation may not be applicable if impermeability of the concrete or carbonation resistance is achieved through means other than increasing the concrete strength.

5. Conclusions

The most significant finding of this paper is that the evolution of the carbonation front and the expected service life of a structure can be approximated using the new Eurocode 2, without relying on the resistance class against carbonation-induced corrosion. Instead, only the strength resistance of the concrete and the exposure class are used.
Additionally, the following conclusions are addressed:
  • The presented study proposes a new continuous formulation for the carbonation front.
  • The formulation is based on the ‘square root of time’ expression given by the relevant literature and is in accordance with the minimum cover proposed by prEN 1992.
  • The minimum cover required to protect against carbonation can be determined from the proposed expression, which is formulated as a function of the compressive strength of concrete.
  • The proposed expression allows for the indicative strength classes against corrosion induced by carbonation proposed by prEN 1992 to be considered.
  • The new expression is shown to be a useful tool for the design of extremely durable structures.

Author Contributions

Conceptualization, E.H.-M. methodology, E.H.-M. and L.M.G.-M.; formal analysis, L.H.-G. and L.M.G.-M.; investigation, L.H.-G.; data curation, E.M.; writing—original draft, L.H.-G.; writing—review and editing, L.H.-G. and L.M.G.-M.; visualization, E.M.; supervision, E.H.-M. project administration, E.H.-M. funding acquisition, E.H.-M. All authors have read and agreed to the published version of the manuscript.

Funding

This work is part of the HYPERION project (https://www.hyperion-project.eu/, accessed on 1 April 2003). HYPERION has received funding from the European Union’s Framework Programme for Research and Innovation (Horizon 2020) under grant agreement no. 821054. This work also was supported by the Spanish Government (Ministerio de Ciencia, Innovación y Universidades) as part of the Research Projects RTI2018-101841-B-C21 and RTI2018-101841-B-C22 (MINECO/FEDER). The content of this publication is the sole responsibility of UGR and does not necessarily reflect the opinion of the European Union.

Institutional Review Board Statement

Not applicable.

Informed Consent Statement

Not applicable.

Data Availability Statement

Data are available upon reasonable request to the authors.

Conflicts of Interest

The authors declare no conflict of interest.

References

  1. Sánchez, J.; Torres, J.E.; Rebolledo, N. Brittle Behavior of Corroded Rebars. Hormigón Acero 2020, 1–7. [Google Scholar] [CrossRef]
  2. Williamson, S.J.; Clark, L.A. Effect of Corrosion and Load on Reinforcement Bond Strength. Struct. Eng. Int. 2002, 12, 117–122. [Google Scholar] [CrossRef]
  3. Val, D.V.; Stewart, M.G. Reliability Assessment of Ageing Reinforced Concrete Structures—Current Situation and Future Challenges. Struct. Eng. Int. 2009, 19, 211–219. [Google Scholar] [CrossRef]
  4. de Boer, A.; Gulikers, J. Effect of Reinforcement Geometry on the Probability of Corrosion Initiation in Reinforced Concrete Structures. Struct. Eng. Int. 2009, 19, 198–202. [Google Scholar] [CrossRef]
  5. Carbonell-Márquez, J.F.; Gil-Martín, L.M.; Fernández-Ruiz, M.A.; Hernández-Montes, E. Procedure for the Assessment of the Residual Capacity of Corroded B-Regions in RC Structures. Constr. Build. Mater. 2016, 121, 519–534. [Google Scholar] [CrossRef]
  6. Hernández-Montes, E.; Fernández-Ruiz, M.A.; Carbonell-Márquez, J.F.; Gil-Martín, L.M. Residual Capacity Assessment of Reinforced Concrete D-Regions Affected by Corrosion. Constr. Build. Mater. 2020, 263, 120228. [Google Scholar] [CrossRef]
  7. Tuutti, K. Corrosion of Steel in Concrete. Ph.D. Thesis, Swedish Cement and Concrete Research Institute, Stockholm, Sweden, 1982. [Google Scholar]
  8. Possan, E.; Dal Molin, D.C.C.; Andrade, J.J.O. A Conceptual Framework for Service Life Prediction of Reinforced Concrete Structures. J. Build. Pathol. Rehabil. 2018, 3, 2. [Google Scholar] [CrossRef]
  9. Andrade, C. Future Trends in Research on Reinforcement Corrosion. In Corrosion of Steel in Concrete Structures; Poursaee, A., Ed.; Woodhead Publishing: Oxford, UK, 2016; pp. 269–288. ISBN 978-1-78242-381-2. [Google Scholar]
  10. Kouassi, F.A.; Dauxois, J.-Y.; Duprat, F.; De Larrard, T.; Deby, F. Engineering Statistical Models for Carbonation Depth. Eur. J. Environ. Civ. Eng. 2022, 27, 215–238. [Google Scholar] [CrossRef]
  11. Isaksson, R.; Rosvall, M.; Espuny, M.; Nunhes, T.V.; de Oliveira, O.J. How Is Building Sustainability Understood?—A Study of Research Papers and Sustainability Reports. Sustainability 2022, 14, 12430. [Google Scholar] [CrossRef]
  12. Andrade, M.C.; Castro-Borges, P.; Pazini, E. Detection of Corrosion Risk besides Patch Repairs. Hormigón Acero 2021, 72, 41–58. [Google Scholar]
  13. Chinchón, S.; Sánchez, J.; Ortega, L.M.; García, J.; Rebolledo, N.; Torres, J.E.; Perilbáñez, J. Nueva Metodología Para La Delimitación de Las Zonas a Reparar de Un Hormigón Afectado Por Corrosión. Hormigón Acero 2022, 73, 51–57. [Google Scholar] [CrossRef]
  14. Ali, M.E.; Hasan, M.F.; Siddiqa, S.; Molla, M.M.; Nasrin Akhter, M. FVM-RANS Modeling of Air Pollutants Dispersion and Traffic Emission in Dhaka City on a Suburb Scale. Sustainability 2023, 15, 673. [Google Scholar] [CrossRef]
  15. Silva, A.; Neves, R.; De Brito, J. Statistical Modelling of Carbonation in Reinforced Concrete. Cem. Concr. Compos. 2014, 50, 73–81. [Google Scholar] [CrossRef]
  16. Andrade, C.; Alonso, C.; Gonzalez, C. Remaining Service Life of Corroding Structures; International Association for Bridge and Structural Engineering: Zurich, Switzerland, 2020. [Google Scholar]
  17. Keršner, Z.; Teplý, B.; Novak, D. Uncertainty in Service Life Prediction Based on Carbonation of Concrete. In Durability of Building Materials and Components 7; Sjostrom, C., Ed.; Routledge: London, UK, 1996; pp. 1–8. ISBN 9781315025025. [Google Scholar]
  18. Saetta, A.V.; Vitaliani, R.V. Experimental Investigation and Numerical Modeling of Carbonation Process in Reinforced Concrete Structures Part I: Theoretical Formulation. Cem. Concr. Res. 2004, 34, 571–579. [Google Scholar] [CrossRef]
  19. Papadakis, V.G.; Vayenas, C.G.; Fardis, M.N. Experimental Investigation and Mathematical Modeling of the Concrete Carbonation Problem. Chem. Eng. Sci. 1991, 46, 1333–1338. [Google Scholar] [CrossRef]
  20. Papadakis, V.G.; Vayenas, C.G.; Fardis, M.N. Fundamental Modeling and Experimental Investigation of Concrete Carbonation. ACI Mater. J. 1991, 88, 363–373. [Google Scholar] [CrossRef]
  21. Hills, T.P.; Gordon, F.; Florin, N.H.; Fennell, P.S. Statistical Analysis of the Carbonation Rate of Concrete. Cem. Concr. Res. 2015, 72, 98–107. [Google Scholar] [CrossRef]
  22. Saetta, A.V.; Vitaliani, R.V. Experimental Investigation and Numerical Modeling of Carbonation Process in Reinforced Concrete Structures: Part II. Practical Applications. Cem. Concr. Res. 2005, 35, 958–967. [Google Scholar] [CrossRef]
  23. Endale, S.A.; Taffese, W.Z.; Vo, D.H.; Yehualaw, M.D. Rice Husk Ash in Concrete. Sustainability 2023, 15, 137. [Google Scholar] [CrossRef]
  24. Marchand, J.; Samson, E. Predicting the Service-Life of Concrete Structures—Limitations of Simplified Models. Cem. Concr. Compos. 2009, 31, 515–521. [Google Scholar] [CrossRef]
  25. Chen, Y.; Liu, P.; Yu, Z. Effects of Environmental Factors on Concrete Carbonation Depth and Compressive Strength. Materials 2018, 11, 2167. [Google Scholar] [CrossRef] [PubMed]
  26. Ekolu, S.O. Model for Practical Prediction of Natural Carbonation in Reinforced Concrete: Part 1-Formulation. Cem. Concr. Compos. 2018, 86, 40–56. [Google Scholar] [CrossRef]
  27. Zhu, J.; Zhang, R.; Zhang, Y.; He, F. The Fractal Characteristics of Pore Size Distribution in Cement-Based Materials and Its Effect on Gas Permeability. Sci. Rep. 2019, 9, 17191. [Google Scholar] [CrossRef]
  28. Monteiro, I.; Branco, F.A.; De Brito, J.; Neves, R. Statistical Analysis of the Carbonation Coefficient in Open Air Concrete Structures. Constr. Build. Mater. 2012, 29, 263–269. [Google Scholar] [CrossRef]
  29. You, X.; Hu, X.; He, P.; Liu, J.; Shi, C. A Review on the Modelling of Carbonation of Hardened and Fresh Cement-Based Materials. Cem. Concr. Compos. 2022, 125, 104315. [Google Scholar] [CrossRef]
  30. Bakker, R. Corrosion of Steel in Concrete, “Initiation Period”; Schiessl, P., Ed.; RILEM; Chapman & Hall: London, UK, 1988. [Google Scholar]
  31. Ghanooni-Bagha, M.; YekeFallah, M.R.; Shayanfar, M.A. Durability of RC Structures against Carbonation-Induced Corrosion under the Impact of Climate Change. KSCE J. Civ. Eng. 2020, 24, 131–142. [Google Scholar] [CrossRef]
  32. Gonçalves, A.F.; Ferreira, M.J.E.; Ribeiro, A.B. The New Lnec Specifications on Reinforced Concrete Durability. In Proceedings of the International RILEM Workshop on Integrated Service Life Modelling of Concrete Structures, Guimarães, Portugal, 5–6 November 2007; pp. 131–140. [Google Scholar]
  33. UNE-EN 1992-1-1; Eurocode 2: Design of Concrete Structures—Part 1–1: General Rules and Rules for Buildings. European Committee for Standardization: Brussels, Belgium, 2013.
  34. prEN 1992-1-1; Eurocode 2: Design of Concrete Structures—Part 1–1: General Rules and Rules for Buildings, Bridges and Civil Engineering Structures. European Committee for Standardization: Brussels, Belgium, 2022.
  35. MITMA. Código Estructural. Volumenes 1 y 2; MITMA: Madrid, Spain, 2021. [Google Scholar]
  36. fib-International Federation for Structural Concrete. Bulletin 34: Model Code for Service Life Design; fib: Lausanne, Switzerland, 2006. [Google Scholar]
  37. Fonseca, E.T.; Vellasco, P.C.G.D.S.; Vellasco, M.M.B.R.; de Andrade, S.A.L. A Neuro-Fuzzy Evaluation of Steel Beams Patch Load Behaviour. Adv. Eng. Softw. 2008, 39, 558–572. [Google Scholar] [CrossRef]
  38. Sanchez, M.; Alonso, M.C. Repassivation of Steel Rebars after an Electrochemical Chlorides Removal Treatment by Simultaneous Application of Calcium Nitrite. In Concrete under Severe Conditions: Environment and Loading, Proceedings of the 6th International Conference on Concrete under Severe Conditions, CONSEC’10, Yucatán, Mexico, 7–9 June 2010; CRC Press/Balkema: Leiden, The Netherlands, 2010; Volume 2, pp. 1109–1114. [Google Scholar]
  39. Alonso, M.C.; García Calvo, J.L.; Hidalgo, A.; Fernández Luco, L. 10—Development and Application of Low-PH Concretes for Structural Purposes in Geological Repository Systems. In Geological Repository Systems for Safe Disposal of Spent Nuclear Fuels and Radioactive Waste; Ahn, J., Apted, M.J., Eds.; Woodhead Publishing Series in Energy; Woodhead Publishing: Sawston, UK, 2010; pp. 286–322. ISBN 978-1-84569-542-2. [Google Scholar]
  40. Andrade, C. Corrosion Of Steel Reinforcement. WIT Trans. State-of-the-Art Sci. Eng. 2007, 28, 185–216. [Google Scholar] [CrossRef]
  41. UNE EN 206-1:2008; Concrete —Part 1: Specification, Performance, Production and Conformity. Asociación Española de Normalización y Certificación (AENOR): Madrid, Spain, 2008.
  42. Hernández, L.; Gil-Martín, L.M. A Comparison of the Most Important Properties of Structural Concrete: European Standards versus American Standards. Eur. J. Environ. Civ. Eng. 2022, 1–14. [Google Scholar] [CrossRef]
Figure 1. Conceptual scheme of a reinforcement corrosion process as a function of time, adapted from [7].
Sustainability 15 07976 g001
Figure 2. Depth of the carbonation front as a function of time.
Sustainability 15 07976 g002
Figure 3. Evolution of the carbonation front for Portland cement according to [35].
Sustainability 15 07976 g003
Figure 4. Comparison of the evolution of the carbonation front for Portland cement according to the Spanish Structural Code [35] and the Portuguese standard LNEC E-465 [28] for XC3 exposure class, cair = 1.0, and fck = 50 MPa. The range of values of the carbonation depth according to Annex C of CEB Bulletin 34 [36] for hNd = 182 days, psR = 0 for HRreal ranging between 0 and 100% is shown as a shaded area.
Sustainability 15 07976 g004
Figure 5. Minimum concrete cover for protection against oxidation induced by carbonation (XC1 = dry, XC2 = wet, or permanent high humidity, XC3 = moderate humidity, XC4 = cyclic wet and dry).
Sustainability 15 07976 g005
Figure 6. Relationship between the XRC class and the characteristic concrete strength for Portland cement with a volume of entrained air of under 4.5% of the volume of the concrete. Design service lives of (a) 50 and (b) 100 years.
Sustainability 15 07976 g006aSustainability 15 07976 g006b
Figure 7. Expected service life of the Green Tunnel.
Sustainability 15 07976 g007
Figure 8. Evolution of the carbonation front in case study 2, Equation (3).
Sustainability 15 07976 g008
Figure 9. Period of time for periodic inspections.
Sustainability 15 07976 g009
Table 1. Type of environment.
Environmentcenv
Sheltered from the rain1.0
Exposed to rain0.5
Buried elements, above the water table0.3
Buried elements, below the water table0.2
Table 2. Type of binder.
Binderab
Portland cement1800−1.7
Portland cement +28% fly ash360−1.2
Portland cement + 9% silica fume400−1.2
Table 3. Environmental coefficients adjusted ( c env * ) to fit the minimum cover for carbonation in prEN 1992 [34].
Adjusted Exposure Classes for CarbonationXC1XC2XC3XC4
c env * 0.450.600.900.95
Table 4. Relationship between the resistance class against corrosion induced by carbonation (XRC) and the characteristic concrete cylinder compressive strength (fck [MPa]) for each type of binder and volume of entrained air content.
Type of BinderPortlandPortland + 28% Fly AshPortland + 9% Silica Fume
Entrained Air>4.5%<4.5%>4.5%<4.5%>4.5%<4.5%
ERC in prEN 1992 [34]XRC 0.5638094128103139
XRC 1496066907398
XRC 2364544594865
XRC 3324036493954
XRC 4283530413345
XRC 5253126352838
XRC 6222721292332
XRC 7212620272129
Table 5. Indicative strength class for corrosion induced by carbonation for each exposure class according to EN 206 [41].
Exposure ClassXC1XC2XC3/XC4
Strength class≥C20/25≥C25/30≥C30/37
Table 6. Prerequisites for the design of the Green Tunnel.
ElementPrecast/Cast In SituNominal Cover *
Inner FaceOuter Face
Arch, Arch wall, Side Wall, FootingPrecast (C50/60)45 mm55 mm
Central WallPrecast (C50/60)45 mm45 mm
Invert/Base SlabCast-in situ (C50/60)60 mm70 mm
* Clear cover to main reinforcement = nominal cover + stirrup diameter.
Disclaimer/Publisher’s Note: The statements, opinions and data contained in all publications are solely those of the individual author(s) and contributor(s) and not of MDPI and/or the editor(s). MDPI and/or the editor(s) disclaim responsibility for any injury to people or property resulting from any ideas, methods, instructions or products referred to in the content.

