
Examining the Potential of Marine Renewable Energy: A Net Energy Perspective

1
Centre for Ecological Research and Forestry Applications (CREAF), 08193 Cerdanyola del Vallès, Spain
2
GRC Geociències Marines, Departament de Dinàmica de la Terra i de l’Oceà, Facultat de Ciències de la Terra, Universitat de Barcelona, 08028 Barcelona, Spain
3
Institute of Marine Sciences (ICM), Physical and Technological Oceanography Department, Spanish National Research Council (CSIC), 08003 Barcelona, Spain
*
Authors to whom correspondence should be addressed.
Sustainability 2023, 15(10), 8050; https://doi.org/10.3390/su15108050
Submission received: 30 March 2023
/
Revised: 8 May 2023
/
Accepted: 9 May 2023
/
Published: 15 May 2023
(This article belongs to the Special Issue From COP 26 to COP 27: Contributions of Systems Approaches to Address the Challenges Ahead)
Abstract
:It is often claimed that marine renewable energy alone could meet the electricity demand of current and future human societies. However, such claims are based on highly uncertain estimations of the global potentials of marine renewable energy sources (including tidal, ocean currents, wave, offshore wind and salinity and thermal gradients), and do not take into account the embedded energy of current technologies. To better understand the effective potential of marine energy, we conducted a literature review of its gross, technical, economic and sustainable potentials, as well as the energy return on investment (EROI), and estimated the net energy potential. We found that all marine technologies could provide a maximum energy surplus of 57,000 /. This figure goes down to when excluding offshore wind. The previous figures do not include the contribution from ocean currents, for which no reliable estimates of global potentials and EROIs could be obtained. Due to its high upfront costs and environmental impacts and low social acceptance, no additional tidal range capacity expansion is envisioned. Similarly, the combination of a low sustainable potential and the low EROI makes the large-scale exploitation of salinity gradients unlikely with current technologies. Including all technologies, the average EROI of marine energy is , but excluding offshore wind reduces the average EROI to . While we did consider sustainability constraints for some marine energy sources, our estimation of marine net energy potential primarily relied on technical factors and did not account for economic and legal constraints. Therefore, the results presented here should be interpreted as an upper bound for the actual net energy contribution of marine energy sources to the global energy mix.
1. Introduction
Most studies agree on the fact that the global marine energy resource is considerably larger than the world’s annual electricity demand [1,2,3,4], which in 2021 was (27,447.4 /) [5]. Although its theoretical potential is evident, estimates of the amount of energy that may be extracted are uncertain and the energy potential of the different technologies vary significantly depending on the source [4].
At present, just a small fraction of such a resource is currently being exploited through 30 operational ocean energy facilities around the world: fourteen for tidal energy, fourteen for wave energy, one for salinity gradient (SGE), and only one for thermal gradient (OTEC), as reported in the Ocean Energy Systems 2022 Annual Report [6]. There are currently no operational ocean current platforms. Asia (261 ) and Europe ( 253 ) account for approximately equal portions of the total installed capacity worldwide (data values for 2022 from [6]), which was between 517 MW [7] and 524 MW in the period 2019–2022, with a total power generation slightly below 1 / ( /) [8]. In fact, the tidal barrage systems of La Rance (France) and Sihwa (the Republic of Korea) represent more than 90% of the total installed capacity worldwide, with 240 and 254 of the installed capacity, respectively [7,9].
Although offshore wind is not oceanic energy, it is usually included among marine technologies [10,11,12] since it is located in the same type of environment, and many synergies can be potentially found between the two [13,14]. Offshore wind resources are also vast. In fact, it is widely recognized that offshore wind energy has a greater potential for electricity generation than onshore wind energy, due to higher and more consistent wind speeds in offshore locations [15,16]. However, similar to the other marine resources, the offshore wind resource is mostly untapped. Indeed, of the total 830 of installed wind capacity in 2021, only 7% were offshore wind farms [17].
Despite the great theoretical potentials, technical [18,19], legal [20,21] and financial and economic [4,22] considerations restrict their large scale implementation [2]. Present and future environmental regulations may also severely restrict those potentials [23] as more evidence is gathered on the impacts of the energy infrastructure on marine ecosystems [24,25,26]. Hence, when referring to the energy potential of ocean energy systems (or any other renewable energy source) it is crucial to distinguish between theoretical, technical, economic and sustainable potentials [4,23]. The current body of literature predominantly explores the theoretical and technical potentials of marine renewable energy (MRE), which hinders the capability to conduct critical and realistic assessments of the actual techno-economic and sustainable potential for MRE.
Under the pressing need for an energy transition, accurately quantifying the potential contribution of MRE technologies to the energy mix is crucial. Such quantification is highly dependent on reliable assessments of their potentials and energy return on investment (EROI). However, the existing literature on this subject is scattered across various sources, and the reported ranges of potentials and EROIs are often wide and uncertain [4], impeding a clear and comprehensive understanding of the subject.
To address these gaps, in this work we produce the following results:
- A compilation of global energy potentials found in the literature for tidal, ocean currents, wave, offshore wind and salinity and thermal gradients, classified according to their type (theoretical, technical, economic and sustainable);
- New estimates of the EROI of the available MRE technologies, based on results from Life Cycle Assessment (LCA) studies;
- New and refined average values of the energy potentials and EROIs of the different MREs based on a critical evaluation of the literature;
- The first estimates of the maximum net energy generation potential from each MRE source by combining the energy potentials of each source with their respective EROIs;
- Identification of knowledge gaps and discussion of future industry and research directions.
After the Introduction and the Methodology (Section 1 and Section 2), the first and second points are included in Section 3 and Section 4, respectively. The net energy calculations (third and fourth points) are presented in Section 5, and the results, knowledge gaps and future research and industry trends for MRE are discussed in Section 6 and Section 7, respectively. Finally, the conclusions of the paper are summarized in Section 8.
While acknowledging the uncertainties in the values presented in this work, our findings suggest that the potentials may not be as significant as previously reported in the literature and highlight the need for further research and investment to fully explore the opportunities and challenges associated with marine energy.
2. Materials and Methods
2.1. Energy Potentials, Energy Return on Investment (EROI) and Net Energy
By energy potential, we refer to the amount of energy that is available from a specific source within specific geographic and time (usually 1 year) boundaries. In this work, we use the concepts of theoretical, technological, economic and sustainable energy potentials, as defined by [23], which have since been widely accepted and adopted by the scientific community [27,28].
While in this work we report a few values for the global economic and sustainable potentials, we recognize that these approximations are inherently imprecise, as the viability of each marine energy project must be assessed individually based on its economic and environmental sustainability.
Marine potentials in the literature are reported in power or energy units, indistinctly. In this work, we provide both. When transforming power potentials to energy units, we consider the theoretical maximum potential (capacity factor (CF) of 100%), unless otherwise stated.
The EROI or energy gain ratio (EGR) is the ratio between the amount of usable energy delivered from a particular energy resource and the amount of exergy used to obtain it [29]. This dimensionless indicator makes it possible to compare the energy profitability of different energy production processes (provided that the same boundaries and time period are used) [30].
Depending on the boundaries considered for the analysis, the resulting EROI is given the extra qualifier of standard (EROIst), point-of-use (EROIpou) or extended (EROIext). The EROIst is obtained by dividing the energy output of a power plant by the amount of energy used to generate that output per year, including the energy used for building, operating, maintaining and decommissioning the power plant. The EROIst is calculated at the point where the fuel leaves the production facility. EROIpou extends EROIst by also including the costs associated with refining and transporting the fuel. Finally, the more comprehensive EROIext also includes the energy required to make actual use of the energy produced. For more details on the different types of EROI and their differences, the reader is referred to the original source [31].
In this work, we make the EROI estimations based on published LCA results of marine technologies. LCA is a methodology to account for the inputs and outputs of materials and energy, and the associated environmental impacts, directly attributable to a product or service throughout its life cycle, from the extraction of natural resources to final disposal (cradle-to-grave) [32]. From all published LCAs on marine technologies, only those in which the Cumulative Energy Demand (CED) was estimated could be used for the assessment of the EROI, though studies reporting Embedded Energy (EE) or Energy Payback Time (EPBT) were also reviewed.
CED measures the total amount of energy needed to produce and use a product or service throughout its entire life cycle, including the energy required for extraction, processing, manufacturing, transportation, use, and disposal. In contrast, embedded or embodied energy is a measure of the energy required to produce a product during the manufacturing stage; hence, it includes the energy required for extracting and processing raw materials, manufacturing the product, and transporting it to the point of sale [33,34].
While the concept of EPBT (or Energy Payback Period, EPP) is commonly used in the literature, its definition varies. In the majority of studies, EPBT is defined as the length of time, measured in years, required for an energy system to generate the same amount of energy (in terms of primary energy equivalent) that was consumed in its production [35,36]. However, some studies define EPBT as the period of operation needed for the energy system to recover the energy invested throughout its entire lifecycle [37,38,39].
Although some of the analyzed LCA studies report EROI values, in most cases they are calculated in this work using Equation (1) [40]:
where CF is the capacity factor (here assumed 100%, otherwise stated), lifespan is the time duration of the technology from installation to dismantlement and cumulative energy demand is the energy needed to construct, operate and maintain the device over the lifespan.
Similarly, the EPBT is not always reported in LCA studies, in which case we obtain it using Equation (2) [37], which derives from Equation (1) by assuming the second definition of EPBT above:
Although we use the term EROI interchangeably throughout this paper, it is important to note that the scope of each LCA used to calculate EROI may vary. While most of the reviewed LCAs include the energy embedded in the connecting cable up to the point of connection with the grid, the resulting EROIs may still differ from the EROIpou. To provide further clarity, we report the specific system boundaries used in the LCAs that were utilized to calculate each EROI value.
Based on the energy potentials and the EROI of the respective technologies, the net energy available to society may be estimated with the following expression [41]:
In the previous equation, the energy potential corresponds to the technical potential of each technology, unless good estimates of the sustainable or economical potentials are available. With this approach, we obtain the maximum net energy potentials of each technology, which are not necessarily comparable to one another.
In addition, for the estimation of net energy, we exclude technologies with EROIs lower than 7, since it is considered the minimum value for a society to sustainably support its basic energy needs and maintain the social and economic structures that depend on energy [42].
Figure 1 summarizes the methodology described above to obtain the maximum (upper-bound) net energy contribution of each MRE.
2.2. Literature Review
For the literature review on energy potentials of marine technologies, we made site and API (when available) searches on the main journal indexing platforms (i.e., Scopus, Web of Science, Google Scholar) by combining keywords such as marine/oceanic, global, resource/gross/theoretical/technical/economical/sustainable, and potential. We also used more specific search criteria for the respective energy forms (wave, tidal, current, OTEC, SGE, wind). The most relevant literature cited in the papers resulting from the previous searches was also reviewed.
Following a similar approach, for the review of the literature on the EROI of marine technologies, we started by looking for the few studies that specifically aimed at estimating their EROI, but then extend the search to LCA studies that had estimated their CED, EE and EPBT.
3. Energy Potentials of Marine Technologies
3.1. Tidal
From the total energy dissipated worldwide in shallow ocean and continental shelves ( (21,915.0 /) [43,44,45]), (14,990 /) are dissipated by tides [44]. Ref. [46] argued that as much as 1 ( 2365 /, assuming a CF of 27%, as in [13]) would be technically harvestable. Ref. [47] reported a lower global tidal technical potential of 1200 / and in more recent years, these technical potentials have been further trimmed to 500/–1000/ [48,49] and 800 / [50].
The Ocean Energy Council estimates that the global theoretical tidal current potential is 0.5 TW [51]. According to [52], the global exploitable tidal current power with current technologies is around 75 ( / assuming a CF of 27%, as in [13]). Tidal stream energy harvesting is, in general, only viable at sites where flow velocities are higher than 2/–2.5/ [4] and with water depths between 25 and 50 [53]. A limited number of sites meet these requirements in the UK, Canada, China, the USA, Argentina, Russia, France, Australia, New Zealand, India, and South Korea [4,54].
Looking specifically at the tidal range resource, using a tidal model [55] estimated a global theoretical potential of 5792 / near the coastal regions of only 11 countries. This figure was recently updated by the same authors, using higher resolution data, to almost twofold the initial value ( 9115 /) [56]. These values correspond to 38.6% and 60.8% of the total theoretical tidal potential reported by [44] (14,990 /), respectively. The higher value is contradictory with the accepted assumption that the theoretical potential for tidal currents is larger than for tidal range [46].
In their first work [55], the authors indicate that they expect the actual technological potential of tidal range to be much lower than the theoretical values they report, and cite a study where it was found to be 37% of the theoretical value. This would correspond to a technical potential of /, which is still larger than the technical potentials reported for tidal stream and tidal range altogether (500/–1000/ [48,49]). It is also larger than the global tidal stream technical potential reported by [52] ( /), which again contradicts IRENA’s assumption [46]. Hence, it seems likely that either the reported theoretical potential or the percentage of the theoretical potential suggested in [55] to obtain the technical one are overestimated.
In fact, by subtracting the theoretical potential for tidal range reported by [55] from the total theoretical tidal potential reported by [44], we should obtain a rough approximation of the actual tidal stream potential (14,990 /– 5792 / = /). If we now calculate the percentage of this theoretical tidal stream potential that is actually harvestable according to the technical potential reported by [52], it corresponds to 1.9%, which is in agreement with the 1–2% range given by [57]. If we use the same percentage for the theoretical potential of tidal range (instead of 37%), we obtain a technical potential for tidal range of /. These are, of course, rough assumptions, but show that the actual global theoretical potential of tidal energy likely stands in the lower range of the values reported by [47,48,49,50].
All figures discussed above are compiled in Table 1.
3.2. Wave
Literature values for the global wave energy resource span from 1 to 10 (8766 to 87,660 /) [4,13,50,58,59,60] (see Table 2). Several recent studies have tried to provide more accurate estimations for the theoretical potential of wave energy by using geospatial software [59,61,62]. The initial estimates, without taking into account the energy direction of the waves, provided theoretical potentials of (32,000 /) [61]. This value is similar to the 29,500 / reported by [47]. Ref. [62] factored in the wave direction on the estimation of the energy potential and obtained a lower value of 18,400 /. Ref. [59] also evaluated the effect of factoring in the wave energy direction and obtained a global wave theoretical potential (at continental level, neglecting the potential of inner seas) of 16,000 /.
More recently, ref. [63] assessed the potential zones for the exploitation of offshore wind and wave energy at a global scale, as well as co-location opportunities, simultaneously taking into consideration aspects such as resource availability, structural survivability, logistics activities, distance to consumer centers, and extractable power. Out of the 20 countries with the highest estimated extractable power in their Exclusive Economic Zone (EEZ), Brazil, with 4500 /, and New Zealand, with 3400 /, stood out from the rest, and together account for roughly 9000 / (own estimation from Figure 8 of [63]). Hence, the technical potential for the 20 countries with the highest potentials (roughly 17,000 /) sits in the range of the theoretical potentials obtained by [59,62], and proves the need for further research on the assessment of the global potentials of wave energy.
Other studies have focused solely on the assessment of the nearshore (water depth = 10 ) resource [64], which the European Thematic Network on Wave Energy estimated to be , with an associated technical potential of 100/–800/ [65]. More recent literature seems to have taken the of harvestable potential, reported by [66], as the more realistic estimate to date for the technical potential. Taking the ratios used by [65] to convert the resource into a technical potential, the would result in 40/–300/. For the sake of comparison, ref. [67] estimated the Baltic Sea alone to have a technical resource in the range of 24 /.
3.3. Ocean Currents
Unlike tidal currents, which are generated by the gravitational pull of the moon, large-scale ocean currents are primarily driven by wind stress and density gradients resulting from variations in temperature and salinity [68]. They flow along the western boundaries of ocean basins, further offshore and in deeper waters compared to tidal currents, and therefore require distinct technologies for harnessing their energy potential. While tidal currents are highly predictable, occurring in cycles of two high tides and two low tides per day, ocean currents are stochastic in nature, and subject to more variability. Even so, their persistence in strength and direction makes them one of the largest renewable energy resources on the planet [69,70,71].
Efforts to estimate the energy potential of ocean currents started in the 1970s [72,73]. Since then, most studies have focused on specific areas, known for their strong currents, including several locations along the Gulf-Stream [68,70,72,73,74,75,76,77,78,79,80], and the Kuroshio [81,82,83,84,85] and Agulhas currents [86,87].
Estimating the global potentials of ocean currents for energy generation is a complex and ongoing research topic, with few studies attempting to provide comprehensive global figures. Additionally, the terminology surrounding ocean currents can be ambiguous, with some articles using the term to refer to both tidal and ocean currents, leading to inconsistencies in the literature.
Different methodologies have been used to try to assess the global potential, from gross approximations to satellite data analysis to complex ocean circulation models. The gross approximations of the global resource potentials in the literature are highly uncertain, with values ranging from 5000 (43,800 /) [88] to 450 ( 3942 /) [70]. Regardless of the methodology used, this is somewhat expected, based on the large uncertainty on the potential values reported in the local studies listed above, some of which also using complex models.
Using results from the HYCOM global ocean circulation model, ref. [89] evaluated the power density found in global ocean current systems. The study identified eight potential locations where ocean current energy could be potentially viable (time-averaged power densities of at least 500 /). However, the study did not attempt to quantify the potential energy generation of the identified sites. In a more recent study, ref. [90] identified flow patterns of near-surface currents in the western boundaries of world oceans by analyzing velocity measurements made with satellite altimeters and Surface Velocity Program (SVP) drifters. They identified the locations of maximum velocities for the four strongest (current speeds above /) western boundary currents (Agulhas Current, Gulf Stream, Mindanao Current and Kuroshio Current). The maximum available mean undisturbed power densities from the four currents were found to be 1403, 1124, 681, and 512 /, respectively. However, the previous approach does not allow taking the three-dimensional wake and velocity–depth relation of ocean currents into account [91]. Additionally, neither [89] nor [90] estimate the potential changes to the existing flow caused by the deployment of ocean turbine power plants.
Finally, in what is the most comprehensive study on the estimation of the global ocean currents’ potential to date, ref. [69] identify 42 sites where the installation of turbine power plants (TPP) may be favorable using a global eddy-resolving ocean model. According to the authors, TPP should occupy a 10 -wide section of a western boundary current at depths between 20 and 46 to harvest a Theoretical Available Power (TAP) that ranges from 100 to more than 1200 for all 42 sites. However, by virtually implementing the TPPs in 16 of the preselected 42 locations, they found the harnessable power (HP) to be significantly smaller (reduction between 29 and 89% from the original TAP for all 16 sites) due to the change of trajectory of the current and, to a lesser extent, the weakening of the current.
The HP as described in [69] may be assimilated to the upper bound of the technical potential. However, it was only estimated in 16 of the 42 locations, hence the global technical potential cannot be estimated from their results. Furthermore, it should be noted that some of the identified sites are located as far as 35 away from the coast, which presents a significant technical challenge [92]. This distance may render several of the identified sites unviable when economic costs and environmental impacts are taken into consideration.
Based on all the above, we conclude that there are currently no reliable estimates of the potential energy that can be derived from global ocean currents. Further research is required to accurately assess this potential. In this regard, we believe that the work of [69] provides an excellent starting point for further investigation. Their research found that there is no robust empirical relationship between the TAP and the HP. Therefore, their approach of modeling virtual TPPs is seen as the most effective method for assessing the energy potential without affecting the currents or causing any harm to the environment. We recommend that future studies build upon their findings and explore the potential of TPPs in greater detail.
3.4. OTEC
The global OTEC resource is limited by the intensity of the vertical thermal gradient of the stratified ocean. Oceanic stratification is the result of a triple process: heating of the ocean surface by the sun, density differences produced by geographic differences in evaporation and precipitation rates, and the greater stability of a fluid in a gravitational field when the more dense fluid is placed below the less dense. Assuming an average temperature difference of 20 K between the surface and deep ocean water, ref. [45] estimates that about 100 (876,000 /) is globally available.
Ref. [93] combined a one-dimensional steady-state model of the vertical structure of oceanic temperature with an equation to estimate OTECs net electrical power generated per unit area (as the product of the evaporator heat load and the gross OTEC conversion efficiency (estimated to be 2.85%)) over an ocean surface equivalent to . By also subtracting the energy used by the pumps, the author reports a potential of ( 23652 /). By applying several refinements to the original model, in a subsequent study, the same author updated the initial estimation to a range between 2.7 (secular scale) and 5 ( 43800 /) (short term) if 16 Sv of intermediate water was pumped to the surface [94]. However, this flow has the same order of magnitude as the Overturning Circulation and could produce unacceptable impacts on marine ecosystems and climate. Ref. [95] estimated that degasification of such flow of -rich intermediate water could add 253 / of CO to the atmosphere, which is 24% of the anthropogenic input of 2011.
In a later work, ref. [58] reported a smaller technical potential of 10,000 /, while [96] report a global OTEC supply delivered to shore for Grid Connected and Energy Carrier OTEC plants of 37,000 /.
Continuing the work initiated by [93,94,97], the net power that could potentially be extracted by covering all ocean areas suitable for OTEC (temperature gradients between surface and deep water exceeding 18 , c.a. 30% of the ocean surface) with this technology, without affecting the vertical oceanic thermal structure, was assessed. To that end, the authors incorporated OTEC operations (represented with fluid sources and sinks of prescribed strength) on an 4 by 4 resolution ocean general circulation model (OGCM). Using a simple formula, derived from previous works [93,94], they obtained a net power (subtracting energy used by pumps) of 30 (262,800 /). Later in the same year, the same authors published the results of a similar exercise, but using a higher resolution (1 by 1) and more vertical layers. This new assessment resulted in a much lower value of 14 (122,640 /). However, in both studies, persistent environmental effects were identified, such as surface cooling in the tropics balanced by surface warming elsewhere, with a net transient heat input into the oceanic water column, as well as a boost in the deep oceanic circulation [98]. Based on that fact, the authors suggest 7 as a safe threshold to minimize the impacts on the oceanic temperature field.
On their 2018 article, ref. [98] improved the approach used by [97] by allowing some atmospheric feedback to the same OGCM. These updates resulted in 8 –10.2 (70,080–89,352 /) for global OTEC scenarios, and 7.2 –9.3 (63,072–81,468 /) for OTEC implementation within 100 of coastlines. However, in the same article, the authors argue that an overall OTEC power production of about 2 TW (17,520 /) would not have large-scale environmental effects, and that 6–7 might be produced provided that the associated effects remain acceptable.
Using a similar approach to [97,98,99], but with a different OGCM and simulation strategy, ref. [100] estimated a time-mean global OTEC power potential during the 1955–2021 period of (74,898 /). Using measured global long-term ocean heat content (OHC), the authors also estimated the time-mean global OTEC power potential to be (81,994 /). They also estimated the OTEC power potential in the same time-frame, but only within the exclusive economic zone (EEZ), which the authors argue would be more practical and cost-effective, and found them to be (41,084 /) and (42,661 /) for the simulated and observed cases, respectively.
Although the technical and environmental constrains still apply, the technical potentials reported above were obtained using the low thermal efficiencies of pure OTEC systems. However, much higher overall thermal efficiencies may be achieved by coupling OTEC with other systems able to reuse the excess heat from the first (integrated OTEC). By integrating OTEC with a membrane distillation desalination plant, ref. [101] obtained a thermal efficiency of 25.38% as compared to the 2.19% of the OTEC system operating on its own. Similarly, ref. [102] proposed a system combining cooling, desalination and power generation and obtained an energy saving rate of 33.72% and thermal efficiency of 29.33%. In addition to improving thermal efficiency, these integrated systems may bring other benefits such as fresh water, hydrogen or ammonia generation, to provide air conditioning and also to create a controlled environment for aquaculture.
It is also relevant to mention that [100] made projections under the RCP8.5 emissions scenario, and found that the OTEC potential may increase by 45.5% by the end of the century (time-mean during 2071–2100 of ), compared to their estimated present-day level ( ).
All values discussed above are summarised in Table 3.
3.5. Salinity Gradient
The first estimations of the globally available power in the form of salinity gradients at river mouths were made in the 1970s, and ranged between 1.4 and (12,305–22,776 /) [103,104] (see Table 4).
Ref. [105] estimate the Gibbs free energy () released by the mixing of river water ( 35 / NaCl) and seawater ( 88 / NaCl) in two different proportions: a) assuming that river water mixes into an infinite volume of seawater, and b) using the ratio of volumes of the two types of water that maximizes of the total solution volume. Then, they multiply the global river discharge (37 ×− 46 × k/) by the two values of to obtain theoretical salinity gradient potential ranges of 28.1 × − 35.0 × TWh/yr and 16.2 × − 20.1 × TWh/yr for cases a and b, respectively.
Ref. [106] estimated the global theoretical and technical potentials for salinity gradient power to be 1.724 and (15,102 and 8611 /), respectively. The same values are reported in [107].
Ref. [108] reports a global theoretical potential of (27,667 /) technical potential of 5200 / and an ecological potential (to sustain the ecological stability of the river) of 520 /. These potentials were also reported in [109].
Based on previous (undisclosed) assessments, ref. [110] reported the global power production potential to be ( 2000 /). The same value was reported by [111], assuming that only 20% of the global river discharge can be used for salinity gradient energy generation.
Using a similar approach, ref. [112] claimed that if one tenth of the global river discharge was used for power production (with PRO) from the mixing with seawater, 1370 / ( ) could be generated. A similar technical potential ( 1650 /) was reported by [113,114].
Finally, ref. [115] estimated the value of the global extractable salinity gradient potential to be 625 / ( /), including 49% of all river mouths, an environmental flow of 30% of the mean river discharge, an extraction factor of 0.2, and an average CF of 84%.
3.6. Offshore Wind
When compared to other ocean energies, the offshore wind sector is considered to be in a relatively mature state [4]. The first platform was established in Denmark in 1991 [117,118], and Statoil-Hydro and Siemens installed the first large scale grid connected floating wind turbine in 2009 on the Norwegian coast, at Karmøy [119].
The estimates of the potential for global offshore wind differ greatly depending on the study and its associated assumptions and constraints [120]. The defined water depth, the power density, and the capacity factor are the key contributors to these discrepancies [121].
Ref. [40] estimated the kinetic energy generation rates onshore and offshore from the global kinetic energy dissipated in the atmospheric boundary layer. Assuming that this power is distributed over each cell proportionally to the mean wind speed squared, the resultant potential for available energy over suitable offshore areas (exclusive economic zone up to 50 deep) is (73,146 /).
The first estimations of offshore wind energy resources were typically constrained by close proximity to land and shallow water depths, allowing for bottom-fixed foundations. Refs. [122,123] used similar methodologies and obtained 157,000 / and 192,800 /, respectively. The studies interpolated between the vertical layers of the GEOS-5 database pressure fields, assuming 100 hub heights. The turbine power density was the only difference between the two cases, at / and 5 /, respectively.
Projections of several Atmospheric general circulation models (AGCMs) on the modification of the large-scale wind field after the installation of large wind farms, reviewed by [124], show that power production tends to saturate at 1 / of surface for wind farms larger than many hundreds of and a surface coverage tending to infinity, even though scattered wind farms may produce a mean electrical power larger than this. The potentially extractable electrical power was studied by [95] in three scenarios of increasing occupation of the ice-free global continental shelves. In these scenarios, wind turbines occupy 10%, 25% and 50% of continental shelves surface up to 225 m deep, respectively. Using the asymptotic value of 1 / reported by [124], the extractable power obtained was 1.8, 4.5 and , respectively).
Ref. [125] made a similar analysis of the offshore power extractability, but for different periods. The first one, using the current technology (up to 50 deep), and the following ones, using floating turbines (assuming depths up to 1000 deep). Then, they determined one scenario of low use, where 4% of the surface of the accessible shelf between 0 and 10 , 10% between 10–50 and 25% between 50–200 were used; and a high use scenario, where 5% (0–10), 40% (10–50) and 80% (50–200) of the surface were used. Their estimation of extractable power for both scenarios was 189 / (52,500 /) and 624 / (173,000 /) for the first period and 197 / (54,722 /) and 652 / (181,111 /) for the next periods.
Other recent studies estimated the global technical potential for floating wind turbines up to 1000 deep at 329,600 /, of which 230,004 / are generated in deep waters (more than 60 ) [121]. Moreover, the International Energy Agency (IEA) has provided estimates of a global potential of more than 420,878 /, including ocean depths up to 2000 [15].
A summary of the energy potentials reported for offshore wind is shown in Table 5.
4. EROI of Marine Technologies and Devices
4.1. Tidal
Ref. [126] modeled the embedded energy of a tidal stream array of 200 marine turbines sited in the Kaipara Harbor north of Auckland, with a total predicted output over an assumed 100-year lifespan of (CF of 37%). The EE was found to be . Not taking into account the energy used during the O&M and decommissioning phases, this would lead to an EROI of 85.3, with an EPBT of 1.18 years.
Ref. [127] performed a cradle-to-grave LCA of the Seagen marine current turbine, and obtained an energy intensity of 214 /, considering a potential annual energy production from the turbine of 4736 (CF of 48%) and a lifespan of 20 years. Using these data, the authors reported an energy payback period of approximately 14 months. Based on these data, we estimate the EROI of this system to be 16.8.
On the other hand, ref. [128] carried out a cradle-to-grave LCA of four tidal stream energy devices: those from OpenHydro (Open-Centre Turbine, rated at 2 , lifespan 20 years), Tidal Generation Ltd. (Deepgen, rated at 1 , with 25 years lifespan), ScotRenewables (SR2000, rated at 2 , lifespan 20 years) and Flumill (Flumill, rated at 2 , lifespan 20 years). They were studied based on a functional unit, defined as an 10 array installed for 100 years and implemented in a hypothetical site with specific tidal and climate conditions. Over their lifespan, the functional units of Open-Centre Turbine generated 7,500,000 , Flumill and SR2000 generated 6,500,000 and Deepgen produced 5,800,000 . Based on the energy debt and credit reported by [128] (in Table 2), we estimated the EROI to be 14, 11.8, 14.31 and 9 for the Open-Centre Turbine, SR2000, Flumill and Deepgen, respectively. The EPBTs estimated in the paper were 7.3, 8.7, 7.2 and 11.2 years, respectively.
In the framework of the H2020 PowerKite project, ref. [129] performed a cradle-to-grave LCA of Minesto’s initial plans of a Deep Green Utility (DGU) tidal current power plant in Holyhead (Wales), with two configurations. The first consisted of an array of twenty four 500 kites ( 12 in total), with a CF between 23% and 46%. The second configuration, which according to the authors reflects a more favorable tidal site, consisted of eighteen 750 kites ( in total) and a CF of 46%. The EROIs at the Holyhead site were found to be between 4.6 to 8.7, which corresponds to EPBTs of 3 to 6 years.
The values of the EROI for tidal range technologies (Table 6), including tidal barrage and tidal lagoon systems, are more uncertain.
With the second-largest tide range in the world () [36,130], the Severn Estuary, located in the southwest of the United Kingdom, has long been considered a potential site for tidal power generation. As a result, several proposals for tidal range power plants have been made in the area over the years. The Cardiff–Weston barrage proposal is the most well-known, and has been subjected to several LCA studies [36,131,132]. In [132], emissions and embedded energy were analyzed over the expected lifespan of the barrage (120 years), but excluding the decommissioning stage (hence not a full or cradle-to-grave LCA). Based on previous assessments, the energy output was assumed to be / (with ebb generation and flood pumping) and the CED (without decommissioning) was 1,958,700 . The authors report an energy gain ratio (EROI) of 3.7, with an energy payback period of 33 years. A previous study in the same site had obtained an EROI of 14.2 [131]. Ref. [132] justify the lower value obtained in their study by the fact that they made a more accurate approximation of the operation energy. Ref. [132] also assessed the case excluding flood pumping (ebb generation only) which resulted in a much higher EROI value of 24.2 and an EPBT of 5 years.
In the most recent analysis of the same project proposal, ref. [36] obtained an energy gain ratio of 22.2, considering ebb generation and flood pumping. However, this value may be overestimated because neither the energy required to build the barrage nor that used in the decommission phase were accounted for. They report an EPBT of 8.6 years, which corresponds to the moment in time in which the energy produced matches the CED until then. To obtain to this figure, the authors considered 50% power generation capacity in year 1 and a construction period of 6 years. With a lifespan of 120 years and the value of EROI reported by the authors (22.2), we estimate a shorter EPBT of 5.4 years with Equation (2).
Hammond and coauthors had previously performed the same analysis for the Shoots Barrage proposal [133], which is a smaller tidal range system upstream of the Cardiff–Weston barrage proposal, and obtained very similar values (EROI = 22.31, EPBT = 9.16 years). The EPBT in this study also considered 50% power generation capacity in the first year, but in this case the construction period was 5 years.
Similarly, ref. [134] made an assessment of the EE and carbon emissions of the Swansea Bay Tidal Lagoon project, also located in the Bristol Channel, from a Life Cycle perspective. In their LCA, the authors considered the following stages: material production, transport, construction and operation, while decommissioning was excluded from the study. They report an EE of 7800 ( 2167 ) with a net annual energy output of 400 over its 120 years lifecycle. Based on these data, we obtain an EROI of 22.15, with an EPBT of 5.5 years. Unfortunately, to our knowledge, the previous findings were never published in a peer reviewed journal and so the EROI estimated here must be taken with caution.
4.2. Wave
Ref. [38] performed a cradle-to-grave LCA of the first generation Pelamis Wave Energy Converter (WEC), rated at 750 . With an estimated power output of / and a lifecycle of 20 years, they report an energy intensity of 293 / and an EPBT of 20 months (1.6 years). With these figures, we estimate an EROI of 12.3.
Ref. [135] performed a cradle-to-grave LCA to a WEC concept project from Uppsala University, which is based on a system utilizing the heaving (up-and-down) movement of the waves. The wave power plants analyzed in their study consist of 1000 such WEC devices, which have an estimated lifespan of 20 years. They consider two case studies: Case NO reproduces the operating conditions 400 from the coast of Norway ( 20 / wavefront), and Case SE corresponds to operation conditions with an average power flow of 5 / wavefront. Case NO delivers , whereas Case SE delivers over their lifespan. The energy intensity of Case NO is /, while that of Case SE is /. From these data, the EROI can be estimated to be 6.3 and 2.04 for the NO and SE case studies, with EPBTs of 3.2 and 9.8 years, respectively.
Ref. [136] performed an LCA on the Oyster 1 device (Oscillating Wave Surge Converter (OWSC)), from Aquamarine Power. The CED over the lifespan of 15 years was estimated to be 5347619 ( ), with an EPBT of 12 months. The Oyster 1 device is rated at 315 with an estimated CF of 51%. This results in an EROI of 15.3.
Ref. [137] carried out a full life cycle assessment of the ( 315 ) Oyster 1 and the ( 800 ) Oyster 800 surge wave energy converters. The authors considered a lifespan of 15 years and an annual output of for the Oyster 1, while the lifespan of Oyster 800 was set at 20 years and the annual output to . The CF used for the two devices was 55%. The CED of Oyster 1 was estimated to be 891 /, while that of the Oyster 800 was 634 /. Accordingly, the EROI of the Oyster 1 and Oyster 800 devices are 4.04 and 5.67, with EPBTs of 3.7 and 3.5 years, respectively (note that lifetimes are different for the two devices). The CED for the Oyster 1 obtained in this study ( 20314800 ) was almost 4 times that estimated by [136] ( 5347619 ), which also results in a EROI c.a. four times smaller than that obtained by [137].
Ref. [138] performed a cradle-to-grave LCA on a Buoy–Rope–Drum (BRD) WEC. The BRD WEC was developed by a research group at Shandong University (Weihai, China) and has a designed rated power capacity of 10 . The energy intensities and EPBTs reported in the study ranged between 387/–968/ and 26–64 months (2.2–5.4 years), with CFs of 50% and 20%, respectively. With a 20-year lifespan, this corresponds to EROIs of 9.1 and 3.7, respectively.
Ref. [139] carried out an LCA of the Wave Dragon WEC (overtopping) following the EDIP methodology [140]. They obtained the data from a 1:4.5 scale prototype, tested for 21 months in sea conditions at a less-energetic site. They considered all phases in the lifecycle of the device (manufacturing, transport, O&M and decommissioning) and anticipated a lifetime of 50 years. The authors report the energy return (EROI) of the device to be 20, with an EPBT of 2.42 years.
Ref. [141] also analyzed the 7 Wave Dragon overtopping WEC, but in this case only taking into account the energy embedded in the materials required to build it. Its annual power generation when placed in Wales Coast would be 20 with a lifespan of 50 years. Using the energy intensities of [142,143], the embedded energies are and . According to the previous values, their EROI and EPBTs are 25.6 and 30.6, and 2 and 1.6 years, respectively.
In the same article, ref. [141] also performed a LCA on the 750 Pelamis WEC (attenuator), which only considered the energy embedded in the construction materials. The annual energy output was estimated at , if placed in Irish coasts. The lifetime of the device was assumed to be 20 years. Two data sources were used for the energy intensities of the required materials, [142,143]. Considering the two sources of information, the EEs were (EROI is 16.5) and (EROI is 16.83), respectively. The EPBT was roughly 1.2 years for the two cases.
Ref. [144] carried out a cradle-to-grave LCA of the Pelamis 1 WEC. The case study was for a typical wave farm located off the north-west coast of Scotland, with a lifespan of 20 years. The authors report an EROI of 7.3, with an EPBT of 33 months (2.8 years).
Ref. [145] made a cradle-to-grave LCA of the MegaRoller WEC, which is an OWSC based on the existing design implemented and commercialized as WaveRoller. The authors report a CED of 432 /, and a total energy production of 53 over a lifespan of 20 years. Based on these data, we obtain an EROI of 8.3 and an EPBT of 2.4 years (authors report 2.5 years).
In their recent work, ref. [146] carried out a cradle-to-grave LCA on the 350 CorPower Ocean AB point absorber WEC, as part of a 10 array (of 28 units) placed in Aguçadora, Portugal, and under three O&M scenarios. They report mean CED ranges of 0.38 /–0.60 /. With a lifespan of 20 years and an annual energy production of 33 / (CF of 38%), we estimate an EROI range of 5.3–9.5 and EPBTs (considering the CED of the total lifespan) of 2.1–3.6 years.
Another relevant work is in this area is that of [147], who performed LCAs of ocean energy devices using detailed technical information on the components and structure of around 180 of them from the Joint Research Centre (JRC) ocean energy database. Though the LCA is very comprehensive, it does not estimate the CED, hence their EROI cannot be obtained.
A summary of the EROIs of wave energy devices found in the literature is presented in Table 8.
4.3. Ocean Currents
Literature on LCAs of ocean currents as a source of energy is notably scarce. To date, only one LCA study has been conducted on an ocean current technology, the Deep Green Utility developed by Minesto, which employs a turbine coupled to a wing that utilizes tidal or ocean currents to generate electricity [148]. Ref. [129] estimated the EROI and EPBT for a tidal current case study, hence the results are reported in Table 7 from the Section 4.1. According to the study, the technology has the potential to operate at a CF ranging from 70 to 95% in a continuous ocean current [129].
There exists an open-sea test site for ocean current energy in Florida: the Southeast National Renewable (Energy Center—Ocean Current Test Facility) [6], but no LCA studies are found from their platform. Additionally, the IHI corporation and NEDO Organization have developed a 100 class ocean current turbine system called “Kairyu” and have conducted a demonstration test for the Kuroshio current [149]. In the mooring test, it generated an approximately 30 output at the current velocity of about 1 / [150].
4.4. OTEC
Very few LCA studies report the CED of OTEC technologies (see Table 9). Ref. [151] performed an LCA of a 10 MW OTEC system at Curaçao, in the Caribbean Sea, based on information of the feasibility report of ocean thermal energy conversion by Bluerise. The total annual energy output was estimated to be 252288000 / (considering a CF of 80%) and the CED over the lifespan was at 948699241 , which results in an EPBT of 3.76 years. In addition, with the lifespan of the plant considered in that work (30 years), we estimate an EROI of 8.
Ref. [152] carried out a LCA for an OTEC plant operating for 20 and 40 years offshore Oahu, Hawaii, with CFs of 85%, 95%, and 100%. For a 20-year operational OTEC plant, the CED, EROI, and EPBT ranged from 0.68 to /, 4.5 to 5.3, and 3.7 to 4.4 years, respectively. For a 40-year operational OTEC plant, CED, EROI, and EPBT ranged from 0.53 to /, 5.8 to 6.8, and 5.9 to 6.9 years, respectively.
Ref. [141] estimated the EE in the materials for construction of a 100 closed cycle OTEC system. The annual power production was estimated to be , considering a CF of 30%, a 25% of self-consumption and a lifespan of 30 years. Taking the material intensities from [142,143], the EE in the materials are (EROI of 12.6) and (EROI of 14.7), with EPBTs of 3.1 and 2.4 years, respectively.
4.5. Salinity Gradient
The literature on SGE technologies is scarce and good quality studies are lacking [39]. When focusing on LCA studies applied to SGE technologies, the knowledge gap is even larger (see Table 10). Though the environmental impacts of SGE had been previously studied [153,154], only in 2020 did [155] perform what they claim was the first comprehensive LCA of a SGE system (reverse electrodialysis (RED)). In another recent LCA study of a RED system, ref. [156] argued that the lack of environmental studies may be related to the very few pilot projects built and operated for long periods. Even more recently, ref. [157] published an environmental impact assessment of a hypothetical 50 RED plant installed in La Carbonera Lagoon, Yucatán, Mexico. In a modeling exercise (not an LCA), ref. [158] estimated the net energy produced during the operation phase of a 1 SGE plant in the Strymon River (Greece). However, neither [155,157] reported the CED or energy intensity of the studied systems, hence their EROI cannot be estimated. Similarly, in [158], only the energy required during operation is reported, while the energy embedded in the construction and decommissioning phases are not taken into account. According to this, the EROI cannot be reliably estimated.
Surprisingly, the only LCA on a SGE technology that we could find in our review that actually measured the CED was that performed by students from the University of Surrey in a Multi-Disciplinary Design Project [159]. In this work, the authors carried out a feasibility study of the PRO technology to generate 10 constantly in a lagoon located at the mouth of the River Avon in the Severn Estuary, in the UK. In their study, they took into account the energy invested in the construction, running, maintaining and decommissioning of the plant. With a design life of 30 years, they obtained an EROI of 0.6, which served them to prove the unfeasibility of the project. Unfortunately, to the best of our knowledge, this work was never published in a peer-reviewed journal.
Looking specifically at the literature reporting EROI values, ref. [160] report EROIs of 7 and 6–7 for RED and PRO technologies, respectively, and based on previous literature. However, looking into those articles, we could not find how the values reported by [160] were obtained. Ref. [161] adds that even though RED is among the highest energy efficiency techniques, it also has a low EROI, without providing any further clues.
4.6. Offshore Wind
Several LCA studies have been carried out on offshore wind systems, and values of EROI and EPBT were either reported or can be extracted from the data.
A meta-analysis of the EROI for onshore and offshore turbines installed from 1977 to 2007 was conducted by [162]. The offshore stations reported (placed in wind fields of 17, 16, and /) had EROIs of 33.3, 51.3, and 14.8, respectively.
The first LCA study for floating offshore wind was performed by [163]. They conducted a preliminary LCA for a Norwegian company project (Sway Company) of a floating offshore wind farm located 50 away from the shore, constituted by 40 floating wind power plants. The study obtained an EPBT of 13 months with a lifetime of 20 years, which corresponds to an EROI of 18.45. This high result is probably due to the fact that they do not take into account the marine ecotoxicity or emissions linked to the installation and maintenance of the farm.
The research of floating technologies was followed by [164], who reviewed six LCAs for six conceptual offshore farms: one with bottom-fixed and five with floating turbines of 90 hub height located 200 off the British coast. The EROI obtained was 12.4 for the bottom-fixed case, and 7.5–12.9 for the floating systems.
Ref. [165] conducted another LCA for two case studies of floating offshore wind farms, but using a detailed O&M model to better estimate its impacts. The first case study was based on the Hywind Scotland deployment and the second on the Kincardine deployment at the south-east of Aberdeen, Scotland. This study finds values in similar ranges to the previous one, but slightly lower; they obtain EPBTs from 3.3 to 4.3 years for the Hywind and 2.8 to 3.7 years for the Kincardine, which implies EROIs of 5.81–7.57 and 6.5–8.9 with 25 years of lifetime expected in both projects.
A LCA study for conceptual offshore farms was conducted by [166]. They proposed two turbines of 4 and 6 turbines of 2015 state-of-the-art technology and 30 and 50 from the coast. The calculated EPBT was 11.1 and 10 months, respectively, which with 20 and 25 years of expected lifetime implies an EROI of 21.6 and 30, respectively.
A theoretical LCA of different energy generation technologies was carried out by [167] and obtained an average EROI of 13.5 for offshore wind plants. However, it omitted technical details regarding the type of farm under consideration. Ref. [40] analyzed two offshore wind farms with a CF of 39%, one anchored at a depth of 15 and the other one floating, the LCAs provided EROIs of 12 and 10.4, respectively.
The Company Siemens-Gamesa made a LCA estimation of an offshore power plant consisting of 80 turbines SG 8.0-167 DD of 8 placed 50 from shore and 22 from shore to grid, with an expected average wind speed of 10 /, and with steel foundation [168]. They estimate an EPBT of 7.4 months for an expected lifetime of 25 years, which implies an EROI of 40.5. This figure can be considered representative of a modern wind farm, with large turbines and placed in an optimal wind region such as the North Sea. The payback period is in the range estimated by the LCA of Vestas of a V117- wind power plant, which obtain a payback time of 5 and 8 months for strong and low winds, respectively [169].
Ref. [170] conducted a LCA on the Alpha Ventus Farm, located in the North Sea at a depth of 30 and 16 from the German coast. In this study, they estimate different EPBT values for 6 scenarios. In the first one—the standard scenario—they obtain 8.8 months with 20 years of lifetime, which implies an EROI of 27.3. The second one has the same boundaries as the first one, but the cable has 40 years of lifetime (20 years for the other components), which results in an EROI of 39.3 with 6.1 months of EPBT. The third and fourth scenarios are identical to the standard but have different full load hours; they obtain 9.5 months (EROI 25.3) for 3600 h/a and 8.1 months (EROI 29.6) for 4200 h/a, compared to 3900 h/a, in the first scenario. For the next scenario, they lower the wind farm maintenance by half and obtain 8.7 months of EPBT (27.6 EROI). Finally, the last scenario assumes that the offshore wind farm has 40 WEC instead of 12; they obtain 7.4 months of EPBT, which implies an EROI of 32.4.
The energy performance of different power stations deployed in the United Kingdom was examined by [171], which obtained an EROI (electricity-equivalent) of 18 for offshore wind stations with a range of variability between 16 and 30. An increased blade size and better wind field tend to improve the turbine EROI due to enhanced CF. This is probably the cause for the large values reported by [172] for wind farms installed in New Zealand: a mean value of 34.3. [173] estimates the EROI of an offshore farm in the Taiwan Strait with and without an offshore substation located 8–15 from the coast. They obtain an EROI of 18.7 without the substation and 16.7 installing the offshore substation. If they considered the recycling of waste materials, the EROIs increased to 26.7 and 23.2, respectively.
Ref. [174] estimated an EROI of 8.7 for the standard offshore wind technologies. This low number could be the result of pessimistic assumptions that need to be tested, including the assumption that “indirect investments of Renewable Energy Systems constitute at least 100% of the total direct energy investments estimated” by typical LCA analyses.
Table 11 summarizes the EROI values and EPBTs reported in the present section.
5. Net Energy
In this section, we discuss the energy potentials and EROIs of the different forms of MRE collated in Table 1, Table 2, Table 3, Table 4, Table 5 and Table 6, Table 7, Table 8, Table 9, Table 10, Table 11, respectively, and use the most reliable figures to obtain their respective potential net energy contribution. A summary with the results obtained in this section is shown in Table 12.
5.1. Tidal
Studying the same site (Cardiff–Weston proposal in the Severn Estuary), ref. [36,131,132] obtained values of EROI slightly above 20 using different hypothesis (see Table 6). Ref. [134] also report an EROI above 20 for the Swansea Bay Tidal Lagoon project. However, all these studies neglect the energy consumption of different stages of the lifecycle of these barrages, hence in this work we settle on a value of 20. Despite the high energy return, the large environmental impacts and upfront economic costs of building large dams and creating artificial impoundments [10,46,175,176,177], combined with the small number of sites with large tidal ranges that could be dammed, are hindering the development of new tidal range capacity, and may result in a low global sustainable potential for this type of technology. Compared to conventional barrage schemes, tidal lagoon power plants impound a smaller body of water and should therefore be less intrusive [55]. However, it is not yet possible to give a factual assessment of the full life-cycle of environmental consequences of tidal lagoons, since there are no full-scale systems of this type in operation to date [178]. Taking all the previous into account, we reckon that further adoption of tidal range technologies is unlikely.
Excluding [126] (not cradle to grave LCA), the mean of all EROIs for tidal stream collated in this study is 11.16 (the median is 11.5) (see Table 12). For the estimation of net energy, we will use the median (11.5).
For the tidal stream technical potential (see Table 1), we use the / reported by [52], noting that it is the only value for the potential of this form of energy that we found in the literature. This value is likely in the lower range of the literature, considering the combined technological potentials of tidal stream and tidal range reported in this work, but it is also likely that when taking into account economic and sustainable aspects, the actual potential becomes even smaller.
According to this, the net energy that may be obtained from tides on an annual basis (besides the / generated by La Rance and Sihwa altogether), based only on technical considerations, would be 162 / ().
5.2. Wave
The technical potential for wave energy estimated in this work from data reported by [63] is higher than the lower bound theoretical potentials collated in Table 2. Therefore, we will discard this value for the calculation. The value reported by [66] is a rough estimate of , and from the remaining values (considering technical and economic potentials), no robust statistical analysis can be performed. However, when factoring in sustainability constraints, the technical potential is likely to go well below 1000 /. Here, we use an optimistic value of 1000 /.
Regarding the EROI of wave energy technologies, the mean of all collated values is 11.2, and the median is 8. This results from the fact that there are many low EROIs and only a few higher ones (see Table 8). Technologies with higher EROIs are more likely to become commercially available. Therefore, here we first calculate the average EROI by device (only those with an EROI > 7), and then select only the technology with the highest EROI. This approach, will most likely result in an overestimation of the future global average EROI, since it is likely that several technologies with different EROI ranges will coexist (and also less optimal sites). Using this approach, we find that the highest EROI is that of the Wave Dragon WEC, with an average value of 20.
With a technical potential of 1000 / and an average EROI of 20, the mean annual net energy that could be extracted from waves, based only on technical considerations and in the very best case scenario, would be 950 /.
5.3. OTEC
OTEC is the energy source with the highest potential, which is also the one with the highest uncertainty of all. Therefore, this will have a large impact on the final net energy potential of ocean energy altogether.
The global technical OTEC potentials in the most recent literature are in the 7–9 range (see Table 3). However, Nihous and colleagues have reported on several occasions that no more than 7 may be exploited without significant large-scale environmental effects. Ref. [100] obtained slightly higher technical potentials, but when considering only the potential in EEZ, the potential (more economically viable) goes down by 45%. Ref. [98] went even further and cut the potential to 2 to prevent potential negative environmental effects. Considering the EEZ only, this potential would decrease to 1 ( 8760 /, considering the theoretical maximum potential). According to our discussion in Section 3.4, this latter figure would imply a potential flow of to the atmosphere of 5% of the anthropogenic input of 2011. While it may still be seen as a considerable amount, it would be much less disruptive than larger powers.
From the very few studies that are available from which EROIs can be estimated for OTEC (see Table 9), it is apparent that with current technology it is unlikely that the average EROI for the whole technical potential remains above 7. Here, using what we consider a very optimistic exercise, we assume that only 50% of all the techno-economic potential ( 4380 /) of OTEC would be exploitable with an average EROI of 7. This leaves us with a very rough estimate for the annual OTEC net energy production of 3750 /.
Here, we estimate the current marine energy potentials, hence we did not take into account the 45% increase in the global OTEC potential due to climate change projected by [100] by 2100. If this was taken into account (assuming that the 45% applies equally to EEZ and outside of it), the techno-economic potential (in EEZ) would be , and the net energy production would go up to 5440 / (that is without taking into account potential technological improvements that would likely translate into higher EROIs).
5.4. Salinity Gradient
The average of all technical potentials for SGE is 3767 / (median is 2000 /) (see Table 4). However, some authors have also estimated what they argue would be a sustainable potential for SGE [108,115]. The average value for the sustainable potential is 570 /.
Despite the lack of studies available on the energy intensity of SGE, the prospects for the EROI of this technology are not very high (see Table 10). According to this, and the expected relatively low sustainable energy potential, here we will assume a null annual contribution from SGE to the energy mix.
5.5. Offshore Wind
There is a fair amount of literature on the energy potential and LCA analyses for offshore wind systems, but the estimates vary greatly depending on the study. Since most of the potentials we report are technological, the value varies widely depending on its constraints (water depth, distance from the coast, available area, turbine density, capacity factor, etc.). We did not find offshore wind studies that reported economic or sustainable global energy potentials.
Here, we consider the potential values of [125], as the study includes both anchored and floating technologies for low-use and high-use scenarios. In addition, their calculations exclude areas with low average wind speeds. The range varies between 52,500 and 181,111 / (see Table 5), the average of which is 116,805 /. However, the realization of the high-use scenario (5% (0 –10 ), 40% (10 –50 ) and 80% (50 –200 )) is improbable, since both marine life and fisheries would be severely impacted. Although the low-use scenario also occupies a large portion of marine areas (4% (0 –10 ), 10% (10 –50 ) and 25% (50 –200 )), we consider it a top boundary for the exploitable potential. Factoring in site-specific sustainability and legal constraints will undoubtedly limit even further the effective potential. Therefore, 54,722 / is the most reasonable value for global offshore wind energy potential.
Reported values of offshore wind EROIs range from 6 to 51 and the average EROI among all the analyzed studies is 22.6 (median 21.6) (see Table 11). The wide range of uncertainty is caused by the specific assumptions established in the different studies. Recycling waste materials also has an important positive impact on EROIs [173,179]. Ref. [165] emphasizes the need for a more thorough investigation of how O&M strategies impact marine ecosystems, as the selection of vessels and the volume of maintenance activities in LCA studies are generally based on broad assumptions. Indeed, research on the impacts of offshore wind farms on marine ecosystems is still in its early stages (e.g., biodiversity loss, seabed destruction, pollution, acoustic noise, electromagnetic field enhancement by underwater transmission cables, etc.) [25,179,180]. Moreover, some recent studies find that large clustered offshore wind farms can impact sea surface fluxes, which is on the magnitude of a climate change impact [26]. Thus, changes in atmospheric climate caused by offshore wind platforms must also be taken into consideration.
6. Discussion
Reliable estimates of the potentials and EROIs for various renewable energy technologies are crucial in strategic planning for future renewable energy portfolios. By combining the technical potential with the EROI, we can estimate the overall net energy that marine technologies could potentially contribute to meet the energy demands of our current societies. Integrated Assessment Models (IAMs) and energy system models are often used to make this mid- to long-term energy planning, and as such, the potentials and EROIs are also crucial inputs to these models [181].
It is important to emphasize that the objective of this study is not to discredit any MRE sources or technologies. Rather, the focus is on identifying and highlighting those with the highest potential to contribute to the future energy mix. By prioritizing the most promising resources and technologies, policymakers and stakeholders can more effectively allocate resources and promote the development and deployment of MRE on a larger scale.
In line with this objective, it is also important to consider the technical and regional suitability of different MRE resources when evaluating their overall potential. While certain MRE resources may have limited potential or exhibit high regionality, they may still be well-suited for specific geographic locations. For instance, although tidal energy may not be exploitable at a global scale, it could be particularly viable in regions such as the UK or Canada. Thus, careful consideration of both technical potential and regional suitability (including environmental impact assessments) is crucial to effectively harness the benefits of MRE resources.
6.1. Literature Review
The literature on marine energy potentials is characterized by a significant degree of uncertainty [4]. This uncertainty can be attributed to several factors, the most important being the inherent complexity of the subject, which arises from the heterogeneity of environmental conditions across different regions and in time [182]. On the methodological side, factors responsible for the large uncertainty include the use of different methodologies (from sophisticated models to simplistic assumptions or basic rules of thumb), the number and complexity of variables included in each analysis (e.g., technical, economic and environmental aspects) and their spatial resolution (e.g., spatially explicit vs. global averages). Finally, the diversity of technologies considered in different studies and the fact that many of them are in the pilot phase make it difficult to provide reliable estimations of energy potentials.
The methodological challenges outlined above are compounded by the lack of clear boundaries between the different types of potentials reported in the literature [4]. Consequently, the reported technical potentials may, in some cases, be closer to theoretical potentials, while ecological potentials may be presented without proper consideration of their economic viability.
In addition, while in most cases theoretical and technical potentials of marine energy resources are relatively easier to approximate, reliable assessments of global economic and ecological potentials can only be achieved through a bottom-up approach, which involves analyzing each combination of site and technology individually. As a result, the majority of potentials collated in this work correspond to theoretical and technical potentials.
This work also highlights the significant discrepancy in quantitative assessments of technological potential between wave, tidal, and offshore wind technologies compared to SGE and OTEC and ocean currents. Specifically, the majority of available studies have focused on the former, while the latter have received far less attention [175]. In fact, the present study reveals that the current literature does not provide sufficient evidence to provide reliable values for the energy potential of ocean currents.
While the EROIs of other energy technologies and fuels have been thoroughly evaluated in numerous publications [31,162,174,183,184,185], the number of studies on marine RE technologies is relatively scarce. This makes the present work a significant contribution to the field, as it is the first comprehensive attempt at compiling the EROI of various MRE technologies.
Obtaining reliable estimates of the EROI of marine technologies is particularly challenging due to their diversity and the range of conditions of the different locations, their low maturity and the overall lack of operational experience [39,186]. Most technologies analyzed in LCA studies are in pilot phases or are full-scale prototypes [39], and as such, the obtained results may differ significantly when scaled-up. The lack of operational experience leads to large uncertainties in the estimations made during the O&M and decommissioning phases, and even their lifespan, which are generally based on expert judgments [39]. Moreover, the lack of standardization in LCA methodologies [35,144,187] and the scarcity of data on energy inputs and outputs are further challenges to estimating the EROI of marine technologies [138].
6.2. Potentials, EROI and Net Energy
The technical potentials obtained in this work for offshore wind, wave and tidal stream are 55,000, 1000 and 180 /, respectively. The sustainable potentials for OTEC and SGE are 4380 and 570 /, respectively, while that of tidal range is negligible due to high environmental impacts [10,46,175,176,177].
Although many efforts have been dedicated to the assessment of the potential of ocean currents, there are still uncertainties and knowledge gaps that need to be addressed before accurate figures can be reported. Despite this, when considering the numerous challenges associated with harvesting ocean currents in deep water and at long distances from shore, as well as the weakening effects that turbine power plants can have on the currents [69], it seems relatively safe to say that ocean current energy will not make a significant contribution to the future energy mix.
Based on all the previous, in this work, we challenge the claims that ocean energy alone (hence excluding offshore wind) may have the potential to cover the current global electricity demand (27,447.4 / [5]). In fact, with the potentials estimated in this work, in the best case scenario and excluding most economic and environmental restrictions (hence including the tidal barrage technical potential), ocean energy alone would cover less than a fourth of the global electricity demand ().
Of all the technologies analyzed in this work, offshore wind, wave energy, and tidal range have the highest average EROIs (around 20). The EROI of tidal stream is slightly above 10, while OTEC’s EROI is around 7. The EROI of SGE remains uncertain, and current evidence suggests that it may be lower than 7. Given the limited research available, further LCA studies are necessary to provide reliable estimates of the EROI of ocean current technologies.
According to the estimations made in this work, the total maximum annual net energy that may be extracted from marine energy sources would be 57,051 / (Table 12) with an average EROI close to 20. From this total, >90% comes from offshore wind, and 77% of the remaining percentage is covered by OTEC. Wave energy may produce a maximum energy surplus of 950 /, while tidal energy may contribute less than 200 /. Due to the low technical potentials and EROIs, in this work the contribution of SGE with current technologies is considered negligible. Finally, it must be noted that the average EROI of 20 is highly influenced by that of offshore wind. Indeed, if offshore wind is excluded, the average EROI becomes 8.
A summary of the results discussed in this section is presented in Figure 2.
6.3. Limitations of the Present Study
The findings reported in this study provide an initial estimate of the potentials and EROIs of various marine technologies. However, it should be noted that the results are subject to a high degree of uncertainty, partly due to limitations in the available literature, as previously discussed. This uncertainty is significant for less-extensively studied technologies, such as OTEC and SGE, and particularly for ocean currents. As further research and development progress in these areas, more reliable estimates of their potentials and EROIs can be expected, potentially affecting the overall conclusions of this study.
The current study also acknowledges a potential limitation that could lead to an overestimation of current potentials and net energy. Specifically, the consideration of economic and environmental restrictions for the various technologies is incomplete [39,144]. As such, the net energy estimations primarily rely on technological potentials, with economic and environmental constraints included only if adequately documented in the literature. Therefore, the net energy potentials obtained in this work for each type of energy are not comparable to one another, but they all represent the maximum energy surplus that each could potentially contribute. This limitation also highlights the need for periodic updates as additional economic assessments and environmental impact assessments become available.
In this study’s approach for estimating net energy, we utilized average EROI values for each marine energy source, computed as the mean of all technologies harnessing the respective resource type. Moreover, a uniform application of EROI was adopted for the entire resource, except for OTEC. Given its vast potential and an EROI close to the viability threshold of 7 used in this study, it was assumed that only half of OTEC’s sustainable potential may be harnessed with an EROI of 7. This assumption is highly uncertain, as estimates of the minimum societal EROI vary significantly in the literature [30].
Spatial overlapping of MRE resources, as well as co-location opportunities or hybrid solutions, were not explored in this work. This represents a potential avenue for further investigation, as the integration of different renewable energy sources in a shared location could lead to improved efficiency and reduced costs and environmental impacts [7,14,188,189,190,191].
Additionally, the results presented here correspond to a point-in-time image of the current situation, as both the marine energy resources and particularly the EROIs of marine technologies are continuously evolving. Indeed, a growing body of literature has started analyzing how marine resources may be affected by climate change in the future [100,192,193,194,195]. Resource potentials may also be affected by more restrictive environmental future legislations, such as the recent UN pledge to protect 30 percent of the planet’s lands and inland waters, as well as of marine and coastal areas, by 2030. Climate change may also shorten the lifespan of marine devices and increase maintenance costs [196], potentially reducing their energy return. The EROI of renewable energy systems are also dependent on the pace of technological innovation, the gains in operation experience, and the need for increased back-up generation and storage [186].
7. Future Industry and Research Directions
The marine energy landscape is diverse, with ongoing efforts to improve existing technologies and develop new devices and processes to reduce the levelized cost of energy (LCOE) and enable commercial exploitation of marine energy resources [14,71,197].
Despite numerous pilot systems being tested worldwide, the number of connected grid systems remains limited [6], highlighting the need for further development and investment [175].
Clear legal frameworks defining potential areas for development are crucial to facilitate the exploitation of marine energy resources [198]. Spain’s recent approval of the Maritime Space Management Plans (POEM) Royal Decree 150/2023 on 28 February 2023, which outlines specific offshore areas for wind energy exploitation, marks significant progress in this regard [199].
However, for such legal frameworks to be truly effective, they must be based on the most recent scientific evidence, especially with regard to sustainability. Despite the growing number of oceanic energy technologies, there has been relatively little research on the assessment of their environmental impacts, largely due to the fact that many of the currently available devices have not yet been deployed or tested [200,201]. Moreover, the vast marine areas and ecosystems where these technologies could be implemented make it difficult to identify all potential impacts [10]. Baseline data on biodiversity in sea waters are also limited, further complicating efforts to evaluate the impacts of marine energy technologies after installation [46].
According to the previous, and to ensure the sustainable exploitation of marine energy resources, future research should prioritize the assessment of environmental impacts, particularly on biodiversity and ecosystem health. A common framework for evaluating the environmental impacts of marine energy technologies should be developed upon common consensus of industry stakeholders, scientific experts and policymakers. Additionally, monitoring systems that track the environmental impacts of marine energy technologies over time should be established, and the collected information should be integrated into decision-making processes related to energy development. Most importantly, industry leaders should adopt a precautionary approach to the deployment of new marine energy technologies, which involves careful risk assessment and management to minimize environmental damages.
Furthermore, as with all other forms of renewable energy, marine energy is anticipated to be impacted by climate change. Indeed, climate change will modify the resource, will reduce the durability of infrastructures/devices and increase O&M costs [100,192,193,194,195]. Research in the field is currently focused on developing more resilient marine energy technologies that can withstand harsher ocean conditions resulting from climate change, while industry leaders are investing in adaptation strategies and renewable energy storage solutions to ensure the sustainability of marine energy resources in the long term.
8. Conclusions
In this work, we review the existing literature on the global potentials of marine energy sources, and the EROIs of currently available marine energy technologies. These values are used to estimate the net energy potential of marine technologies, as well as the average EROI of marine energy.
The technical potentials obtained in this work for offshore wind, wave and tidal stream are 55,000, 1000 and 180 /, respectively. The available literature allowed obtaining what might be considered approximations to the actual sustainable potentials for OTEC, SGE and tidal range. For OTEC and SGE, the sustainable potentials are 4380 and 570 /, respectively, while that of tidal range is negligible due to its high environmental impact.
The average EROIs are for offshore wind, waves and tidal range, 12 for tidal stream, 7 for OTEC and <7 for SGE. Based on their low EROIs, SGE is not considered a viable technology currently, while for OTEC we assume that only half of its sustainable potential will be exploitable with an EROI of 7.
The available evidence in the literature is insufficient to provide reliable estimates of the energy potential of ocean currents, nor the EROI of available ocean current technologies.
Crossing the estimated potentials and EROIs, we find that marine technologies (excluding ocean currents) could provide a maximum energy surplus of 57,000 /. Excluding offshore wind, the net energy from the oceans goes down to a maximum of , with OTEC being the major contributor (>77%).
Finally, the average EROI for the whole potential of all marine energy types combined is close to 20, while it goes down to when excluding offshore wind.
The estimations made in this work generally take optimistic views and do not take into account all economic and environmental restrictions. As such, we anticipate that subsequent studies will produce even narrower ranges. Therefore, we view this work as a contribution to a broader and ongoing dialogue on marine energy potentials, and an invitation for further research.
Author Contributions
The individual contributions of the co-authors of this work include: conceptualization, R.S. and J.S.; methodology, R.S.; software, R.S.; investigation, R.S., J.C. and A.G.-O.; writing—original draft preparation, R.S. and J.C; writing—review and editing, J.S, J.C and A.G.-O.; funding acquisition, J.S. All authors have read and agreed to the published version of the manuscript.
Funding
This work was supported by the European Union through the funding of the MEDEAS and LOCOMOTION projects under the Horizon 2020 research and innovation programme (grant agreements No 691287 and 821105, respectively).
Institutional Review Board Statement
Not applicable.
Informed Consent Statement
Not applicable.
Data Availability Statement
Not applicable.
Conflicts of Interest
The authors declare no conflict of interest.
Abbreviations
The following abbreviations are used in this manuscript:
| AGCM | Atmospheric General Circulation Models |
| API | Application Programming Interface |
| BRD | Buoy-Rope-Drum |
| CapMix | Capacitive Mixing |
| CED | Cumulative Energy Demand |
| CF | Capacity Factor |
| EE | Embedded Energy |
| EEZ | Exclusive Economic Zone |
| EGR | Energy Gain Ratio |
| EPBT | Energy Payback Time |
| EROI | Energy Return on Investment |
| EROIst | standard EROI |
| EROIpou | point-of-use EROI |
| EROIext | extended EROI |
| GHG | Greenhouse gas |
| HP | Harnessable Power |
| IAM | Integrated Assessment Models |
| JRC | Joint Research Centre |
| LCA | Life Cycle Assessment |
| LCOE | Levelized Cost of Energy |
| MRE | Marine Renewable Energy |
| OGCM | Ocean General Circulation Model |
| OHC | Ocean Heat Content |
| OTEC | Ocean Thermal Energy Conversion |
| OWSC | Oscillating Wave Surge Converter |
| O&M | Operation and Maintenance |
| PRO | Pressure Retarded Osmosis |
| RCP | Representative Concentration Pathways |
| RED | Reverse Electrodialysis |
| SGE | Salinity Gradient Energy |
| SGP | Salinity Gradient Power |
| SVP | Surface Velocity Program |
| THC | thermohaline circulation |
| TPP | Turbine Power Plants |
| VRE | Variable Renewable Energy |
| WEC | Wave Energy Converter |
| WED | Wave Energy Devices |
References
- Khan, M.Z.A.; Khan, H.A.; Aziz, M. Harvesting Energy from Ocean: Technologies and Perspectives. Energies 2022, 15, 3456. [Google Scholar] [CrossRef]
- Melikoglu, M. Current status and future of ocean energy sources: A global review. Ocean Eng. 2018, 148, 563–573. [Google Scholar] [CrossRef]
- Sang, Y.; Karayaka, H.B.; Yan, Y.; Yilmaz, N.; Souders, D. 1.18 Ocean (Marine) Energy. In Comprehensive Energy Systems; Dincer, I., Ed.; Elsevier: Oxford, UK, 2018; pp. 733–769. [Google Scholar] [CrossRef]
- Taveira-Pinto, F.; Rosa-Santos, P.; Fazeres-Ferradosa, T. Marine renewable energy. Renew. Energy 2020, 150, 1160–1164. [Google Scholar] [CrossRef]
- Ember Climate Data. 2022. Available online: https://ember-climate.org/data/ (accessed on 8 July 2022).
- IEA-OES. Annual Report: An Overview of Ocean Energy Activities in 2022; Technical Report, OES-IEA; OES-IEA: Paris, France, 2023. [Google Scholar]
- IEA-OES. Annual Report: An Overview of Ocean Energy Activities in 2021; Technical Report; OES-IEA; OES-IEA: Paris, France, 2022. [Google Scholar]
- IRENA. IRENASTAT Online Data Query Tool. 2022. Available online: http://pxweb.irena.org/pxweb/en/IRENASTAT (accessed on 8 July 2022).
- REN21. Renewables 2022 Global Status Report; REN21 Secretariat: Paris, France, 2022. [Google Scholar]
- Mendoza, E.; Lithgow, D.; Flores, P.; Felix, A.; Simas, T.; Silva, R. A framework to evaluate the environmental impact of OCEAN energy devices. Renew. Sustain. Energy Rev. 2019, 112, 440–449. [Google Scholar] [CrossRef]
- Boehlert, G.W.; Gill, A.B. Environmental and Ecological Effects of Ocean Renewable Energy Development: A Current Synthesis. Oceanography 2010, 23. [Google Scholar] [CrossRef]
- Inger, R.; Attrill, M.J.; Bearhop, S.; Broderick, A.C.; James Grecian, W.; Hodgson, D.J.; Mills, C.; Sheehan, E.; Votier, S.C.; Witt, M.J.; et al. Marine renewable energy: Potential benefits to biodiversity? An urgent call for research. J. Appl. Ecol. 2009, 46, 1145–1153. [Google Scholar] [CrossRef]
- Esteban, M.; Leary, D. Current developments and future prospects of offshore wind and ocean energy. Appl. Energy 2012, 90, 128–136. [Google Scholar] [CrossRef]
- Rosa-Santos, P.; Taveira-Pinto, F.; López, M.; Rodríguez, C.A. Hybrid Systems for Marine Energy Harvesting. J. Mar. Sci. Eng. 2022, 10, 633. [Google Scholar] [CrossRef]
- International Energy Agency (IEA). Offshore Wind Outlook 2019: World Energy Outlook Special Report; Technical Report; International Energy Agency: Paris, France, 2019. [Google Scholar]
- Li, J.; Wang, G.; Li, Z.; Yang, S.; Chong, W.T.; Xiang, X. A review on development of offshore wind energy conversion system. Int. J. Energy Res. 2020, 44, 9283–9297. [Google Scholar] [CrossRef]
- IEA. Wind Electricity. 2022. Available online: https://www.iea.org/reports/wind-electricity (accessed on 3 March 2023).
- Wilberforce, T.; El Hassan, Z.; Durrant, A.; Thompson, J.; Soudan, B.; Olabi, A. Overview of ocean power technology. Energy 2019, 175, 165–181. [Google Scholar] [CrossRef]
- REN21. Renewables 2020 Global Status Report; REN21 Secretariat: Paris, France, 2020. [Google Scholar]
- Leary, D.; Esteban, M. Climate Change and Renewable Energy from the Ocean and Tides: Calming the Sea of Regulatory Uncertainty. Int. J. Mar. Coast. Law 2009, 24, 617–651. [Google Scholar] [CrossRef]
- Salvador, S.; Costoya, X.; Sanz-Larruga, F.J.; Gimeno, L. Development of Offshore Wind Power: Contrasting Optimal Wind Sites with Legal Restrictions in Galicia, Spain. Energies 2018, 11, 731. [Google Scholar] [CrossRef]
- IRENA. Renewable Power Generation Costs in 2021; Technical Report; IRENA: Abu Dhabi, United Arab Emirates, 2022. [Google Scholar]
- German Advisory Council on Global Change. World in Transition—Towards Sustainable Energy Systems; Earthscan: Oxford, UK, 2003; p. 242. [Google Scholar]
- Bonar, P.A.; Bryden, I.G.; Borthwick, A.G. Social and ecological impacts of marine energy development. Renew. Sustain. Energy Rev. 2015, 47, 486–495. [Google Scholar] [CrossRef]
- Lloret, J.; Turiel, A.; Solé, J.; Berdalet, E.; Sabatés, A.; Olivares, A.; Gili, J.M.; Vila-Subirós, J.; Sardá, R. Unravelling the ecological impacts of large-scale offshore wind farms in the Mediterranean Sea. Sci. Total. Environ. 2022, 824, 153803. [Google Scholar] [CrossRef]
- Akhtar, N.; Geyer, B.; Schrum, C. Impacts of accelerating deployment of offshore windfarms on near-surface climate. Sci. Rep. 2022, 12, 18307. [Google Scholar] [CrossRef]
- Teske, S. Achieving the Paris Climate Agreement Goals: Global and Regional 100% Renewable Energy Scenarios with Non-Energy GHG Pathways for +1.5 °C and +2 °C; Springer Nature: Cham, Switzerland, 2019. [Google Scholar] [CrossRef]
- Bawazir, R.O.; Cetin, N.S. Comprehensive overview of optimizing PV-DG allocation in power system and solar energy resource potential assessments. Energy Rep. 2020, 6, 173–208. [Google Scholar] [CrossRef]
- Murphy, D.J.; Hall, C.A.S. Year in review—EROI or energy return on (energy) invested. Ann. N. Y. Acad. Sci. 2010, 1185, 102–118. [Google Scholar] [CrossRef]
- Dupont, E.; Germain, M.; Jeanmart, H. Estimate of the Societal Energy Return on Investment (EROI). Biophys. Econ. Sustain. 2021, 6, 2. [Google Scholar] [CrossRef]
- Hall, C.A.; Lambert, J.G.; Balogh, S.B. EROI of different fuels and the implications for society. Energy Policy 2014, 64, 141–152. [Google Scholar] [CrossRef]
- Dincer, I.; Rosen, M.A. Chapter 22—Exergetic life cycle assessment. In Exergy, 3rd ed.; Dincer, I., Rosen, M.A., Eds.; Elsevier: Amsterdam, The Netherlands, 2021; pp. 601–629. [Google Scholar] [CrossRef]
- ISO 14040:2006; Environmental Management–Life Cycle Assessment–Principles and Framework. ISO: Geneva, Switzerland, 2006. Available online: https://www.iso.org/standard/37456.html (accessed on 8 July 2022).
- ISO 14044:2006; Environmental Management–Life Cycle Assessment–Requirements and Guidelines. ISO: Geneva, Switzerland, 2006. Available online: https://www.iso.org/standard/38498.html (accessed on 8 July 2022).
- Palmer, G.; Floyd, J. An Exploration of Divergence in EPBT and EROI for Solar Photovoltaics. Biophys. Econ. Resour. Qual. 2017, 2, 15. [Google Scholar] [CrossRef]
- Hammond, G.P.; Jones, C.I.; Spevack, R. A technology assessment of the proposed Cardiff–Weston tidal barrage, UK. Proc. Inst. Civ. Eng.-Eng. Sustain. 2018, 171, 383–401. [Google Scholar] [CrossRef]
- Bhandari, K.P.; Collier, J.M.; Ellingson, R.J.; Apul, D.S. Energy payback time (EPBT) and energy return on energy invested (EROI) of solar photovoltaic systems: A systematic review and meta-analysis. Renew. Sustain. Energy Rev. 2015, 47, 133–141. [Google Scholar] [CrossRef]
- Parker, R.P.M.; Harrison, G.P.; Chick, J.P. Energy and carbon audit of an offshore wave energy converter. Proc. Inst. Mech. Eng. Part J. Power Energy 2007, 221, 1119–1130. [Google Scholar] [CrossRef]
- Paredes, M.G.; Padilla-Rivera, A.; Güereca, L.P. Life Cycle Assessment of Ocean Energy Technologies: A Systematic Review. J. Mar. Sci. Eng. 2019, 7, 322. [Google Scholar] [CrossRef]
- Dupont, E.; Koppelaar, R.; Jeanmart, H. Global available wind energy with physical and energy return on investment constraints. Appl. Energy 2018, 209, 322–338. [Google Scholar] [CrossRef]
- King, L.C.; van den Bergh, J.C.J.M. Implications of net energy-return-on-investment for a low-carbon energy transition. Nat. Energy 2018, 3, 334–340. [Google Scholar] [CrossRef]
- Hall, C.A. Introduction to Special Issue on New Studies in EROI (Energy Return on Investment). Sustainability 2011, 3, 1773–1777. [Google Scholar] [CrossRef]
- Bai, G.; Li, W.; Chang, H.; Li, G. The effect of tidal current directions on the optimal design and hydrodynamic performance of a three-turbine system. Renew. Energy 2016, 94, 48–54. [Google Scholar] [CrossRef]
- Egbert, G.D.; Ray, R.D. Significant dissipation of tidal energy in the deep ocean inferred from satellite altimeter data. Nature 2000, 405, 775–778. [Google Scholar] [CrossRef]
- Hermann, W.A. Quantifying global exergy resources. Energy 2006, 31, 1685–1702. [Google Scholar] [CrossRef]
- IRENA. Tidal Energy: Technology Brief; Technical Report June, IRENA; IRENA: Abu Dhabi, United Arab Emirates, 2014. [Google Scholar] [CrossRef]
- Ocean Energy Systems (OES). Annual Report 2012: Implementing Agreement on Ocean Energy Systems; Technical Report; OES-IEA: Paris, France, 2012. [Google Scholar]
- Hammons, T.J. Tidal power. Proc. IEEE 1993, 81, 419–433. [Google Scholar] [CrossRef]
- Sangiuliano, S.J. Planning for tidal current turbine technology: A case study of the Gulf of St. Lawrence. Renew. Sustain. Energy Rev. 2017, 70, 805–813. [Google Scholar] [CrossRef]
- Khan, N.; Kalair, A.; Abas, N.; Haider, A. Review of ocean tidal, wave and thermal energy technologies. Renew. Sustain. Energy Rev. 2017, 72, 590–604. [Google Scholar] [CrossRef]
- OceanEnergyCouncil. Ocean Current Energy. Available online: https://www.oceanenergycouncil.com/ocean-energy/ocean-current-energy/ (accessed on 15 December 2022).
- Nachtane, M.; Tarfaoui, M.; Hilmi, K.; Saifaoui, D.; El Moumen, A. Assessment of Energy Production Potential from Tidal Stream Currents in Morocco. Energies 2018, 11, 1065. [Google Scholar] [CrossRef]
- Lewis, M.; Neill, S.; Robins, P.; Hashemi, M. Resource assessment for future generations of tidal-stream energy arrays. Energy 2015, 83, 403–415. [Google Scholar] [CrossRef]
- Evans, P.S. Hydrodynamic Characteristics of Macrotidal Straits and Implications for Tidal Stream Turbine Deployment. Ph.D. thesis, School of Earth and Ocean Sciences, Columbia, SC, USA, 2014. [Google Scholar] [CrossRef]
- Neill, S.P.; Angeloudis, A.; Robins, P.E.; Walkington, I.; Ward, S.L.; Masters, I.; Lewis, M.J.; Piano, M.; Avdis, A.; Piggott, M.D.; et al. Tidal range energy resource and optimization—Past perspectives and future challenges. Renew. Energy 2018, 127, 763–778. [Google Scholar] [CrossRef]
- Neill, S.P.; Hemer, M.; Robins, P.E.; Griffiths, A.; Furnish, A.; Angeloudis, A. Tidal range resource of Australia. Renew. Energy 2021, 170, 683–692. [Google Scholar] [CrossRef]
- Ocean Energy Systems (OES). Annual Report 2008: Implementing Agreement on Ocean Energy Systems; Technical Report; OES-IEA: Paris, France, 2008. [Google Scholar]
- Harvey, L.D. Energy and the New Reality 2: Carbon-Free Energy Supply; Routledge: London, UK, 2010; pp. 1–576. [Google Scholar] [CrossRef]
- Reguero, B.; Losada, I.; Méndez, F. A global wave power resource and its seasonal, interannual and long-term variability. Appl. Energy 2015, 148, 366–380. [Google Scholar] [CrossRef]
- Wahyudie, A.; Jama, M.; Susilo, T.; Saeed, O.; Nandar, C.; Harib, K. Simple bottom-up hierarchical control strategy for heaving wave energy converters. Int. J. Electr. Power Energy Syst. 2017, 87, 211–221. [Google Scholar] [CrossRef]
- Assessing the Global Wave Energy Potential. In Proceedings of the ASME 2010 29th International Conference on Ocean, Offshore and Arctic Engineering, Shanghai, China, 6–11 June 2010. [CrossRef]
- Gunn, K.; Stock-Williams, C. Quantifying the global wave power resource. Renew. Energy 2012, 44, 296–304. [Google Scholar] [CrossRef]
- Weiss, C.V.; Guanche, R.; Ondiviela, B.; Castellanos, O.F.; Juanes, J. Marine renewable energy potential: A global perspective for offshore wind and wave exploitation. Energy Convers. Manag. 2018, 177, 43–54. [Google Scholar] [CrossRef]
- Folley, M.; Whittaker, T. Analysis of the nearshore wave energy resource. Renew. Energy 2009, 34, 1709–1715. [Google Scholar] [CrossRef]
- WaveNet. Results from the work of the European Thematic Network on Wave Energy; Technical Report; European Community; WaveNet: Birmingham, UK, 2003. [Google Scholar]
- Cruz, J. Ocean Wave Energy: Current Status and Future Prespectives; Springer: Berlin/Heidelberg, Germany, 2008. [Google Scholar] [CrossRef]
- Bernhoff, H.; Sjöstedt, E.; Leijon, M. Wave energy resources in sheltered sea areas: A case study of the Baltic Sea. Renew. Energy 2006, 31, 2164–2170. [Google Scholar] [CrossRef]
- Haas, K.; Yang, X.; Neary, V.; Gunawan, B. Ocean Current Energy Resource Assessment for the Gulf Stream System: The Florida Current. In Marine Renewable Energy: Resource Characterization and Physical Effects; Yang, Z., Copping, A., Eds.; Springer International Publishing: Cham, Switzerland, 2017; pp. 217–236. [Google Scholar] [CrossRef]
- Barnier, B.; Domina, A.; Gulev, S.; Molines, J.M.; Maitre, T.; Penduff, T.; Le Sommer, J.; Brasseur, P.; Brodeau, L.; Colombo, P. Modelling the impact of flow-driven turbine power plants on great wind-driven ocean currents and the assessment of their energy potential. Nat. Energy 2020, 5, 240–249. [Google Scholar] [CrossRef]
- Finkl, C.W.; Charlier, R. Electrical power generation from ocean currents in the Straits of Florida: Some environmental considerations. Renew. Sustain. Energy Rev. 2009, 13, 2597–2604. [Google Scholar] [CrossRef]
- Shirasawa, K.; Tokunaga, K.; Iwashita, H.; Shintake, T. Experimental verification of a floating ocean-current turbine with a single rotor for use in Kuroshio currents. Renew. Energy 2016, 91, 189–195. [Google Scholar] [CrossRef]
- Von Arx, W.; Stewart, H.; Apel, J. The Florida current as a potential source of usable energy. In Proceedings of the Mac Arthur Workshop Feasibility of Extracting Usable Energy From the Florida Current, Palm Beach Shores, FL, USA, 27 February–1 March 1974; pp. 91–101. [Google Scholar]
- Lissaman, P. The Coriolis Program. Oceanus 1979, 22, 23–28. [Google Scholar]
- Hanson, H.P.; Bozek, A.; Duerr, A.E.S. The Florida Current: A Clean but Challenging Energy Resource. EOS Trans. Am. Geophys. Union 2011, 92, 29–30. [Google Scholar] [CrossRef]
- Duerr, A.E.S.; Dhanak, M.R. An Assessment of the Hydrokinetic Energy Resource of the Florida Current. IEEE J. Ocean. Eng. 2012, 37, 281–293. [Google Scholar] [CrossRef]
- Neary, V.S.; Gunawan, B.; Ryou, A. Performance evaluation of HYCOM-GOM for hydrokinetic resource assessment in the Florida Strait. In ORNL Technical Memorandum, ORNL/TM-2012/22, June; ORNL: Oak Ridge, TN, USA, 2012. [Google Scholar]
- Yang, X.; Haas, K.A.; Fritz, H.M. Evaluating the potential for energy extraction from turbines in the gulf stream system. Renew. Energy 2014, 72, 12–21. [Google Scholar] [CrossRef]
- Yang, X.; Haas, K.A.; Fritz, H.M. Theoretical assessment of ocean current energy potential for the gulf stream system. Mar. Technol. Soc. J. 2013, 47, 101–112. [Google Scholar] [CrossRef]
- San, O. Numerical assessments of ocean energy extraction from western boundary currents using a quasi-geostrophic ocean circulation model. Int. J. Mar. Energy 2016, 16, 12–29. [Google Scholar] [CrossRef]
- Kabir, A.; Lemongo-Tchamba, I.; Fernandez, A. An assessment of available ocean current hydrokinetic energy near the North Carolina shore. Renew. Energy 2015, 80, 301–307. [Google Scholar] [CrossRef]
- Chen, F. Kuroshio power plant development plan. Renew. Sustain. Energy Rev. 2010, 14, 2655–2668. [Google Scholar] [CrossRef]
- Chang, Y.C.; Chu, P.C.; Tseng, R.S. Site selection of ocean current power generation from drifter measurements. Renew. Energy 2015, 80, 737–745. [Google Scholar] [CrossRef]
- Liu, T.; Wang, B.; Hirose, N.; Yamashiro, T.; Yamada, H. High-resolution modeling of the Kuroshio current power south of Japan. J. Ocean. Eng. Mar. Energy 2018, 4, 37–55. [Google Scholar] [CrossRef]
- Komaki, H.; Yamashiro, T.; Jomoto, K.; Nishina, A.; Nakamura, H.; Hirose, N. Investigation of the Kuroshio current in the Tokara Strait for ocean current power generation. J. Jpn. Soc. Civ. Eng. Ser. 3 (Ocean Eng.) 2013, 69, 109–113. [Google Scholar] [CrossRef]
- Kodaira, T.; Waseda, T.; Nakagawa, T.; Isoguchi, O.; Miyazawa, Y. Measuring the Kuroshio current around Miyake Island, a potential site for ocean-current power generation. Int. J. Offshore Polar Eng. 2013, 23, 272–278. [Google Scholar]
- Marais, E.; Chowdhury, S.; Chowdhury, S.P. Theoretical resource assessment of marine current energy in the Agulhas Current along South Africa’s East coast. In Proceedings of the 2011 IEEE Power and Energy Society General Meeting, Detroit, MI, USA, 24–29 July 2011; pp. 1–8. [Google Scholar] [CrossRef]
- Meyer, I.; Van Niekerk, J.L. Towards a practical resource assessment of the extractable energy in the Agulhas ocean current. Int. J. Mar. Energy 2016, 16, 116–132. [Google Scholar] [CrossRef]
- Charlier, R.H.; Justus, J.R. Ocean Energies: Environmental, Economic, and Technological Aspects of Alternative Power Sources; Elsevier: Amsterdam, The Netherlands, 1993; p. 534. [Google Scholar]
- VanZwieten, J.; Duerr, A.; Alsenas, G.; Hanson, H. Global ocean current energy assessment: An initial look. In Proceedings of the 1st Marine Energy Technology Symposium (METS13) hosted by the 6th Annual Global Marine Renewable Energy Conference, Washington, DC, USA, 14–15 April 2013; pp. 10–11. [Google Scholar]
- Tseng, R.S.; Chang, Y.C.; Chu, P. Use of Global Satellite Altimeter and Drifter Data for Ocean Current Resource Characterization; Springer: Berlin/Heidelberg, Germany, 2017; pp. 159–177. [Google Scholar] [CrossRef]
- Hu, B.; Zhu, R.; Sun, Y.; Huang, W.; Shao, C.; Niu, T.; Zhou, J.; Sun, K.; Li, C.; Xie, K. Coordinated layout planning of ocean current turbines and collector system considering spatial velocity distribution. Electr. Power Syst. Res. 2021, 200, 107450. [Google Scholar] [CrossRef]
- Alcérreca-Huerta, J.C.; Encarnacion, J.I.; Ordoñez-Sánchez, S.; Callejas-Jiménez, M.; Gallegos Diez Barroso, G.; Allmark, M.; Mariño-Tapia, I.; Silva Casarín, R.; O’Doherty, T.; Johnstone, C.; et al. Energy Yield Assessment from Ocean Currents in the Insular Shelf of Cozumel Island. J. Mar. Sci. Eng. 2019, 7, 147. [Google Scholar] [CrossRef]
- Nihous, G.C. An Order-of-Magnitude Estimate of Ocean Thermal Energy Conversion Resources. J. Energy Resour. Technol. 2005, 127, 328–333. [Google Scholar] [CrossRef]
- Nihous, G.C. A Preliminary Assessment of Ocean Thermal Energy Conversion Resources. J. Energy Resour. Technol. 2007, 129, 10–17. [Google Scholar] [CrossRef]
- García-Olivares, A. Energy for a sustainable post-carbon society. Sci. Mar. 2016, 80, 257–268. [Google Scholar] [CrossRef]
- Martel, L.; Smith, P.; Rizea, S.; Van Ryzin, J.; Morgan, C.; Noland, G.; Pavlosky, R.; Thomas, M.; Halkyard, J. Ocean Thermal Energy Conversion Life Cycle Cost Assessment, Final Technical Report, 30 May 2012; Technical Report; Lockheed Martin: Bethesda, MD, USA, 2012. [Google Scholar] [CrossRef]
- Rajagopalan, K.; Nihous, G.C. Estimates of global Ocean Thermal Energy Conversion (OTEC) resources using an ocean general circulation model. Renew. Energy 2013, 50, 532–540. [Google Scholar] [CrossRef]
- Jia, Y.; Nihous, G.C.; Rajagopalan, K. An Evaluation of the Large-Scale Implementation of Ocean Thermal Energy Conversion (OTEC) Using an Ocean General Circulation Model with Low-Complexity Atmospheric Feedback Effects. J. Mar. Sci. Eng. 2018, 6. [Google Scholar] [CrossRef]
- Rajagopalan, K.; Nihous, G.C. An Assessment of Global Ocean Thermal Energy Conversion Resources With a High-Resolution Ocean General Circulation Model. J. Energy Resour. Technol. 2013, 135, 041202. [Google Scholar] [CrossRef]
- Du, T.; Jing, Z.; Wu, L.; Wang, H.; Chen, Z.; Ma, X.; Gan, B.; Yang, H. Growth of ocean thermal energy conversion resources under greenhouse warming regulated by oceanic eddies. Nat. Commun. 2022, 13, 7249. [Google Scholar] [CrossRef]
- Qingfen, M.; Yun, Z.; Hui, L.; Jingru, L.; Shenghui, W.; Chengpeng, W.; Zhongye, W.; Yijun, S.; Xuejin, L. A Novel Ocean Thermal Energy Driven System for Sustainable Power and Fresh Water Supply. Membranes 2022, 12, 160. [Google Scholar] [CrossRef]
- Zhou, S.; Liu, X.; Bian, Y.; Shen, S.; Shen, S. Energy, exergy and exergoeconomic analysis of a combined cooling, desalination and power system. Energy Convers. Manag. 2020, 218, 113006. [Google Scholar] [CrossRef]
- Isaacs, J.D.; Seymour, R.J. The ocean as a power resource. Int. J. Environ. Stud. 1973, 4, 201–205. [Google Scholar] [CrossRef]
- Wick, G.; Schmitt, W. Prospects for renewable energy from sea. Mar. Technol. Soc. J. 1977, 5–6, 16–21. [Google Scholar]
- Yip, N.Y.; Brogioli, D.; Hamelers, H.V.M.; Nijmeijer, K. Salinity Gradients for Sustainable Energy: Primer, Progress, and Prospects. Environ. Sci. Technol. 2016, 50, 12072–12094. [Google Scholar] [CrossRef] [PubMed]
- Post, J.W. Blue Energy: Electricity Production from Salinity Gradients by Reverse Electrodialysis. Ph.D. Thesis, Wageningen University, Wageningen, The Netherlands, 2009. [Google Scholar]
- Kuleszo, J.; Kroeze, C.; Post, J.; Fekete, B.M. The potential of blue energy for reducing emissions of CO2 and non-CO2 greenhouse gases. J. Integr. Environ. Sci. 2010, 7, 89–96. [Google Scholar] [CrossRef]
- Stenzel, P.; Wagner, H. Osmotic power plants: Potential analysis and site criteria. In Proceedings of the 3rd International Conference on Ocean Energy, Bilbao, Spain, 6 October 2010; pp. 1–5. [Google Scholar]
- IRENA. Salinity Gradient Energy Conversion: Technology Brief; Technical Report June; IRENA: Abu Dhabi, United Arab Emirates, 2014. [Google Scholar]
- Aaberg, R.J. Osmotic power: A new and powerful renewable energy source? Refocus 2003, 4, 48–50. [Google Scholar] [CrossRef]
- Krewitt, W.; Nienhaus, K.; Klessmann, C.; Capone, C.; Stricker, E.; Graus, W.H.J.; Hoogwijk, M.M.; Supersberger, N.; von Winterfeld, U.; Samadi, S. Role and Potential of Renewable Energy and Energy Efficiency for Global Energy Supply; Umweltbundesamt: Dessau-Roßlau, Germany, 2009. [Google Scholar]
- Yip, N.Y.; Elimelech, M. Thermodynamic and Energy Efficiency Analysis of Power Generation from Natural Salinity Gradients by Pressure Retarded Osmosis. Environ. Sci. Technol. 2012, 46, 5230–5239. [Google Scholar] [CrossRef]
- Skråmestø, .S.; Skilhagen, S.E.; Nielsen, W.K. Power Production Based on Osmotic Pressure. In Proceedings of Waterpower XVI, Spokane, WA, USA, 27–30 July 2009. [Google Scholar]
- Thorsen, T.; Holt, T. The potential for power production from salinity gradients by pressure retarded osmosis. J. Membr. Sci. 2009, 335, 103–110. [Google Scholar] [CrossRef]
- Alvarez-Silva, O.; Osorio, A.; Winter, C. Practical global salinity gradient energy potential. Renew. Sustain. Energy Rev. 2016, 60, 1387–1395. [Google Scholar] [CrossRef]
- Helfer, F.; Lemckert, C. The power of salinity gradients: An Australian example. Renew. Sustain. Energy Rev. 2015, 50, 1–16. [Google Scholar] [CrossRef]
- Gale, R.; Barg, S. Earthscan; Earthscan Publications Ltd.: London, UK, 1995; p. 381. [Google Scholar]
- Perveen, R.; Kishor, N.; Mohanty, S.R. Off-shore wind farm development: Present status and challenges. Renew. Sustain. Energy Rev. 2014, 29, 780–792. [Google Scholar] [CrossRef]
- Castro-Santos, L.; Diaz-Casas, V. Floating Offshore Wind Farms; Springer International Publishing: Berlin/Heidelberg, Germany, 2016; p. 204. [Google Scholar] [CrossRef]
- Shi, J.; Erdem, E. Estimation of Wind Energy Potential and Prediction of Wind Power. In Wind Energy Engineering. A Handbook for Onshore and Offshore Wind Turbines; Academic Press: Cambridge, MA, USA, 2017. [Google Scholar] [CrossRef]
- Bosch, J.; Staffell, I.; Hawkes, A.D. Temporally explicit and spatially resolved global offshore wind energy potentials. Energy 2018, 163, 766–781. [Google Scholar] [CrossRef]
- Xi Lu, M.B.M.; Kiviluoma, J. Global potential for wind-generated electricity. Proc. Natl. Acad. Sci. USA 2009, 106, 10933–10938. [Google Scholar] [CrossRef]
- Arent, D.; Sullivan, P.; Heimiller, D.; Lopez, A.; Eurek, K.; Badger, J.; Jorgensen, H.E.; Kelly, M.; Clarke, L.; Luckow, P. Improved Offshore Wind Resource Assessment in Global Climate Stabilization Scenarios; Technical Report; National Renewable Energy Laboratory: Golden, CO, USA, 2012. [Google Scholar] [CrossRef]
- Adams, A.S.; Keith, D.W. Are global wind power resource estimates overstated? Environ. Res. Lett. 2013, 8, 15021. [Google Scholar] [CrossRef]
- Deng, Y.Y.; Haigh, M.; Pouwels, W.; Ramaekers, L.; Brandsma, R.; Schimschar, S.; Grözinger, J.; de Jager, D. Quantifying a realistic, worldwide wind and solar electricity supply. Glob. Environ. Chang. 2015, 31, 239–252. [Google Scholar] [CrossRef]
- Rule, B.M.; Worth, Z.J.; Boyle, C.A. Comparison of Life Cycle Carbon Dioxide Emissions and Embodied Energy in Four Renewable Electricity Generation Technologies in New Zealand. Environ. Sci. Technol. 2009, 43, 6406–6413. [Google Scholar] [CrossRef] [PubMed]
- Douglas, C.A.; Harrison, G.P.; Chick, J.P. Life cycle assessment of the Seagen marine current turbine. Proc. Inst. Mech. Eng. Part M J. Eng. Marit. Environ. 2008, 222, 1–12. [Google Scholar] [CrossRef]
- Walker, S.; Howell, R.; Hodgson, P.; Griffin, A. Tidal energy machines: A comparative life cycle assessment study. Proc. Inst. Mech. Eng. Part M J. Eng. Marit. Environ. 2015, 229, 124–140. [Google Scholar] [CrossRef]
- Kaddoura, M.; Molander, S. Deliverable D6.1: LCA Report, 2018; Project Deliverable powerKite; powerKite: Noordwijk, The Netherlands, 2018. [Google Scholar]
- Binnie, C. Tidal energy from the Severn estuary, UK. Proc. Inst. Civ. Eng.-Energy 2016, 169, 3–17. [Google Scholar] [CrossRef]
- Roberts, F. Energy accounting of river severn tidal power schemes. Appl. Energy 1982, 11, 197–213. [Google Scholar] [CrossRef]
- Kelly, K.; McManus, M.; Hammond, G. An energy and carbon life cycle assessment of tidal power case study: The proposed Cardiff–Weston severn barrage scheme. Energy 2012, 44, 692–701. [Google Scholar] [CrossRef]
- Hammond, G.; Jones, C.; Spevack, R. The ‘Shoots Barrage’: An Indicative Energy Technology Assessment of a Tidal Power Scheme. J. Sustain. Dev. Energy Water Environ. Syst. 2014, 2, 388–407. [Google Scholar] [CrossRef]
- Simon, P. Assessment of Embodied Energy and Carbon Emissions of the Swansea Bay Tidal Lagoon From a Life Cycle Perspective. Master’s Thesis, Mittuniversitetet (Mid Sweden University), Sundsvall, Sweden, 2015. [Google Scholar]
- Dahlsten, H. Life Cycle Assessment of Electricity from Wave Power. Master’s Thesis, Department of Energy and Technology, Swedish University of Agricultural Sciences, Uppsala, Sweden, 2009. [Google Scholar]
- Walker, S.; Howell, R. Life cycle comparison of a wave and tidal energy device. Proc. Inst. Mech. Eng. Part M J. Eng. Marit. Environ. 2011, 225, 325–337. [Google Scholar] [CrossRef]
- Karan, H.; Thomson, R.C.; Harrison, G.P. Full life cycle assessment of two surge wave energy converters. Proc. Inst. Mech. Eng. Part A J. Power Energy 2020, 234, 548–561. [Google Scholar] [CrossRef]
- Zhai, Q.; Zhu, L.; Lu, S. Life Cycle Assessment of a Buoy-Rope-Drum Wave Energy Converter. Energies 2018, 11, 2432. [Google Scholar] [CrossRef]
- Sørensen, H.C.; Naef, S.; Anderberg, S.; Hauschild, M.Z. Life cycle assessment of the wave energy converter: Wave Dragon. In Proceedings of the International Conference Ocean Energy—From Innovation to Industry, Hanoi, Vietnam, 5–9 March 2007; Poster session presented at Conference in Bremerhaven. [Google Scholar]
- Wenzel, H.; Hauschild, M.; Alting, L.; Overcash, M. Environmental assessment of products volume 1: Methodology, tools, and case studies in product. Int. J. Life Cycle Assess. 1999, 4, 6. [Google Scholar] [CrossRef]
- Banerjee, S.; Duckers, L.; Blanchard, R.E. An overview on green house gas emission characteristics and energy evaluation of ocean energy systems from life cycle assessment and energy accounting studies. J. Appl. Nat. Sci. 2013, 5, 535–540. [Google Scholar] [CrossRef]
- Schleisner, L. Life Cycle Assessment of a Wind Farm and related externalities. Renew. Energy 2000, 20, 279–288. [Google Scholar] [CrossRef]
- Hammond, G.P.; Jones, C.I. Embodied energy and carbon in construction materials. Proc. Inst. Civ. Eng.-Energy 2008, 161, 87–98. [Google Scholar] [CrossRef]
- Thomson, R.C.; Chick, J.P.; Harrison, G.P. An LCA of the Pelamis wave energy converter. Int. J. Life Cycle Assess. 2019, 24, 51–63. [Google Scholar] [CrossRef]
- Apolonia, M.; Simas, T. Life Cycle Assessment of an Oscillating Wave Surge Energy Converter. J. Mar. Sci. Eng. 2021, 9, 206. [Google Scholar] [CrossRef]
- Pennock, S.; Vanegas-Cantarero, M.M.; Bloise-Thomaz, T.; Jeffrey, H.; Dickson, M.J. Life cycle assessment of a point-absorber wave energy array. Renew. Energy 2022, 190, 1078–1088. [Google Scholar] [CrossRef]
- Uihlein, A. Life cycle assessment of ocean energy technologies. Int. J. Life Cycle Assess. 2016, 21, 1425–1437. [Google Scholar] [CrossRef]
- Minesto. Available online: https://minesto.com/ocean-energy/ (accessed on 6 March 2023).
- Ueno, T.; Nagaya, S.; Shimizu, M.; Saito, H.; Murata, S.; Handa, N. Development and Demonstration Test for Floating Type Ocean Current Turbine System Conducted in Kuroshio Current. In Proceedings of the 2018 OCEANS—MTS/IEEE Kobe Techno-Oceans (OTO), Kobe, Japan, 28–31 May 2018; pp. 1–6. [Google Scholar] [CrossRef]
- Practical Design of Ships and Other Floating Structures. In Proceedings of the 14th International Symposium, PRADS 2019, Yokohama, Japan, 22—26 September 2019 — Volume III, Lecture Notes in Civil Engineering. Yokohama, Japan, 22–26 September 2019; Springer: Singapore, 2021; Volume 65. [CrossRef]
- Aalbers, R.R.D. Life Cycle Assessment of Ocean Thermal Energy Conversion. Master’s Thesis, Delft University of Technology, Delft, The Netherlands, 2015. [Google Scholar]
- Hauer, W.B. Warm Water Entrainment Impacts and Environmental Life Cycle Assessment of a Proposed Ocean Thermal Energy Conversion Pilot Plant Offshore Oahu, Hawaii. Ph.D. Thesis, University of New Hampshire, Durham, NH, USA, 2017. [Google Scholar]
- Papapetrou, M.; Kumpavat, K. 10- Environmental aspects and economics of salinity gradient power (SGP) processes. In Sustainable Energy from Salinity Gradients; Cipollina, A., Micale, G., Eds.; Woodhead Publishing: Sawston, UK, 2016; pp. 315–335. [Google Scholar] [CrossRef]
- Seyfried, C.; Palko, H.; Dubbs, L. Potential local environmental impacts of salinity gradient energy: A review. Renew. Sustain. Energy Rev. 2019, 102, 111–120. [Google Scholar] [CrossRef]
- Mueller, K.E.; Thomas, J.T.; Johnson, J.X.; DeCarolis, J.F.; Call, D.F. Life cycle assessment of salinity gradient energy recovery using reverse electrodialysis. J. Ind. Ecol. 2021, 25, 1194–1206. [Google Scholar] [CrossRef]
- Tristán, C.; Rumayor, M.; Dominguez-Ramos, A.; Fallanza, M.; Ibáñez, R.; Ortiz, I. Life cycle assessment of salinity gradient energy recovery by reverse electrodialysis in a seawater reverse osmosis desalination plant. Sustain. Energy Fuels 2020, 4, 4273–4284. [Google Scholar] [CrossRef]
- Marin-Coria, E.; Silva, R.; Enriquez, C.; Martínez, M.L.; Mendoza, E. Environmental Assessment of the Impacts and Benefits of a Salinity Gradient Energy Pilot Plant. Energies 2021, 14, 3252. [Google Scholar] [CrossRef]
- Zachopoulos, K.; Kokkos, N.; Elmasides, C.; Sylaios, G. Coupling Hydrodynamic and Energy Production Models for Salinity Gradient Energy Assessment in a Salt-Wedge Estuary (Strymon River, Northern Greece). Energies 2022, 15, 2970. [Google Scholar] [CrossRef]
- Aftalion, J.; Hipkiss, R.; Pierce, L.; Ogunsola, S.; Sarvananthan, T.; Saunders, S. Salinity Gradient Power Generation; IRENA: Abu Dhabi, United Arab Emirates, 2014. [Google Scholar]
- Acuña Mora, D.; de Rijck, A. Blue Energy: Salinity Gradient Power in Practice; Technical Report; United Nations: New York, NY, USA, 2015. [Google Scholar]
- Zoungrana, A.; Çakmakci, M. Optimization of the reverse electrodialysis power output through the ratio of the feed solutions salinity. IET Renew. Power Gener. 2021, 15, 769–777. [Google Scholar] [CrossRef]
- Kubiszewski, I.; Cleveland, C.J.; Endres, P.K. Meta-analysis of net energy return for wind power systems. Renew. Energy 2010, 35, 218–225. [Google Scholar] [CrossRef]
- Weinzettel, J.; Reenaas, M.; Solli, C.; Hertwich, E.G. Life cycle assessment of a floating offshore wind turbine. Renew. Energy 2009, 34, 742–747. [Google Scholar] [CrossRef]
- Raadal, H.L.; Vold, B.I.; Myhr, A.; Nygaard, T.A. GHG emissions and energy performance of offshore wind power. Renew. Energy 2014, 66, 314–324. [Google Scholar] [CrossRef]
- Garcia-Teruel, A.; Rinaldi, G.; Thies, P.R.; Johanning, L.; Jeffrey, H. Life cycle assessment of floating offshore wind farms: An evaluation of operation and maintenance. Appl. Energy 2022, 307, 118067. [Google Scholar] [CrossRef]
- Bonou, A.; Laurent, A.; Olsen, S.I. Life cycle assessment of onshore and offshore wind energy-from theory to application. Appl. Energy 2016, 180, 327–337. [Google Scholar] [CrossRef]
- Kis, Z.; Pandya, N.; Koppelaar, R.H. Electricity generation technologies: Comparison of materials use, energy return on investment, jobs creation and CO2 emissions reduction. Energy Policy 2018, 120, 144–157. [Google Scholar] [CrossRef]
- Siemens Gamesa Renewable Energy. A Clean Energy Solution—From Cradle to Grave. Environmental Product Declaration SG 8.0-167 DD. 2019. Available online: https://www.siemensgamesa.com/-/media/siemensgamesa/downloads/en/products-and-services/offshore/brochures/siemens-gamesa-environmental-product-declaration-epd-sg-8-0-167.pdf (accessed on 14 December 2022).
- Elsam Engineering A/S. Life Cycle Assessment of Offshore and Onshore Sited Wind Power Based on Vesta V90-3.o MW Turbines. 2006. Available online: https://www.vestas.com/en/sustainability/environment/energy-payback (accessed on 10 January 2023).
- Wagner, H.J.; Baack, C.; Eickelkamp, T.; Epe, A.; Lohmann, J.; Troy, S. Life cycle assessment of the offshore wind farm alpha ventus. Energy 2011, 36, 2459–2464. [Google Scholar] [CrossRef]
- Raugei, M.; Leccisi, E. A comprehensive assessment of the energy performance of the full range of electricity generation technologies deployed in the United Kingdom. Energy Policy 2016, 90, 46–59. [Google Scholar] [CrossRef]
- Walmsley, T.G.; Walmsley, M.R.; Atkins, M.J. Energy Return on energy and carbon investment of wind energy farms: A case study of New Zealand. J. Clean. Prod. 2017, 167, 885–895. [Google Scholar] [CrossRef]
- Huang, Y.F.; Gan, X.J.; Chiueh, P.T. Life cycle assessment and net energy analysis of offshore wind power systems. Renew. Energy 2017, 102, 98–106. [Google Scholar] [CrossRef]
- De Castro, C.; Capellán-Pérez, I. Standard, Point of Use, and Extended Energy Return on Energy Invested (EROI) from Comprehensive Material Requirements of Present Global Wind, Solar, and Hydro Power Technologies. Energies 2020, 13, 36. [Google Scholar] [CrossRef]
- Hussain, A.; Arif, S.M.; Aslam, M. Emerging renewable and sustainable energy technologies: State of the art. Renew. Sustain. Energy Rev. 2017, 71, 12–28. [Google Scholar] [CrossRef]
- Horrillo-Caraballo, J.; Yin, Y.; Fairley, I.; Karunarathna, H.; Masters, I.; Reeve, D. A comprehensive study of the tides around the Welsh coastal waters. Estuarine Coast. Shelf Sci. 2021, 254, 107326. [Google Scholar] [CrossRef]
- Kim, J.; Ha, H.; Woo, S.B.; Kim, M.S.; Kwon, H.K. Unbalanced sediment transport by tidal power generation in Lake Sihwa. Renew. Energy 2021, 172, 1133–1144. [Google Scholar] [CrossRef]
- Hendry, C. The role of tidal lagoons. Final. Rep. 2016, 1718, 52. [Google Scholar]
- Li, C.; Mogollón, J.M.; Tukker, A.; Steubing, B. Environmental Impacts of Global Offshore Wind Energy Development until 2040. Environ. Sci. Technol. 2022, 56, 11567–11577. [Google Scholar] [CrossRef] [PubMed]
- Scheidat, M.; Tougaard, J.; Brasseur, S.; Carstensen, J.; Van Polanen Petel, T.; Teilmann, J.; Reijnders, P. Harbour porpoises (Phocoena phocoena) and wind farms: A case study in the Dutch North Sea. Environ. Res. Lett. 2011, 6, 025102. [Google Scholar] [CrossRef]
- Chu, C.T.; Hawkes, A.D. A geographic information system-based global variable renewable potential assessment using spatially resolved simulation. Energy 2020, 193, 116630. [Google Scholar] [CrossRef]
- Varlas, G.; Christakos, K.; Cheliotis, I.; Papadopoulos, A.; Steeneveld, G.J. Spatiotemporal variability of marine renewable energy resources in Norway. Energy Procedia 2017, 125, 180–189. [Google Scholar] [CrossRef]
- Wu, X.; Xia, X.; Chen, G.; Wu, X.; Chen, B. Embodied energy analysis for coal-based power generation system-highlighting the role of indirect energy cost. Appl. Energy 2016, 184, 936–950. [Google Scholar] [CrossRef]
- Koppelaar, R. Solar-PV energy payback and net energy: Meta-assessment of study quality, reproducibility, and results harmonization. Renew. Sustain. Energy Rev. 2017, 72, 1241–1255. [Google Scholar] [CrossRef]
- Solé, J.; García-Olivares, A.; Turiel, A.; Ballabrera-Poy, J. Renewable transitions and the net energy from oil liquids: A scenarios study. Renew. Energy 2018, 116, 258–271. [Google Scholar] [CrossRef]
- Brand-Correa, L.I.; Brockway, P.E.; Copeland, C.L.; Foxon, T.J.; Owen, A.; Taylor, P.G. Developing an Input-Output Based Method to Estimate a National-Level Energy Return on Investment (EROI). Energies 2017, 10, 534. [Google Scholar] [CrossRef]
- Zhang, X.; Zhang, L.; Yuan, Y.; Zhai, Q. Life Cycle Assessment on Wave and Tidal Energy Systems: A Review of Current Methodological Practice. Int. J. Environ. Res. Public Health 2020, 17, 1604. [Google Scholar] [CrossRef] [PubMed]
- Marziah, Z.; Azhim, A.; Mahdzir, A.; Musa, M.N.; Jaafar, A.B. Potential of deep seawater mariculture for economic transformation in Sabah, Malaysia. In Proceedings of the 2015 10th Asian Control Conference (ASCC), Kota Kinabalu, Malaysia, 31 May–3 June 2015; pp. 1–6. [Google Scholar] [CrossRef]
- McTiernan, K.L.; Sharman, K.T. Review of Hybrid Offshore Wind and Wave Energy Systems. J. Phys. Conf. Ser. 2020, 1452, 012016. [Google Scholar] [CrossRef]
- Garavelli, L.; Freeman, M.C.; Tugade, L.G.; Greene, D.; McNally, J. A feasibility assessment for co-locating and powering offshore aquaculture with wave energy in the United States. Ocean. Coast. Manag. 2022, 225, 106242. [Google Scholar] [CrossRef]
- Aumesquet-Carreto, M.Á.; Ortega-Delgado, B.; García-Rodríguez, L. Opportunities of Reducing the Energy Consumption of Seawater Reverse Osmosis Desalination by Exploiting Salinity Gradients. Membranes 2022, 12, 1045. [Google Scholar] [CrossRef]
- Gernaat, D.E.H.J.; de Boer, H.S.; Daioglou, V.; Yalew, S.G.; Müller, C.; van Vuuren, D.P. Climate change impacts on renewable energy supply. Nat. Clim. Chang. 2021, 11, 119–125. [Google Scholar] [CrossRef]
- Khojasteh, D.; Lewis, M.; Tavakoli, S.; Farzadkhoo, M.; Felder, S.; Iglesias, G.; Glamore, W. Sea level rise will change estuarine tidal energy: A review. Renew. Sustain. Energy Rev. 2022, 156, 111855. [Google Scholar] [CrossRef]
- Reguero, B.G.; Losada, I.J.; Méndez, F.J. A recent increase in global wave power as a consequence of oceanic warming. Nat. Commun. 2019, 10, 1–14. [Google Scholar] [CrossRef] [PubMed]
- Vu Dinh, Q.; Doan, Q.V.; Ngo-Duc, T.; Nguyen Dinh, V.; Dinh Duc, N. Offshore wind resource in the context of global climate change over a tropical area. Appl. Energy 2022, 308, 118369. [Google Scholar] [CrossRef]
- Neill, S.P.; Haas, K.A.; Thiébot, J.; Yang, Z. A review of tidal energy—Resource, feedbacks, and environmental interactions. J. Renew. Sustain. Energy 2021, 13, 062702. [Google Scholar] [CrossRef]
- de Andres, A.; MacGillivray, A.; Roberts, O.; Guanche, R.; Jeffrey, H. Beyond LCOE: A study of ocean energy technology development and deployment attractiveness. Sustain. Energy Technol. Assess. 2017, 19, 1–16. [Google Scholar] [CrossRef]
- Ramos, V.; Giannini, G.; Calheiros-Cabral, T.; Rosa-Santos, P.; Taveira-Pinto, F. Legal framework of marine renewable energy: A review for the Atlantic region of Europe. Renew. Sustain. Energy Rev. 2021, 137, 110608. [Google Scholar] [CrossRef]
- Ministerio de Transportes, M.y.A.U. Maritime Space Management Plans (POEM) Royal Decree 150/2023. 2023. Available online: https://www.boe.es/buscar/doc.php?id=BOE-A-2023-5704 (accessed on 23 March 2023).
- Greaves, D.; Conley, D.; Magagna, D.; Aires, E.; Chambel Leitão, J.; Witt, M.; Embling, C.B.; Godley, B.J.; Bicknell, A.W.; Saulnier, J.B.; et al. Environmental Impact Assessment: Gathering experiences from wave energy test centres in Europe. Int. J. Mar. Energy 2016, 14, 68–79. [Google Scholar] [CrossRef]
- Zangiabadi, E.; Masters, I.; Williams, A.J.; Croft, T.; Malki, R.; Edmunds, M.; Mason-Jones, A.; Horsfall, I. Computational prediction of pressure change in the vicinity of tidal stream turbines and the consequences for fish survival rate. Renew. Energy 2017, 101, 1141–1156. [Google Scholar] [CrossRef]
Figure 1.
Summary of the methodology used to obtain the global maximum energy potential, the EROI and the maximum energy surplus (net energy) for each MRE.
Figure 1.
Summary of the methodology used to obtain the global maximum energy potential, the EROI and the maximum energy surplus (net energy) for each MRE.

Figure 2.
Estimated average EROIs (left), and maximum (upper bounds) global energy potentials and net energy potentials (right) for each MRE (see Table 12 for the actual values). NOTE 1: the EROI of SGE is not represented in the figure, as it is below the threshold considered in this work (EROI<7). NOTE 2: although the values of the energy potentials (and net energy potentials) shown in this figure are indicative of the scale of the respective potentials, they are not comparable to one another, as different technical, economic and sustainability criteria were considered to obtain each of them. The values for offshore wind, waves and tidal stream may be assimilated to technical potentials, while those of OTEC, SGE and tidal range are closer to their sustainable potentials (see Section 2 for further details). NOTE 3: this figure does not include the values for ocean currents, as neither their energy potentials nor the EROI of the available technologies could be reliably estimated based on the available literature (see Section 3.3 and Section 4.3).
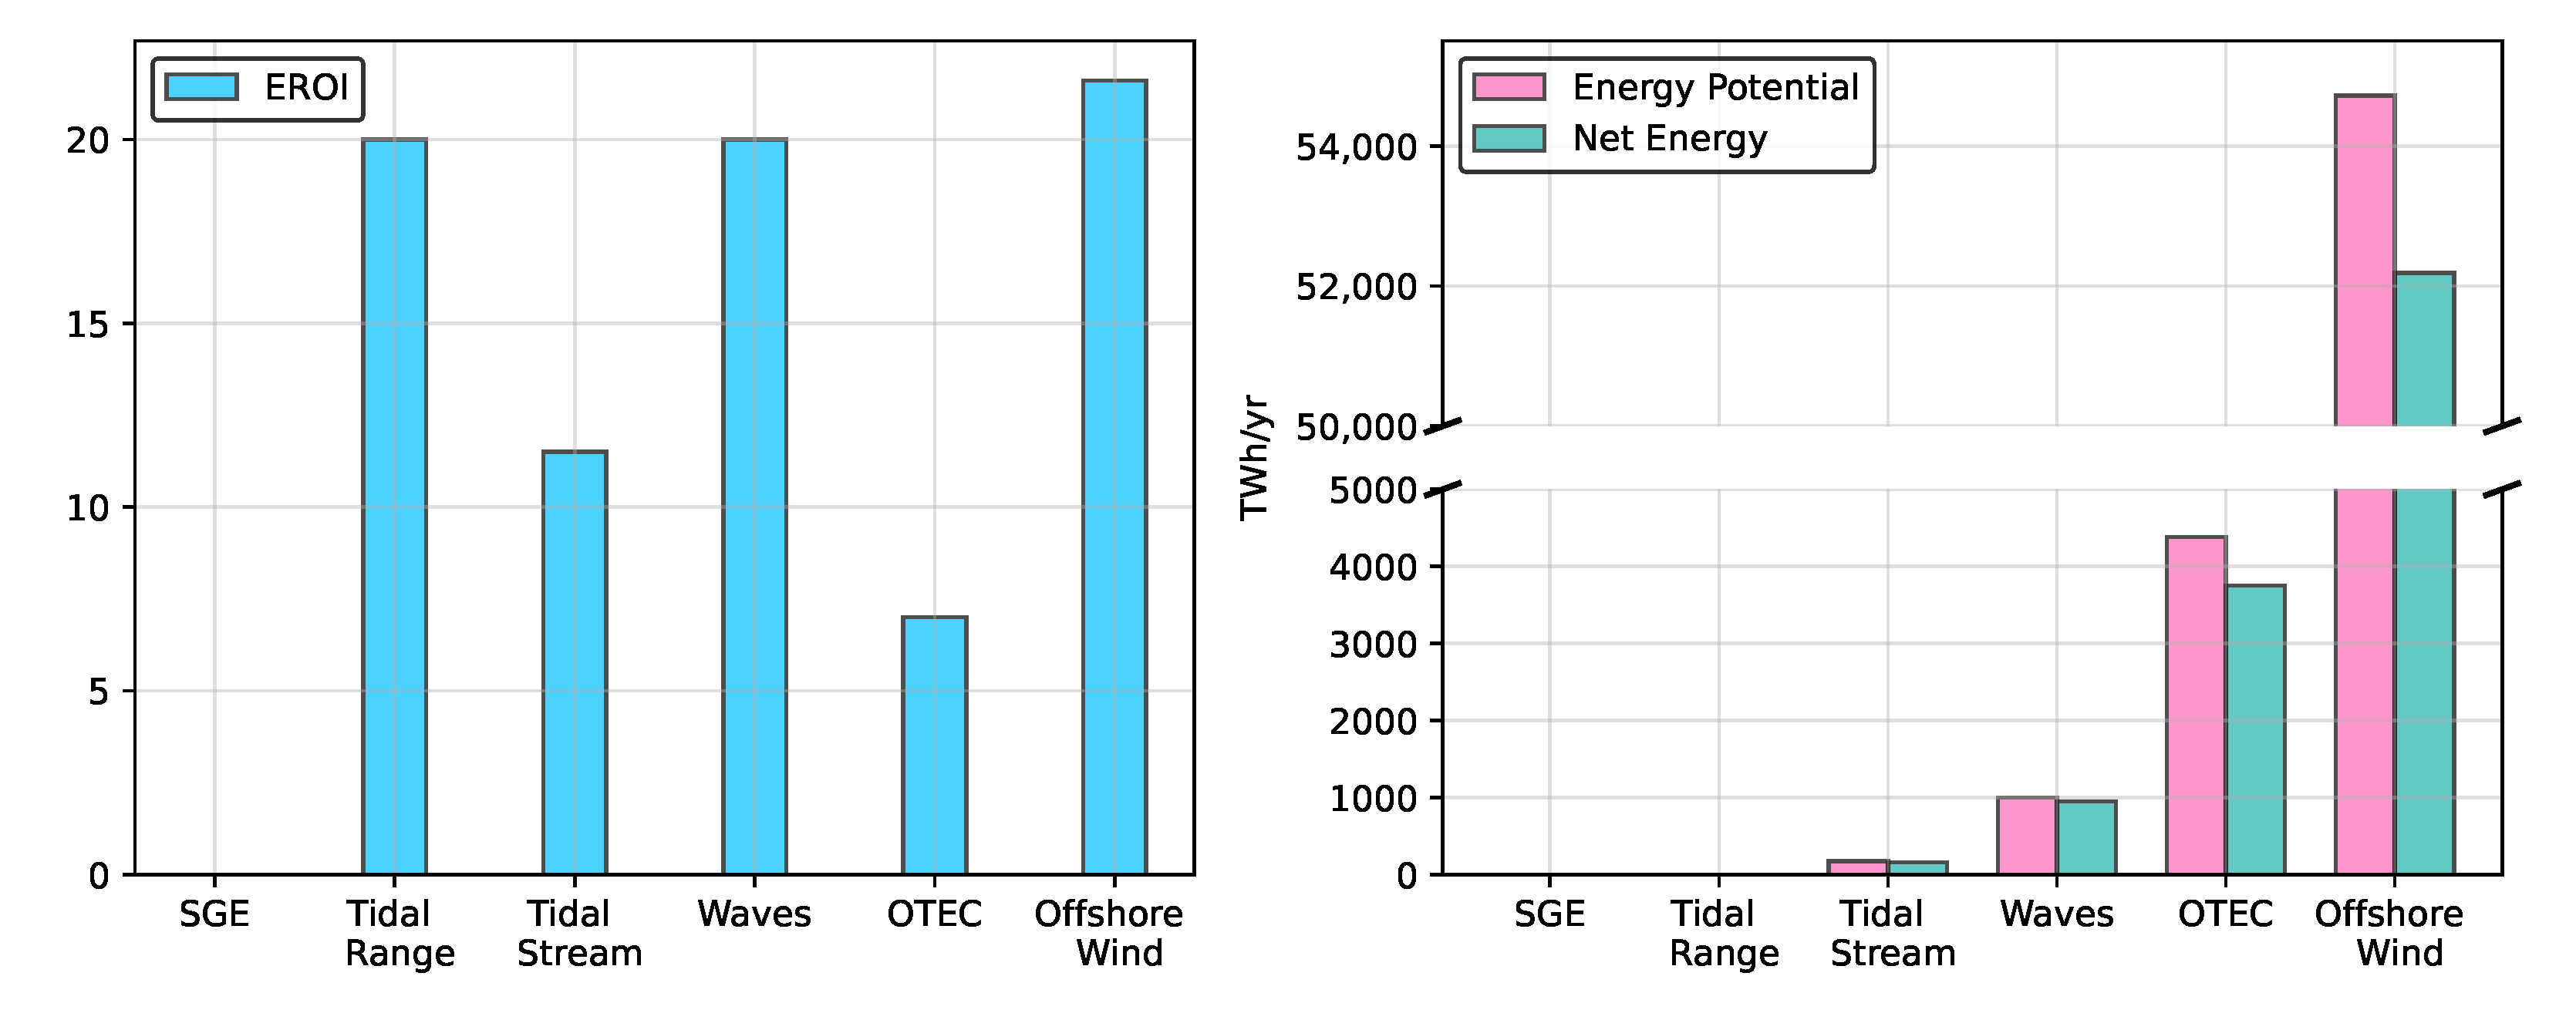

Table 1.
Global tidal energy potentials reported in literature.
| Potentials (in TWh/yr) | |||||
|---|---|---|---|---|---|
| Type | Theoretical | Technological | Economic | Sustainable | Source |
| Tidal (all forms) | 14,990 1 | [43,45] | |||
| 2365 3 | [46] | ||||
| 1200 | [47] | ||||
| 500–1000 | [48,49] | ||||
| 800 | [50] | ||||
| 200–400 4 | [57] | ||||
| Tidal stream | 4380 | [51] | |||
| 177.4 5 | [52] | ||||
| Tidal range | 5792 2 | [55] | |||
| 9115 2 | [56] | ||||
Table 2.
Global wave energy potentials reported in the literature.
| Potentials (in TWh/yr) | ||||
|---|---|---|---|---|
| Theoretical | Technological | Economic | Sustainable | Source |
| 8000–80,000 | [4,50,58] (from previous literature) | |||
| 32000 1 | [61] | |||
| 29500 | [47] | |||
| 18400 5 | [62] | |||
| 16000 2 | [59] | |||
| 11395.8 4 | 100–800 4 | [65] | ||
| 4380 8 | [66] | |||
| 100–500 and 200–1000 3 | [67] | |||
| 17000 6,7 | [63] | |||
1 Not taking into account the energy direction of the waves. 2 At continental level, neglecting the potential of inner seas. 3 For 20 /–30 / and 10 /–20 / wave front ranges, respectively. 4 Only nearshore (water depth = 10). 5 Total incident wave power along the ocean-facing global coastline, neglecting certain islands and poles. 6 Own estimation using data from Figure 8 in [63]. 7 Taking into consideration aspects such as resource availability, structural survivability, logistics activities, distance to consumer centers, and extractable power. 8 0.5 TW.
Table 3.
Global OTEC energy potentials reported in the literature.
| Potentials (in TWh/yr) | ||||
|---|---|---|---|---|
| Theoretical | Technological | Economic | Sustainable | Source |
| 876,000 | [45] | |||
| 37,000 | [96] | |||
| 23,652 to 43,800 | [93,94] 1,2 | |||
| 10,000 | [58] | |||
| 122,640 to 262,800 | [97,99] 1,2 | |||
| 63,072 to 81,468 2 | < 17,520 | [98] 1,3 | ||
| 74,898 (81,994) | 41,084 (42,661) 5 | [100] 1,4 | ||
1 Subtracting the energy consumed by pumps. 2 Assuming non-negligible effects on the oceanic temperature field. 3 Considering a maximum distance of 100 of coastlines for OTEC implementation. 4 Simulated and measured (within parenthesis) potentials. 5 Within the EEZ only.
Table 4.
Global Salinity Gradient energy potentials reported in the literature.
| Potentials (in TWh/yr) | ||||
|---|---|---|---|---|
| Theoretical | Technological | Economic | Sustainable | Source |
| 12,305 to 22,776 | [103,104] | |||
| 2000 1 | [110,111] | |||
| 1650 | [113] | |||
| 15,102 | 8617 | [106,107] | ||
| 27,667 | 5200 | 520 | [108,109] | |
| 1370 2 | [112,116] | |||
| 625 | [115] | |||
| 16,200 to 35,000 | [105] | |||
1 Assuming that only 20% of the global river discharge can be used for salinity gradient energy generation. 2 Assuming that one tenth of the global river discharge could be used for power production (with PRO).
Table 5.
Global offshore wind energy potentials reported in the literature.
| Potentials (in TWh/yr) | ||||
|---|---|---|---|---|
| Theoretical | Technological | Economic | Sustainable | Source |
| 731,46 1 | [40] | |||
| 157,000 2 | [122] | |||
| 192,800 3 | [123] | |||
| 15,768, 39,420 and 77,964 4 | [95] | |||
| 52,500 and 173,000 5 | [125] | |||
| 54,722 and 181,111 6 | [125] | |||
| 329,600 7 | [121] | |||
| 420,878 8 | [15] | |||
1 Exclusive economic zones up to 50 deep. 2 Up to 200 m, assumes loss of 10% of potential power caused by interturbine interference. 3 Up to 200 m, 10% array losses and 20% averaged CF. 4 Turbines occupying 10%, 25% and 50% of continental shelves surface up to 225 m deep. 5 For low- and high-use scenarios using the current technology (up to 50 deep). 6 For low- and high-use scenarios using floating turbine technology (up to 1000 deep). 7 Up to 1000 deep, 12.5% array losses and 20% averaged CF. 8 Turbines founded up to 2000 deep on the continental shelves.
Table 6.
Summary of literature values of EROIs for tidal range technologies.
| Device, Technology (Manufacturer) or Case Study | LCA Boundaries | EROI Value (Energy Payback Time) | Reference |
|---|---|---|---|
| Cardiff–Weston tidal barrage proposal, UK | construction and O&M | 3.7 (33 years) 1 and 24.2 (5 years) 2 | [132] |
| Cardiff–Weston tidal barrage proposal, UK | energy accounting for construction and O&M | 14.2 (8.3 years) 1 | [131] |
| Swansea Bay Tidal Lagoon project | cradle to gate and O&M | 22 (5.5 years) 2 | EROI was estimated using energy intensity and energy output estimations made in [134] 3 |
| Shoots barrage proposal, UK | cradle to site and O&M | 22.31 (9.16 years 4) 1 | [133] |
| Cardiff–Weston tidal barrage proposal, UK | cradle to site and O&M | 22.2 (8.6 years 4) 1 | [36] |
1 Ebb generation and flood pumping. 2 Ebb generation only. 3 Non-peer reviewed. 4 See assumptions made for the calculation of the EPBT in the text.
Table 7.
Summary of the literature values of EROIs for tidal stream technologies.
| Device, Technology (Manufacturer) or Case Study | LCA Boundaries | EROI Value (Energy Payback Time) | Reference |
|---|---|---|---|
| 200 marine turbines sited in the Kaipara Harbor, New Zealand | cradle to gate | 85.26 (1.18 years) 1 | Both EROI and EPBT are estimated using energy intensity and energy output over lifespan [126] |
| Seagen (Marine Current Turbines Ltd.) | cradle to grave | 16.8 (1.2 years) 2 | Estimated using data from [127] |
| Open Centre Turbine (OpenHydro) | cradle to grave | 14 (7.3 years) | EROI estimated using energy intensity and energy output over lifespan from [128] |
| Deepgen (Tidal Generation Ltd.) | cradle to grave | 9 (11.2 years) | EROI estimated using energy intensity and energy output over lifespan from [128] |
| SR2000 (ScotRenewables) | cradle to grave | 11.8 (8.7 years) | EROI estimated using energy intensity and energy output over lifespan from [128] |
| Flumill (Flumill) | cradle to grave | 14.31 (7.2 years) | EROI estimated using energy intensity and energy output over lifespan from [128] |
| Deep Green utility in Holyhead, Wales (Minesto) | cradle to grave | 4.6 (6 years) to 8.7 (3 years) | [129] |
1 Lifespan of 100 years, as opposed to the 20–25 years considered in the other studies. 2 The EPBT reported by the authors was estimated using the lifetime energy input.
Table 8.
Summary of literature values for EROIs by device/technology for WEC.
| Device, Technology (Manufacturer) or Case Study | LCA Boundaries | EROI Value (Energy Payback Time) | Reference |
|---|---|---|---|
| P-750 Pelamis (Ocean Power Delivery Ltd., now Pelamis Wave Power) | cradle to grave | 12.3 (1.6 years) | EROI estimated using energy intensity and energy output over lifespan from [38] |
| WEC concept project from Uppsala University | cradle to grave | 6.3 (3.2 years) for case NO; 2.0 (9.8 years) for case SE | [135] (non peer-reviewed) |
| Oyster 1 (Aquamarine Power) | cradle to grave | 15.3 (1 year) | Estimated using data from [136] |
| Oyster 1 and Oyster 800 (Aquamarine Power) | cradle to grave | 4.0 (3.7 years) for Oyster 1; 5.7 (3.5 years) for Oyster 800 | Estimated using data from [137] |
| Buoy-Rope-Drum (BRD) Wave Energy Converter (Shandong University) | cradle to grave | 9.1 (2.2 years) with CF = 50%; 3.7 (5.4 years) with CF = 20% | EROI estimated using data from [138] |
| Wave Dragon WEC (Wave Dragon Aps) | cradle to grave | 20 (2.42 years) | [139] |
| Wave Dragon WEC (Wave Dragon Aps) placed in Wales Coast | energy embedded in the construction materials | 25.6 (2 years) with energy intensities from [142]; 30.6 (1.6 years) with energy intensities from [143] | EROI and EPBT estimated using data from [141] |
| P-750 Pelamis WEC (Pelamis Wave Power) placed in the Irish coast | energy embedded in the construction materials | 16.5 (1.2 years) with energy intensities from [142]; 16.8 (1.2 years) with energy intensities from [143] | Estimated using data from [141] |
| Pelamis P1 WEC (Pelamis Wave Power) wave farm located off the north-west coast of Scotland | cradle to grave | 7.3 (2.8 years) | [144] |
| MegaRoller OWSC | cradle to grave | 8.3 (2.4 years) | EROI estimated using data from [145] |
| 10 array of 28 350 CorPower Ocean AB point absorber WEC | cradle to grave | 5.3 (3.6 years) to 9.5 (2.1 years) | EROI and EPBT estimated using mean CED range given in [146] |
Table 9.
Summary of literature values for EROIs by device/technology for OTEC.
| Device, Technology (Manufacturer) or Case Study | LCA Boundaries | EROI Value (Energy Payback Time) | Reference |
|---|---|---|---|
| 10 OTEC system at Curaçao, in the Caribbean Sea (Bluerise) | based on information of the feasibility report of ocean thermal energy conversion by Bluerise | 8 (3.8 years) | Estimated using data from [151] |
| 10 OTEC pilot plant offshore Oahu, Hawaii | cradle-to-grave | 4.5 to 5.3 (3.8 to 4.4 years) for 20 years of operation with CF of 85% and 100%, respectively; 5.9 to 6.8 (5.9 to 6.9 years) for 40 years of operation with CF 85% and 100%, respectively. | [152] |
| Closed cycle 100 OTEC system | energy embedded in the construction materials plus 25% of self-consumption during operation | 12.6 (3.1 years) with energy intensities from [142]; 14.7 (2.4 years) with energy intensities from [143] | Estimated using data from [141] |
Table 10.
Summary of literature values for EROIs by device/technology for Salinity gradient.
| Device, Technology (Manufacturer) or Case Study | LCA Boundaries | EROI Value (Energy Payback Time) | Reference |
|---|---|---|---|
| Reverse Electrodialysis (RED) | – | 7 | [160] based on previous studies. |
| Pressure Retarded Osmosis (PRO) | – | 6-7 | [160] based on previous studies. |
| Feasibility study of a 10 PRO system in a lagoon located at the mouth of the River Avon in the Severn Estuary, in the UK | cradle to grave | 0.6 | [159] 1 |
1 Non-peer reviewed.
Table 11.
Summary of literature values for EROIs for offshore wind technologies.
| Device, Technology (Manufacturer) or Case Study | LCA Boundaries | EROI Value (Energy Payback Time) | Reference |
|---|---|---|---|
| Review of 119 wind turbines (onshore and offshore) 1 | Input-Output and Process Analysis | 33.3 (7.2 months), 51.3 (5 months) and 14.3 (4 months) | [162] |
| Floating offshore wind farm 50 away from the shore based on the Sway Company project | production and end-of-life | 18.45 (13 months) | Estimated using data from [163] |
| 6 conceptual offshore farms 200 off the British Coast, at Doggerbank | cradle to grave | 12.4 (19.2 months) for the bottom-fixed concept; 7.5–12.9 (19.2–32.4 months) for the floating systems | [164] |
| Two floating offshore wind farms case studies | cradle to grave | 5.81–7.57 for the Hywind Scotland (39.6 to 51.6 months) and 6.5–8.92 for the Kincardine Aberdeen (33.6 to 44.4 months) | Estimated using data from [165] |
| Two conceptual offshore farms, with 4 and 6 MW turbines | cradle to grave | 30 (10 months) and 21.6 (11.1 months) | Estimated using data from [166] |
| Theoretical LCA of different electricity generation technologies (undisclosed offshore wind farm) | cradle to grave | 13.5 (22.2 months) | [167] |
| Bottom-fixed and floating offshore wind farms with 39% CF | cradle to grave | 12 (25 months) for the turbines founded at 15 depth; 10.4 (28.8 months) for the floating system | [40] |
| Siemens-Gamesa LCA of 80 turbines SG 8.0-167 DD of 8 | cradle to grave | 40.5 (7.4 months) | Estimated using data from [168] |
| 6 scenarios for the Alpha Ventus farm in the North Sea | cradle to grave | 27.3 (8.8 months), 39.3 (6.1 months), 25.3 (9.5 months), 29.6 (8.1 months), 27.6 (8.7 months), and 32.4 (7.4 months) | Estimated using data from [170] |
| Different power stations deployed in the United Kingdom | cradle to grave | 18 (13.3 months) | [171] |
| Wind farms installed in New Zealand | cradle to grave | 34.3 (7 months) | [172] |
| Offshore farm simulation in the Taiwan Strait, near the coast of Fangyuan Township | hybrid analysis (input-output and process analysis) | 16.7 (14.4 months) with an offshore substation (26.7 if recycling waste materials) and 18.7 (12.8 months) without it (23.2 recycling waste materials) | [173] |
| Global assessment | cradle to gate and O&M | 8.7 (34.5 months) | [174] |
1 Only values for offshore wind are reported here.
Table 12.
Average energy potentials and EROIs used in this work for the estimation of the annual net energy production.
Table 12.
Average energy potentials and EROIs used in this work for the estimation of the annual net energy production.
| Energy Form | Technical Potential (in TWh/yr) | Economic Potential (in TWh/yr) | Sustainable Potential (in TWh/yr) | Average EROI | Net Energy (in TWh/yr) |
|---|---|---|---|---|---|
| Tidal range | 0 | 20 | 1.1 1 | ||
| Tidal stream | 177.4 | 11.5 | 162 | ||
| Waves | 1000 | 20 2 | 950 | ||
| OTEC | 4380 3 | 7 | 3750 | ||
| SGE | 0 4 | <7 | 0 | ||
| Offshore wind | 54,722 | 21.6 | 52,188 | ||
| TOTAL | 57,051 |
1 Current energy generation of La Rance ( 600/) and Sihwa ( 550 /) tidal barrage systems, applying an EROI of 20. 2 Average value for the Wave Dragon WEC. 3 We assume that only half of the current techno-sustainable potential for OTEC will be exploitable with an EROI of ∼7. 4 Assumed to be unexploitable due to low EROI.
Disclaimer/Publisher’s Note: The statements, opinions and data contained in all publications are solely those of the individual author(s) and contributor(s) and not of MDPI and/or the editor(s). MDPI and/or the editor(s) disclaim responsibility for any injury to people or property resulting from any ideas, methods, instructions or products referred to in the content. |
© 2023 by the authors. Licensee MDPI, Basel, Switzerland. This article is an open access article distributed under the terms and conditions of the Creative Commons Attribution (CC BY) license (https://creativecommons.org/licenses/by/4.0/).
Share and Cite
MDPI and ACS Style
Samsó, R.; Crespin, J.; García-Olivares, A.; Solé, J. Examining the Potential of Marine Renewable Energy: A Net Energy Perspective. Sustainability 2023, 15, 8050. https://doi.org/10.3390/su15108050
AMA Style
Samsó R, Crespin J, García-Olivares A, Solé J. Examining the Potential of Marine Renewable Energy: A Net Energy Perspective. Sustainability. 2023; 15(10):8050. https://doi.org/10.3390/su15108050
Chicago/Turabian StyleSamsó, Roger, Júlia Crespin, Antonio García-Olivares, and Jordi Solé. 2023. "Examining the Potential of Marine Renewable Energy: A Net Energy Perspective" Sustainability 15, no. 10: 8050. https://doi.org/10.3390/su15108050
Note that from the first issue of 2016, this journal uses article numbers instead of page numbers. See further details here.