
Joint Flood Risks in the Grand River Watershed

1
Department of Systems Design Engineering, University of Waterloo, Waterloo, ON N2L 3G1, Canada
2
School of Administrative Studies, York University, Toronto, ON M3J 1P3, Canada
3
Adjunct Faculty, UN University Institute for Water, Environment and Health, Hamilton, ON L8P 0A1, Canada
4
Department of Electrical & Computer Engineering, University of Waterloo, Waterloo, ON N2L 3G1, Canada
5
Department of Machine Learning, Mohamed bin Zayed University of Artificial Intelligence, Masdar City, Abu Dhabi Pin Code 50819, United Arab Emirates
*
Author to whom correspondence should be addressed.
Sustainability 2023, 15(12), 9203; https://doi.org/10.3390/su15129203
Submission received: 3 April 2023
/
Revised: 25 May 2023
/
Accepted: 1 June 2023
/
Published: 7 June 2023
(This article belongs to the Special Issue Water-Related Disasters and Risks)
Abstract
:According to the World Meteorological Organization, since 2000, there has been an increase in global flood-related disasters by 134 percent compared to the previous decades. Efficient flood risk management strategies necessitate a holistic approach to evaluating flood vulnerabilities and risks. Catastrophic losses can occur when the peak flow values in the rivers in a basin coincide. Therefore, estimating the joint flood risks in a region is vital, especially when frequent occurrences of extreme events are experienced. This study focuses on estimating the joint flood risks due to river flow extremes in the Grand River watershed in Canada. For this purpose, the study uses copula analysis to investigate the joint occurrence of extreme river flow events in the Speed and Grand Rivers in the Grand River Watershed in Ontario, Canada. By estimating the joint return period for extreme flows in both rivers, we demonstrate the interdependence of the two river flows and how this interdependence influences the behavior of river flow extreme patterns. Our findings suggest that the interdependence between the two river flows leads to changes in the river flow extreme pattern. Determining the interdependence of floods at multiple locations using state-of-the-art tools will benefit various stakeholders, such as the insurance industry, the disaster management sector, and most importantly, the public.
1. Introduction
Extreme weather events such as floods, landslides, heat waves, wildfires, storms, and droughts are becoming more frequent and severe [1,2]. Compound extreme events refer to the interdependence of simultaneous or successive occurrences of two or more extreme events or hazard drivers that can cause severe impacts on the ecosystem [3]. Cascading events are a type of compound event where the consecutive occurrence of events lead to significant effects [4]. Cascading events can considerably impact the environment, the economy, and human health and safety [5]. To effectively manage the risks associated with compound extreme events, it is crucial to understand their interdependence and the cascading effects that can occur. By taking a holistic approach to risk assessment and management, stakeholders can develop effective strategies to mitigate the impacts of these events and protect vulnerable populations.
According to the World Health Organization, floods affected more than two billion people worldwide in the last two decades, and 80–90% of natural disasters in the last decade are from floods, droughts, and severe storms [6]. Floods cause disastrous impacts on humans as well as animal and aquatic life. Joint risk estimation of cascading flood events is critical these days as more frequent and severe events are projected in the near future.
Different rivers can have varying effects on flood generation in the mainstream. When floods co-occur in various rivers, they can lead to peak flow and increase the risk of flooding. To accurately assess the combination risk for hydraulic design, it is essential to consider the impact of simultaneous occurrences of extreme flows in different rivers in the region. The traditional univariate frequency analysis that estimates the probability that a value of the flood characteristic will be exceeded, cannot encompass the risk of coincidence of flood risks at multiple rivers in the region. Furthermore, when the river receives significant flow from a tributary, the univariate approach does not yield reliable estimates of flood properties. In such cases, multivariate analysis incorporating the dependence between flood variables of different rivers/tributaries is needed [7].
A bivariate model using the copula function was applied in this study to estimate the joint flood risks of two rivers in the Grand River watershed. Because of its applicability in multivariate analysis, the copula is widely used in the financial sector and business decisions [8,9,10]. In the past few decades, its applicability in hydrological and meteorological studies is becoming increasingly widespread [11,12,13]. Copula has now been widely used in varied fields where interdependence between variables plays a crucial role. For instance, copula has been successfully implemented in the analysis of extreme events such as flood and drought [14,15,16], rainfall frequency analysis [15] and other multivariate problems [17,18,19,20,21,22].
One of the key advantages of using copula functions in flood studies is their ability to model the tail dependence of variables [13,23]. The tail dependence of variables refers to the degree to which extreme values of one variable are associated with extreme values of another variable. In the context of flood studies, this means that copula functions are particularly useful for analyzing extreme flood events that have the potential to cause significant damage to communities and infrastructure [13,24]. By modeling tail dependence, copula functions can provide valuable insights into extreme flood events’ likelihood and potential impact. This information can inform flood risk management strategies, such as the development of flood warning systems, the construction of flood protection infrastructure, and the implementing land-use planning and zoning policies that consider the potential impact of floods.
Copula functions are often used to combine interrelated variables such as peak flow and flood volume and conduct analysis in a probabilistic approach. They allow assessing compound flood hazards from riverine and coastal interactions [25]. Copula-based flood frequency analysis can model the dependence structure among peak flow, volume, and duration [26]. This method could relax the limitation of traditional flood frequency analysis by selecting marginal from different families of probability distribution functions for flood characteristics [26]. Copula-based flood frequency analysis is found to perform better than conventional flood frequency analysis [26]. Xie et al. [27] assessed the joint impact of rainfall characteristics on urban floods using a coupled hydrological model based on copula.
Several studies have demonstrated the effectiveness of copula functions in flood studies [28,29,30] and found that copula-based models provided a more accurate representation of the dependence structure between the variables, which was important in accurately assessing flood risk and designing appropriate management strategies. For example, Wang et al. [31] proposed a copula simulation approach to developing a joint flood risk distribution of multi-reservoirs. They found that the copula-based approach provides valuable insights into reservoir joint risk control. Zhong et al. [32] conducted a copula-based multivariate probability analysis for flash flood risk assessment by considering the compounding effect of soil moisture and rainfall. Bačová Mitková et al. [33] focused on comparing different methods for performing frequency analysis of floods and suggested that the copula method is useful for this purpose.
Most copula-based flood studies typically focus on the relationship between two or more flood variables, such as peak flow and flow volume. By understanding the interdependence of these variables, researchers can gain a more accurate picture of flood risk and make better-informed decisions regarding flood management and mitigation.
The current study uses a copula to estimate the bivariate return period of peak flow events in two rivers in a river catchment. This involves examining the correlation between peak river flows in a catchment and using copula analysis to identify interdependence between these flows and estimate joint return periods.
The study addresses several important research questions about peak river flows in a catchment. For example, it seeks to understand how the peak flow in multiple rivers in a catchment correlate and how copula analysis identifies interdependence between these variables. The study also aims to estimate joint return periods for peak river flows and explore how this information can inform flood risk management and mitigation strategies.
By answering these research questions, the study contributes to the broader field of flood risk management and provides valuable insights for policymakers, researchers, and other stakeholders. By understanding the interdependence between peak river flows and other flood variables, stakeholders can develop more effective strategies for managing flood risk, protecting communities and infrastructure, and minimizing the damage caused by floods. Ultimately, the study highlights the importance of copula analysis in flood frequency studies and underscores the need for ongoing research to refine our understanding of flood risk further and develop more effective strategies for managing this critical natural hazard.
2. Materials and Methods
2.1. Grand River Watershed
The Grand River watershed is the largest watershed in southern Ontario [34], with an area of 6800 km2. The area has five major urban settlements: Guelph, Kitchener, Waterloo, Cambridge, and Brantford. Agricultural land makes up 70% of the watershed. This study selects the Speed River and Grand River as case studies. These rivers meet in the City of Cambridge, and simultaneous flooding of these rivers can cause disastrous impacts in the highly populated urban settlements (Figure 1). The annual peak flows of the rivers at the meeting station (Galt) are analyzed for their interdependence structure and to estimate the bivariate return period. The annual extreme flow data has been obtained from the website of the water survey of Canada [35]. Additionally, the annual extreme flows at the two rivers, Speed and Grand at Galt, Cambridge, are analyzed to explore the probability of joint occurrence of extreme events at the two rivers.
The selected case study of the joint occurrence of flood in Two Rivers (Grand River and Speed River) is essential for several reasons. Firstly, these two rivers meet at a high settlement urban area, which makes it crucial to study their joint occurrence of flood. Urbanization significantly increases the risk of flooding in urban settings [36], as in the watershed selected in this study, which may lead to severe consequences, including loss of life, property damage, and environmental degradation. Therefore, studying the flood dynamics in these rivers is essential to mitigate the risk of flooding and ensure sustainable development in the region. Secondly, the frequent occurrence of floods in the area and the long history of flooding in the Grand River system highlight the urgency of the study. Floods in the region can occur in all seasons, and they have caused significant damage in the past, such as the major flood events of 1912, 1948, 1974, and 2017 [37]. Therefore, understanding the flood dynamics and predicting the flood risk accurately can help the local authorities in taking effective measures to reduce flood damage and ensure public safety. Lastly, the Grand River is the largest river in southern Ontario, which makes it a crucial water resource for the region. The river provides water for various purposes, including drinking water, irrigation, and industrial use [37]. Therefore, it is essential to study the flood dynamics in this river to ensure the sustainability of water resources in the region.
2.2. Copula in Bivariate Frequency Analysis
To estimate a multivariate return period, joint probability analysis of the variables needs to be conducted, which would become complicated if traditional methods are employed as the marginal distributions of the variables can differ. Copulas can be efficiently used in this scenario as copulas are functions that describe the correlation structure between random variables, irrespective of their marginal distributions [38]. As per Sklar’s theorem, any multivariate joint distribution can be described in terms of univariate marginal distribution functions and a copula defining the dependence structure between the variables.
Consider two random variables, Y1 and Y2, with distribution functions F1(Y1) and F2(Y2), respectively. As per Sklar’s theorem, there always exists a copula function (C) such that,
where C(ul,u2) is itself a distribution function, where u1 and u2 are F1(y1) and F2(y2) respectively.
F(Y1 = y1, Y2 = y2) = C(F1(y1), F2(y2))
2.3. Joint and Conditional Return Period Using Copula
The return period is an estimate (statistical measurement) of the interarrival time between events, such as floods or earthquakes of a certain intensity. It is often used for risk analysis and infrastructure design [13].
For univariate studies, the return period (T) is the average time interval between occurrences of the event Y > y and can be described as below [12,40,41]:
where ) is the probability of exceedance, is the non-exceedance probability and μ denotes the average interarrival time between two events (or realizations of the process).
2.3.1. Joint Return Period Using Copula
In a bivariate analysis using copula, the joint/conditional probabilities and corresponding return period can be calculated using the copula distribution function. Some of such relations are given in Equations (3)–(8) below [13]:
Consider two random variables (Y1 and Y2). The copula describing the interdependence of the variables is given as C12. The joint return period for “AND” and “OR” cases and the conditional return period for different conditions can be calculated using the relations given below:
The joint return period of the “AND” (where both Y1 and Y2 are exceeded) case can be expressed as follows:
The joint return period of the “OR” case is simply expressed as follows:
2.3.2. Conditional Return Period Using Copula
The copula can be used to determine the conditional return periods under different conditions.
The corresponding conditional return period is as follows:
Similarly, the conditional return period of is as follows:
3. Results and Discussion
A bivariate analysis of peak river flow events in two rivers in the Grand River watershed is carried out in the study. In the bivariate analysis, the annual peak river flows at Grand River and Speed River have been analyzed and joint return periods have been estimated.
Bivariate Copula in Estimating Joint Flood Risks
The annual peak river flows from 1951 to 2021 at the Grand and Speed Rivers were analyzed. The yearly peak flow events at the rivers are shown in Figure 2.
The marginal probability distributions that fit each of the rivers’ peak flow data were estimated. The probability distributions such as Gumbel, Normal, Gamma, and exponential distributions were selected as possible marginal distributions for the peak flow of Speed and Grand Rivers. The parameters for the distributions were estimated using the Maximum Likelihood method and the best fit marginal distribution is selected by the Akaike information criterion [42] (with the lowest AIC value). The Speed River and Grand River data are observed to be following normal and gamma distribution, respectively.
The Speed River and Grand River flow data behaved differently regarding probability distributions, making it difficult to calculate joint probability distributions of the events. Copulas are hence used here, as they can be easily applied in such scenarios irrespective of the marginal distributions of individual variables. It is worth mentioning that the observed river flow data of the Speed and Grand Rivers have a Kendall correlation coefficient of 0.6, exhibiting a medium correlation between their occurrences.
The bivariate copula that fits the random variables is estimated by using the function “bicopselect” in “VineCopula” R package [43]. Before using the function, the data are preconditioned as data vectors within the range of [0, 1]. The bivariate copula is selected so that it fits the two variables (Speed and Grand Rivers data) perfectly and the selected copula is BB7 copula [44]. The observed river flow data and the simulated data by copula are given in Figure 3, showing the fitted copula can simulate the data with great accuracy. In addition, goodness of fit tests such as Cramer–von Mises (CvM) and Kolmogorov–Smirnov (KS) tests at a 5% critical level are used here to evaluate the fit of the selected copula to data. The CvM test compares the cumulative distribution function (CDF) of the fitted copula to the CDF of the observed data, while the KS test compares the empirical distribution function (EDF) of the fitted copula to the EDF of the observed data [45]. A smaller test statistic indicates a better fit, and the bootstrapped p-value estimates the probability of observing such a statistic under the null hypothesis of no difference between the fitted copula and the observed data [45].
The results of the tests are given in Table 1 and they indicate that the BB7 copula provides a good fit to the extreme river flow data, as indicated by the high bootstrapped p-values for both the CvM and KS tests. The observed test statistics were small, suggesting a good fit between the fitted copula and the observed data. Hence, these findings show that the selected BB7 copula is a suitable model for the extreme river flow data. The probability distribution function (pdf) and cumulative distribution function (cdf) of the developed bivariate distribution are shown in Figure 4 and Figure 5, respectively.
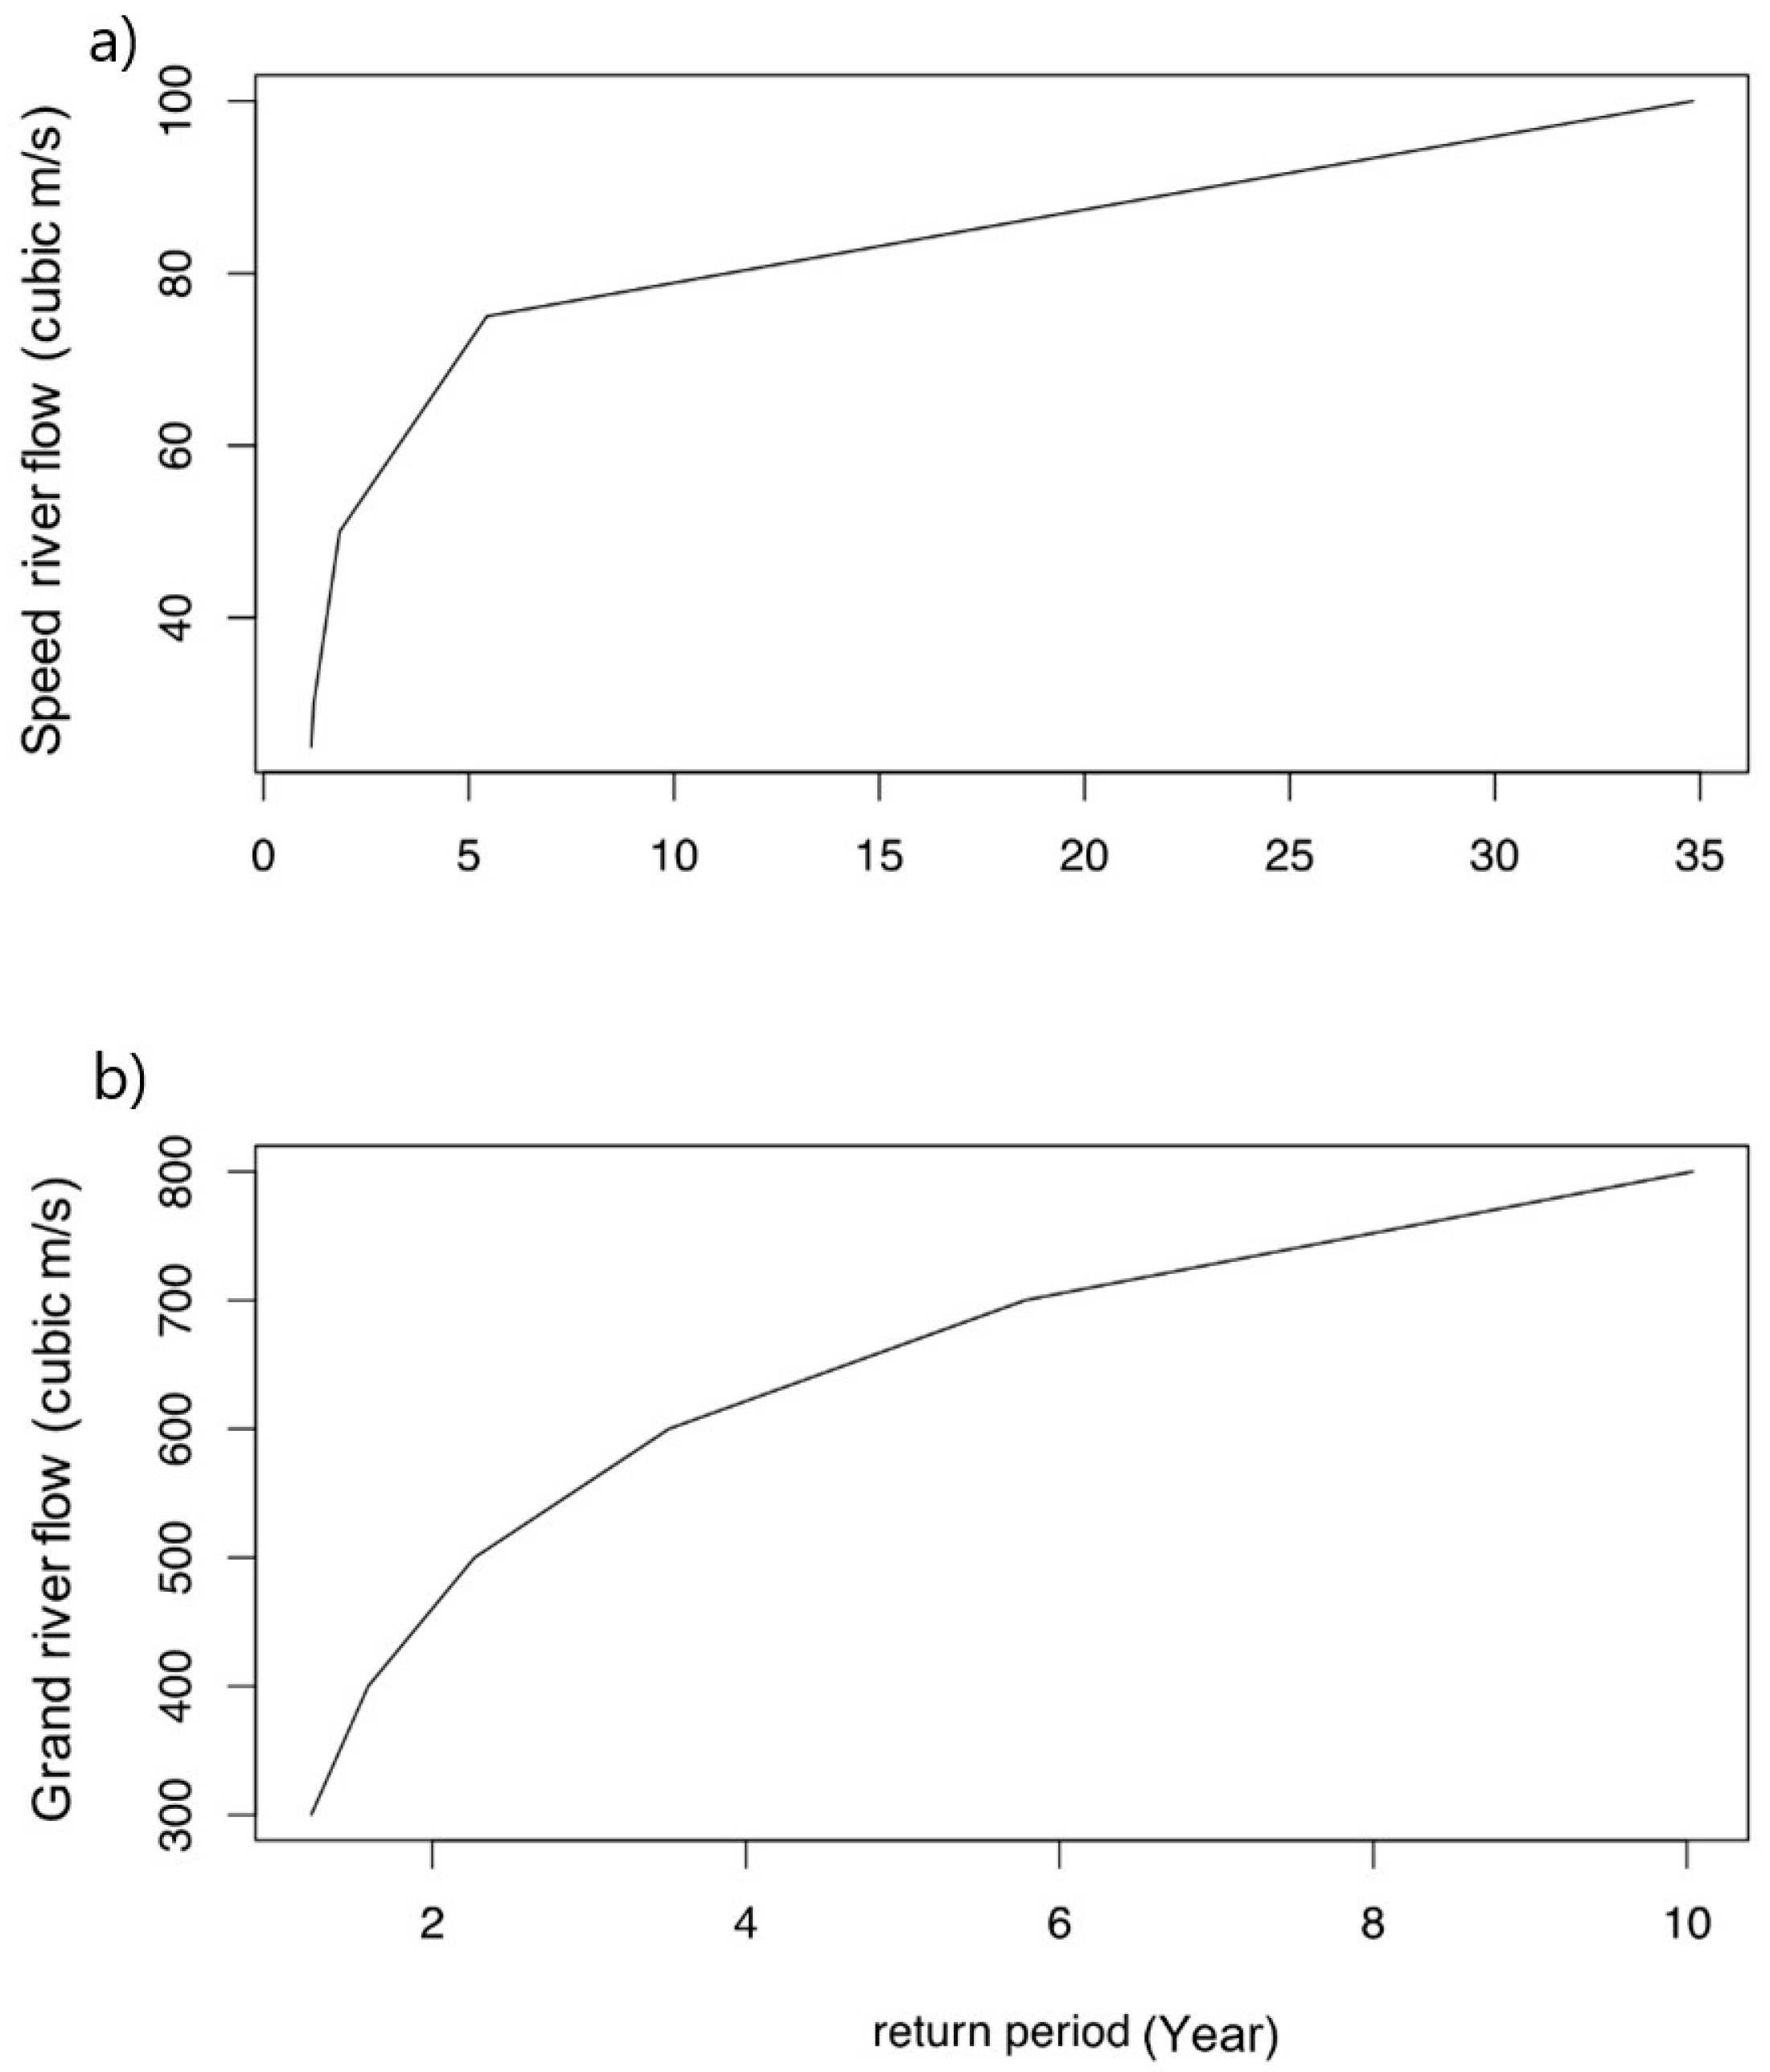
The bivariate return periods of the two river flow events were also estimated using the fitted copula by applying Equations (3)–(8). The AND return period of the events, where the probability of both the rivers’ flow exceeding the given values, were estimated using Equation (5). The OR return period where the probability of either of the rivers’ flow conditions exceeds the given condition was estimated using Equation (6). The conditional return periods were also estimated using Equations (7) and (8). The joint return periods of Speed and Grand Rivers flow extremes are shown in Figure 6 and Figure 7. The conditional return periods of Speed and Grand Rivers flow extremes are given Figure 8 and Figure 9. Comparing the joint return periods with the traditional univariate return periods of flow data gives a comprehensive system outlook. The univariate return periods have been estimated by traditional extreme value analysis using the marginal probability distributions (Equation (2)) and are given in Figure 10.
By incorporating the mutual dependence of the Speed and Grand Rivers flow extremes by means of the copula, detailed information regarding the joint probability of flood risks can be obtained. The joint return period (AND) of the Speed and Grand Rivers flow extremes (Figure 6) shows the return period for the joint occurrence of both the Speed and Grand Rivers extremes. Our analysis of the copula-based approach revealed important findings regarding the dependence between the Speed and Grand Rivers flow extremes. Specifically, the conditional return period analysis of Speed River extremes given the Grand River flow (Figure 8) showed that as the Grand River flow extremes increase, the magnitude of a t-year return period event for the Speed River flow decreases until the Grand River flow was approximately near 600 m3/s. Beyond this point, the magnitude of the Speed River flow events remained constant for all return periods. This implies that the Grand River flow has a limiting effect on the magnitude of extreme events in the Speed River flow. The inference may suggest that the interdependence and interaction between the two rivers are complex and depend on various factors, such as the magnitude of extreme flow events and the temporal and spatial scales of the analysis. Further research may be required to understand these relationships in more detail. Similarly, the conditional return period analysis of Grand River extremes given the Speed River flow (Figure 9) showed that as the Speed River flow extremes increase, the magnitude of a t-year return period event for the Grand River flow increases. This indicates that the flows of the Speed River can influence the flood outcome of the Grand River, similar to the effect of tributary flows on the main river channel.
These interdependencies and interactions between the two rivers can have a significant impact on the flood outcome in the region. Hence, there is an imminent future scope to study more about the interactions by incorporating detailed modeling approaches such as coupled hydrological and hydraulic models, or dynamic flood inundation models. These types of models can provide more insight into the spatial and temporal dynamics of flood events and can help to identify the most effective flood management strategies.
These results have important implications for flood risk management and planning. By incorporating the dependence structure between the two rivers using a copula-based approach, we can obtain more accurate estimates of the joint probability of flood risks. Moreover, the conditional return period analysis provides insights into how the risk of floods in one river may be affected by changes in the flow of the other river. These insights can help inform flood risk management strategies and improve our ability to plan for extreme weather events.
For a more detailed understanding, the return period for some combinations/cases of Grand and Speed River flow extremes is given in Table 2. The combinations of Grand and Speed Rivers are selected based on the basic statistics of the flow data. The mean, the 3rd Quartile, and the upper control limits (mean + 1 standard deviation and mean + 1.5 Standard deviation) of Speed and Grand Rivers peak flow data are used to find out the respective bivariate and univariate return periods.
Based on the observations from Table 2, it is apparent that when dealing with higher flow conditions, joint return periods should be taken into account when planning flood risk management strategies. For instance, while considering the joint return period for either Speed flow or Grand flow to exceed 90 and 600 cubic meters per second (m3/s), respectively, in the area, it is ten years, whereas the univariate return period is 15 years and 12 years for Speed and Grand flow, respectively. Furthermore, it is worth noting that the 6-year return period flow of 77 m3/s and 607 m3/s in Speed and Grand rivers (while considering univariate analysis) can translate to a 9-year return period of simultaneous flow, which also needs to be considered. Therefore, the joint return period is essential in accurately assessing flood risk and planning appropriate management strategies, particularly in areas with high flow conditions.
The comparison between univariate and bivariate probabilistic analysis of extreme river flow events using copulas highlights the benefits of considering the dependencies between the extreme river flows at the two rivers. The univariate analysis focuses on modeling the marginal distribution of a single variable, here, the river flow extreme of a river. While it provides information about the likelihood of individual extreme events, it does not consider any dependencies between the extreme flow events at the two rivers. On the other hand, bivariate analysis based on copula focuses on modeling the joint distribution of two river flow extreme variables (at the Speed and Grand Rivers) and considers the dependencies between variables. This leads to a more comprehensive understanding of the relationship between the two rivers’ extremes and can inform risk management and decision-making in a way univariate analysis cannot. Bivariate analysis using copulas can better represent the overall risk, as it accounts for complex dependencies, including non-linear relationships, between variables. In contrast, univariate analysis only provides information about individual events and does not account for the interplay between variables, which can result in underestimating the overall risk. Bivariate analysis incorporating dependencies between variables improves prediction accuracy compared to univariate analysis.
It is also important to mention that river flow rate is influenced by various factors such as precipitation, snowmelt, and other climatic factors, as well as the geomorphic characteristics of the surrounding environment. Future studies could consider using hydrological and hydraulic models to incorporate these factors into the analysis and provide a more comprehensive assessment of flood risk.
4. Conclusions
The main objective of this paper is to estimate the joint return period of river flow extremes in two rivers located in the Grand River watershed in Ontario, Canada. To achieve this goal, the study employs bivariate copula analysis, which enables the incorporation of mutual dependencies between the two events. By estimating the return period for the joint occurrence of extremes at the two rivers, the study provides valuable insights into the interdependence of the two river flows and how this interdependence influences the behavior of river flow extreme patterns. One of the key observations of the study is that the interdependence between the two river flows leads to behavioral changes in the river flow extreme pattern. The copula analysis employed in the study can capture the dependencies between different extreme river flow events, which traditional methods of extreme value analysis may not be able to do. The use of copulas in studying joint flood risks has several benefits, including flexibility in modeling complex relationships, separation of marginal distributions and dependence structure, better handling of extreme events, improved risk assessment, and improved prediction accuracy.
By highlighting the importance of considering joint flood risks, the study contributes to the body of knowledge on flood risk management and provides useful insights for policymakers and other stakeholders involved in flood risk management. Furthermore, studying joint flood risks provides a more comprehensive understanding of floods’ complex and interrelated risks. This understanding can inform decision-making for effective risk management.
In conclusion, this paper emphasizes the importance of studying joint flood risks using copula analysis. The study provides valuable insights into the interdependence between river flows and how this interdependence influences the behavior of river flow extreme patterns. The use of copulas in studying joint flood risks can provide several benefits, including improved risk assessment and prediction accuracy, and can inform decision-making for effective risk management.
Author Contributions
Conceptualization, P.U. and K.P.; Methodology, P.U. and K.P.; Formal analysis, P.U. and N.A.; Investigation, P.U. and F.K.; Resources, K.P.; Data curation, K.P.; Writing—original draft, P.U.; Writing—review & editing, K.P., N.A.; Supervision, K.P., N.A. and F.K.; Project administration, F.K. All authors have read and agreed to the published version of the manuscript.
Funding
The authors thank NSERC and NSERC-Loblaws CRD for partial funding.
Institutional Review Board Statement
Not applicable.
Informed Consent Statement
Not applicable.
Data Availability Statement
Publicly available datasets were analyzed in this study. This data can be found here: https://wateroffice.ec.gc.ca/.
Conflicts of Interest
The authors declare no conflict of interest.
References
- Cook, K.H.; Vizy, E.K. Coupled Model Simulations of the West African Monsoon System: Twentieth and Twenty-First-Century Simulations. J. Clim. 2006, 19, 3681–3703. [Google Scholar] [CrossRef]
- Trenberth, K.E.; Fasullo, J.; Smith, L. Trends and Variability in Column-Integrated Atmospheric Water Vapor. Clim. Dyn. 2005, 24, 741–758. [Google Scholar] [CrossRef]
- Seneviratne, S.; Nicholls, N.; Easterling, D.; Goodess, C.M.; Kanae, S.; Kossin, J.; Luo, Y.; Marengo, J.; McInnes, K.; Rahimi, M.; et al. Changes in Climate Extremes and Their Impacts on the Natural Physical Environment. In Managing the Risks of Extreme Events and Disasters to Advance Climate Change Adaptation; Field, C.B., Barros, V., Stocker, T.F., Qin, D., Dokken, D.J., Ebi, K.L., Mastrandrea, M.D., Mach, K.J., Plattner, G.-K., Allen, S.K., et al., Eds.; Cambridge University Press: Cambridge, UK; New York, NY, USA, 2012; pp. 109–230. [Google Scholar]
- AghaKouchak, A.; Chiang, F.; Huning, L.S.; Love, C.A.; Mallakpour, I.; Mazdiyasni, O.; Moftakhari, H.; Papalexiou, S.M.; Ragno, E.; Sadegh, M. Climate Extremes and Compound Hazards in a Warming World. Annu. Rev. Earth Planet. Sci. 2020, 48, 519–548. [Google Scholar] [CrossRef] [Green Version]
- Zuccaro, G.; De Gregorio, D.; Leone, M.F. Theoretical Model for Cascading Effects Analyses. Int. J. Disaster Risk Reduc. 2018, 30, 199–215. [Google Scholar] [CrossRef]
- World Health Organization. Floods. Available online: https://www.who.int/health-topics/floods#tab=tab_1 (accessed on 7 January 2023).
- Chen, L.; Singh, V.P.; Shenglian, G.; Hao, Z.; Li, T. Flood Coincidence Risk Analysis Using Multivariate Copula Functions. J. Hydrol. Eng. 2012, 17, 742–755. [Google Scholar] [CrossRef]
- Vaz de Melo Mendes, B.; Mendes Semeraro, M.P.; Câmara Leal, R. Pair-Copulas Modeling in Finance. Financ. Mark. Portf. Manag. 2010, 24, 193–213. [Google Scholar] [CrossRef]
- Hu, L. Dependence Patterns across Financial Markets: A Mixed Copula Approach. Appl. Financ. Econ. 2006, 16, 717–729. [Google Scholar] [CrossRef]
- Aas, K.; Czado, C.; Frigessi, A.; Bakken, H. Pair-Copula Constructions of Multiple Dependence. Insur. Math. Econ. 2009, 44, 182–198. [Google Scholar] [CrossRef] [Green Version]
- Bačová Mitková, V.; Halmová, D. Joint Modeling of Flood Peak Discharges, Volume and Duration: A Case Study of the Danube River in Bratislava. J. Hydrol. Hydromech. 2014, 62, 186–196. [Google Scholar] [CrossRef] [Green Version]
- Gräler, B.; van den Berg, M.J.; Vandenberghe, S.; Petroselli, A.; Grimaldi, S.; de Baets, B.; Verhoest, N.E.C. Multivariate Return Periods in Hydrology: A Critical and Practical Review Focusing on Synthetic Design Hydrograph Estimation. Hydrol. Earth Syst. Sci. 2013, 17, 1281–1296. [Google Scholar] [CrossRef] [Green Version]
- Zhang, L.; Singh, V.P. Copulas and Their Applications in Water Resources Engineering; Cambridge University Press: Cambridge, UK, 2019; ISBN 9781108565103. [Google Scholar]
- Karmakar, S.; Simonovic, S.P. Bivariate Flood Frequency Analysis. Part 2: A Copula-Based Approach with Mixed Marginal Distributions. J. Flood Risk Manag. 2009, 2, 32–44. [Google Scholar] [CrossRef]
- Kao, S.; Govindaraju, R.S. A Bivariate Frequency Analysis of Extreme Rainfall with Implications for Design. J. Geophys. Res. Atmos. 2007, 112, 2007JD008522. [Google Scholar] [CrossRef]
- Zhang, L.; Singh, V.P. Bivariate Flood Frequency Analysis Using the Copula Method. J. Hydrol. Eng. 2006, 11, 150–164. [Google Scholar] [CrossRef]
- Righi, M.B.; Ceretta, P.S. Analyzing the Dependence Structure of Various Sectors in the Brazilian Market: A Pair Copula Construction Approach. Econ. Model. 2013, 35, 199–206. [Google Scholar] [CrossRef]
- Danaher, P.J.; Smith, M.S. Modeling Multivariate Distributions Using Copulas: Applications in Marketing. Mark. Sci. 2011, 30, 4–21. [Google Scholar] [CrossRef]
- Dißmann, J.; Brechmann, E.C.; Czado, C.; Kurowicka, D. Selecting and Estimating Regular Vine Copulae and Application to Financial Returns. Comput. Stat. Data Anal. 2013, 59, 52–69. [Google Scholar] [CrossRef] [Green Version]
- Smith, M.S. Copula Modelling of Dependence in Multivariate Time Series. Int. J. Forecast. 2015, 31, 815–833. [Google Scholar] [CrossRef] [Green Version]
- Liu, Y.R.; Li, Y.P.; Ma, Y.; Jia, Q.M.; Su, Y.Y. Development of a Bayesian-Copula-Based Frequency Analysis Method for Hydrological Risk Assessment—The Naryn River in Central Asia. J. Hydrol. 2020, 580, 124349. [Google Scholar] [CrossRef]
- Nazeri Tahroudi, M.; Ramezani, Y.; De Michele, C.; Mirabbasi, R. Trivariate Joint Frequency Analysis of Water Resources Deficiency Signatures Using Vine Copulas. Appl. Water Sci. 2022, 12, 67. [Google Scholar] [CrossRef]
- Nelson, R.B. An Introduction to Copulas, 2nd ed.; Bickel, P., Diggle, P., Fienberg, S., Gather, U., Olkin, I., Zeger, S., Eds.; Springer: Berlin/Heidelberg, Germany, 2006; ISBN 10: 0-387-28659-4. [Google Scholar]
- Chen, L.; Guo, S. Copulas and Its Application in Hydrology and Water Resources; Springer: Berlin/Heidelberg, Germany, 2019; ISBN 978-981-13-0573-3. [Google Scholar]
- Perz, A.; Wrzesiński, D.; Sobkowiak, L.; Stodolak, R. Copula-Based Geohazard Assessment—Case of Flood-Prone Area in Poland. J. Hydrol. Reg. Stud. 2022, 44, 101214. [Google Scholar] [CrossRef]
- Razmkhah, H.; Fararouie, A.; Ravari, A.R. Multivariate Flood Frequency Analysis Using Bivariate Copula Functions. Water Resour. Manag. 2022, 36, 729–743. [Google Scholar] [CrossRef]
- Xie, K.; He, Y.; Kim, J.-S.; Yoon, S.-K.; Liu, J.; Chen, H.; Lee, J.H.; Zhang, X.; Xu, C.-Y. Assessment of the Joint Impact of Rainfall Characteristics on Urban Flooding and Resilience Using the Copula Method. Water Resour. Manag. 2023, 37, 1765–1784. [Google Scholar] [CrossRef]
- Latif, S.; Mustafa, F. Bivariate flood distribution analysis under parametric copula framework: A case study for Kelantan River basin in Malaysia. Acta Geophys. 2020, 68, 821–859. [Google Scholar] [CrossRef]
- Feng, Y.; Shi, P.; Qu, S.; Mou, S.; Chen, C.; Dong, F. Nonstationary Flood Coincidence Risk Analysis Using Time-Varying Copula Functions. Sci. Rep. 2020, 10, 3395. [Google Scholar] [CrossRef] [Green Version]
- Ai, P.; Yuan, D.; Xiong, C. Copula-Based Joint Probability Analysis of Compound Floods from Rainstorm and Typhoon Surge: A Case Study of Jiangsu Coastal Areas, China. Sustainability 2018, 10, 2232. [Google Scholar] [CrossRef] [Green Version]
- Wang, S.; Wu, J.; Wang, S.; Xie, X.; Fan, Y.; Lv, L.; Huang, G. Copula-Based Multivariate Simulation Approach for Flood Risk Transfer of Multi-Reservoirs in the Weihe River, China. Water 2022, 14, 2676. [Google Scholar] [CrossRef]
- Zhong, M.; Zeng, T.; Jiang, T.; Wu, H.; Chen, X.; Hong, Y. A Copula-Based Multivariate Probability Analysis for Flash Flood Risk under the Compound Effect of Soil Moisture and Rainfall. Water Resour. Manag. 2021, 35, 83–98. [Google Scholar] [CrossRef]
- Bačová Mitková, V.; Halmová, D.; Pekárová, P.; Miklánek, P. The Copula Application for Analysis of the Flood Threat at the River Confluences in the Danube River Basin in Slovakia. Water 2023, 15, 984. [Google Scholar] [CrossRef]
- Kaur, B.; Shrestha, N.; Daggupati, P.; Rudra, R.; Goel, P.; Shukla, R.; Allataifeh, N. Water Security Assessment of the Grand River Watershed in Southwestern Ontario, Canada. Sustainability 2019, 11, 1883. [Google Scholar] [CrossRef] [Green Version]
- Environment and Natural Resources Water Level and Flow. Available online: https://wateroffice.ec.gc.ca/ (accessed on 29 March 2022).
- Nirupama, N.; Simonovic, S.P. Increase of Flood Risk Due to Urbanisation: A Canadian Example. Nat. Hazards 2007, 40, 25–41. [Google Scholar] [CrossRef]
- Grand River Conservation Authority (GRCA) Our Watershed. Available online: https://www.grandriver.ca/en/our-watershed/Our-Watershed.aspx (accessed on 3 April 2022).
- Sklar, A. Fonctions de Repartition à n Dimensionls et Leurs Marges; Publications de l’Institut Statistique de l’Université de Paris: Paris, France, 1959; pp. 229–231. [Google Scholar]
- Hofert, M.; Kojadinovic, I.; Machler, M.; Yan, J. Elements of Copula Modeling With R; Springer: Berlin/Heidelberg, Germany, 2018; ISBN 9783319896342. [Google Scholar]
- Salvadori, G.; De Michele, C. Multivariate Multiparameter Extreme Value Models and Return Periods: A Copula Approach. Water Resour. Res. 2010, 46, 2009WR009040. [Google Scholar] [CrossRef]
- Vorobevskii, I.; Kronenberg, R.; Bernhofer, C. Estimation of Joint Return Periods of Compound Precipitation-Discharge Extremes for Small Catchments. Hydrol. Earth Syst. Sci. Discuss. 2020, 1–23. [Google Scholar] [CrossRef]
- Akaike, H. A New Look at the Statistical Model Identification. IEEE Trans. Automat. Contr. 1974, 19, 716–723. [Google Scholar] [CrossRef]
- Nagler, T.; Schepsmeier, U.; Stoeber, J.; Brechmann, E.C.; Graeler, B.; Erhardt, T. VineCopula: Statistical Inference of Vine Copulas. Available online: https://github.com/tnagler/VineCopula (accessed on 18 February 2022).
- Joe, H. Multivariate Models and Multivariate Dependence Concepts; Chapman and Hall/CRC: London, UK, 1997; ISBN 9780367803896. [Google Scholar]
- Evans, D.L.; Drew, J.H.; Leemis, L.M. The Distribution of the Kolmogorov–Smirnov, Cramer–von Mises, and Anderson–Darling Test Statistics for Exponential Populations with Estimated Parameters. Commun. Stat. Simul. Comput. 2008, 37, 1396–1421. [Google Scholar] [CrossRef]
Figure 1.
Grand River and Speed River meeting at the City of Cambridge, Ontario, Canada.
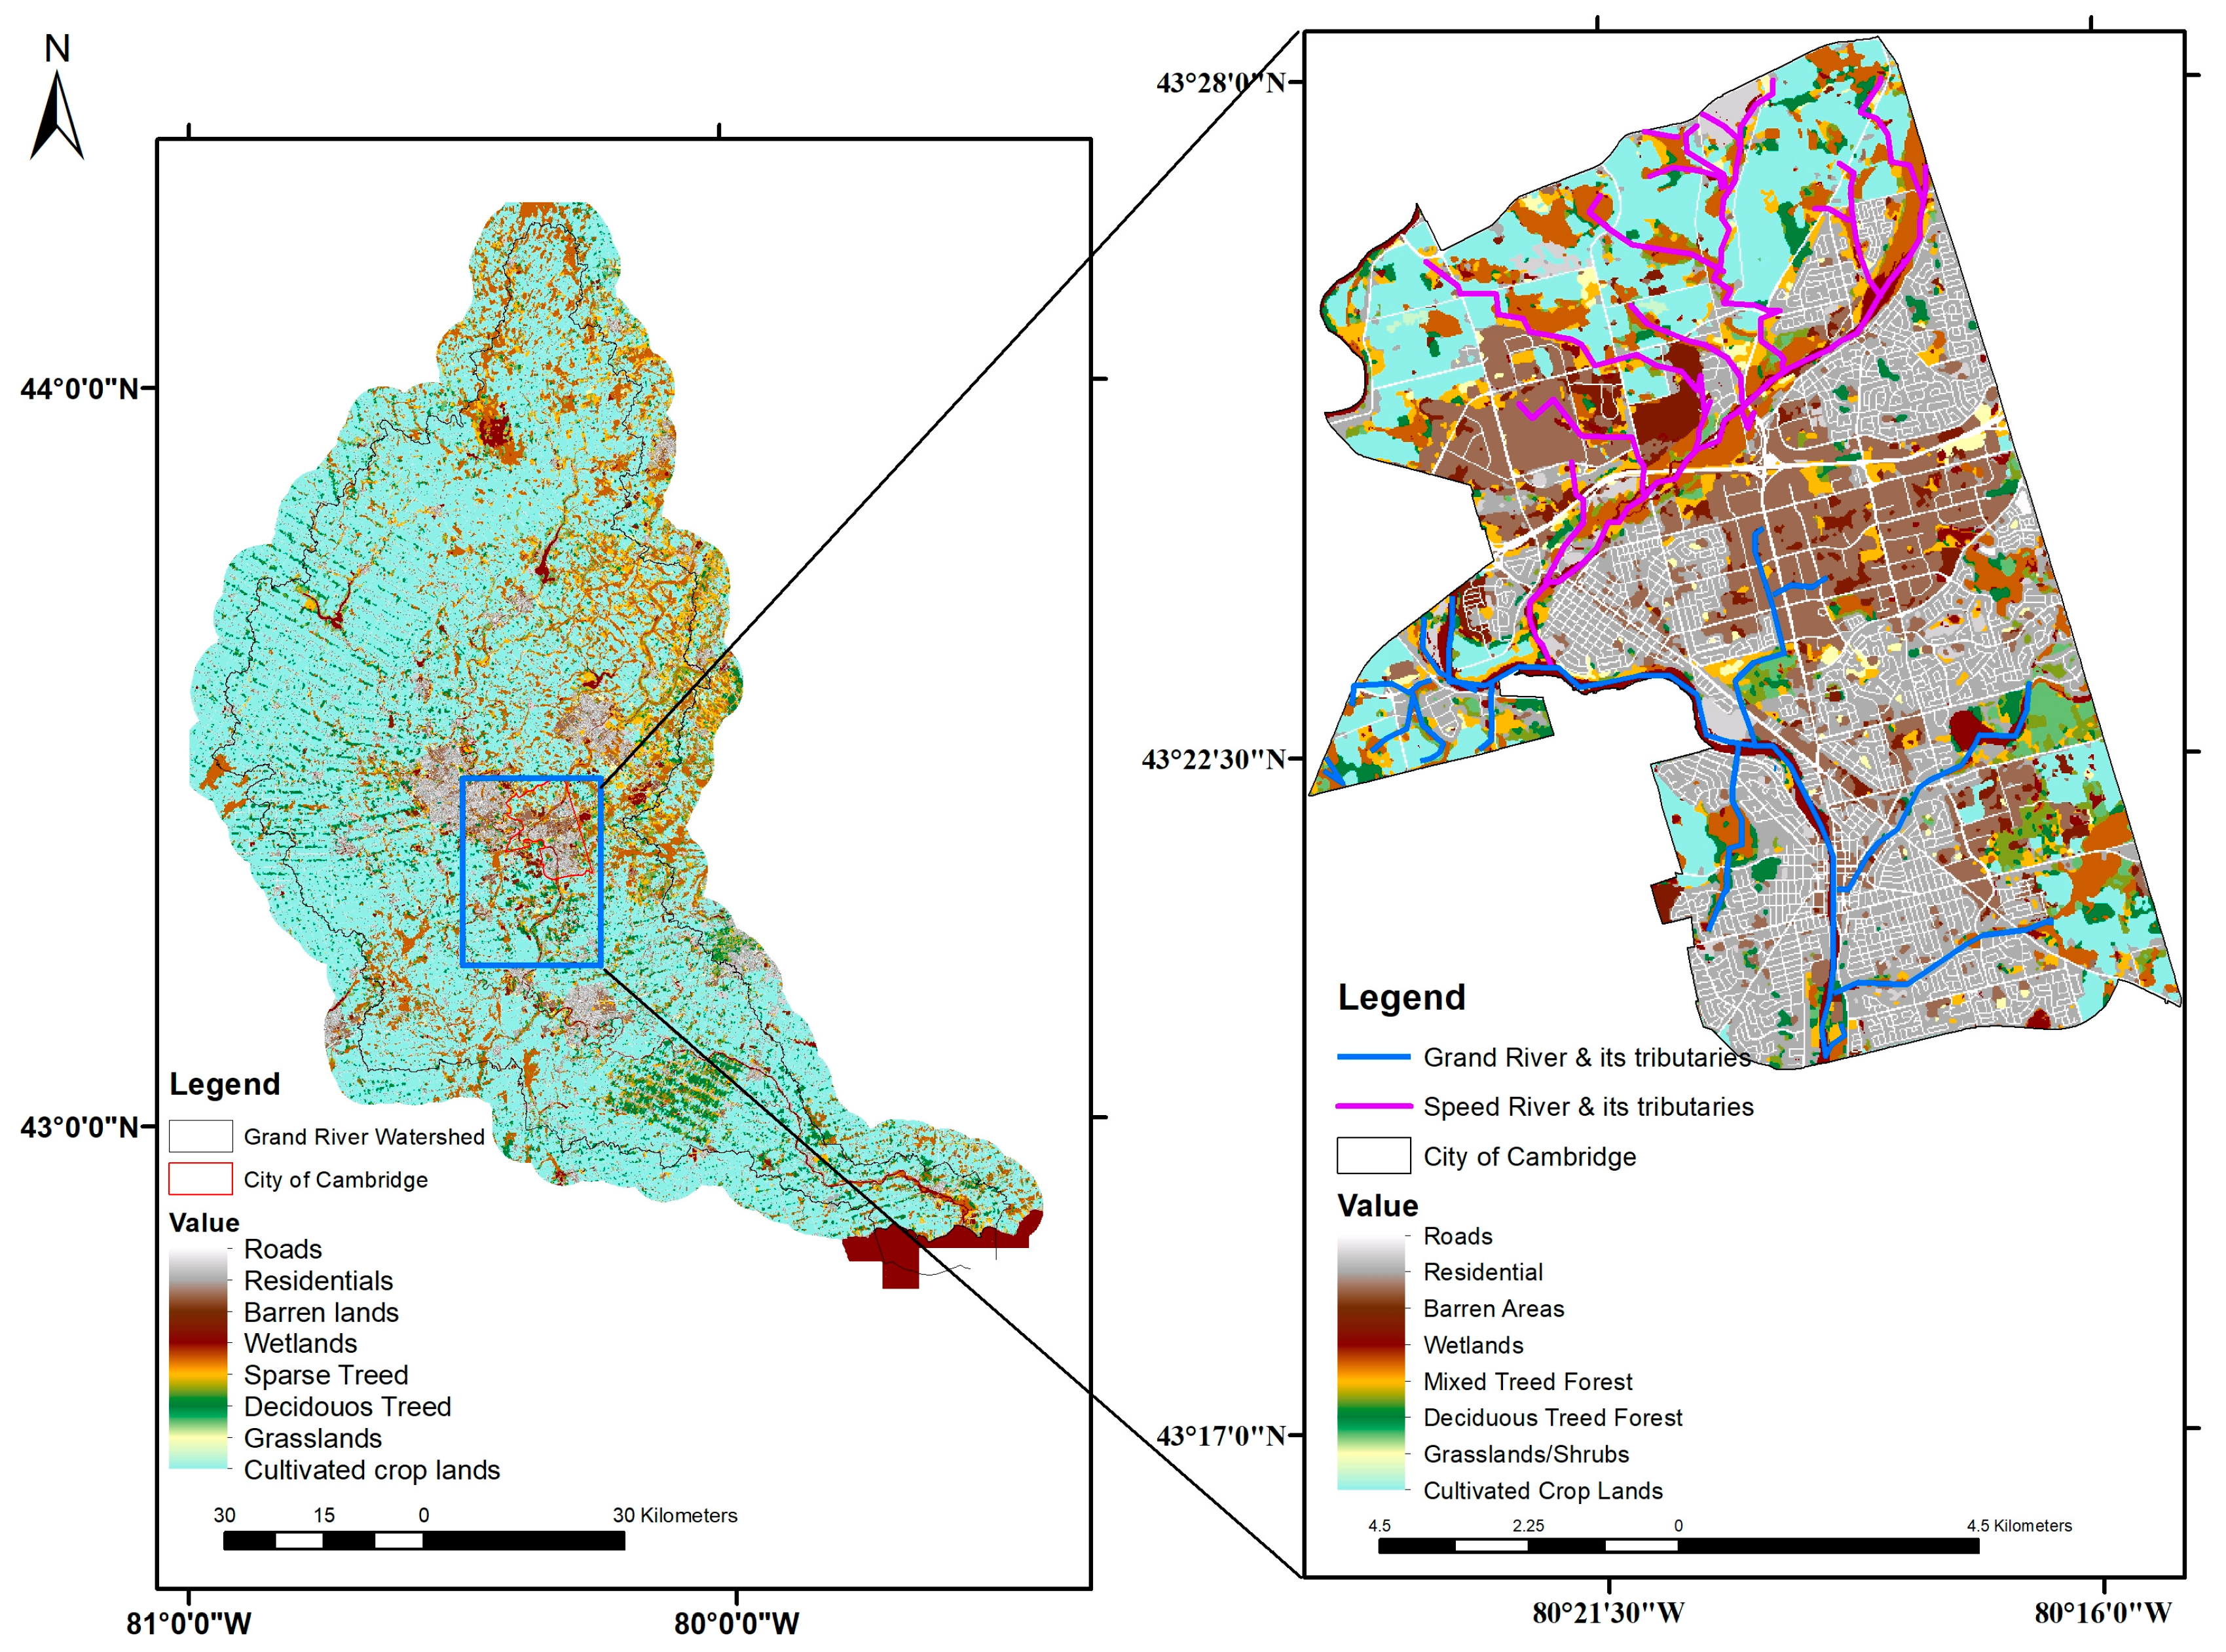
Figure 2.
Annual peak flow events at the Speed River and Grand River in the Grand River watershed in Canada.
Figure 2.
Annual peak flow events at the Speed River and Grand River in the Grand River watershed in Canada.
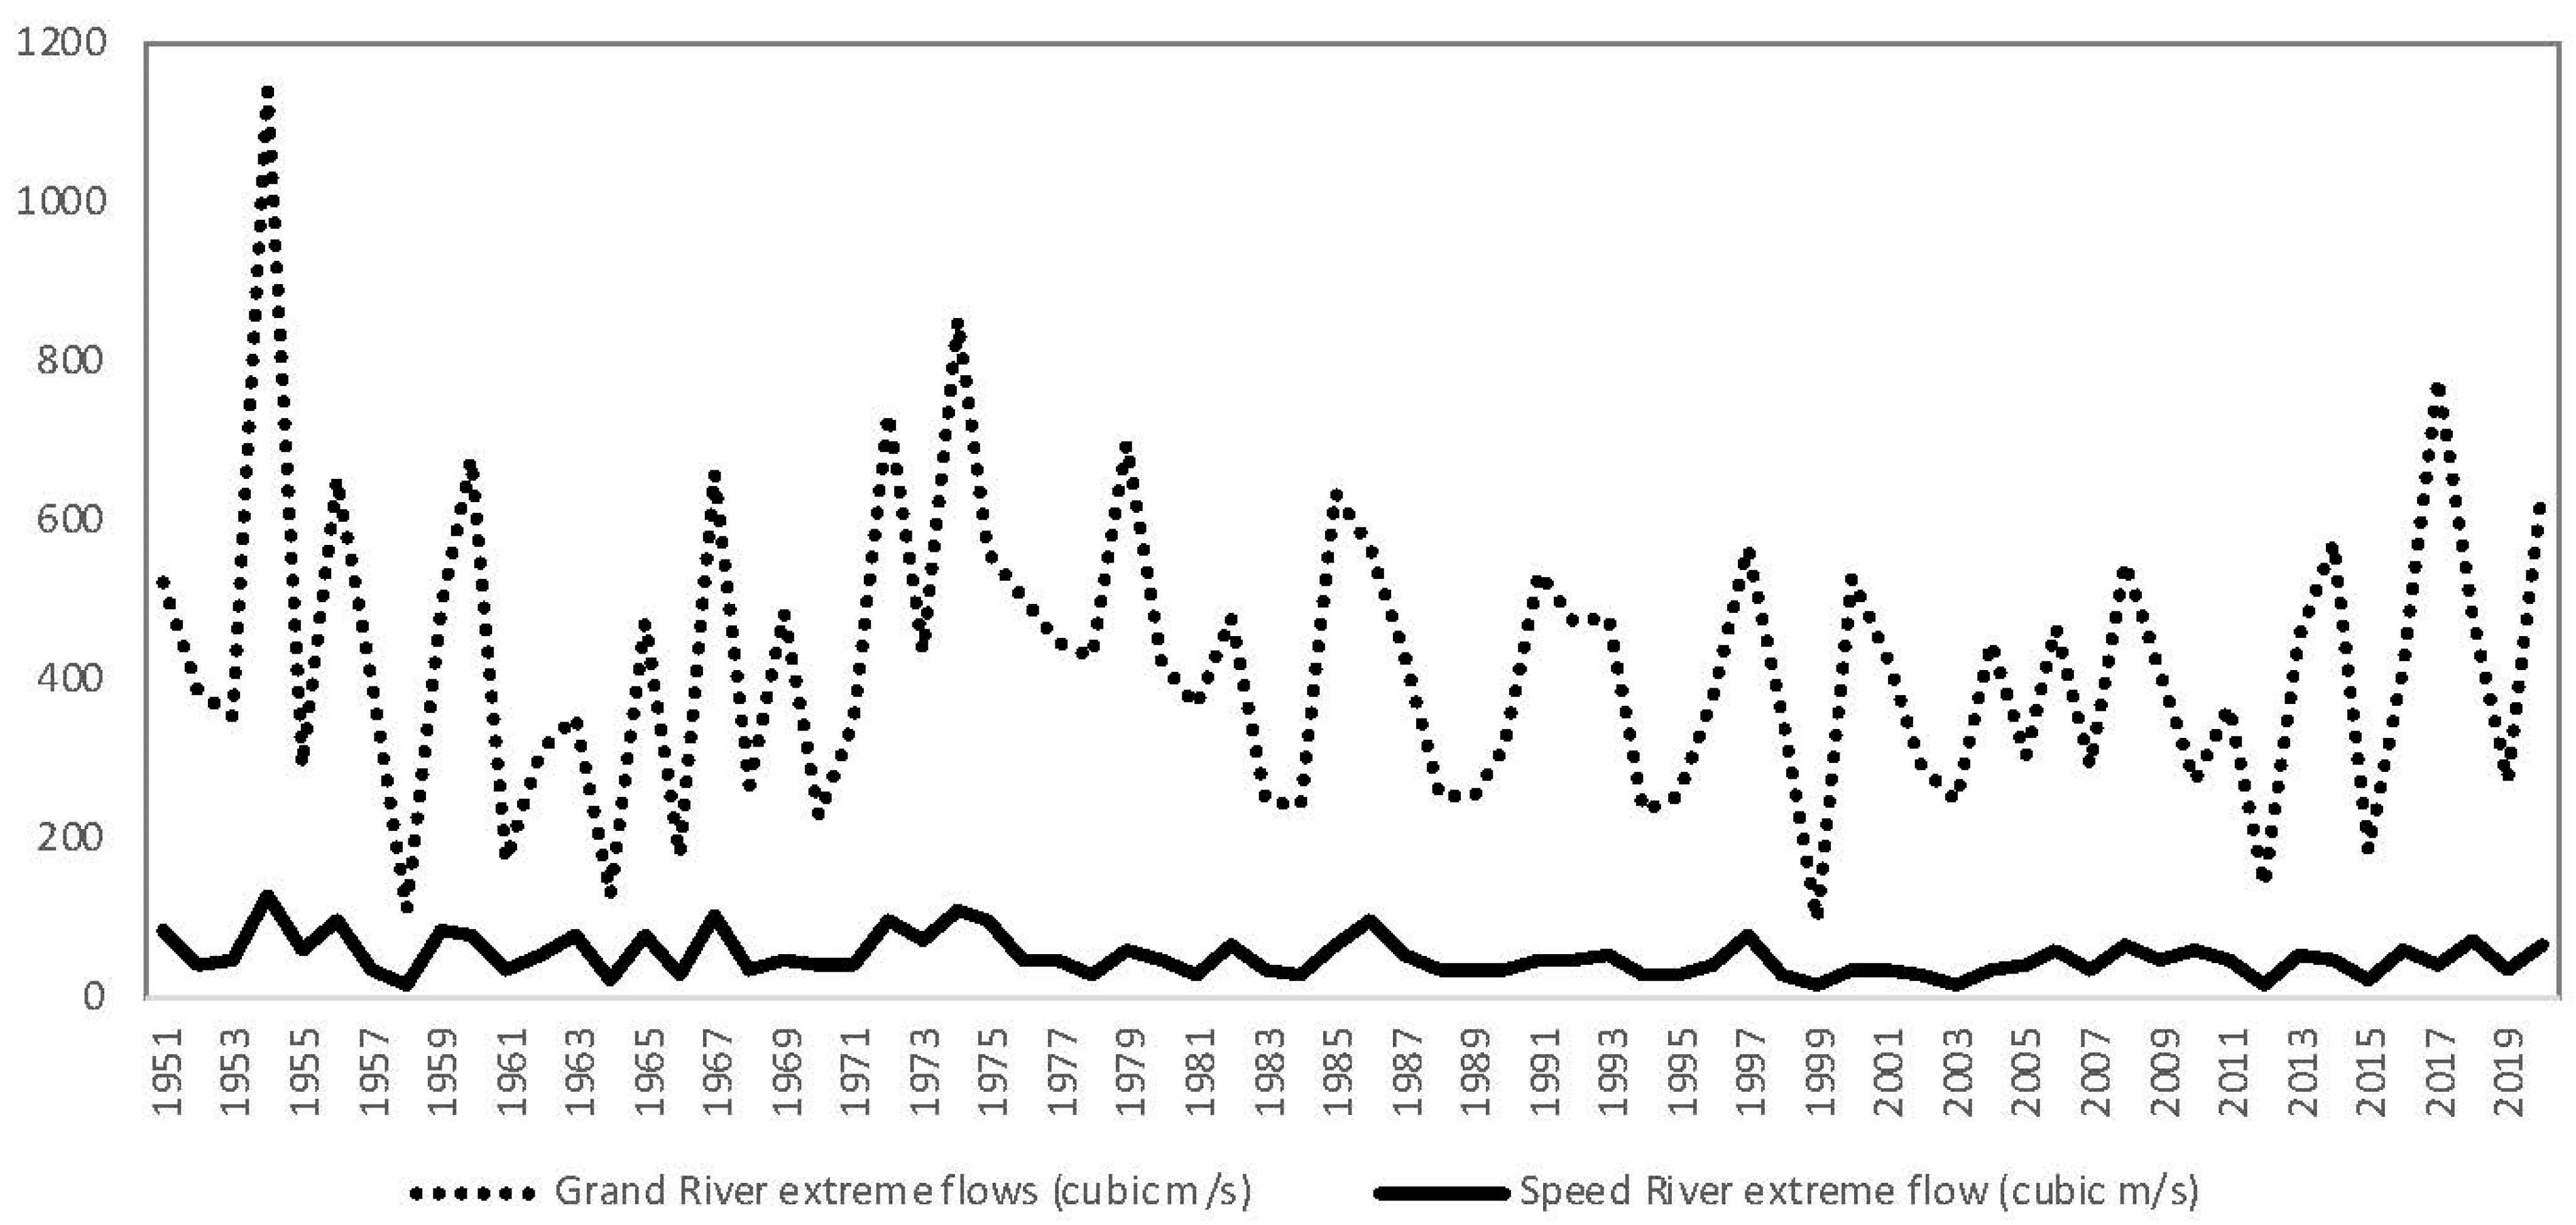
Figure 3.
Observed river flow extremes and simulated data using bivariate copula.
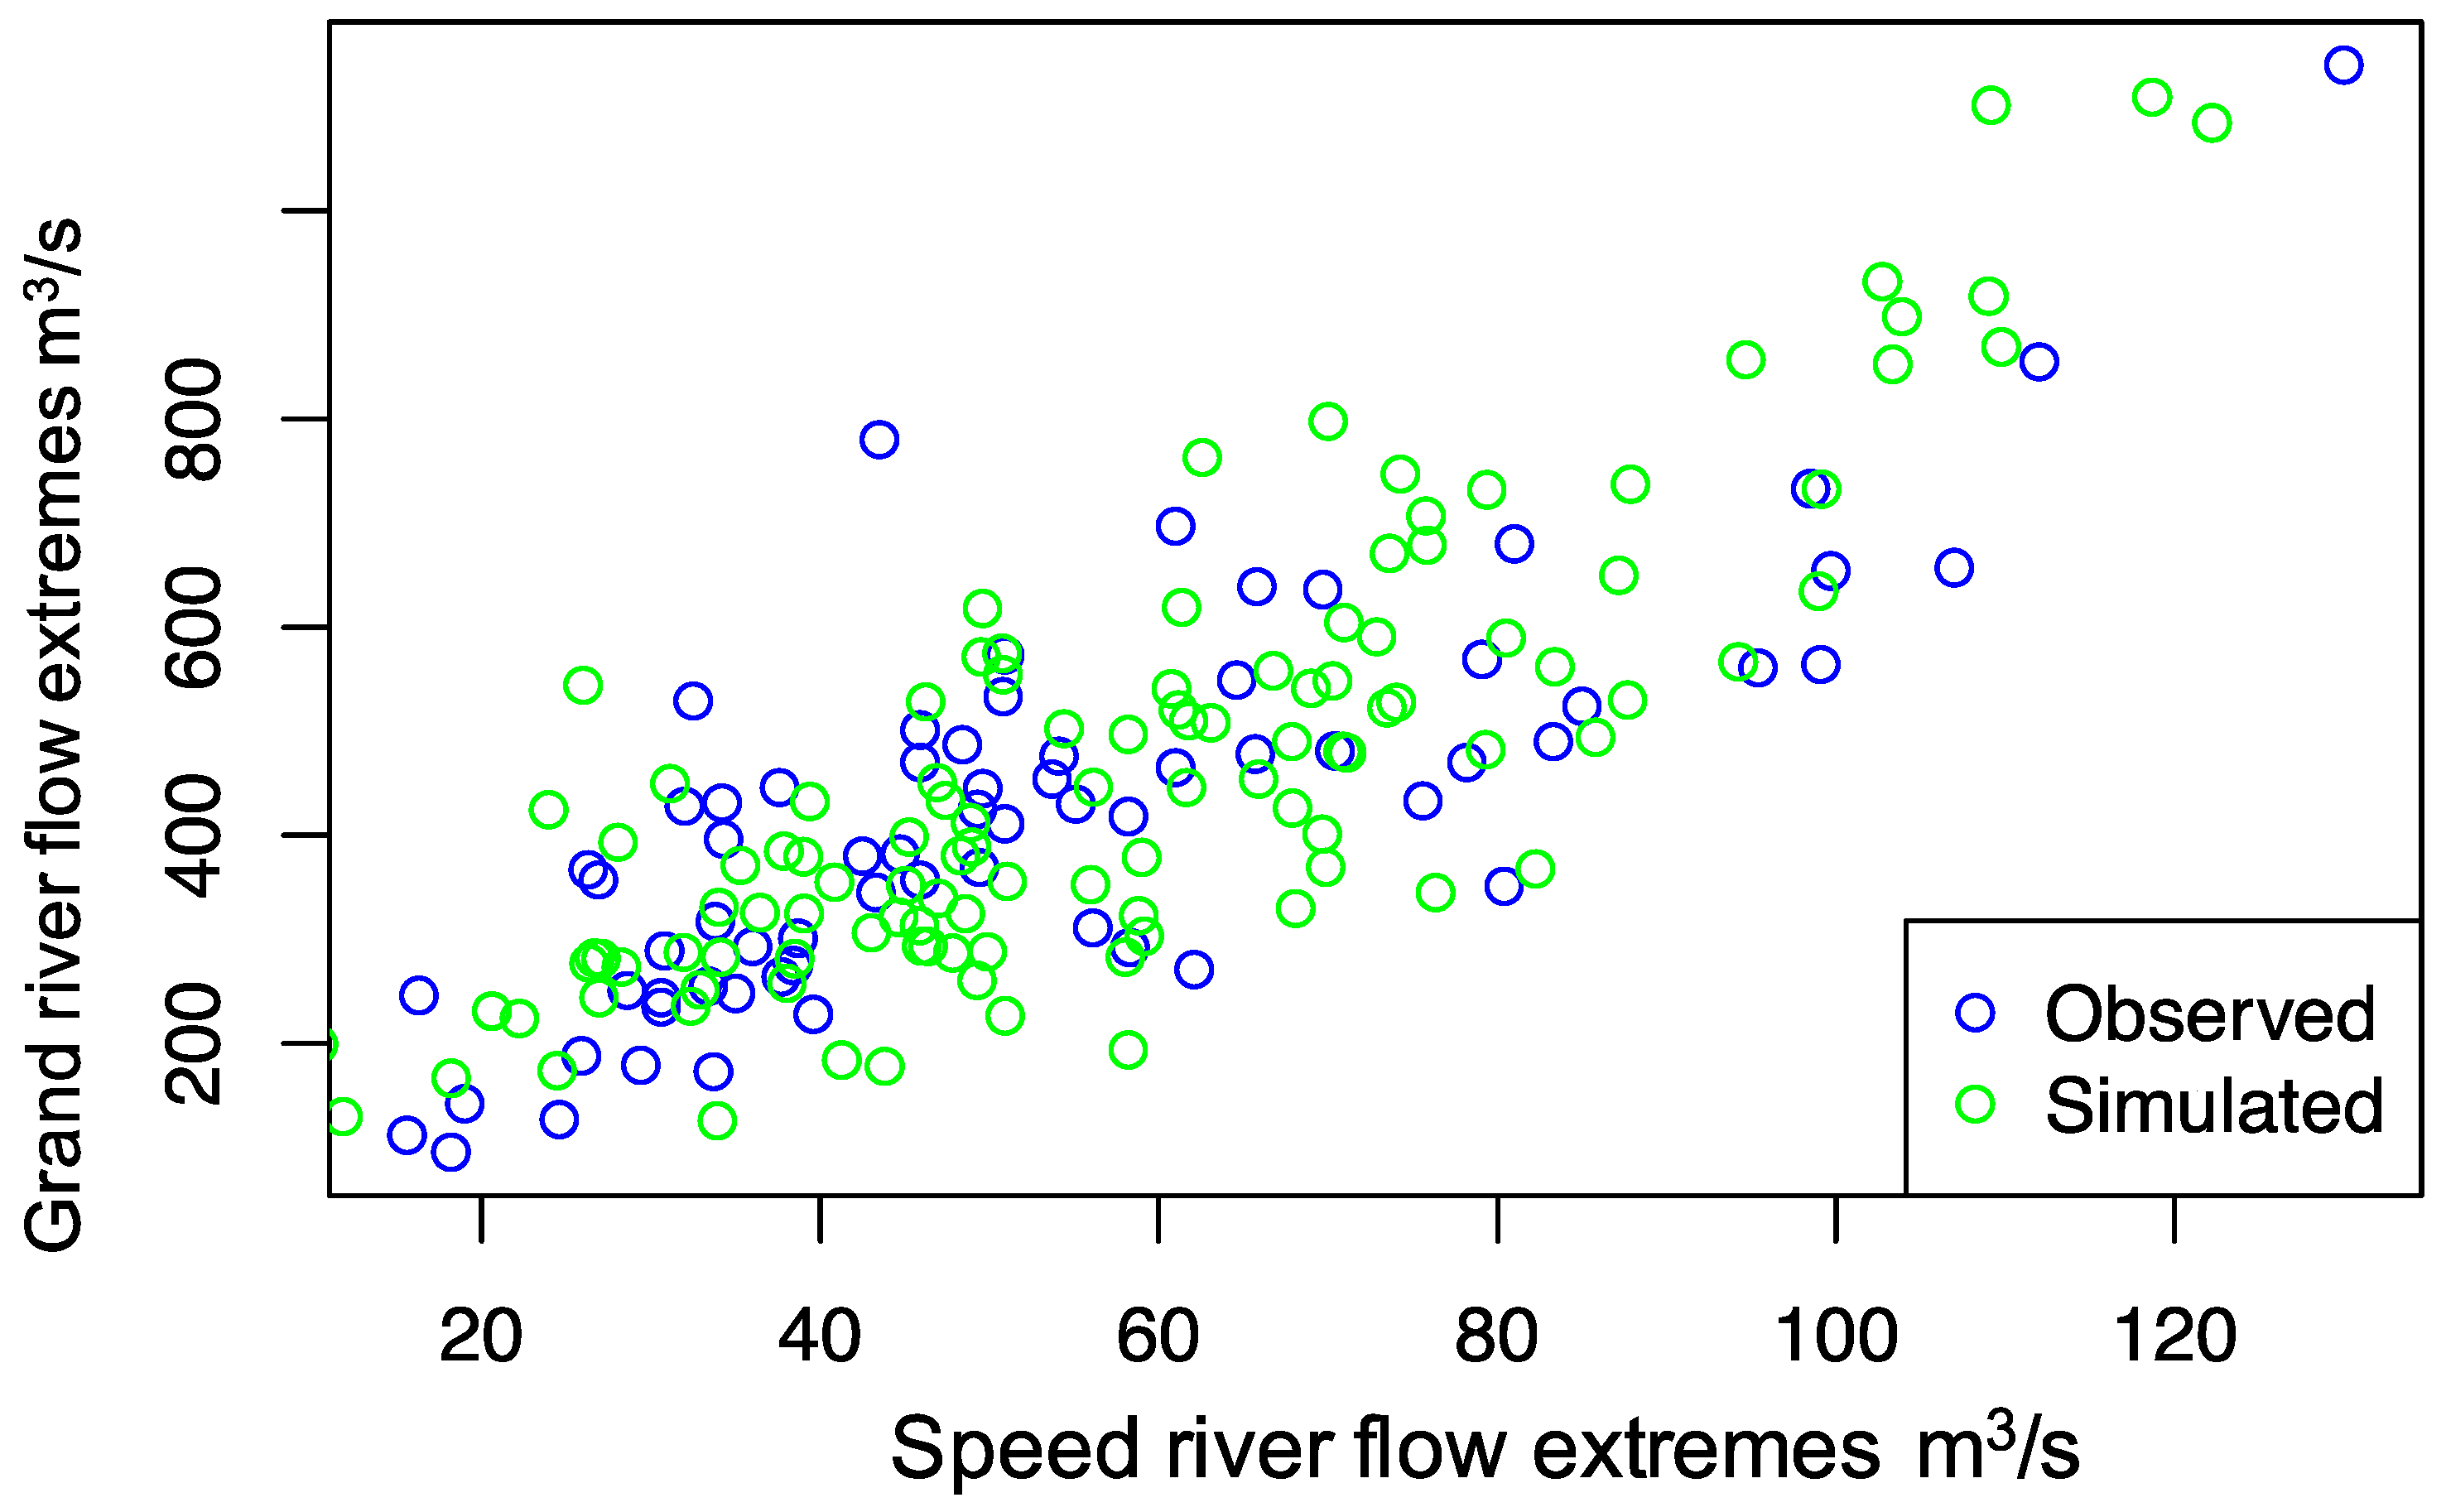
Figure 4.
Probability distribution function (PDF) of the developed bivariate distribution (copula) of the Speed and Grand Rivers flow extremes.
Figure 4.
Probability distribution function (PDF) of the developed bivariate distribution (copula) of the Speed and Grand Rivers flow extremes.
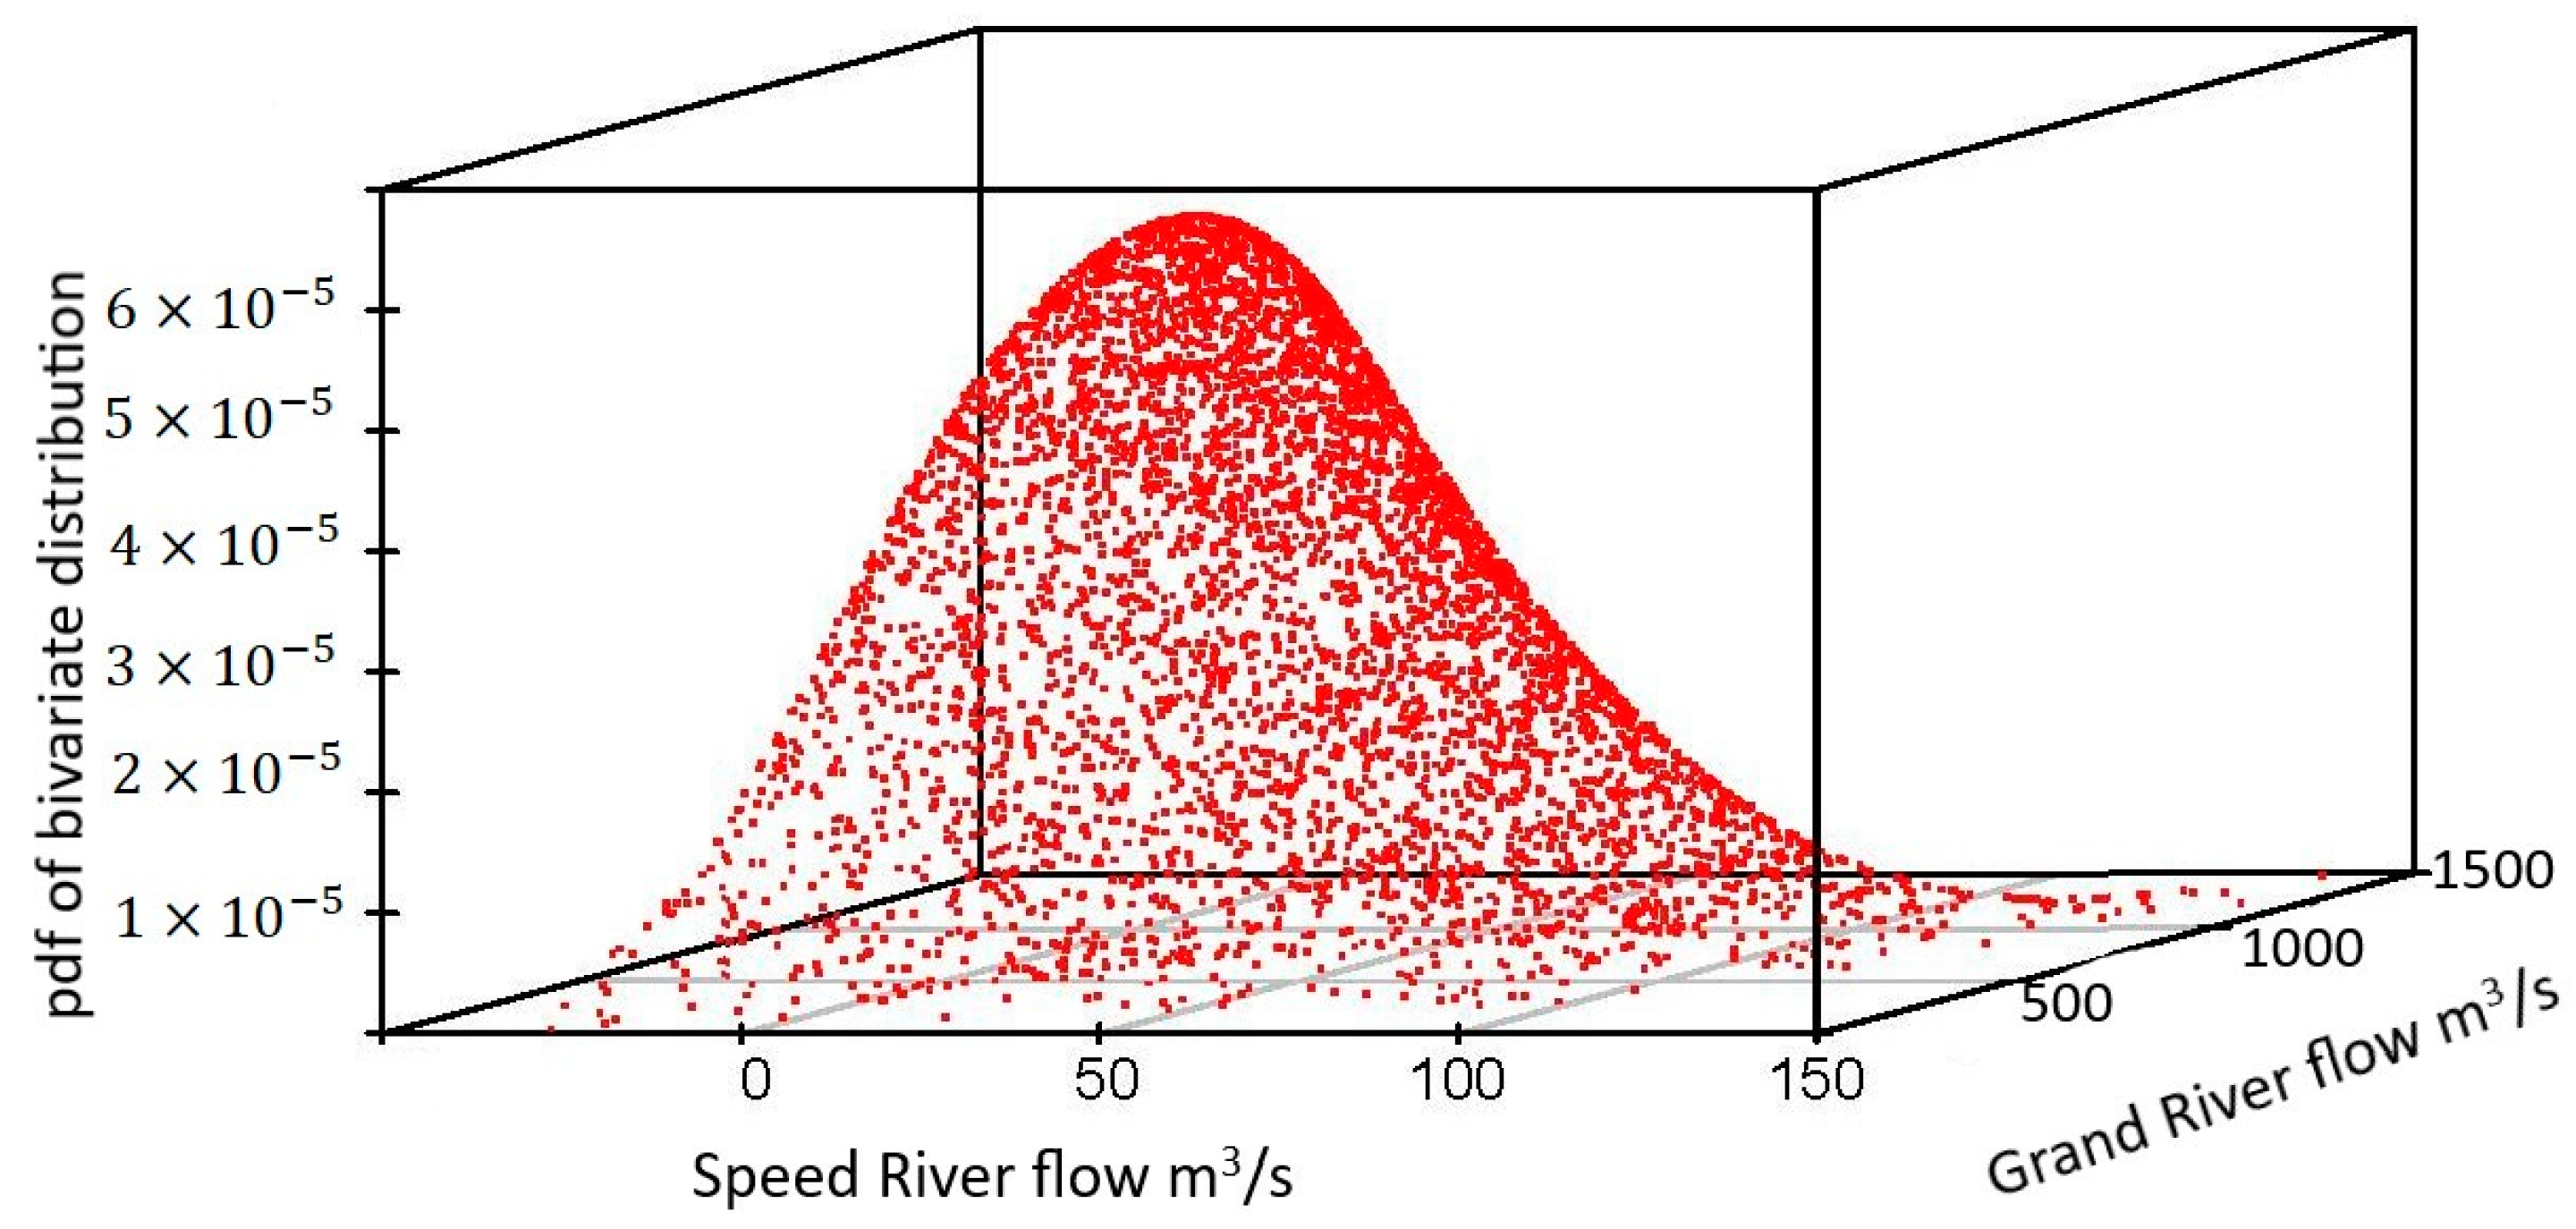
Figure 5.
Cumulative distribution function (CDF) of the developed bivariate distribution of the Speed and Grand Rivers flow extremes.
Figure 5.
Cumulative distribution function (CDF) of the developed bivariate distribution of the Speed and Grand Rivers flow extremes.
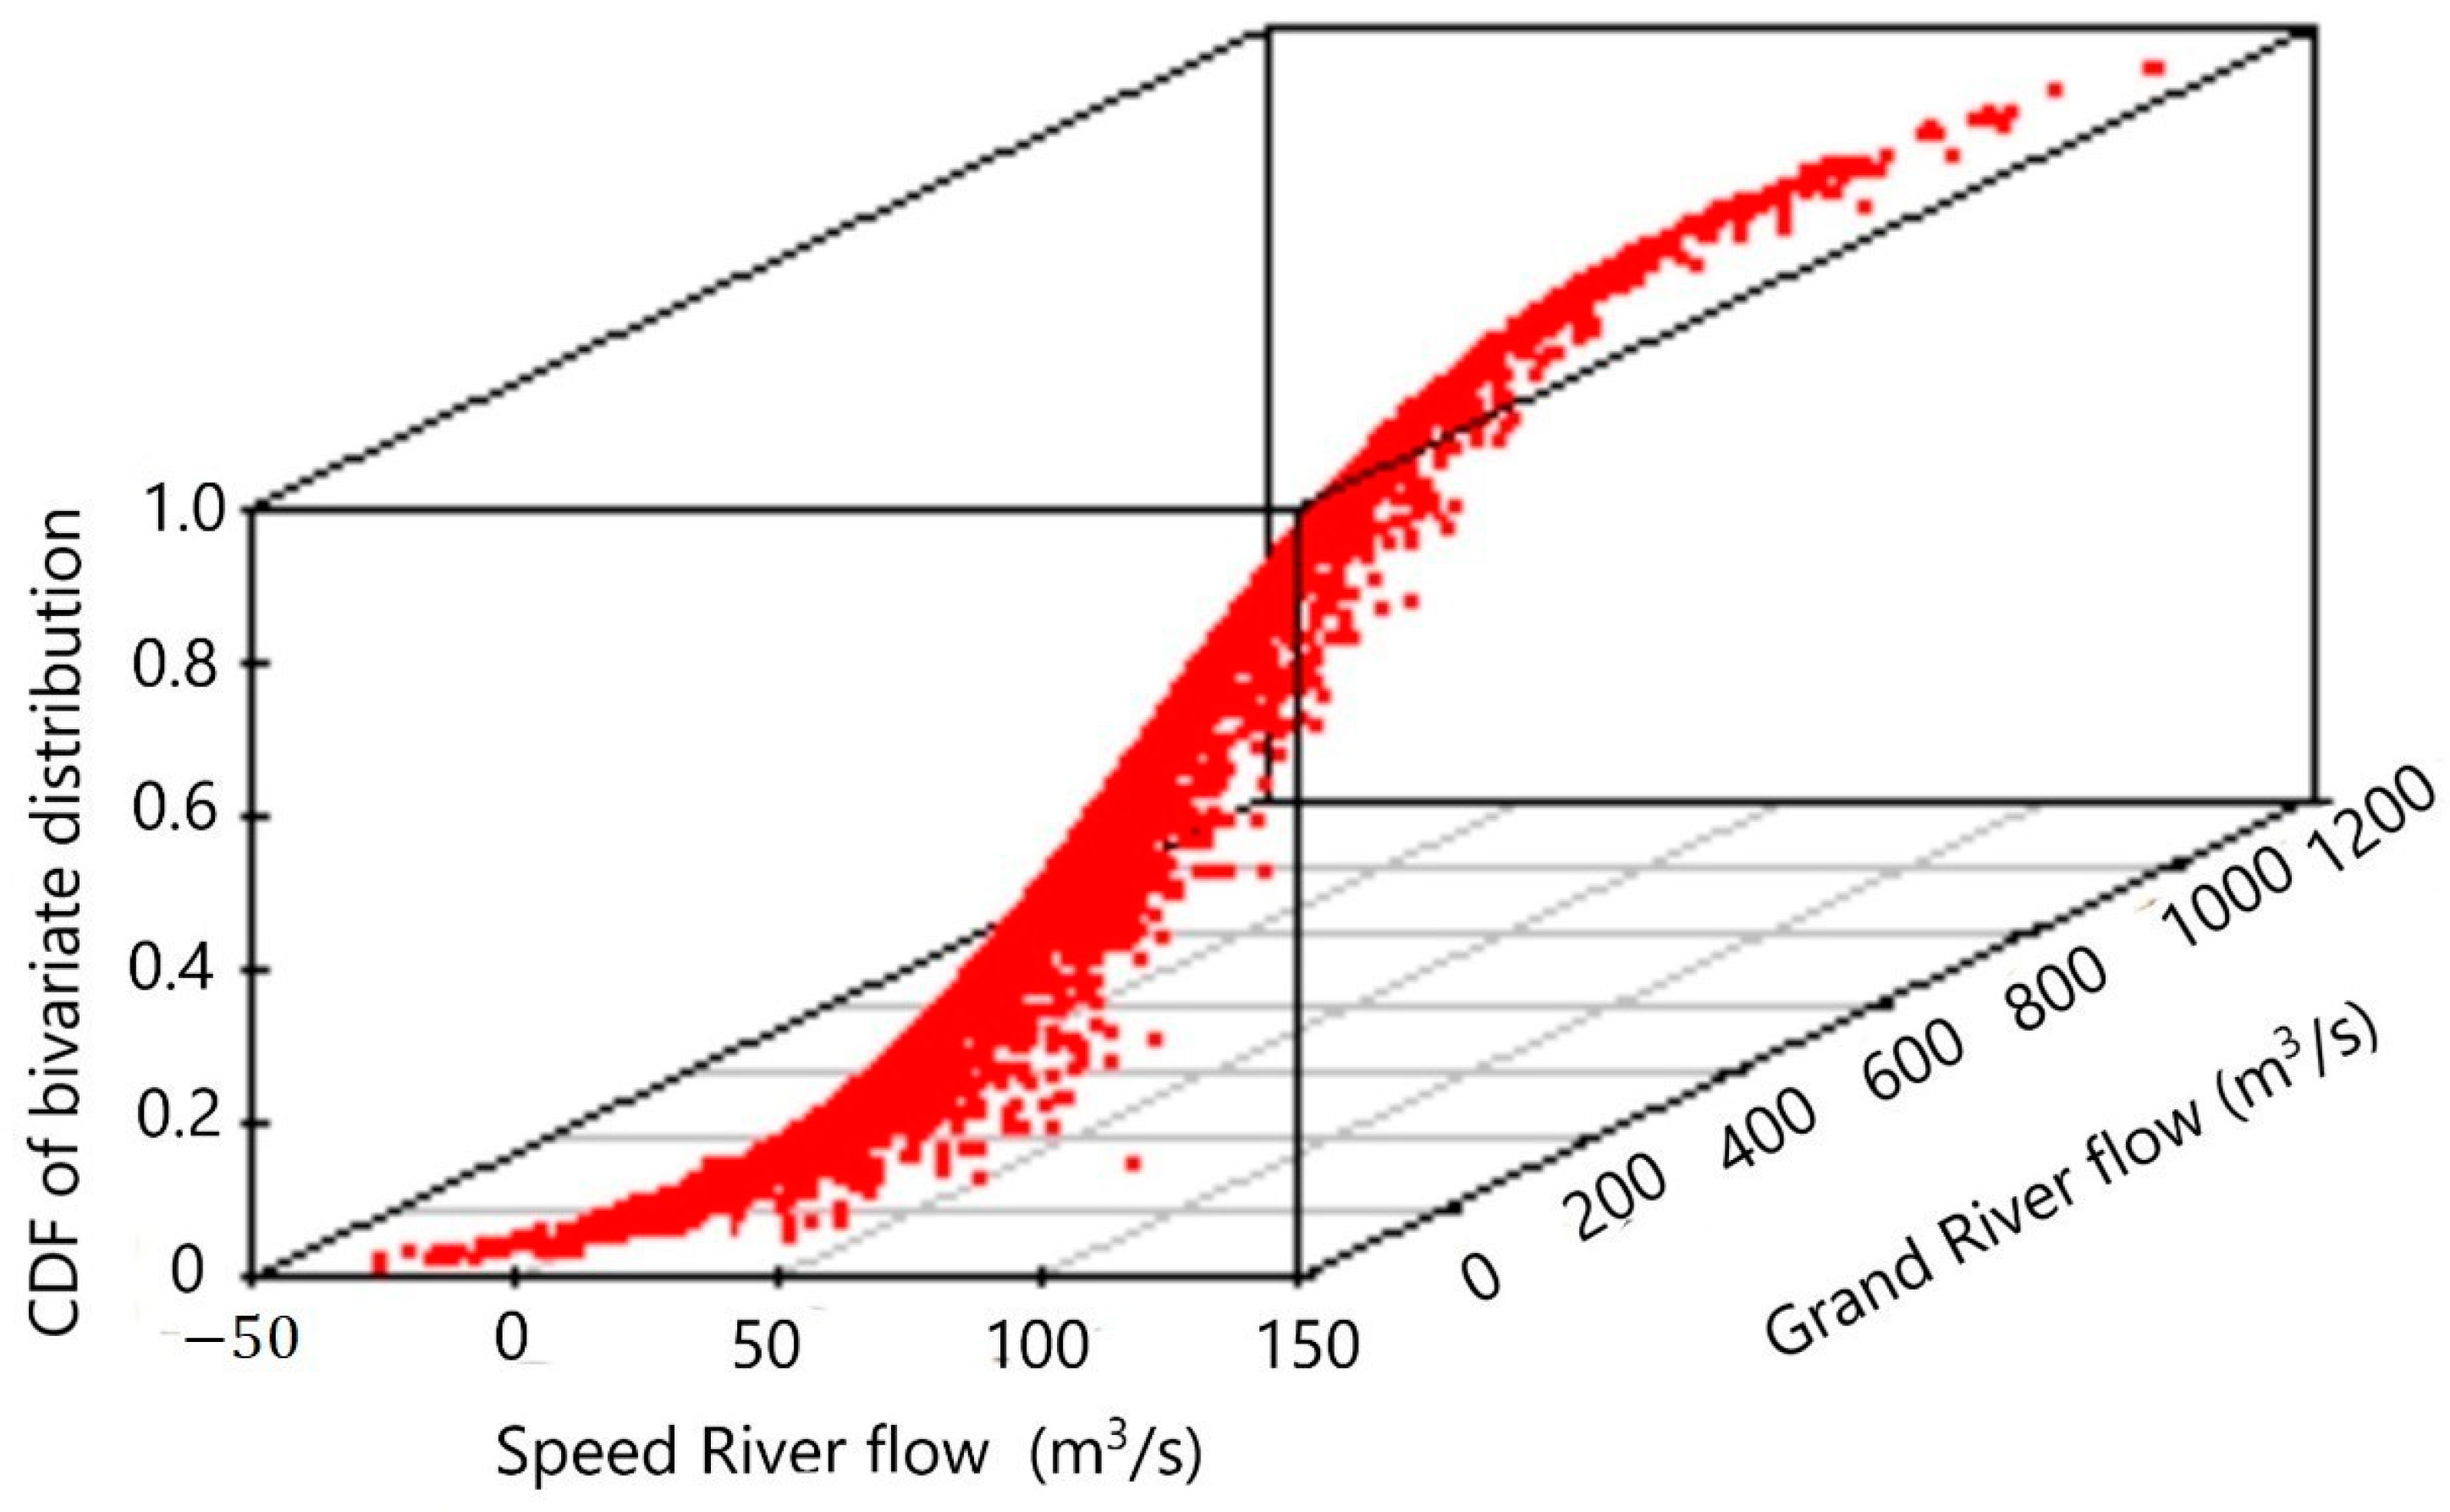
Figure 6.
Joint return period (AND) of the Speed and Grand Rivers flow extremes.
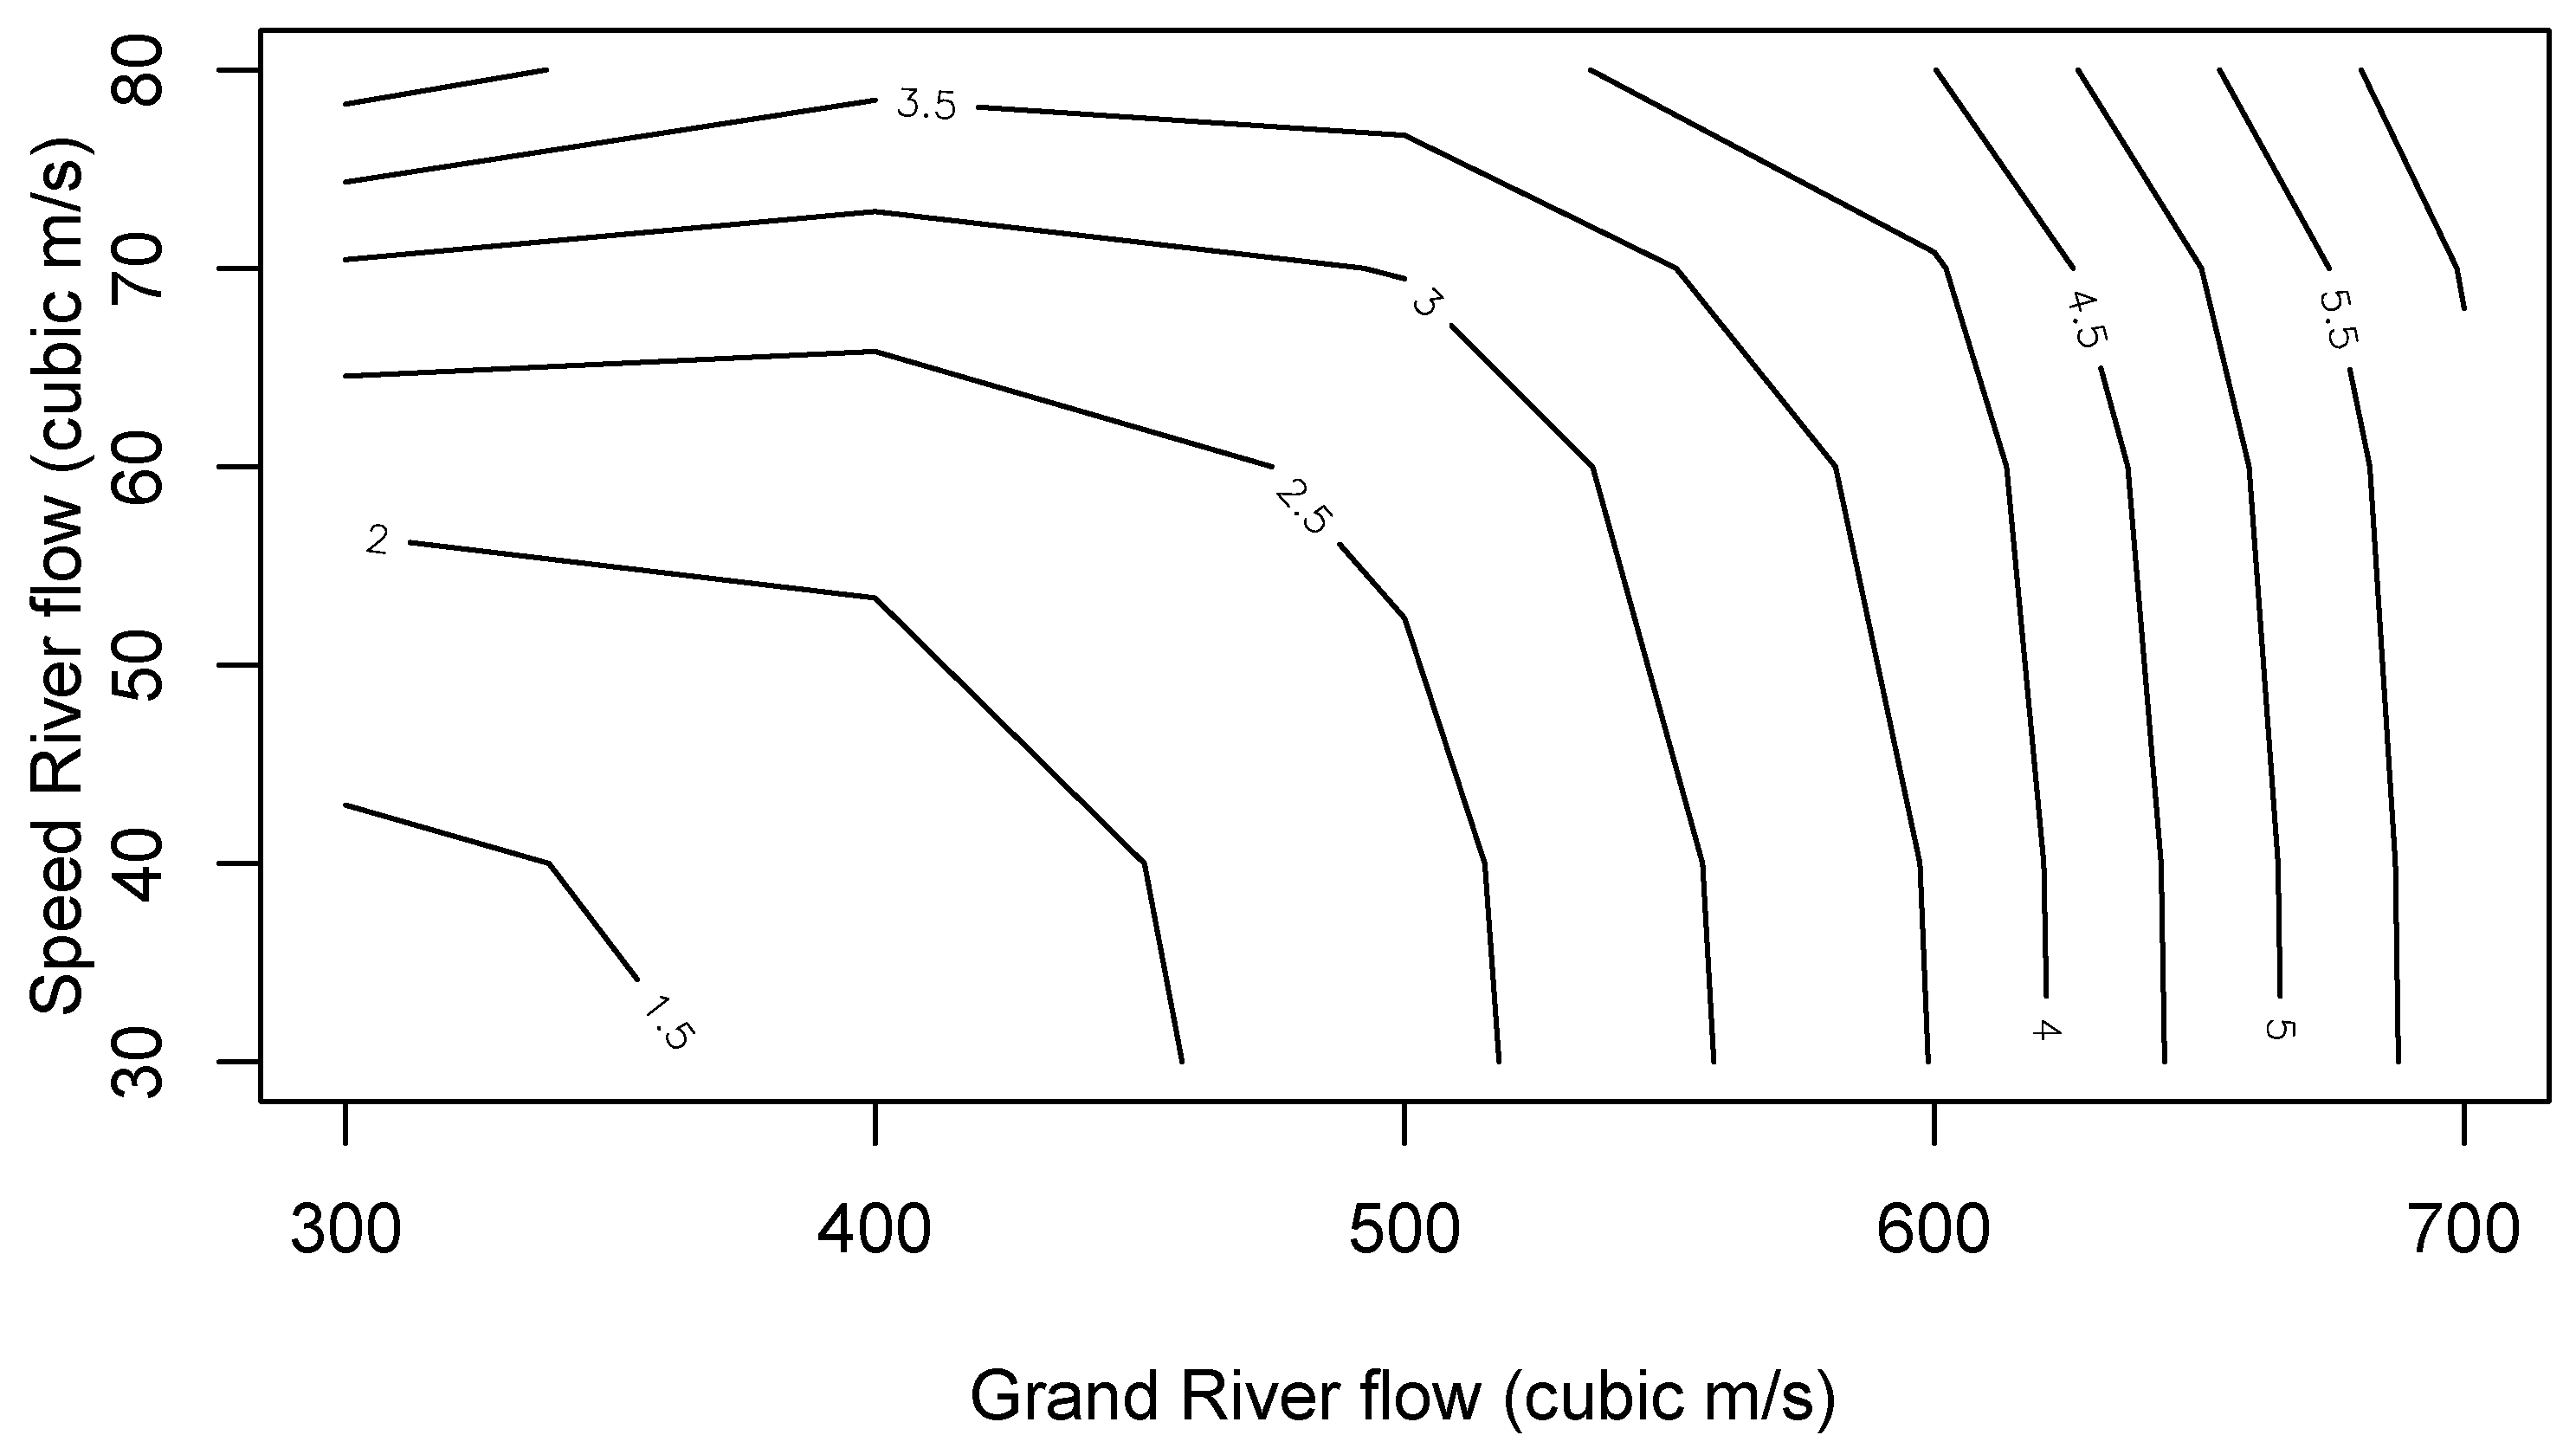
Figure 7.
Joint return period (OR) of the Speed and Grand Rivers flow extremes.

Figure 8.
Conditional return period of Speed River flow extremes given the Grand River flows.
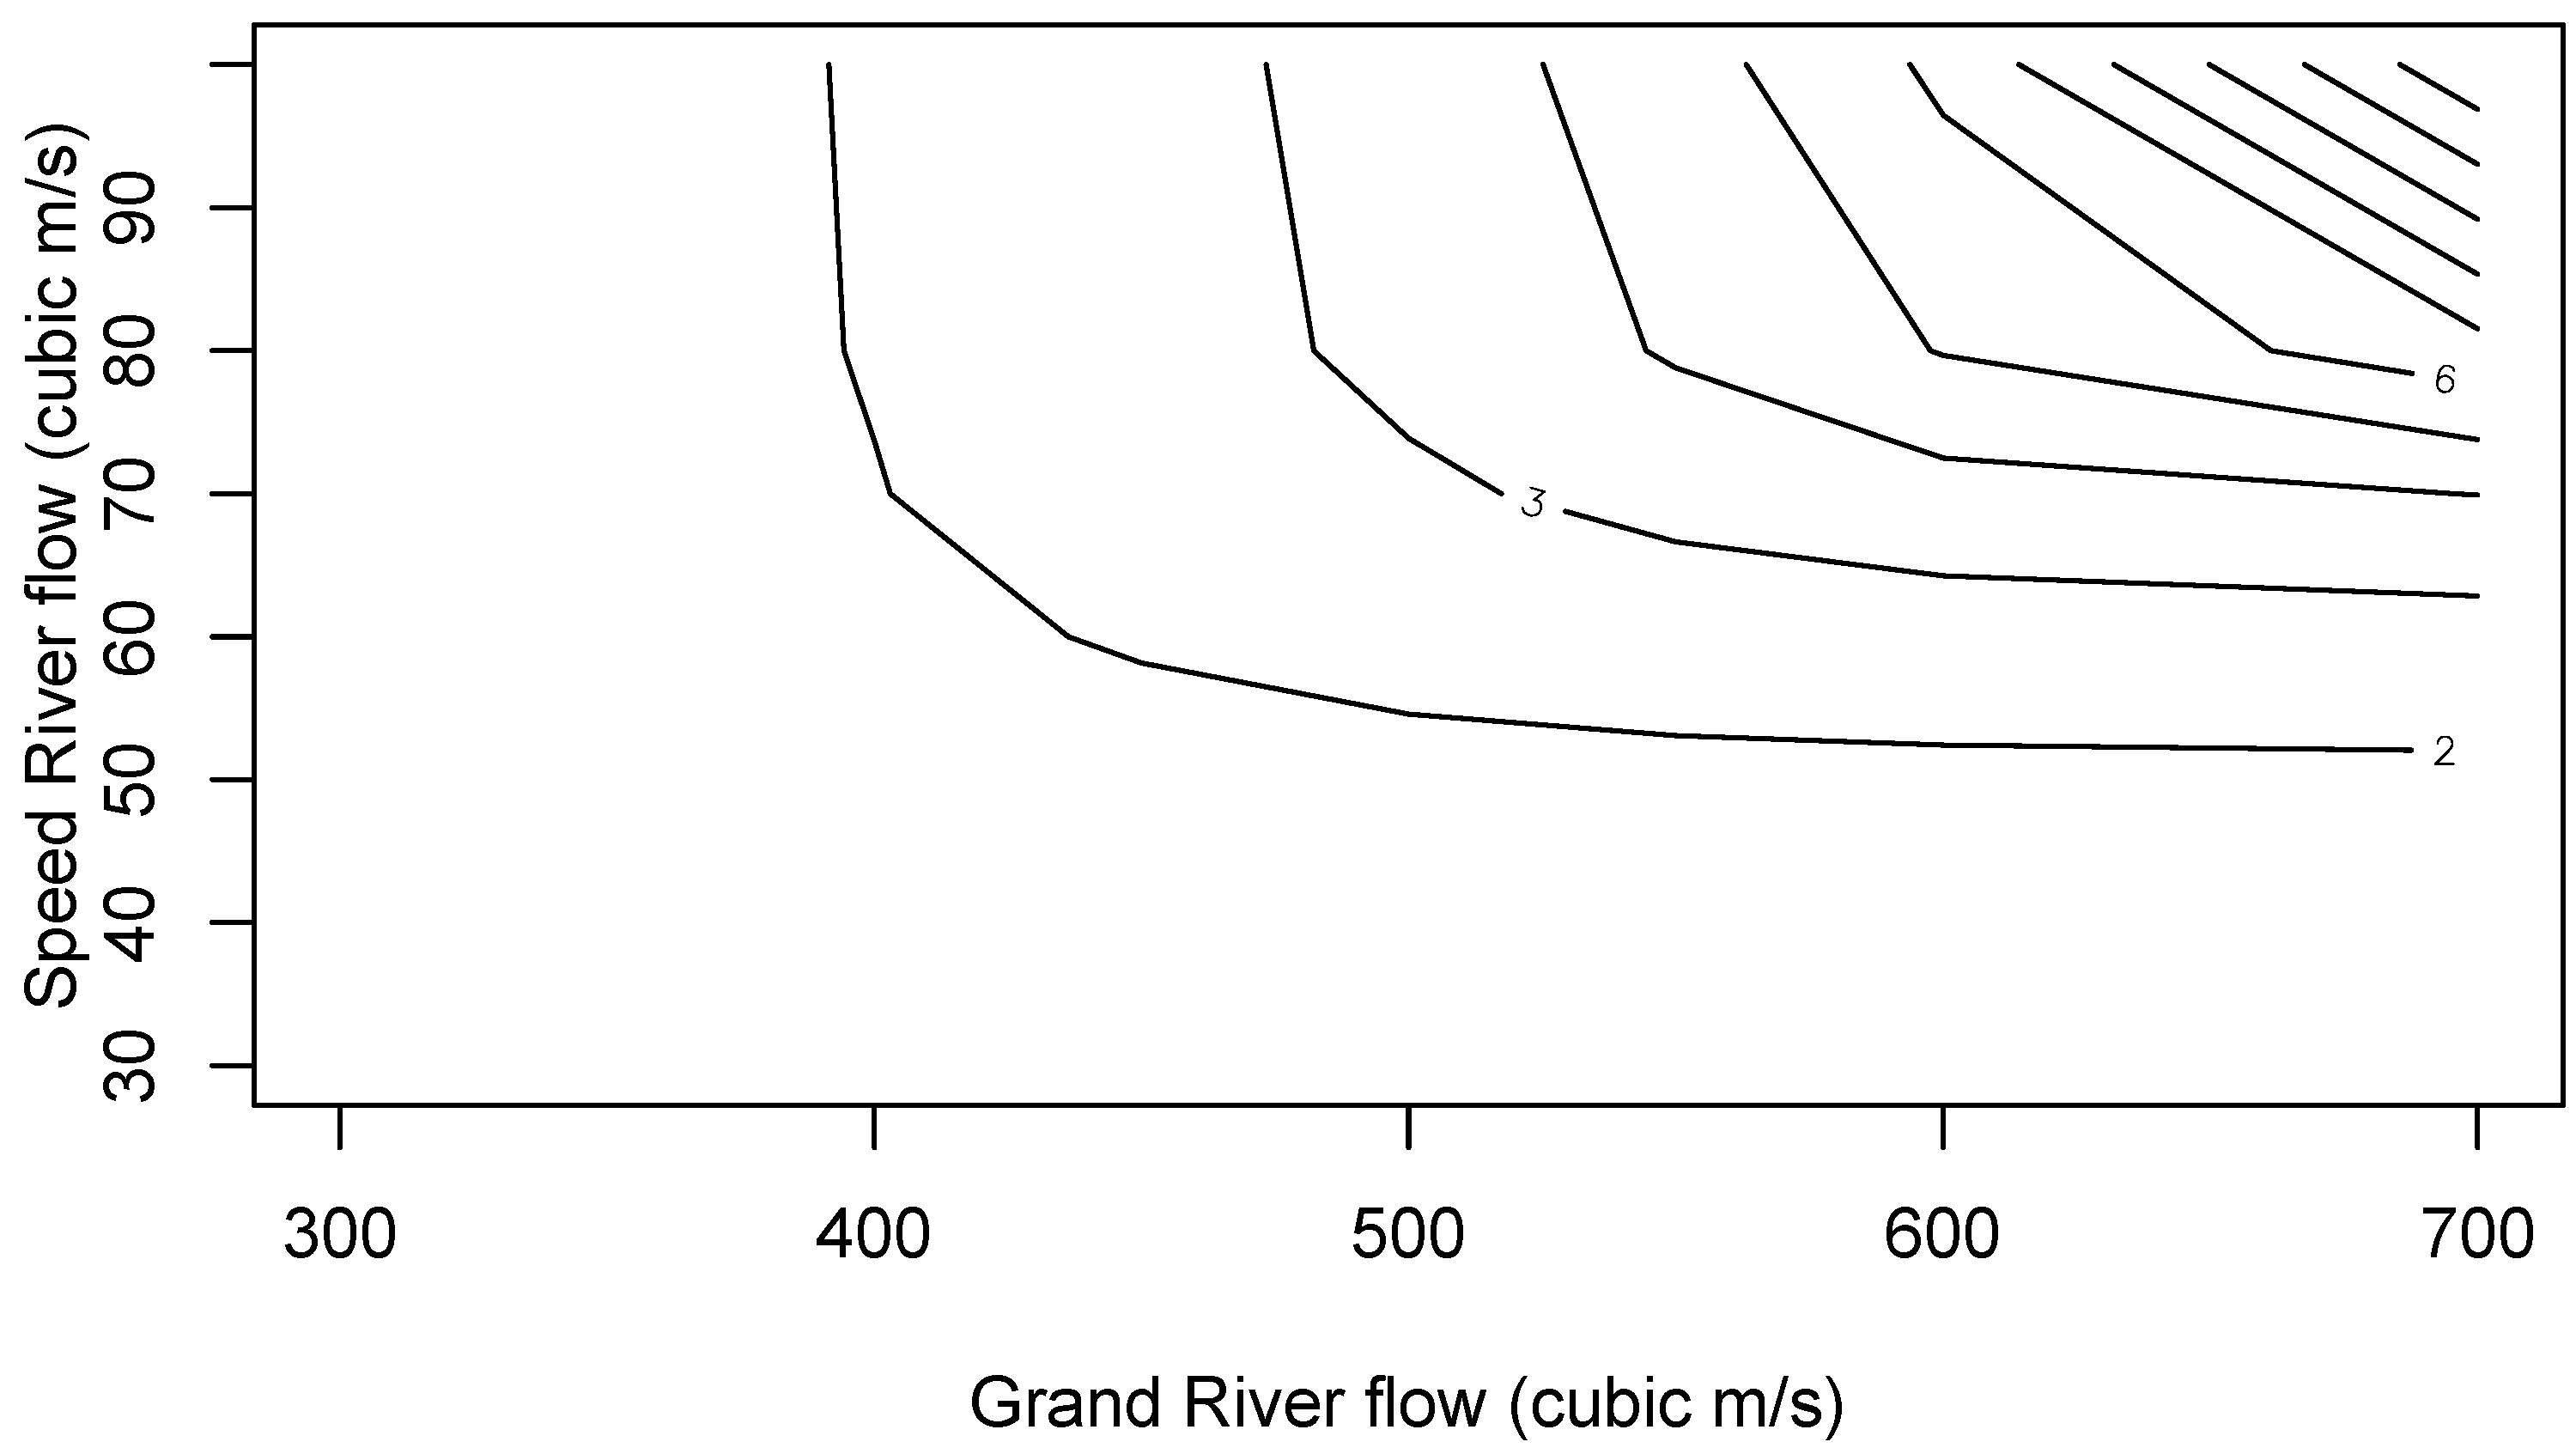
Figure 9.
The conditional return period of Grand River flow extremes given the Speed River flows.
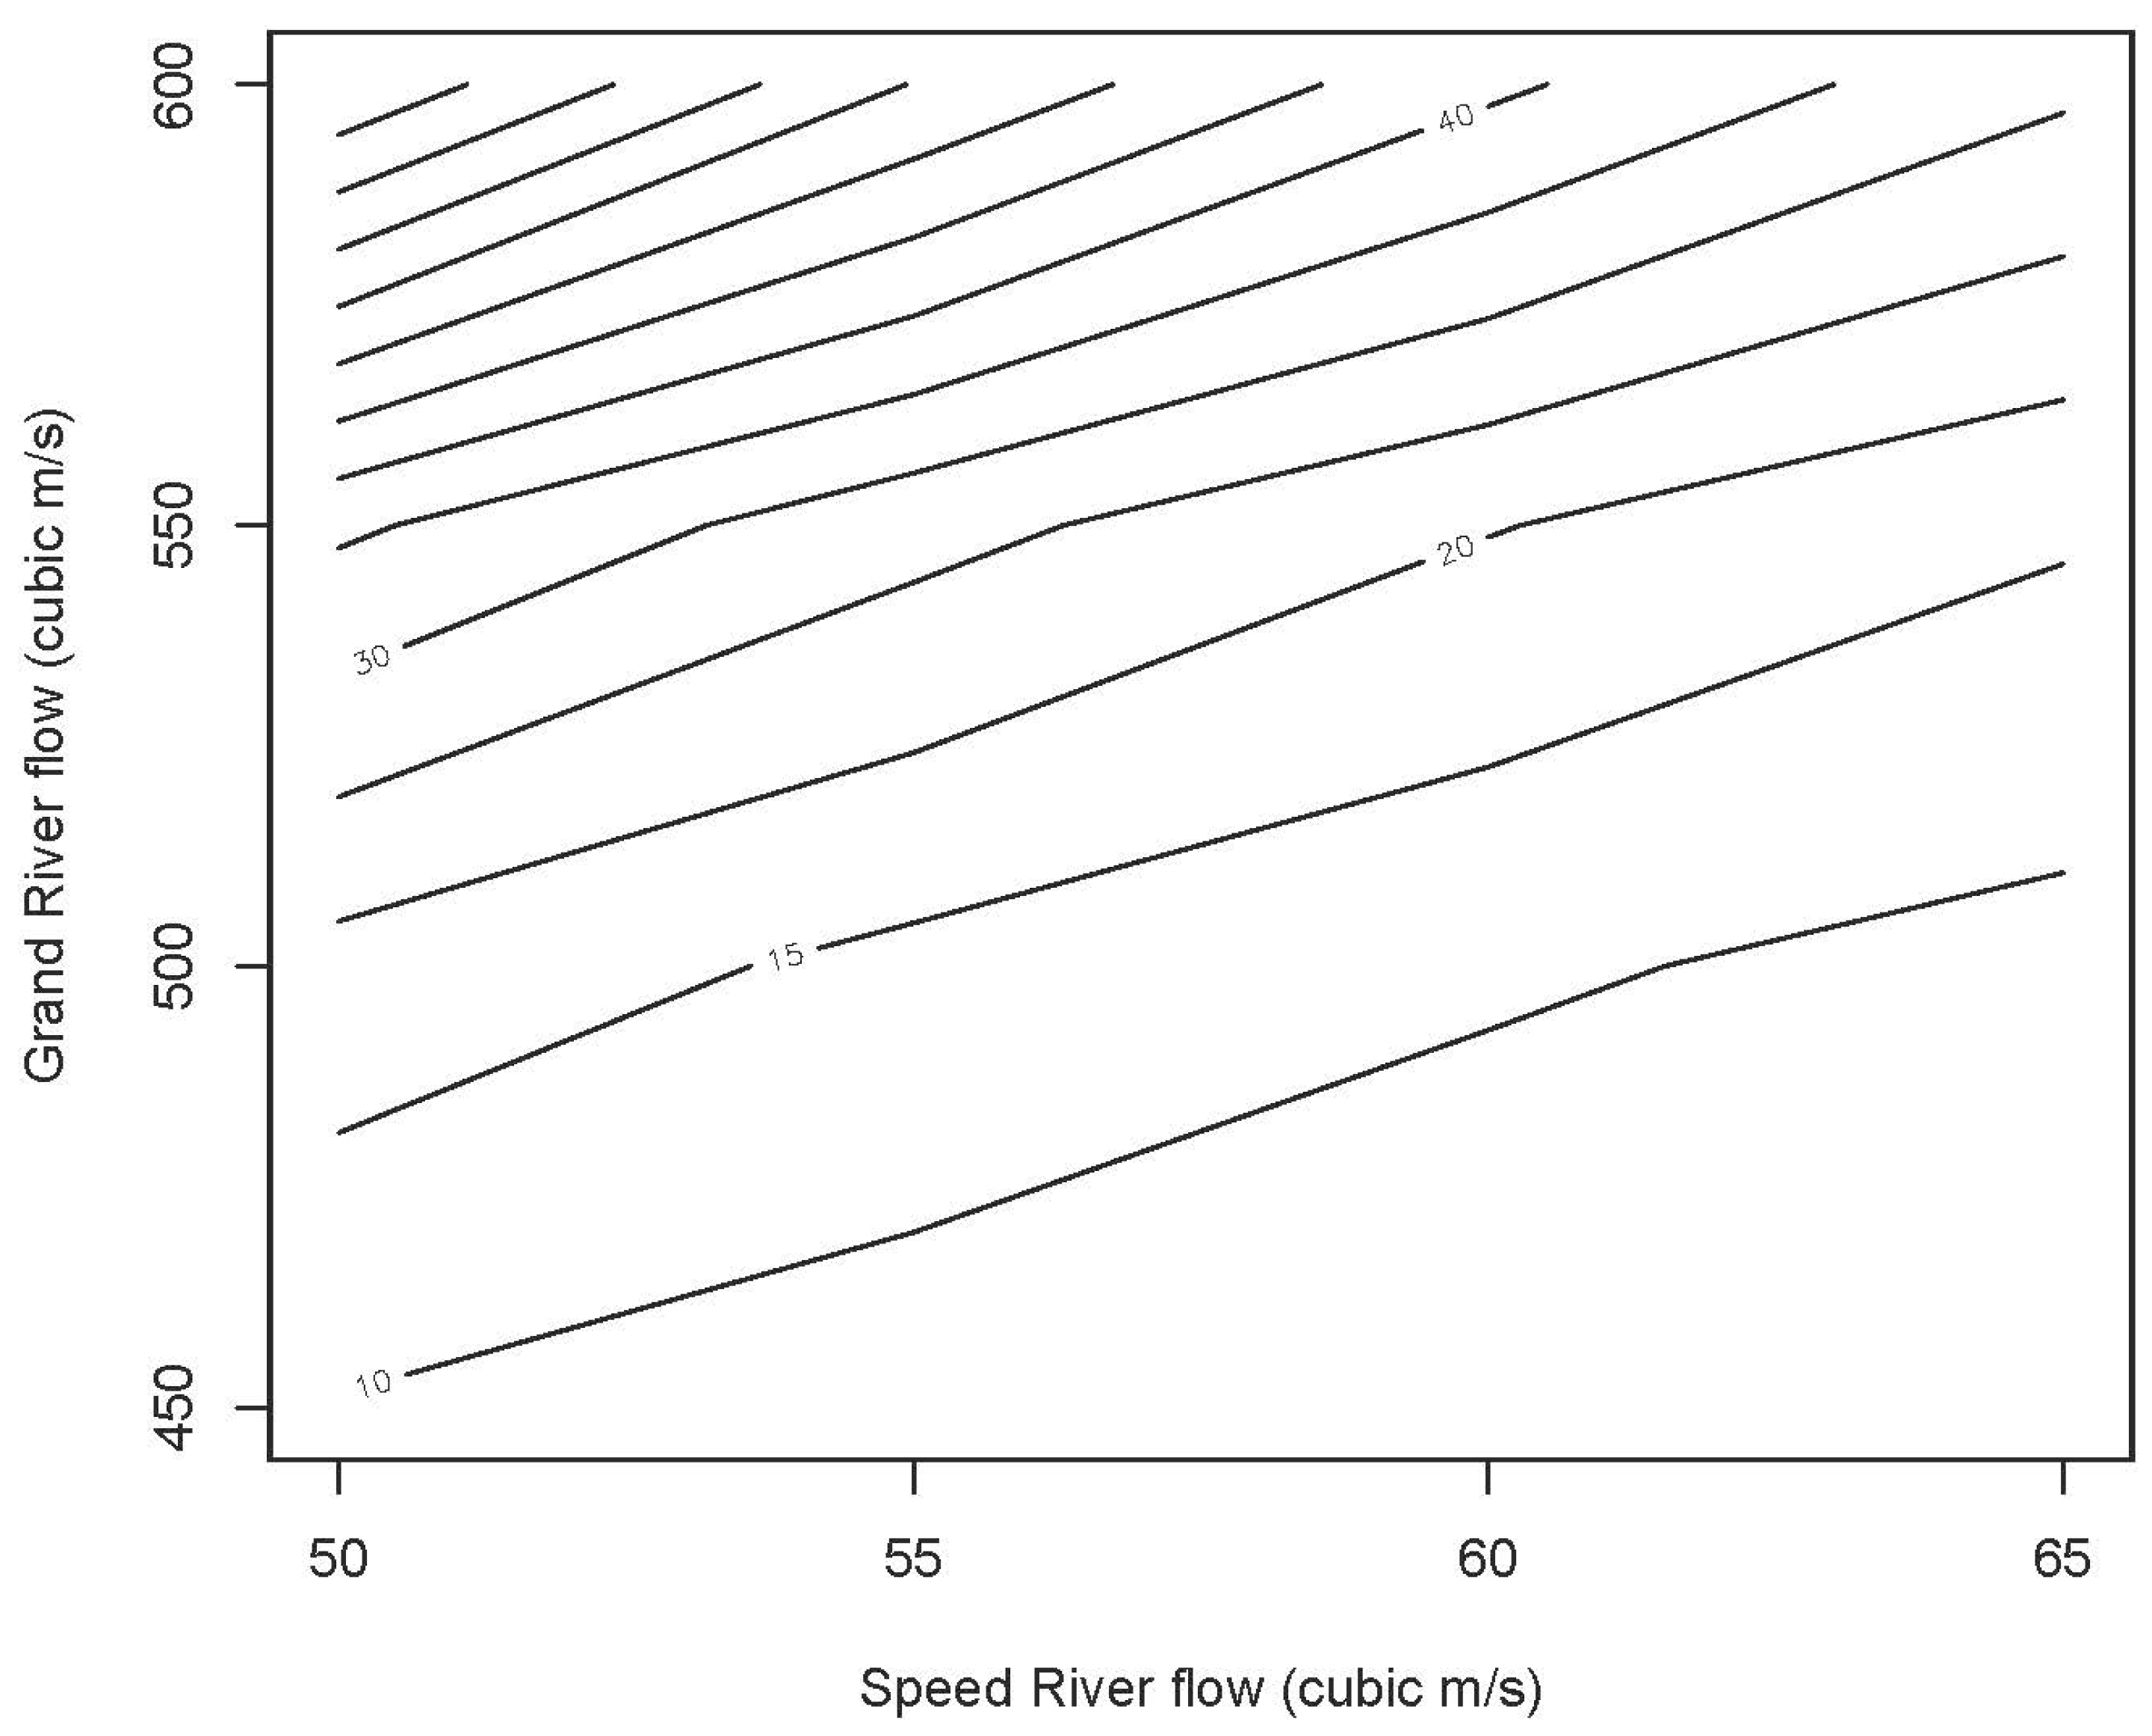
Figure 10.
Univariate return period of (a) Speed River flow and (b) Grand River flow.

Table 1.
Results of Goodness of fit test for the copula.
| Goodness of Fit Tests | p-Value | Test Statistic |
|---|---|---|
| Cramer-von Mises | 0.96 | 0.024 |
| Kolmogorov-Smirnov | 0.96 | 0.437 |
Table 2.
Bivariate and univariate return periods of Speed and Grand Rivers flow extremes.
| Speed Flow (m3/s) | Grand Flow (m3/s) | TAND (Year) | TOR (Year) | TS (Year) | TG (Year) |
|---|---|---|---|---|---|
| 52 | 420 | 2.8 | 1.7 | 2 | 2.2 |
| 65 | 518 | 5 | 2.7 | 3.2 | 3.8 |
| 77 | 607 | 9.5 | 4.7 | 6.1 | 6.5 |
| 90 | 700 | 20.7 | 10 | 15 | 12.2 |
Disclaimer/Publisher’s Note: The statements, opinions and data contained in all publications are solely those of the individual author(s) and contributor(s) and not of MDPI and/or the editor(s). MDPI and/or the editor(s) disclaim responsibility for any injury to people or property resulting from any ideas, methods, instructions or products referred to in the content. |
© 2023 by the authors. Licensee MDPI, Basel, Switzerland. This article is an open access article distributed under the terms and conditions of the Creative Commons Attribution (CC BY) license (https://creativecommons.org/licenses/by/4.0/).
Share and Cite
MDPI and ACS Style
Unnikrishnan, P.; Ponnambalam, K.; Agrawal, N.; Karray, F. Joint Flood Risks in the Grand River Watershed. Sustainability 2023, 15, 9203. https://doi.org/10.3390/su15129203
AMA Style
Unnikrishnan P, Ponnambalam K, Agrawal N, Karray F. Joint Flood Risks in the Grand River Watershed. Sustainability. 2023; 15(12):9203. https://doi.org/10.3390/su15129203
Chicago/Turabian StyleUnnikrishnan, Poornima, Kumaraswamy Ponnambalam, Nirupama Agrawal, and Fakhri Karray. 2023. "Joint Flood Risks in the Grand River Watershed" Sustainability 15, no. 12: 9203. https://doi.org/10.3390/su15129203
Note that from the first issue of 2016, this journal uses article numbers instead of page numbers. See further details here.