
Image Acquisition, Preprocessing and Classification of Citrus Fruit Diseases: A Systematic Literature Review

 ,
,  ,
,  and
and
Abstract
:1. Introduction
2. Systematic Literature Review
- The first step is identifying the need for the SLR.
- In the second step, research questions are formulated to answer the issues being addressed in the review.
- The third step designed is a search strategy comprised of two further steps, i.e., primary and secondary steps.
- The fourth step is to find relevant studies from the different resources relied upon to answer the research questions. The inclusion and exclusion criteria for screening the related studies are also included in this phase.
3. Need for SLR
3.1. Research Questions
- RQ1: Which kind of diseases affect citrus fruits?
- RQ2: Which techniques have been used to capture citrus fruits’ disease-related patterns?
- RQ3: Which techniques outperform other techniques in terms of classification accuracy?
- RQ4: Which hybrid techniques were used to detect citrus fruit diseases?
- RQ5: What evaluation metrics are commonly seen in studies for assessing techniques?
- RQ6: What evaluation metrics are commonly seen in studies for assessing techniques?
3.2. Search Strategy and Study Selection
- a.
- Primary searching;
- b.
- Secondary searching.
- IEEE Xplore;
- Scopus;
- Springer;
- Science Direct;
- Wiley;
- Google Scholar;
- ACM Digital Library.
3.3. Quality Assessment Criteria
- Q1. Are the goals of the study explicitly stated?
- Q2. Are the techniques of analysis well-established and reasoned?
- Q3. Are the experiments implemented with adequate datasets?
- Q4. Is the experiment extended to dataset(s) processed with images?
- Q5. Are the findings and outcomes explicitly stated?
- 0 (No);
- 1 (Rarely);
- 2 (Partly);
- 3 (Mostly);
- 4 (Yes).
- 0–1.5 (no);
- 1.6–3.5 (moderate);
- 3.6–5.0 (yes).
3.4. Data Extraction and Data Synthesis
4. Results and Discussion
- RQ1: What kinds of diseases affect citrus fruits?
- RQ2: Which techniques have been used to capture citrus fruits’ disease-related patterns?
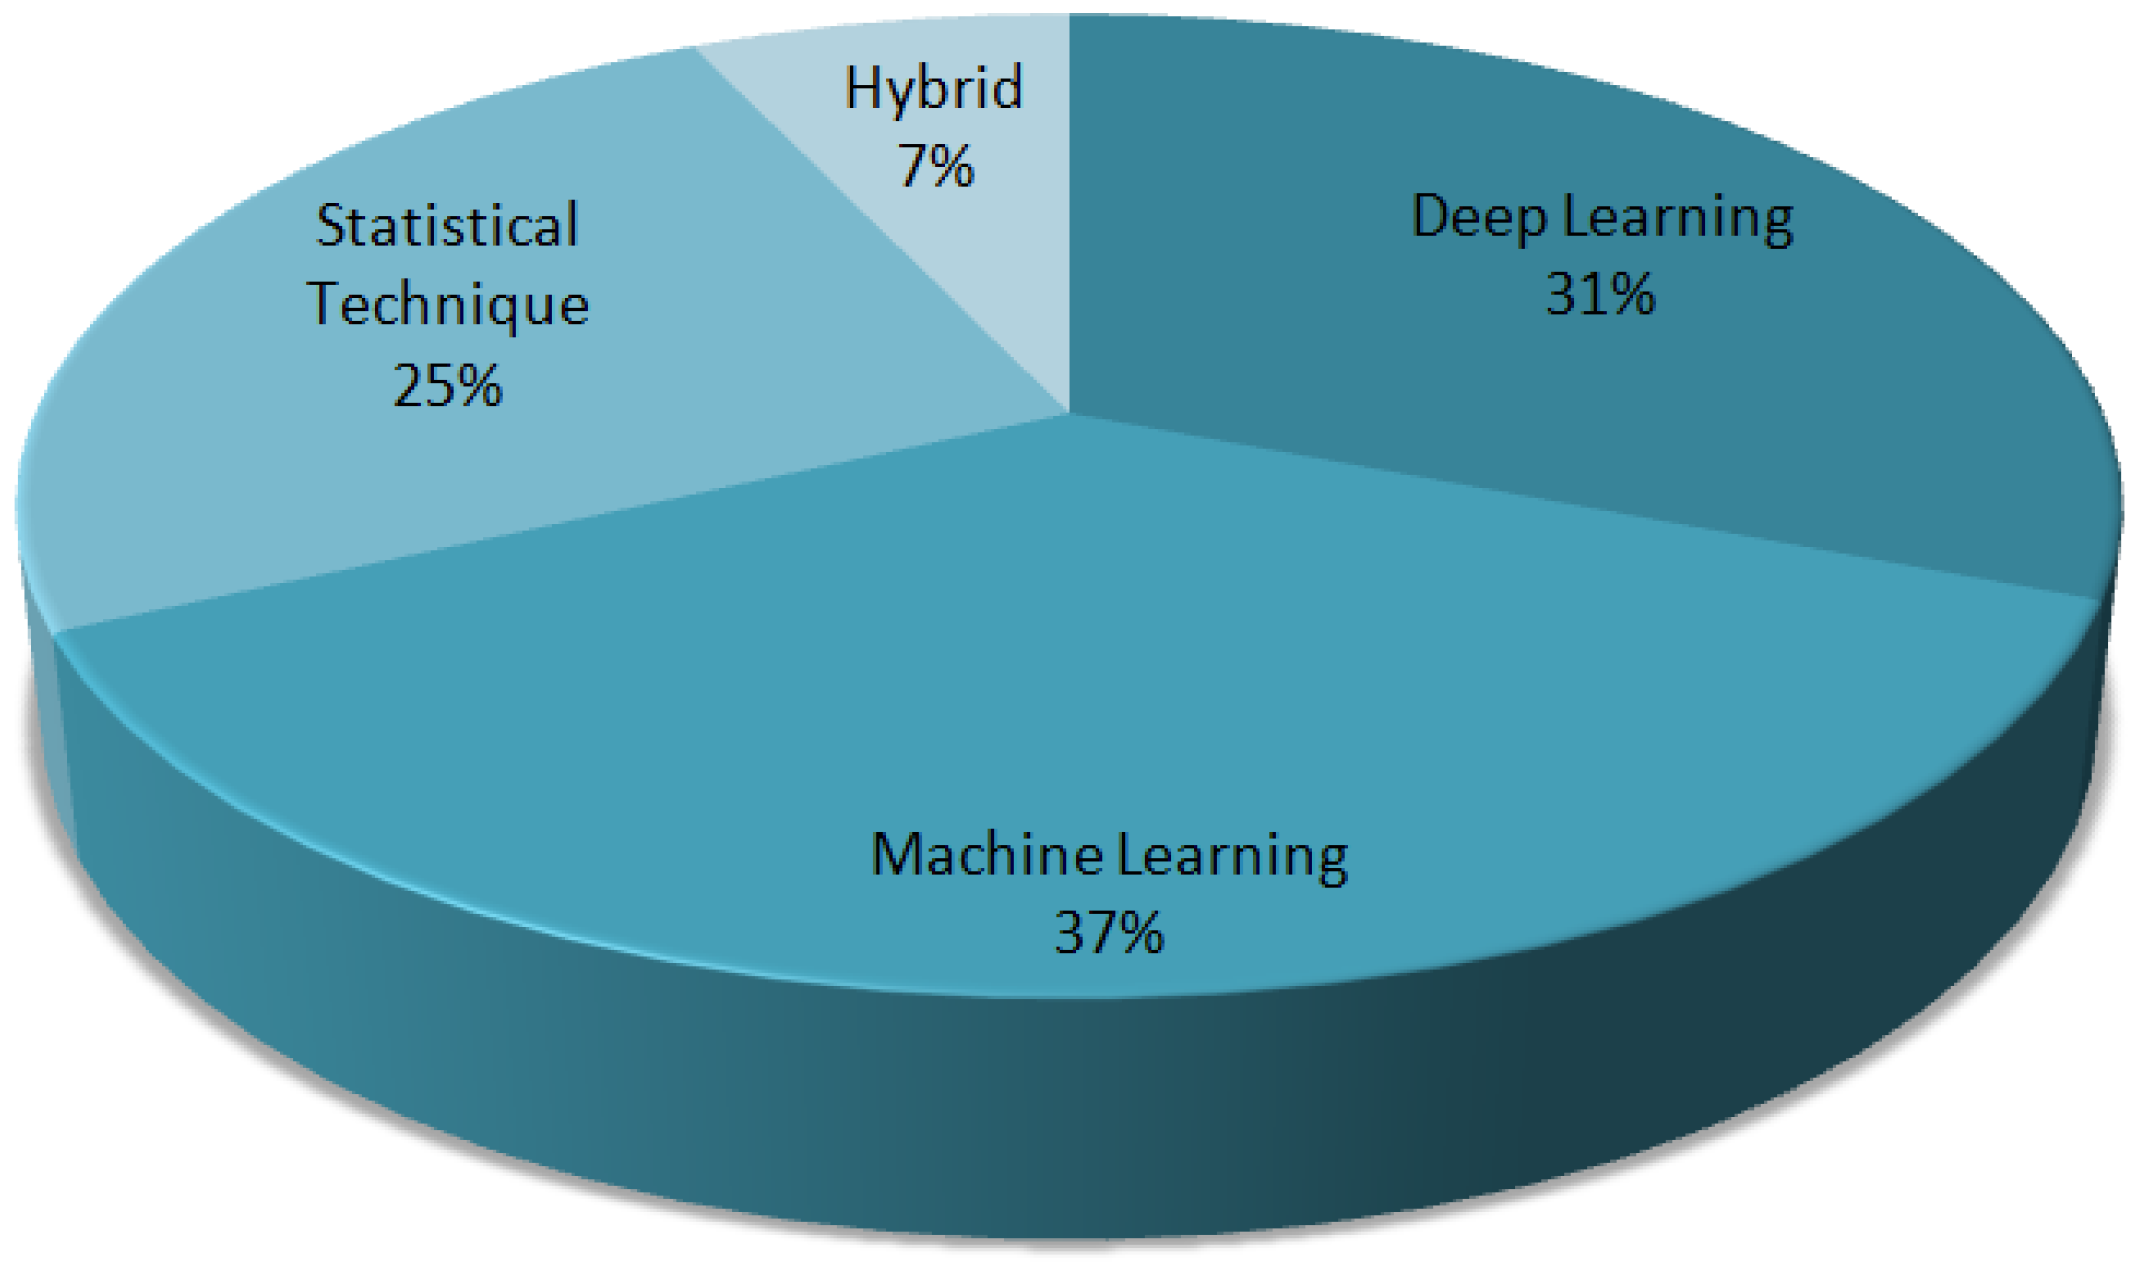
- Machine learning;
- Deep learning;
- Statistical techniques.
- Deep learning models used for capturing disease-related patterns of citrus fruits.
- Artificial neural networks (ANN);
- Convolution neural networks (CNN);
- Probabilistic neural networks (PNN);
- Multilayer perceptrons (MLP);
- Associative neural networks (AANN);
- Radial basis probabilistic neural networks (RBPNN);
- Back propagation neural network (BPNN).
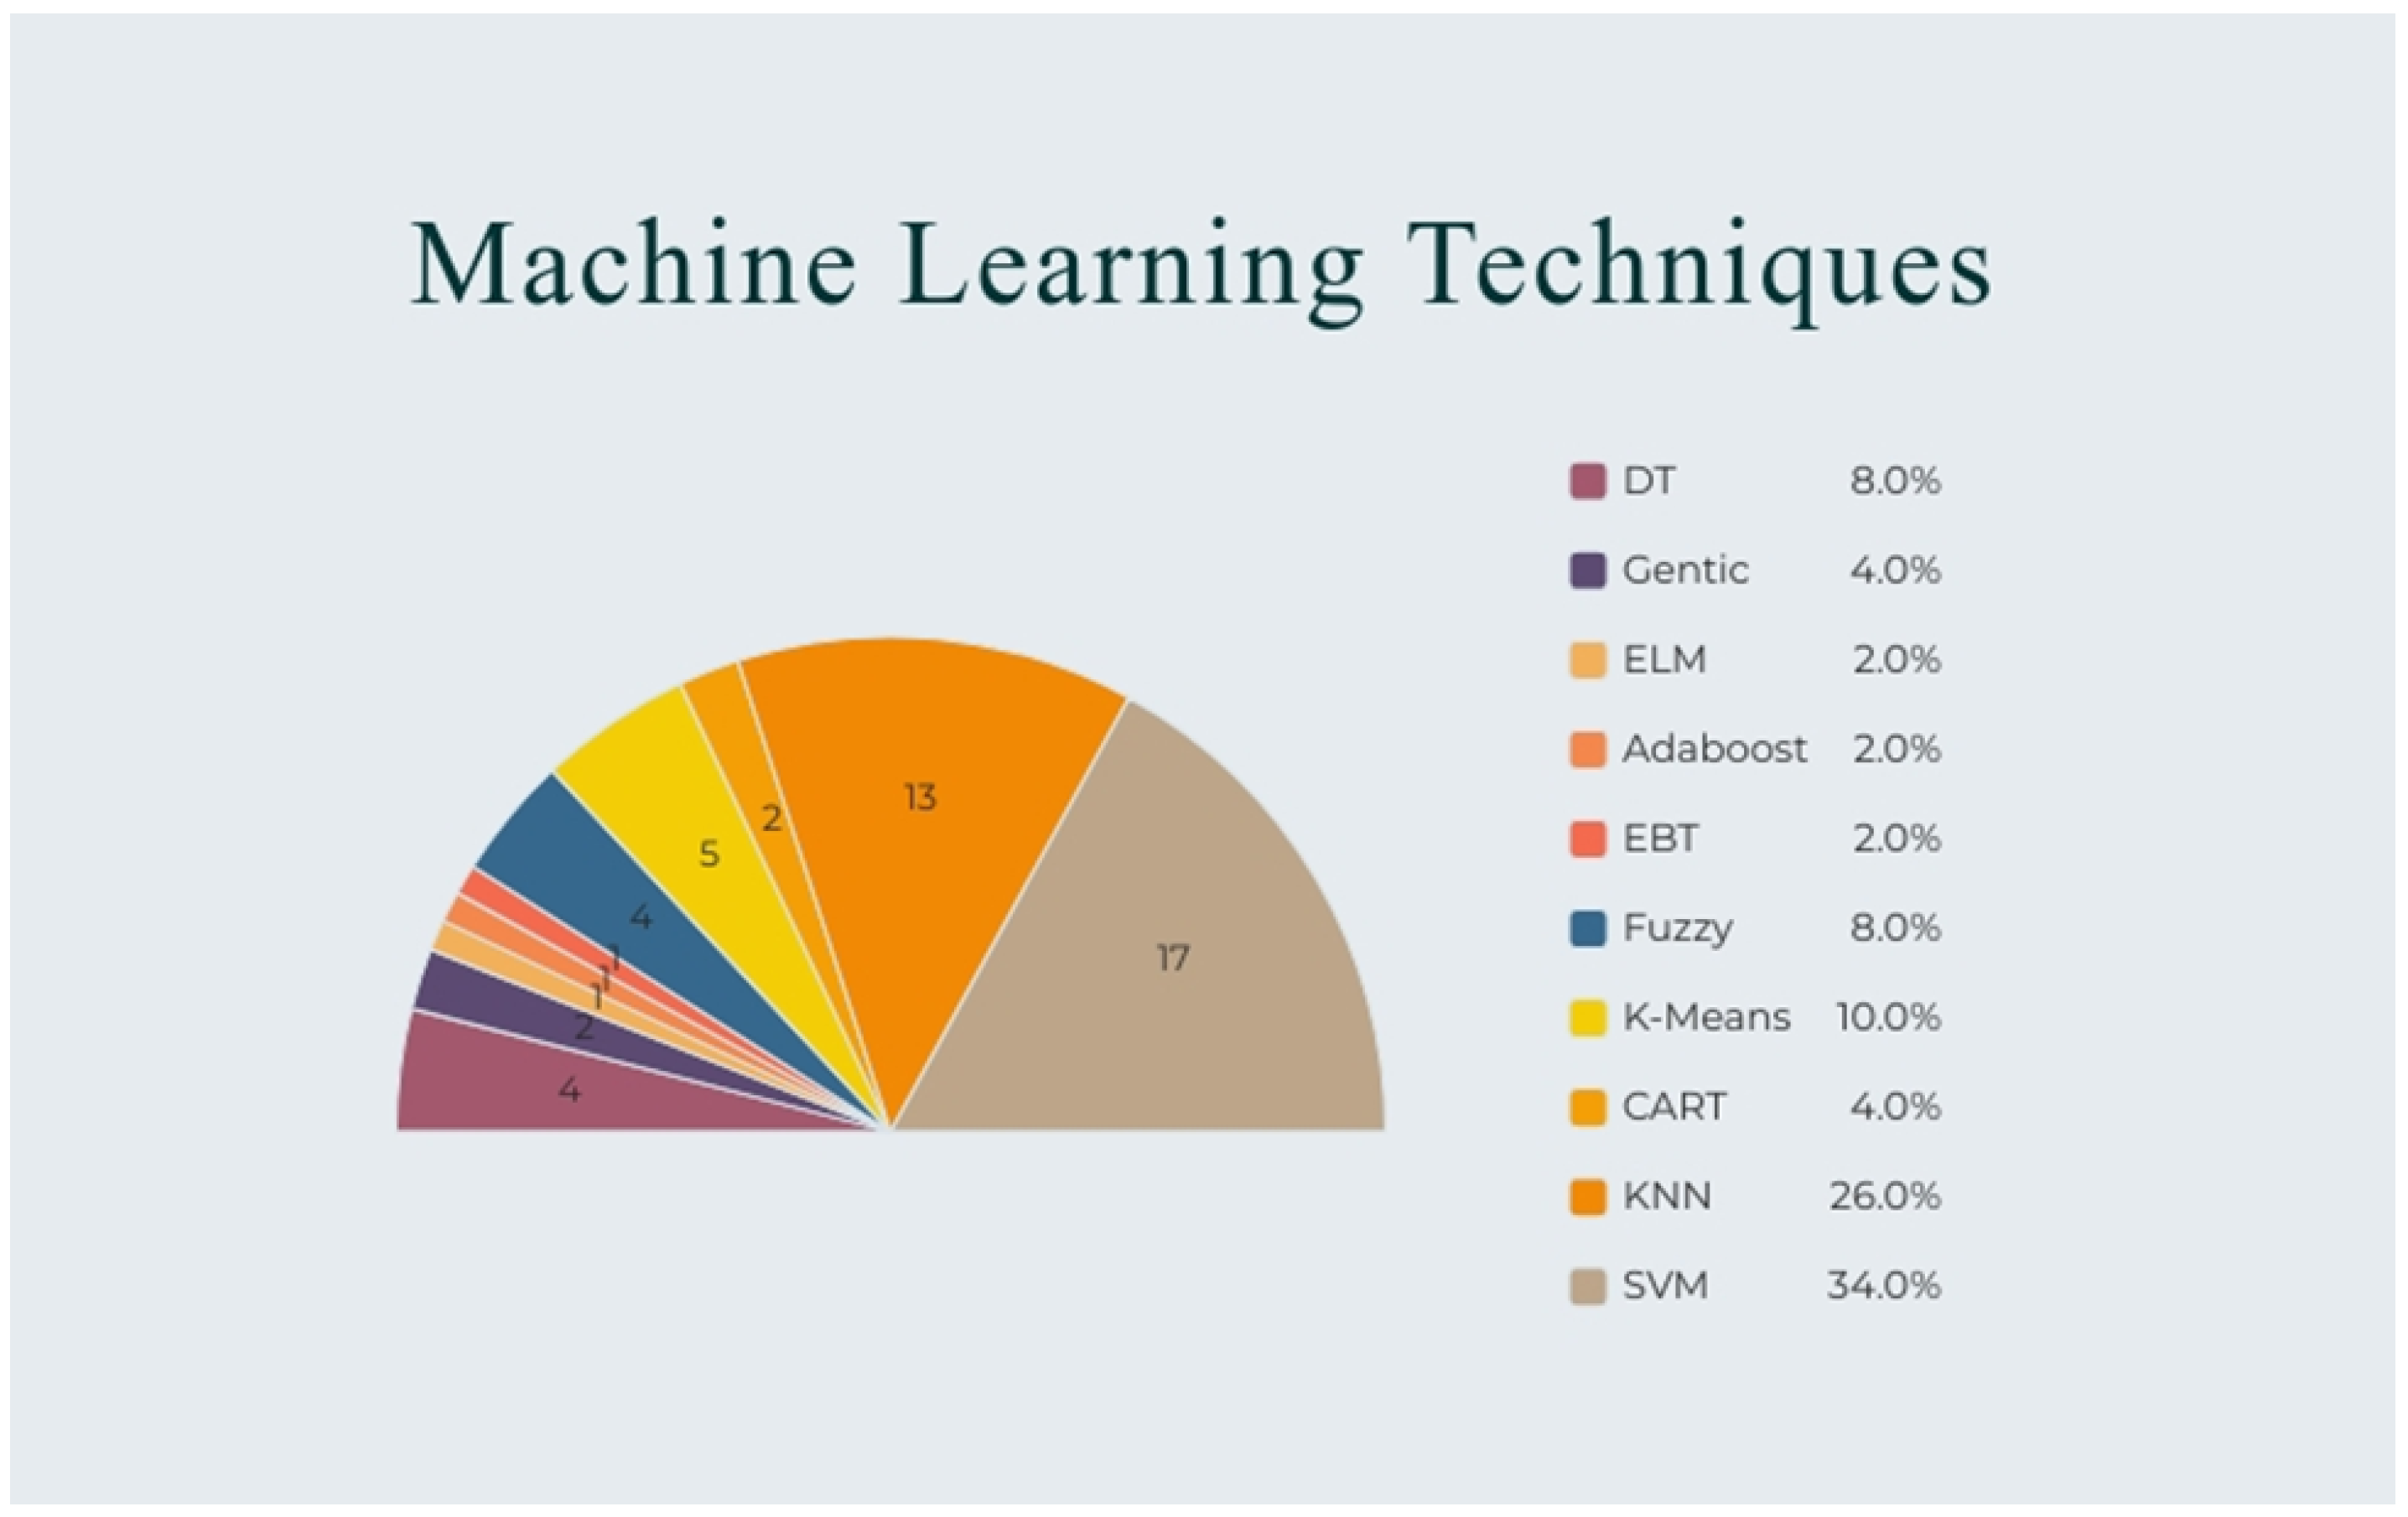
- Machine learning models used for capturing disease-related patterns of citrus fruit
- Support vector machines (SVM);
- Bayesian networks (BN);
- K-nearest neighbors (KNNs);
- Decision trees (DT);
- Genetic programming (GP);
- Classification and regression tree (CART);
- Naïve Bayes;
- Random forest (RF);
- K-means clustering;
- Fuzzy;
- Extreme learning machine (ELM);
- Ensemble learning (Adaboost);
- Ensemble boosted tree (EBT).
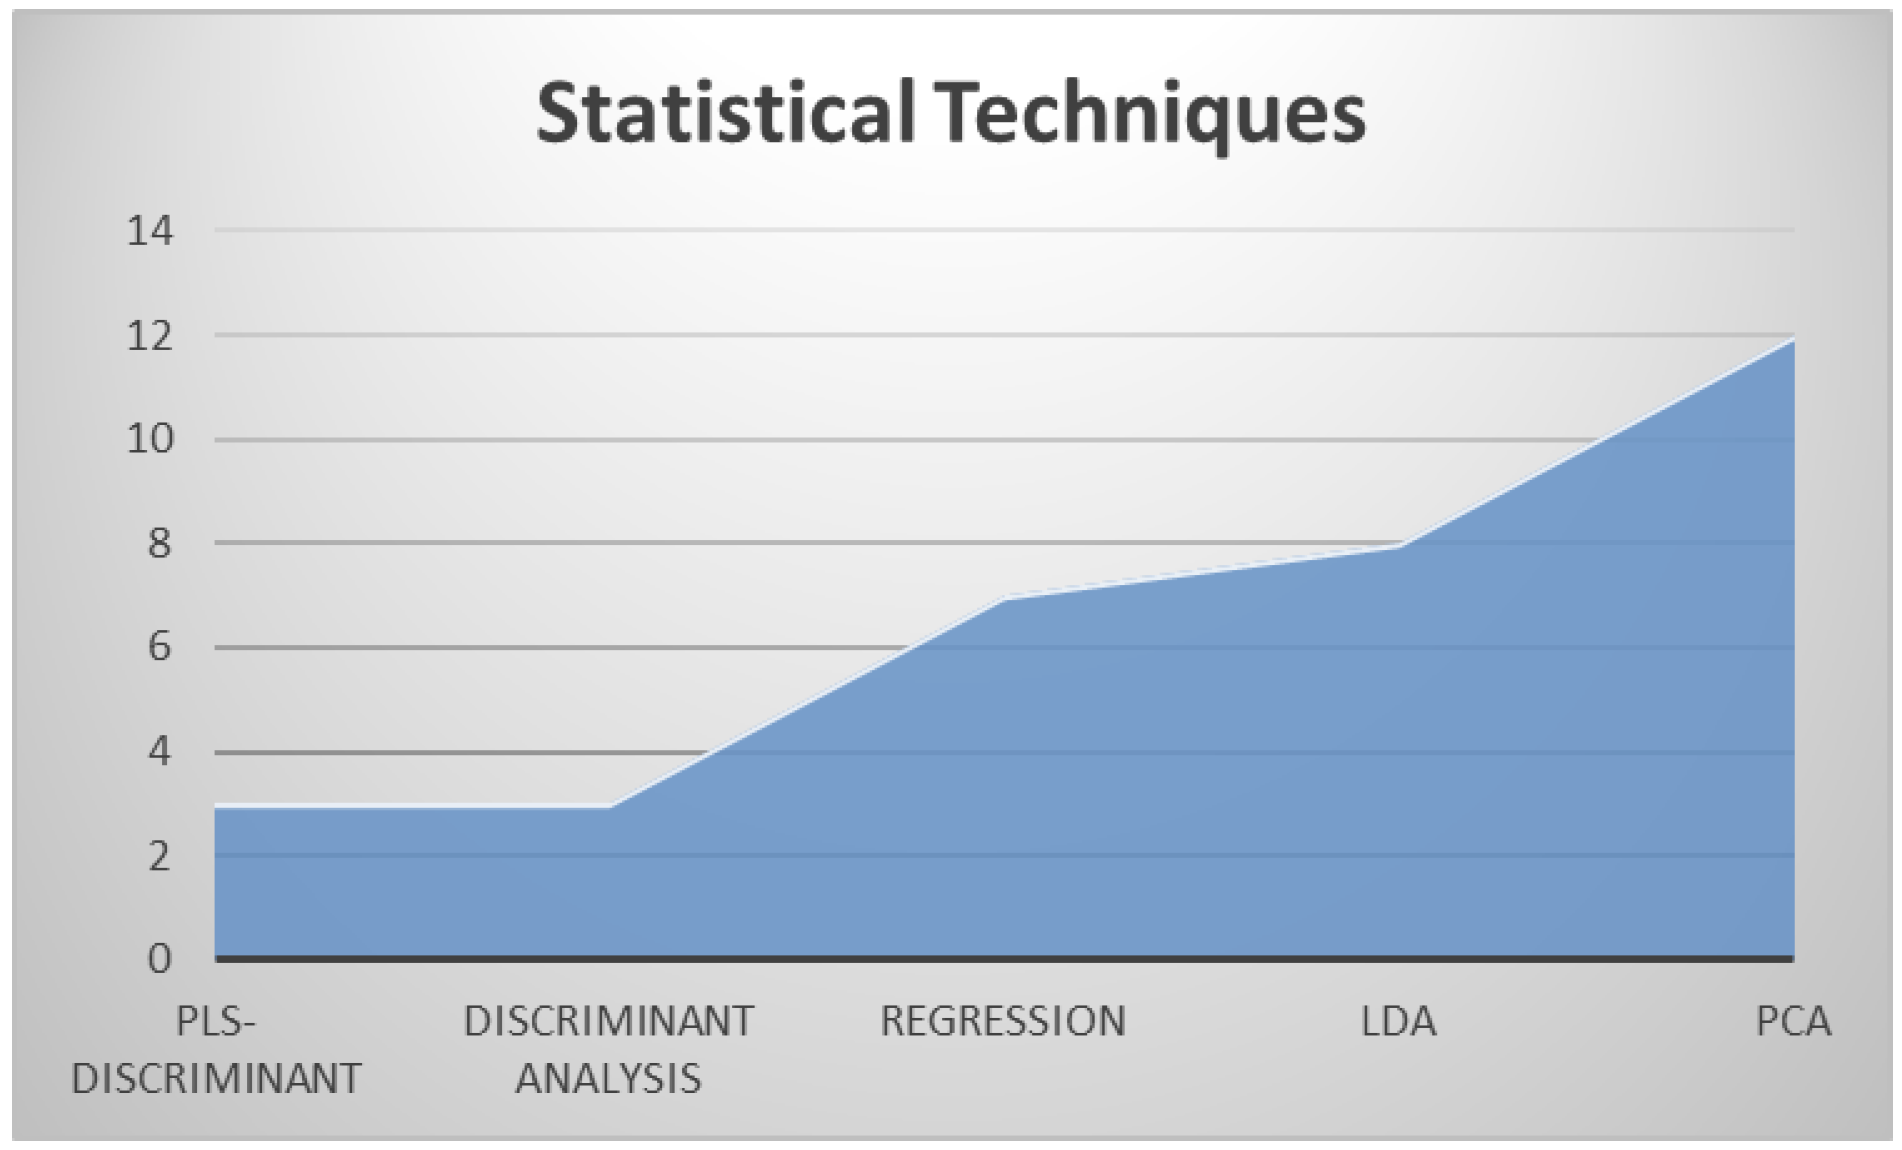
- Statistical techniques used for capturing disease-related patterns in citrus fruits.
- PLS-discriminant;
- Discriminant analysis;
- Regression;
- Decision tree (LDA);
- Principal component analysis (PCA).
- RQ3: Which techniques outperform other techniques in terms of classification accuracy?
- RQ4: Which hybrid techniques were used to classify citrus fruit diseases?
- RQ5: Which features are to be extracted to classify citrus fruit diseases?
- RQ6: What evaluation metrics are commonly seen in studies for assessing techniques?
5. Summary and Findings
6. Limitations
7. Conclusions
Author Contributions
Funding
Conflicts of Interest
References
- Gulzar, Y.; Hamid, Y.; Soomro, A.B.; Alwan, A.A.; Journaux, L. A convolution neural network-based seed classification system. Symmetry 2020, 12, 2018. [Google Scholar] [CrossRef]
- Albarrak, K.; Gulzar, Y.; Hamid, Y.; Mehmood, A.; Soomro, A.B. A deep learning-based model for date fruit classification. Sustainability 2022, 14, 6339. [Google Scholar] [CrossRef]
- Aggarwal, S.; Gupta, S.; Gupta, D.; Gulzar, Y.; Juneja, S.; Alwan, A.A.; Nauman, A. An Artificial Intelligence-Based Stacked Ensemble Approach for Prediction of Protein Subcellular Localization in Confocal Microscopy Images. Sustainability 2023, 15, 1695. [Google Scholar] [CrossRef]
- Mamat, N.; Othman, M.F.; Abdulghafor, R.; Alwan, A.A.; Gulzar, Y. Enhancing Image Annotation Technique of Fruit Classification Using a Deep Learning Approach. Sustainability 2023, 15, 901. [Google Scholar] [CrossRef]
- Malhotra, R.; Chug, A. Software Maintainability: Systematic Literature Review and Current Trends. Int. J. Softw. Eng. Knowl. Eng. 2016, 26, 1221–1253. [Google Scholar] [CrossRef]
- Kitchenham, B.; Brereton, O.; Budgen, D.; Turner, M.; Bailey, J.; Linkman, S. Systematic literature reviews in software engineering—A systematic literature review. Inf. Softw. Technol 2009, 51, 7–15. [Google Scholar] [CrossRef]
- Malhotra, R.; Lata, K. A systematic literature review on empirical studies towards prediction of software maintainability. Soft. Comput. 2020, 24, 16655–16677. [Google Scholar] [CrossRef]
- Marcos-Pablos, S.; García-Peñalvo, F.J. Decision support tools for SLR search string construction. In Proceedings of the Sixth International Conference on Technological Ecosystems for Enhancing Multiculturality (TEEM’18), Salamanca, Spain, 24–26 October 2018; pp. 660–667. [Google Scholar]
- Ali, A.; Gravino, C. A systematic literature review of software effort prediction using machine learning methods. J. Softw. Evol. Process 2019, 31, 1–25. [Google Scholar] [CrossRef]
- Malhotra, R. A systematic review of machine learning techniques for software fault prediction. Appl. Soft Comput. J. 2015, 27, 504–518. [Google Scholar] [CrossRef]
- Ramesh, T.; Vijayaragavan, M.; Poongodi, M.; Hamdi, M.; Wang, H.; Bourouis, S. Peer-to-peer trust management in intelligent transportation system: An Aumann’s agreement theorem based approach. ICT Express 2022, 8, 340–346. [Google Scholar]
- Sahoo, S.K.; Mudligiriyappa, N.; Algethami, A.A.; Manoharan, P.; Hamdi, M.; Raahemifar, K. Intelligent Trust-Based Utility and Reusability Model: Enhanced Security Using Unmanned Aerial Vehicles on Sensor Nodes. Appl. Sci. 2022, 12, 1317. [Google Scholar] [CrossRef]
- Poongodi, M.; Malviya, M.; Hamdi, M.; Vijayakumar, V.; Mohammed, M.A.; Rauf, H.T.; Al-Dhlan, K.A. 5G based Blockchain network for authentic and ethical keyword search engine. IET Commun. 2021, 16, 442–448. [Google Scholar]
- Poongodi, M.; Malviya, M.; Kumar, C.; Hamdi, M.; Vijayakumar, V.; Nebhen, J.; Alyamani, H. New York City taxi trip duration prediction using MLP and XGBoost. Int. J. Syst. Assur. Eng. Manag. 2021, 13, 16–27. [Google Scholar] [CrossRef]
- Poongodi, M.; Nguyen, T.N.; Hamdi, M.; Cengiz, K. Global cryptocurrency trend prediction using social media. Inf. Process. Manag. 2021, 58, 102708. [Google Scholar]
- Soini, C.T.; Abid, M.R. Citrus Greening Infection Detection (CiGID) by Computer Vision and Deep Learning. In Proceedings of the 3rd International Conference on Information System and Data Mining, Houston, TX, USA, 6–8 April 2019; pp. 21–26. [Google Scholar]
- Behera, S.K.; Jena, L.; Rath, A.K.; Sethy, P.K. Disease Classification and Grading of Orange Using Machine Learning and Fuzzy Logic. In Proceedings of the 2018 IEEE International Conference on Communication and Signal Processing, Chennai, India, 3–5 April 2018; pp. 678–682. [Google Scholar]
- Khoje, S.A.; Bodhe, S.K.; Adsul, A. Automated Skin Defect Identification System for Fruit Grading Based on Discrete Curvelet Transform. Int. J. Eng. Technol. 2013, 5, 3251–3256. [Google Scholar]
- Kamalakannan, A.; Rajamanickam, G. Surface defect detection and classification in mandarin fruits using fuzzy image thresholding, binary wavelet transform and linear classifier model. In Proceedings of the 4th International Conference on Advanced Computing, Chennai, India, 13–15 December 2012; pp. 1–6. [Google Scholar]
- Khan, A.M.; Paplinski, A.P. Blemish detection in citrus fruits. In Proceedings of the SPIT-IEEE Colloquium and International Conference, Mumbai, India, 4–5 February 2008; Volume 1, pp. 262–271. [Google Scholar]
- Lorente, D.; Escandell-Montero, P.; Cubero, S.; Gómez-Sanchis, J.; Blasco, J. Visible-NIR reflectance spectroscopy and manifold learning methods applied to the detection of fungal infections on citrus fruit. J. Food Eng. 2015, 163, 17–24. [Google Scholar] [CrossRef]
- Miller, W.M. Optical defect analysis of Florida citrus. Appl. Eng. Agric. 1995, 11, 855–860. [Google Scholar] [CrossRef]
- Lan, Y. Comparison of machine learning methods for citrus greening detection on UAV multispectral images. Comput. Electron. Agric. 2020, 171, 105234. [Google Scholar] [CrossRef]
- Capizzi, G.; Lo, G.; Sciuto, C.; Napoli, E.; Tramontana, M.; Wozniak, M. Automatic classification of fruit defects based on Co-occurrence matrix and neural networks. In Proceedings of the Federated Conference on Computer Science and Information Systems, Lodz, Poland, 13–16 September 2015; pp. 861–867. [Google Scholar]
- Gómez-Sanchis, J. Hyperspectral LCTF-based system for classification of decay in mandarins caused by Penicillium digitatum and Penicillium italicum using the most relevant bands and non-linear classifiers. Postharvest Biol. Technol. 2013, 82, 76–86. [Google Scholar] [CrossRef]
- Bulanon, D.M.; Burks, T.F.; Kim, D.G.; Ritenour, M.A. Citrus black spot detection using hyperspectral image analysis. Agric. Eng. Int. CIGR J. Open 2013, 15, 171–180. [Google Scholar]
- Stegmayer, G.; Milone, D.H.; Garran, S.; Burdyn, L. Automatic recognition of quarantine citrus diseases. Expert Syst. Appl. 2013, 40, 3512–3517. [Google Scholar] [CrossRef] [Green Version]
- Choi, D.; Lee, W.S.; Schueller, J.K.; Ehsani, R.; Roka, F.; Diamond, J. A performance comparison of RGB, NIR, and depth images in immature citrus detection using deep learning algorithms for yield prediction. In Proceedings of the 2017 ASABE Annual International Meeting, Spokane, WA, USA, 16–19 July 2017; pp. 1–6. [Google Scholar]
- Rahmanian, A.; Mireei, S.A.; Sadri, S.; Gholami, M.; Nazeri, M. Application of biospeckle laser imaging for early detection of chilling and freezing disorders in orange. Postharvest. Biol. Technol. 2020, 162, 111118. [Google Scholar] [CrossRef]
- Capizzi, G.; Lo, G.; Sciuto, C.; Napoli, E.; Tramontana, M.; Woźniak, M. A novel neural networks-based texture image processing algorithm for orange defects classification. Int. J. Comput. Sci. Appl. 2016, 13, 45–60. [Google Scholar]
- Gómez-Sanchis, J.; Martín-Guerrero, J.D.; Soria-Olivas, E.; Martínez-Sober, M.; Magdalena-Benedito, R.; Blasco, J. Detecting rottenness caused by Penicillium genus fungi in citrus fruits using machine learning techniques. Expert Syst. Appl. 2012, 39, 780–785. [Google Scholar] [CrossRef]
- Wajid, A.; Singh, N.K.; Junjun, P.; Mughal, M.A. Recognition of ripe, unripe and scaled condition of orange citrus based on decision tree classification. In Proceedings of the International Conference on Computing, Mathematics and Engineering Technologies, Sukkur, Pakistan, 3–4 March 2018; pp. 1–4. [Google Scholar]
- Jahanbakhshi, A.; Momeny, M.; Mahmoudi, M.; Zhang, Y.D. Classification of sour lemons based on apparent defects using stochastic pooling mechanism in deep convolutional neural networks. Sci. Hortic. 2020, 263, 109133. [Google Scholar] [CrossRef]
- Miller, W.M.; Drouillard, G.P. Multiple feature analysis for machine vision grading of Florida citrus. Appl. Eng. Agric. 2001, 17, 627–633. [Google Scholar] [CrossRef]
- Dael, M.V. A segmentation and classification algorithm for online detection of internal disorders in citrus using X-ray radiographs. Postharvest. Biol. Technol. 2016, 112, 205–214. [Google Scholar] [CrossRef]
- Itakura, K.; Saito, Y.; Suzuki, T.; Kondo, N.; Hosoi, F. Estimation of citrus maturity with fluorescence spectroscopy using deep learning. Horticulturae 2019, 5, 1–9. [Google Scholar]
- Theanjumpol, P.; Wongzeewasakun, K.; Muenmanee, N. Non-destructive identification and estimation of granulation in `Sai Num Pung’ tangerine fruit using near infrared spectroscopy and chemometrics. Postharvest. Biol. Technol. 2019, 153, 13–20. [Google Scholar] [CrossRef]
- Yang, G.L.; Luo, L.; Feng, Y.Q.; Zhao, H.S. Research of navel orange defect and color detection based on machine vision. Appl. Mech. Mater. 2014, 513, 3442–3445. [Google Scholar] [CrossRef]
- Jhawar, J. Orange Sorting by Applying Pattern Recognition on Colour Image. Procedia Comput. Sci. 2015, 78, 691–697. [Google Scholar] [CrossRef] [Green Version]
- Abdulridha, J.; Batuman, O.; Ampatzidis, Y. UAV-based remote sensing technique to detect citrus canker disease utilizing hyperspectral imaging and machine learning. Remote Sens. 2019, 11, 1373. [Google Scholar] [CrossRef] [Green Version]
- Sharif, M.; Khan, M.A.; Iqbal, Z.; Azam, M.F.; Lali, M.I.U.; Javed, M.Y. Detection and classification of citrus diseases in agriculture based on optimized weighted segmentation and feature selection. Comput. Electron. Agric. 2017, 150, 220–234. [Google Scholar] [CrossRef]
- Qiu, S.; Wang, J.; Tang, C.; Du, D. Comparison of ELM, RF, and SVM on E-nose and E-tongue to trace the quality status of mandarin (Citrus unshiu Marc.). J. Food Eng. 2015, 166, 193–203. [Google Scholar] [CrossRef]
- Steinmetz, V.; Biavati, E.; Molto, E.; Pons, R.; Fornes, I. Predicting the maturity of oranges with non destructive sensors. In Proceedings of the International Symposium on Sensors in Horticulture, Tune Landboskole, Denmark, 21–26 August 1995; Volume 421, pp. 271–278. [Google Scholar]
- Zhang, Y.; Lee, W.S.; Li, M.; Zheng, L.; Ritenour, M.A. Non-destructive recognition and classification of citrus fruit blemishes based on ant colony optimized spectral information. Postharvest. Biol. Technol. 2018, 143, 119–128. [Google Scholar] [CrossRef]
- Singh, H.; Gill, N. Machine Vision Based Color Grading of Kinnow Mandarin. Int. J. Adv. Res. Comput. Sci. Softw. Eng. 2015, 5, 1253–1259. [Google Scholar]
- Moomkesh, S.; Ahmad, S.; Sadeghi, M. ScienceDirect Early detection of freezing damage in sweet lemons using Vis/SWNIR spectroscopy. Biosyst. Eng. 2017, 164, 157–170. [Google Scholar] [CrossRef]
- Gawande, M.A.; Dhande, S.S. Implementation of Fruits Grading and Sorting System by using Image Processing and Data Classifier. SSRG Int. J. Comput. Sci. Eng. 2015, 2, 22–27. [Google Scholar]
- Gómez-Sanchis, J. Hyperspectral system for early detection of rottenness caused by Penicillium digitatum in mandarins. J. Food Eng. 2008, 89, 80–86. [Google Scholar] [CrossRef]
- Mercol, J.P.; Gambini, J.; Santos, J.M. Automatic classification of oranges using image processing and data mining techniques. In Proceedings of the XIV Congreso Argentino de Ciencias de la Computación, Río Cuarto, Argentina, 14–18 October 2008. [Google Scholar]
- Qin, J.; Burks, T.F.; Kim, M.S.; Chao, K.; Ritenour, M.A. Citrus canker detection using hyperspectral reflectance imaging and PCA-based image classification method. Sens. Instrum. Food Qual. Saf. 2008, 2, 168–177. [Google Scholar] [CrossRef]
- Fiona, B.O.; Thomas, M.R.; Maria, S.; Hannah, I.J. Identification Of Ripe And Unripe Citrus Fruits Using Artificial Neural Network. J. Phys. Conf. Ser. 2019, 1362, 12033. [Google Scholar] [CrossRef]
- Zhang, Y. Navel Orange Pest Image Recognition Based on Convolution Deep Neural Network. Int. J. Simul. Syst. Sci. Technol. 2008, 17, 8–12. [Google Scholar]
- Li, J.; Huang, W.; Tian, X.; Wang, C.; Fan, S.; Zhao, C. Fast detection and visualization of early decay in citrus using Vis-NIR hyperspectral imaging. Comput. Electron. Agric. 2016, 127, 582–592. [Google Scholar] [CrossRef]
- Dong, C.; Ye, Y.; Zhang, J.; Zhu, H.; Liu, F. Detection of Thrips Defect on Green-Peel Citrus Using Hyperspectral Imaging Technology Combining PCA and B-Spline Lighting Correction Method. J. Integr. Agric. 2014, 13, 60671–60672. [Google Scholar] [CrossRef] [Green Version]
- Thendral, R.; Suhasini, A. Automated skin defect identification system for orange fruit grading based on genetic algorithm. Curr. Sci. 2017, 112, 1704–1711. [Google Scholar] [CrossRef]
- Lorente, D.; Zude, M.; Regen, C.; Palou, L.; Gómez-Sanchis, J.; Blasco, J. Early decay detection in citrus fruit using laser-light backscattering imaging. Postharvest. Biol. Technol. 2013, 86, 424–430. [Google Scholar] [CrossRef]
- Kaur, M.; Sharma, R. Quality Detection of Fruits by Using ANN Technique. IOSR J. Electron. Commun. Eng. 2015, 10, 2278–2834. [Google Scholar]
- López-García, F.; Andreu-García, G.; Blasco, J.; Aleixos, N.; Valiente, J.M. Automatic detection of skin defects in citrus fruits using a multivariate image analysis approach. Comput. Electron. Agric. 2010, 71, 189–197. [Google Scholar] [CrossRef]
- Li, J. Detection of early decayed oranges based on multispectral principal component image combining both bi-dimensional empirical mode decomposition and watershed segmentation method. Postharvest. Biol. Technol. 2019, 158, 110986. [Google Scholar] [CrossRef]
- Wen, T. Rapid detection and classification of citrus fruits infestation by Bactrocera dorsalis (Hendel) based on electronic nose. Postharvest. Biol. Technol. 2018, 147, 156–165. [Google Scholar] [CrossRef]
- Mohana, S.H.; Prabhakar, C.J. Automatic Detection of Surface Defects on Citrus Fruit based on Computer Vision Techniques. Int. J. Image Graph. Signal Process 2015, 7, 11–19. [Google Scholar]
- Cubero, S.; Blasco, J.; Cubero, S.; Blasco, J.; Ferrer, A. VIS/NIR hyperspectral imaging and N-way PLS-DA models for detection of decay lesions in citrus fruits. Chemom. Intell. Lab. Syst. 2016, 156, 241–248. [Google Scholar]
- Saha, R. Orange Fruit Disease Classification using Deep Learning Approach. Int. J. Adv. Trends Comput. Sci. Eng. 2020, 9, 2297–2301. [Google Scholar] [CrossRef]
- Cevallos-Cevallos, J.M.; Futch, D.B.; Shilts, T.; Folimonova, S.Y.; Reyes-De-Corcuera, J.I. GC-MS metabolomic differentiation of selected citrus varieties with different sensitivity to citrus huanglongbing. Plant Physiol. Biochem. 2012, 53, 69–76. [Google Scholar] [CrossRef]
- Pourreza, A.; Lee, W.S.; Ritenour, M.A.; Roberts, P. Spectral characteristics of citrus black spot disease. Horttechnology 2016, 26, 254–260. [Google Scholar] [CrossRef]
- Magwaza, L.S. The use of Vis/NIRS and chemometric analysis to predict fruit defects and postharvest behaviour of “Nules Clementine” mandarin fruit. Food Chem. 2014, 163, 267–274. [Google Scholar] [CrossRef]
- Kavitha, V.; Devi, M.R. Predicting the Diseases by Graphcut Method for Citrus Fruits. Int. Res. J. Manag. Sci. Technol. 2016, 7, 465–470. [Google Scholar]
- Rong, D.; Rao, X.; Ying, Y. Computer vision detection of surface defect on oranges by means of a sliding comparison window local segmentation algorithm. Comput. Electron. Agric. 2017, 137, 59–68. [Google Scholar] [CrossRef]
- Ranjit, K.N.; Raghunandan, K.S.; Naveen, C.; Chethan, H.K.; Sunil, C. Deep Features Based Approach for Fruit Disease Detection and Classification. Int. J. Comput. Sci. Eng. 2019, 7, 2347–2693. [Google Scholar]
- Kim, D.G.; Burks, T.F.; Qin, J.; Bulanon, D.M. Classification of grapefruit peel diseases using color texture feature analysis. Int. J. Agric. Biol. Eng. 2009, 2, 41–50. [Google Scholar]
- Ashwani, Y.; Dubey, K.; Ratan, R.; Rocha, A. Computer vision based analysis and detection of defects in fruits causes due to nutrients deficiency. Clust. Comput. 2019, 6, 10586–10605. [Google Scholar]
- Senthilkumar, C.; Kamarasan, M. An Effective Classification of Citrus Fruits Diseases using Adaptive Gamma Correction with Deep Learning Model. Int. J. Eng. Adv. Technol. 2020, 9, 2249–8958. [Google Scholar] [CrossRef]
- Behera, S.K.; Rath, A.K.; Sethy, P.K. Automatic Fruits Identification and Disease Analysis using Machine Learning Techniques. Int. J. Innov. Technol. Explor. Eng. 2019, 8, 103–107. [Google Scholar]
- Kim, G.; Lee, K.; Choi, K.; Son, J.; Choi, D.; Kang, S. Defect and ripeness inspection of citrus using NIR transmission spectrum. In Key Engineering Materials; Trans Tech Publications: Stafa-Zurich, Switzerland, 2004; pp. 1008–1013. [Google Scholar]
- Lopez, J.J.; Aguilera, E.; Cobos, M. Defect detection and classification in citrus using computer vision. In Proceedings of the International Conference on Neural Information Processing, Bangkok, Thailand, 1–5 December 2009; pp. 11–18. [Google Scholar]
- Pan, W.; Qin, J.; Xiang, X.; Wu, Y.; Tan, Y.; Xiang, L. A Smart Mobile Diagnosis System for Citrus Diseases Based on Densely Connected Convolutional Networks. IEEE Access 2019, 7, 87534–87542. [Google Scholar] [CrossRef]
- Kumar, G.; S, Y. Identification and Classification of Fruit Diseases. In Proceedings of the International Conference on Recent Trends in Image Processing and Pattern Recognition, Bidar, India, 16–17 December 2016; pp. 382–390. [Google Scholar]
- Doh, B.; Zhang, D.; Shen, Y.; Hussain, F.; Doh, R.F.; Ayepah, K. Automatic citrus fruit disease detection by phenotyping using machine learning. In Proceedings of the 25th IEEE International Conference on Automation and Computing, Lancaster, UK, 5–7 September 2019; pp. 1–5. [Google Scholar]
- Lorente, D.; Aleixos, N.; Gómez-Sanchis, J.; Cubero, S.; Blasco, J. Selection of Optimal Wavelength Features for Decay Detection in Citrus Fruit Using the ROC Curve and Neural Networks. Food Bioprocess Technol. 2011, 6, 530–541. [Google Scholar] [CrossRef] [Green Version]
- Vijayarekha, K.; Govindaraj, R. Citrus fruit external defect classification using wavelet packet transform features and ANN. In Proceedings of the 2006 IEEE International Conference on Industrial Technology, Mumbai, India, 15–17 December 2006; pp. 2872–2877. [Google Scholar]
- Bhargava, A.; Bansal, A. Automatic Detection and Grading of Multiple Fruits by Machine Learning. Food Anal. Methods 2019, 13, 751–761. [Google Scholar] [CrossRef]
- Chen, Y.; Wu, J.; Cui, M. Automatic classification and detection of oranges based on computer vision. In Proceedings of the 4th International Conference on Computer and Communications, Chengdu, China, 7–10 December 2018; pp. 1551–1556. [Google Scholar]
- Xie, X. Image matching algorithm of defects on navel orange surface based on compressed sensing. J. Ambient. Intell. Humaniz. Comput. 2018, 1, 1–9. [Google Scholar] [CrossRef]
- Huijun, L.; Xiangfeng, W. Rapid shelf-life identification model of citrus based on near infrared spectroscopy. In Proceedings of the International Symposium on Knowledge Acquisition and Modeling, Wuhan, China, 21–22 December 2008; pp. 298–301. [Google Scholar]
- Pham, V.H.; Lee, B.R. An image segmentation approach for fruit defect detection using k-means clustering and graph-based algorithm. Vietnam J. Comput. Sci. 2015, 2, 25–33. [Google Scholar] [CrossRef] [Green Version]
- Turitsyna, E.G.; Webb, S. Hyperspectral detection of citrus damage with Mahalanobiskernel classifier. Electron. Lett. 2005, 41, 40–41. [Google Scholar]
- Enciso-Aragón, C.J.; Jimenez-Moreno, R. Quality control system by means of CNN and fuzzy systems. Int. J. Appl. Eng. Res. 2018, 13, 12846–12853. [Google Scholar]
- Patel, H.; Prajapati, R.; Patel, M. Detection of Quality in Orange Fruit Image using SVM Classifier. In Proceedings of the 3rd International Conference on Trends in Electronics and Informatics (ICOEI), Tirunelveli, India, 23–25 April 2019; pp. 74–78. [Google Scholar]
- Taghadomi-Saberi, S.; Masoumi, A.A.; Sadeghi, M.; Zekri, M. Integration of wavelet network and image processing for determination of total pigments in bitter orange (Citrus aurantium L.) peel during ripening. J. Food Process Eng. 2019, 42, e13120. [Google Scholar] [CrossRef]
- Cooper, D.; Doucet, L.; Pratt, M. Detection and classification of citrus green mold caused by Penicillium digitatum using multispectral imaging. J. Sci. Food Agric. 2018, 98, 3542–3550. [Google Scholar]
- Du, C. Recent developments in the applications of image processing techniques for food quality evaluation. Trends Food Sci. Technol. 2004, 15, 230–249. [Google Scholar] [CrossRef]


| PAPER | RQ1 | RQ2 | RQ3 | RQ4 | RQ5 | PAPER | RQ1 | RQ2 | RQ3 | RQ4 | RQ5 |
|---|---|---|---|---|---|---|---|---|---|---|---|
| [16] | Yes | Yes | No | No | Yes | [17] | Yes | Yes | No | No | Yes |
| [18] | Yes | Yes | No | No | Yes | [19] | Yes | Yes | No | No | Yes |
| [20] | Yes | Yes | No | No | Yes | [21] | Yes | Yes | Yes | No | Yes |
| [22] | Yes | Yes | Yes | No | Yes | [23] | Yes | Yes | Yes | No | Yes |
| [24] | Yes | Yes | No | No | Yes | [25] | Yes | Yes | No | No | Yes |
| [26] | Yes | Yes | No | No | Yes | [27] | Yes | Yes | No | No | Yes |
| [28] | Yes | Yes | No | No | Yes | [29] | Yes | Yes | No | No | Yes |
| [30] | Yes | Yes | No | No | Yes | [31] | Yes | Yes | No | No | Yes |
| [32] | Yes | Yes | Yes | No | Yes | [33] | Yes | Yes | Yes | No | Yes |
| [34] | Yes | Yes | No | No | Yes | [35] | Yes | Yes | No | No | Yes |
| [36] | Yes | Yes | No | Yes | Yes | [37] | No | Yes | No | No | Yes |
| [38] | Yes | Yes | No | No | Yes | [39] | Yes | Yes | No | No | No |
| [40] | Yes | Yes | Yes | No | Yes | [41] | Yes | Yes | Yes | No | Yes |
| [40] | Yes | Yes | No | No | Yes | [42] | Yes | Yes | Yes | No | Yes |
| [43] | Yes | Yes | No | No | Yes | [44] | Yes | Yes | No | No | Yes |
| [45] | Yes | Yes | No | No | Yes | [46] | Yes | Yes | No | Yes | Yes |
| [47] | Yes | Yes | No | No | Yes | [48] | Yes | Yes | Yes | Yes | Yes |
| [49] | Yes | Yes | Yes | No | Yes | [50] | Yes | Yes | No | No | Yes |
| [51] | Yes | Yes | No | No | Yes | [21] | Yes | Yes | No | No | Yes |
| [52] | Yes | Yes | No | No | Yes | [53] | Yes | Yes | No | No | Yes |
| [17] | Yes | Yes | No | No | Yes | [54] | Yes | Yes | No | No | Yes |
| [55] | Yes | Yes | Yes | No | Yes | [56] | Yes | Yes | No | No | Yes |
| [57] | Yes | Yes | No | No | No | [58] | Yes | Yes | No | No | Yes |
| [59] | Yes | Yes | No | No | Yes | [60] | Yes | Yes | Yes | No | Yes |
| [61] | Yes | Yes | No | No | Yes | [62] | Yes | Yes | No | No | Yes |
| [63] | Yes | Yes | No | No | Yes | [64] | Yes | Yes | No | No | Yes |
| [65] | Yes | Yes | No | No | Yes | [66] | Yes | Yes | No | Yes | Yes |
| [67] | Yes | Yes | No | No | No | [68] | Yes | Yes | No | No | Yes |
| [69] | Yes | Yes | Yes | No | Yes | [59] | Yes | Yes | No | No | Yes |
| [70] | Yes | Yes | No | No | Yes | [71] | Yes | Yes | No | No | Yes |
| [72] | Yes | Yes | No | Yes | Yes | [73] | Yes | Yes | No | No | Yes |
| [74] | Yes | Yes | Yes | No | Yes | [75] | Yes | Yes | No | No | Yes |
| [76] | Yes | Yes | No | No | Yes | [77] | Yes | Yes | No | No | Yes |
| [78] | Yes | Yes | Yes | No | Yes | [79] | Yes | Yes | No | No | Yes |
| [80] | Yes | Yes | No | No | Yes | [81] | No | Yes | Yes | No | Yes |
| [82] | Yes | Yes | No | No | Yes | [83] | Yes | Yes | No | No | Yes |
| [84] | Yes | Yes | No | Yes | Yes | [85] | Yes | Yes | No | No | No |
| [86] | Yes | Yes | Yes | Yes | Yes | [87] | Yes | Yes | No | Yes | Yes |
| [88] | Yes | Yes | No | No | Yes | [89] | Yes | Yes | No | No | Yes |
| [90] | Yes | Yes | No | No | Yes |
| Type of Diseases | Description | Research Papers |
|---|---|---|
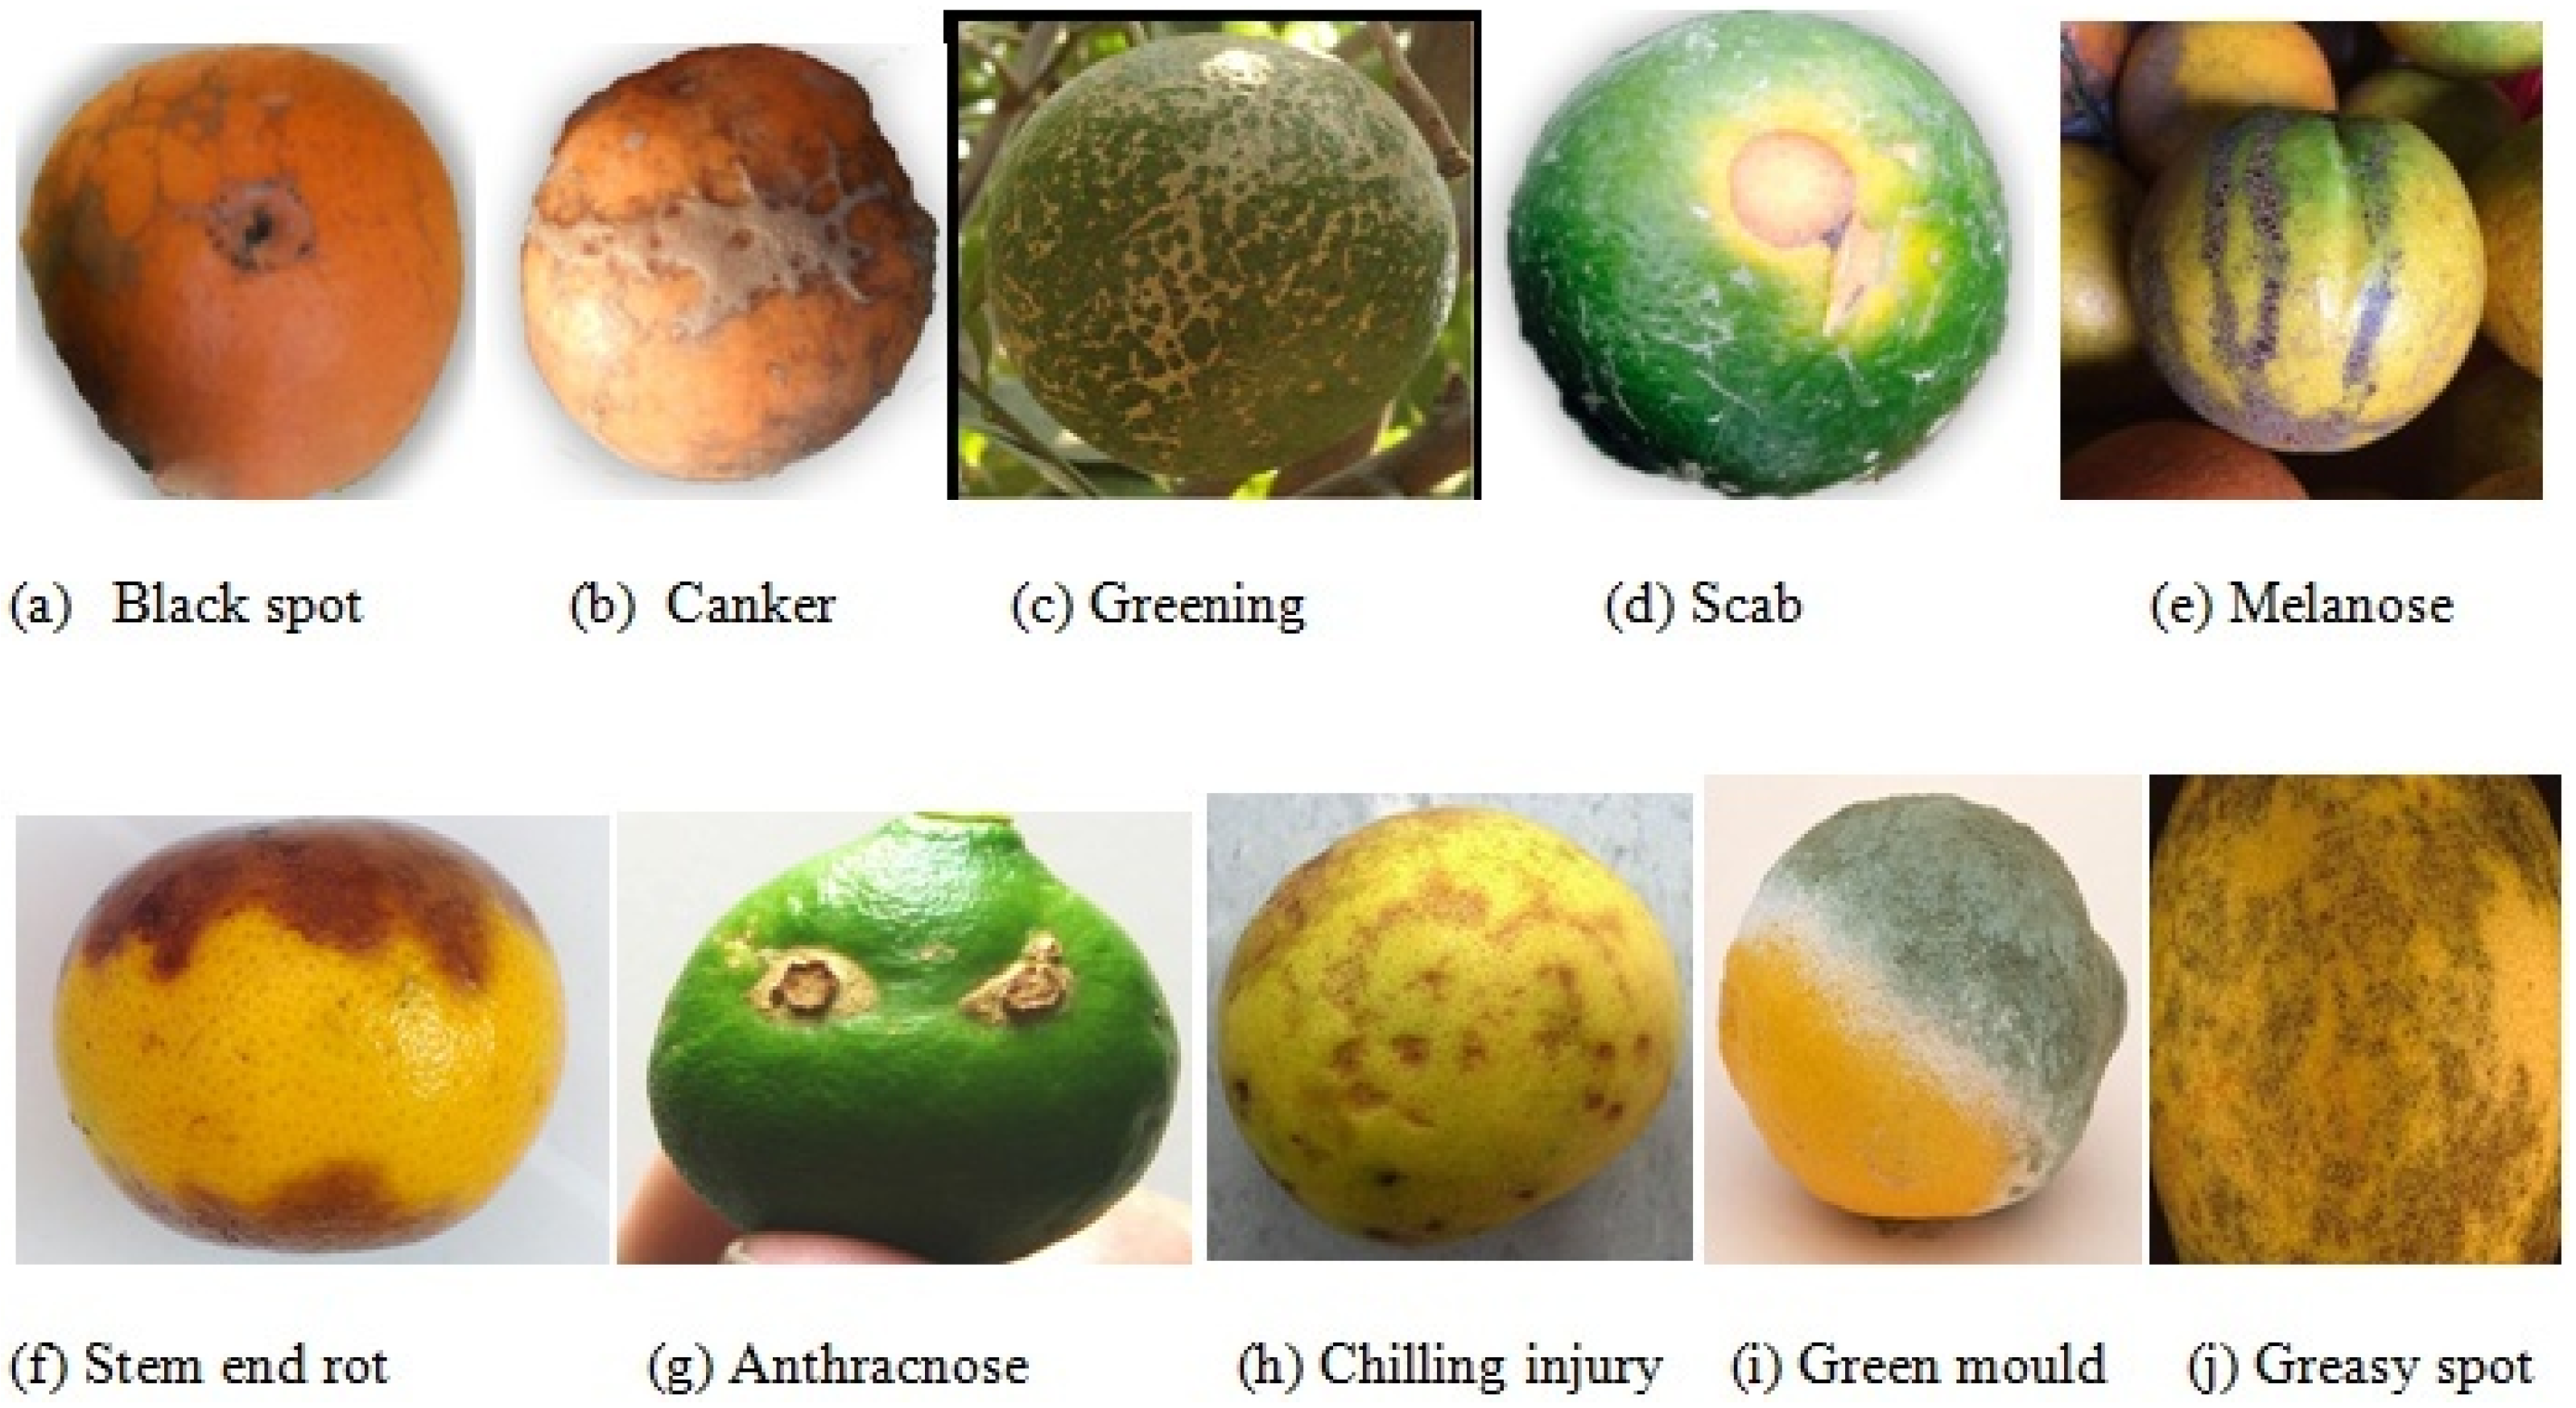
| Anthracnose | It is an initial colonizer of damage, with brown-colored lesions on fruits damaged by many factors, such as sunburn, chemical exposure, high temperatures, and extended storage duration. | [76,78,88] |
| Melanose | This disease creates a slight bruise on the fruit that can rarely affect the ultimate fruit production yield but induces visible imperfections that decrease the profitability of fruits destined for the produce market. | [17,22,26,44,50,59,63,70,78] |
| Citrus scab | These fungal pathogens of foliage are globally present in various citrus-cultivar-producing regions. Generally, in in-plane areas with regular rain, the occurrence of scab is more extreme than in tropical regions. Scab injuries can be found on fruits just before seven days of contamination. These infections also present as small patches with a coarse and distorted appearance. | [27,59,72,76,78] |
| Black spot | These are small, round, and dangerous spots with a diameter of 0.12 to 0.4 in fruits. | [26,41,59,65,72,76,78] |
| Canker | The diameter of the fruit scar is about 1–10 mm and is surrounded by water-dipped and yellow disc-like lesions. | [17,22,27,40,41,50,59,63,68,70,78] |
| Huanglongbing (HLB) | Another name of HLB is greening. It occurs because of liberibacter, phloem-limited fastidious, and candidatus. It is a bacterial and most destructive disease that reduces fruit production globally. With low soluble solids and high acidity, fruit tainted by HLB juice becomes abnormally sour. It causes the fruit to be malformed and break. It causes malformations and cracks on fruit. | [16,23,41,44,59,64,72,78] |
| Wind scar | Windy weather can cause tree branches to rub or hit growing fruit. These scars are likely to only appear on the fruit’s surface and do not, in general, compromise its consistency. Tissue damage contributes to the entry of bacteria and fungi and colonize the tissue, resulting in further damage. | [22,26,34,44,58,70,75] |
| P. digitatum fungus | Infections because of Penicillium spp. fungi are a primary concern impacting citrus development. Actual losses due to this fungus are complex and rely on the processing location, citrus type, age, environmental conditions of the developing and harvesting stage, the degree of apparent damage during handling, and the climate after harvest. | [21,25,31,48,53,56,59,60,62,65,79,86,88] |
| Greasy spot | It is more intense where concentrations of rust mites are high. Rind blotch considerably lowers the extrinsic properties of fruit for sale at the market. Grapefruit is of significant concern, but this disease can also be present in oranges and other citrus fruits. Rind blotch decreases the amount of grapefruit that is suitable for the fresh market. | [26,44,50,70] |
| Surface defects | Mechanical injury (bruises) and indications of illnesses entail surface defects. Surface injuries include fruit blemishes, burns, and wrong structures. | [18,30,32,38,40,43,49,55,61,71,77,79,82,83,85,87] |
| Chilling/freezing disorders | This post-harvest disorder occurs due to the chilling effect, and it is a catastrophic disorder that evolves with the storage of fruits at low temperatures that notably demotes the quality of citrus fruits in the market or disqualifies them from the market. The impact of the chilling disorder depends upon the temperature at which fruits are to be stored or the duration of the time spent by the fruit in cold storage. Its severity increases with lower storage temperatures and long durations of exposure. | [29,46] |
| Other color defects | Other miscellaneous defects are stubborn, brown rot, black mould, green spot, color defects, copper burn, blemishes, morphological disorders, stem-end rot, etc. | [17,19,20,22,24,26,27,30,34,63,68,70] |
| Best Technique | Outperformed Techniques | |||||||
|---|---|---|---|---|---|---|---|---|
| SVM | ANN [76] | W-KNN, EBT, DT, LDA [41] | CNN, KNN [71] | ANN, KNN, SRS [81] | KNN, NaïveBaYes [23] | DT, Fuzzy, ANN [33] | MLP, RBF [49] | KNN [69] |
| ANN | SRC [81] | SVM, LR, [23,29] | DT [33] | Naïve Bayes [23,32] | KNN [33,81] | Fuzzy [33] | LDA [29] | QDA [29] |
| DT | Naïve Bayes [32] | MLP, RB [49] | Fuzzy [33] | EBT [41] | LDA [86] | ANN [32] | SMO [49] | |
| LDA | PCA [60] | EBT [41] | CART [48] | |||||
| BaYesian | NN [22] | |||||||
| CNN | KNN [69] | ANN, DT, Fuzzy [33] | SVM [33,69] | |||||
| NNRB | KNN [40] | |||||||
| ASNN | SVM, [55] | BPNN [55] | ||||||
| PLS | MLR [74] | |||||||
| FA | PCA [21] | SM [21] | ||||||
| Adaboost | SVM [23] | LR [23] | KNN [23] | Naïve Bayes [23] | NN [23] | |||
| RF | SVM [42] | |||||||
| KNN | CNN [71] | FUZZY, DT [33] | ||||||
| PCA | SM [21] | |||||||
| LR | SVM [23] | Naïve baYes [23] | KNN [23] | |||||
| W-KNN | EBT [41] | |||||||
| ELM | SVM [42] | |||||||
| BPNN | SVM [55] | |||||||
| Hybrid Techniques | Description | Result |
|---|---|---|
| ALEX-NET and Random Forest | Feature extraction takes place using the Alex-Net model. Lastly, multiclass classification is implemented using the random forest technique to classify different diseases. | The described AGC-A algorithm reliably identifies various forms of citrus fruit diseases with an overall identification rate of 97.29% [72]. |
| PCA and NN | The radial neurons are used as input and linear output neurons are used as the hidden layer in the RBF neural network model. The analysis was formulated by the newrb function in the Matlab programme, but this function is unstable. PCA was used for feature selection to enhance relative stability. A total of 10 variables were employed as the input of the neural network. | The shelf lives of 40 samples were estimated, and the prediction accuracy of the model developed in this paper was 80 [84]. |
| SVMs with the Mahalanobis kernel | The paper adopted a methodology determined by the collective use of hyperspectral images and a classifier of the Mahalanobis kernel. More detailed and accurate findings were obtained relative to other approaches in multiple scenarios and acquired images. The different intrinsic importance of spectral channels was assessed more effectively by this kernel, as their relative value was learned from the results. | The total accuracy on the MK-SVM classifier test set through various levels of training samples for the clemenules and clemenvilla mandarin variants was 95% [86]. |
| Genetic algorithms based on LDA | LDA-based genetic algorithms were used to determine one of the most suitable bands. The fitness function was chosen to re-examine the response of every execution while undertaking any GA method. The more extraordinary fitness feature could be chosen to produce a new generation. The study utilized the overall precision of LDA as its fitness function, and hence, the technique was called GALDA. | The overall result for clemenules using the LDA classifier with the GALDA system was 90%, and the results for clemenules using the CART classifier was 95% [48]. |
| PCA-ANN | PCA was first used to decrease the dimensionality of the spectral data, which were then considered the input for the ANN modeling technique. | Soft independent class analogy modeling (SIMCA), a form of PCA combined with ANN and SVM techniques, was performed to recognize freezing damage in sweet lemons, leading to various experimental simulated freezing environments on the entire spectral content. Using PCA-ANN, the accuracy of classification was 100% [46]. |
| CNN regression | The Brix/acid ratio of flesh juice was measured in this research by executing a regression analysis with a CNN (CNN regression). The most common CNN styles, comprising a convolution layer, a pooling layer, and a fully connected layer, were introduced. The regression layer was positioned in the final layer to implement CNN regression and measure the Brix/acid ratio. | The absolute error in the Brix/acid ratio was 2.48 employing CNN regression [36]. |
| Principal component analysis followed by PLS-discriminant analysis | PLS-discriminant analysis (PLS-DA) with principal component analysis (PCA) was used to distinguish fruit per the canopy position. PCA and PLS-DA methods are focused on spectra obtained before harvesting, being unable to distinguish fruit depending on their canopy position. | The precision of the two regression approaches revealed that for screening between internal and outside fruit and sorting fruit depending on susceptibility to RBD, both strategies could be used solely or in collaboration [66]. |
| Convolutional neural networks and a fuzzy motor | Centered on artificial intelligence algorithms using CNN and a fuzzy motor, a fruit-oriented automated quality evaluation framework was introduced that examined a set of external attributes of critical value to assess the Persian lemon quality in addition to mitigating the loss variables of objectivity that could lead to an operator to diverge from the selection criterion. | Invalidating characteristics, the CNN trained by transfer learning gained 97.5% performance, and the methodology developed for the characterization procedure was performed correctly. In the three classes suggested, each lemon was correctly categorized by the fuzzy method according to the characteristics of each lemon and the classification score provided by CNN [87]. |
| PCA and multi-class support-vector machine (M-SVM) | The most relevant features were selected by implementing a hybrid feature selection technique that comprised entropy, PCA score, and a covariance vector premised on skewness. For the final classification of citrus disease, the identified features were fed to the multi-class support vector machine (M-SVM). | The proposed method significantly outperformed the other techniques and attains 97% accuracy for the image gallery dataset, 89% accuracy for the consolidated dataset, and 90.4% accuracy for their local dataset [69]. |
| Mask R-CNN and merging algorithm | The ability to recognise fruits in various occluded situations is a crucial area of expertise for a fruit-grading robot system. An unified approach was created to concurrently recognise and quantify citrus fruits and branches using a branch segment merging method and a mask regional convolutional neural network. To increase the accuracy of the mask R-CNN, a segmental labelling technique was presented for randomized and asymmetrical branches. The minimal enclosing rectangle of the segmental mask portions predicted by the model was calculated to produce a much more exact bounding box. After that, the branches and the trunk were rebuilt using a branch segment merging technique. Casting the colour image out onto the contour allows for the measurement of the fruit and branch diameters. | Fruit and branch detection have typical accuracies of 88.15 and 96.27%, respectively. The average measurement errors for the diagonal dimension of fruit, the longitudinal radius of fruit, and the radius of branches are 2.52, 2.29, and 1.17 mm, respectively. The outcomes of the tests demonstrate that the detecting system performs well for all sorts of fruits and geometric distortions. The robot can effectively design a proper picking path and avoid collisions with the aid of this imaging system. |
| Metrics | Equation |
|---|---|
| Co-occurrence metric | |
| Inertia moment | |
| The absolute value of the difference | |
| Regular value of the difference | |
| The modified absolute value of the difference | |
| Mean | |
| Standard deviation | |
| Entropy | |
| Variance | |
| Kurtosis | |
| Skewness | |
| Range | max (Z (x,y)) – min (Z (x,y)) |
| Homogeneity | |
| Correlation | |
| Contrast | |
| Energy | |
| Gradient module | g, g(x) = x − M + 1 |
| Intensity Symmetry | 1 − |
| HSV Space | |
| Hue component | = |
| Saturation component | 1 − ( ) |
| Intensity component | ( |
| Smoothness S | 1 − |
| Consistency C | |
| Evaluation Parameter | Formula Used | Description | Count |
|---|---|---|---|
| Accuracy | The proportion of accurate assessments among all the assessments. | 47 | |
| Sensitivity | The percentage of infected classes correctly predicted among all existing infected classes. It is also called recall and the true-positive rate (TPR). | 17 | |
| Specificity | Healthy fruit classes that are correctly predicted among all authentic, healthy classes. | 8 | |
| Precision | The percentage of infected fruit classes that are appropriately categorized among the total number of cases classified. | 7 | |
| FPR | The percentage of healthy classes identified as infected classes. | 3 | |
| FNR | The percentage of infectious categories classified as the regular class. | 2 | |
| F-measure | The harmonic means of accuracy and sensitivity. It expresses the equilibrium between recall and precision. | 7 | |
| Percentage error | The percentage error is the difference between the expected number and the actual number relative to the actual number measured in the percentage format. | 5 |
| S.No | Point | Facts |
|---|---|---|
| 1 | Which technique was popularly used for the classification of diseases of citrus fruits in the studies assessed in our SLR? | Machine Learning |
| 2 | Popularly used deep learning technique for citrus fruit disease classification | CNN |
| 3 | Popularly used machine learning technique for citrus fruit disease classification | SVM |
| 4 | A popularly used statistical technique for citrus fruit disease classification | PCA |
| 5 | Popularly used image processing technique | Thresholding |
| 6 | Technique that outperformed other techniques (ML/Non-ML) in terms of accuracy | Machine Learning (SVM) |
| 7 | Defect type on which most of the state-of-the-art work has been performed | Surface defects |
| 8 | The most frequently studied citrus fruit | Orange |
| 9 | The most commonly used evaluation parameter | Accuracy |
| 10 | The number of studies using ML/DL/statistical methods | |
| 11 | Name of the disease on which most of the work has been performed | Canker |
| 12 | Name of the fungi on which most of the work has been performed | P. digitatum |
Disclaimer/Publisher’s Note: The statements, opinions and data contained in all publications are solely those of the individual author(s) and contributor(s) and not of MDPI and/or the editor(s). MDPI and/or the editor(s) disclaim responsibility for any injury to people or property resulting from any ideas, methods, instructions or products referred to in the content. |
© 2023 by the authors. Licensee MDPI, Basel, Switzerland. This article is an open access article distributed under the terms and conditions of the Creative Commons Attribution (CC BY) license (https://creativecommons.org/licenses/by/4.0/).
Share and Cite
Dhiman, P.; Kaur, A.; Balasaraswathi, V.R.; Gulzar, Y.; Alwan, A.A.; Hamid, Y. Image Acquisition, Preprocessing and Classification of Citrus Fruit Diseases: A Systematic Literature Review. Sustainability 2023, 15, 9643. https://doi.org/10.3390/su15129643
Dhiman P, Kaur A, Balasaraswathi VR, Gulzar Y, Alwan AA, Hamid Y. Image Acquisition, Preprocessing and Classification of Citrus Fruit Diseases: A Systematic Literature Review. Sustainability. 2023; 15(12):9643. https://doi.org/10.3390/su15129643
Chicago/Turabian StyleDhiman, Poonam, Amandeep Kaur, V. R. Balasaraswathi, Yonis Gulzar, Ali A. Alwan, and Yasir Hamid. 2023. "Image Acquisition, Preprocessing and Classification of Citrus Fruit Diseases: A Systematic Literature Review" Sustainability 15, no. 12: 9643. https://doi.org/10.3390/su15129643