Article

Monitoring and Assessing Urbanization Progress in Thailand between 2000 and 2020 Using SDG Indicator 11.3.1

1
Department of Energy, Environment and Climate Change, School of Environment, Resources and Development, Asian Institute of Technology, Klong Luang, Pathumthani 12120, Thailand
2
Department of Information and Communication Technologies, School of Engineering and Technology, Asian Institute of Technology, Pathumthani 12120, Thailand
3
Department of Development and Sustainability, School of Environment, Resources and Development, Asian Institute of Technology, Pathumthani 12120, Thailand
4
Department of Geoinformatics, University of Salzburg, 5020 Salzburg, Austria
*
Author to whom correspondence should be addressed.
Sustainability 2023, 15(12), 9794; https://doi.org/10.3390/su15129794
Submission received: 23 May 2023 / Revised: 13 June 2023 / Accepted: 16 June 2023 / Published: 19 June 2023

Abstract

:
Urbanization, generally across developing countries, is accelerating at an ever-increasing pace along with population growth. The growth of built-up space is often disproportionate with the population growth rate, creating multiple stresses to the environment and hindering sustainable development. To account for this disproportionality, the SDG 11.3.1 indicator “Ratio of land consumption rate (LCR) to Population growth rate (PGR)” was developed to achieve SDG 11 and its integrated SDGs. This study assessed the variations in the LCR, PGR, and LCRPGR from 2000~2020, taking four different intervals of 5 years across Thailand, its provinces and regions by adopting the methodology recommended by UN-Habitat. A combined approach of remote sensing and statistical analysis was employed for assessing urban land use efficiency, the growth of built-up space and the relationship between the LCR and PGR in temporal as well as spatial dimensions. It was found that urban expansion is disproportionate with the PGR in most of the provinces and during a majority of the time intervals with the average LCRPGR of 0.70 (2000~2005), 1.6 (2005~2010), 0.40 (2010~2015) and 1.12 (2015~2020). Some of the studied periods (2005~2010 and 2015~2020) were dominated by the increasing built-up space in Thai provinces and regions as compared to the population growth rate, leading to higher per capita land consumption, and some experienced greater population growth, and rising urban compactness, while a few provinces tended towards stability, which was influenced by demographic factors and economic development. The average annual growth rate of built-up areas has declined in recent years across all the regions of Thailand. Further, this study is pivotal for urban planners and policymakers to promote more sustainable growth in Thai provinces and regions.

Graphical Abstract

1. Introduction

Urbanization is considered an indicator of the economic development of a country, and reveals changes in the social and cultural aspects of a community as it creates employment opportunities, leads to the influx of people and processes to urban areas, and increases built-up space along with the expansion of industries, development projects and infrastructure development [1,2,3]. However, unplanned urbanization poses substantial negative impacts on the natural environment at the local as well as global scale [4,5,6]. Urbanized areas are now occupied with more than half of the world’s population (above 4 billion), which is increasing rampantly and is projected to be two-thirds of the global population by 2050 [1,7,8]. The world’s urbanized areas in 1975 covered 37 Mha, which increased to 78 Mha in 2015, expanding at an average rate of 1 Mha/year [9].As the population increases and built-up areas expand, the burden on natural environment exceeds its carrying capacity, resulting in reductions in ecological habitats, arable land, and natural resources [5,10]. For instance, rampant population growth imposes threats to urban land use management [11]. With improper urban planning, the rate of population growth does not align with the urban expansion rate, causing inefficient urban land use [7,12]. Taking both population growth and urban expansion into consideration, the UN’s 2030 Agenda for Sustainable Development incorporates SDG 11 “Sustainable cities and communities” to build safe, resilient, inclusive and sustainable cities and communities [8,13]. Within SDG 11, the disproportionate expansion of urban areas with regard to population growth is explained by SDG 11.3.1, where the major focus of this study lies.
Furthermore, achieving proportionate urban land expansion across the world is a major challenge since there could be multiple of factors causing imbalance between the land consumption rate (LCR) and population growth rate (PGR), such as land use policy, socio-economic status, government ownership, and infrastructures, of which land use policy is recognized as a most influential one [9,14,15]. Weak enforcement of the existing land use policy leads to inefficient urban land use, while poor socio-economic status and low infrastructures cause influx to urban areas with greater urban compactness. Without addressing the disproportionality of urban land expansion and population growth, SDG 11 cannot be achieved. Moreover, the goals and targets under the UN’s 2030 Agenda are integrated, indivisible and globally acceptable; hence, unsatisfied progress on SDG 11 could hinder the achievement of many interconnected goals and targets. Therefore, it is important to understand and coordinate human–land relationships by acquiring information on both urban land consumption and population growth. Monitoring and assessing urbanization progress not only shows the status of land use efficiency, but also helps urban planners and policymakers to formulate land use policy accordingly and to achieve the ultimate target of sustainable urbanization [16]. The value of LCRPGR can vary by region, country, and in a smaller unit, across the world [12,17,18]. Globally, the LCR and PGR showed a declining trend between 1975 and 2015, with the values of LCR (0.022) and PGR (0.016) during 1975–2000 increasing to 0.0124 and 0.016, respectively, between 2000 and 2015 [9]. However, the average LCRPGR of China during 1990–1995 was 1.34, which dropped to 0.85 during 1995–2000 and again showed an increasing and decreasing trend in the subsequent periods of 2000–2005 and 2005–2010 [15]., with a slower urban expansion rate after 2010 [19]. As a developing country, Thailand can exhibit variability in the LCRPGR index across different provinces and regions in different time periods. There has been a number of studies on SDG 11.3.1 at regional, national as well as sub-national levels, where the majority of the studies determined inefficient land use as having an LCRPGR value greater or smaller than the ideal value of one [7,9,12,17,18,20,21,22].
Even though the monitoring and assessment of the urbanization progress of developing countries have been conducted by analyzing the LCRPGR index, there seems to have been no studies to date using the SDG 11.3.1 indicator for Thailand or its provincial levels. Assessing the LCRPGR at the regional and provincial levels could reveal the complete profile of the entire nation comprehensively, which could be a representative study for other Southeast Asian countries. The applications of earth observation land cover datasets have increasingly gained attention across scientific communities such as Global Human Settlement Layer (GHSL), Atlas of Urban Expansion, and Global Urban Footprint [23,24,25,26,27]. The global land cover datasets do provide a higher accuracy that could be used at a global and regional scale [28,29]. Since the global land cover datasets use standard classification schemes and methods, they are consistent and comparable across different regions and countries. The easy accessibility of global land cover datasets, which have a finer resolution, and their harmonization with various global datasets has led to their use in scientific studies [30,31].
In 1990, the population of Thailand was 56.5 million, which increased to 69.9 million by 2021 (https://www.worlddata.info/asia/thailand/populationgrowth.php (accessed on 3 March 2023)). The urban population of Thailand has continuously increased from 43.8% in 2010 to 52.2% in 2021 [32]. In the context of the disproportionality between population growth and urban expansion throughout the world, Thailand and its more detailed provincial level analysis could explore its specific situation regarding urbanization progress and sustainability, which could provide valuable insights to urban planners and policymakers in Thailand and in the region. There is a need to gain information on areas that are experiencing rampant urbanization, determine the potential reasons for this trend, analyze the environmental impacts of urbanization and potential measures to mitigate the impacts, and identify opportunities for green infrastructure and sustainable urban design.
This study aimed to investigate and understand the spatial and temporal variations in urban expansion and population growth patterns of all the provinces of Thailand over a 20-year period from 2000 to 2020. Based on remotely sensed land cover datasets and census data of Thailand, it also assessed the LCR, PGR and LCRPGR following the methodology recommended by UN-Habitat. In addition, this study aimed to analyze how population growth is related to built-up area expansion in different provinces and regions in Thailand and to interpret the potential interlinkage between regional land use policy and urban development patterns. The present study offers quantitative insights and empirical evidence to better understand sustainable land use management and the implications for policymaking and urban planning in Thailand, and potentially in other developing countries facing similar challenges.

2. Materials and Methods
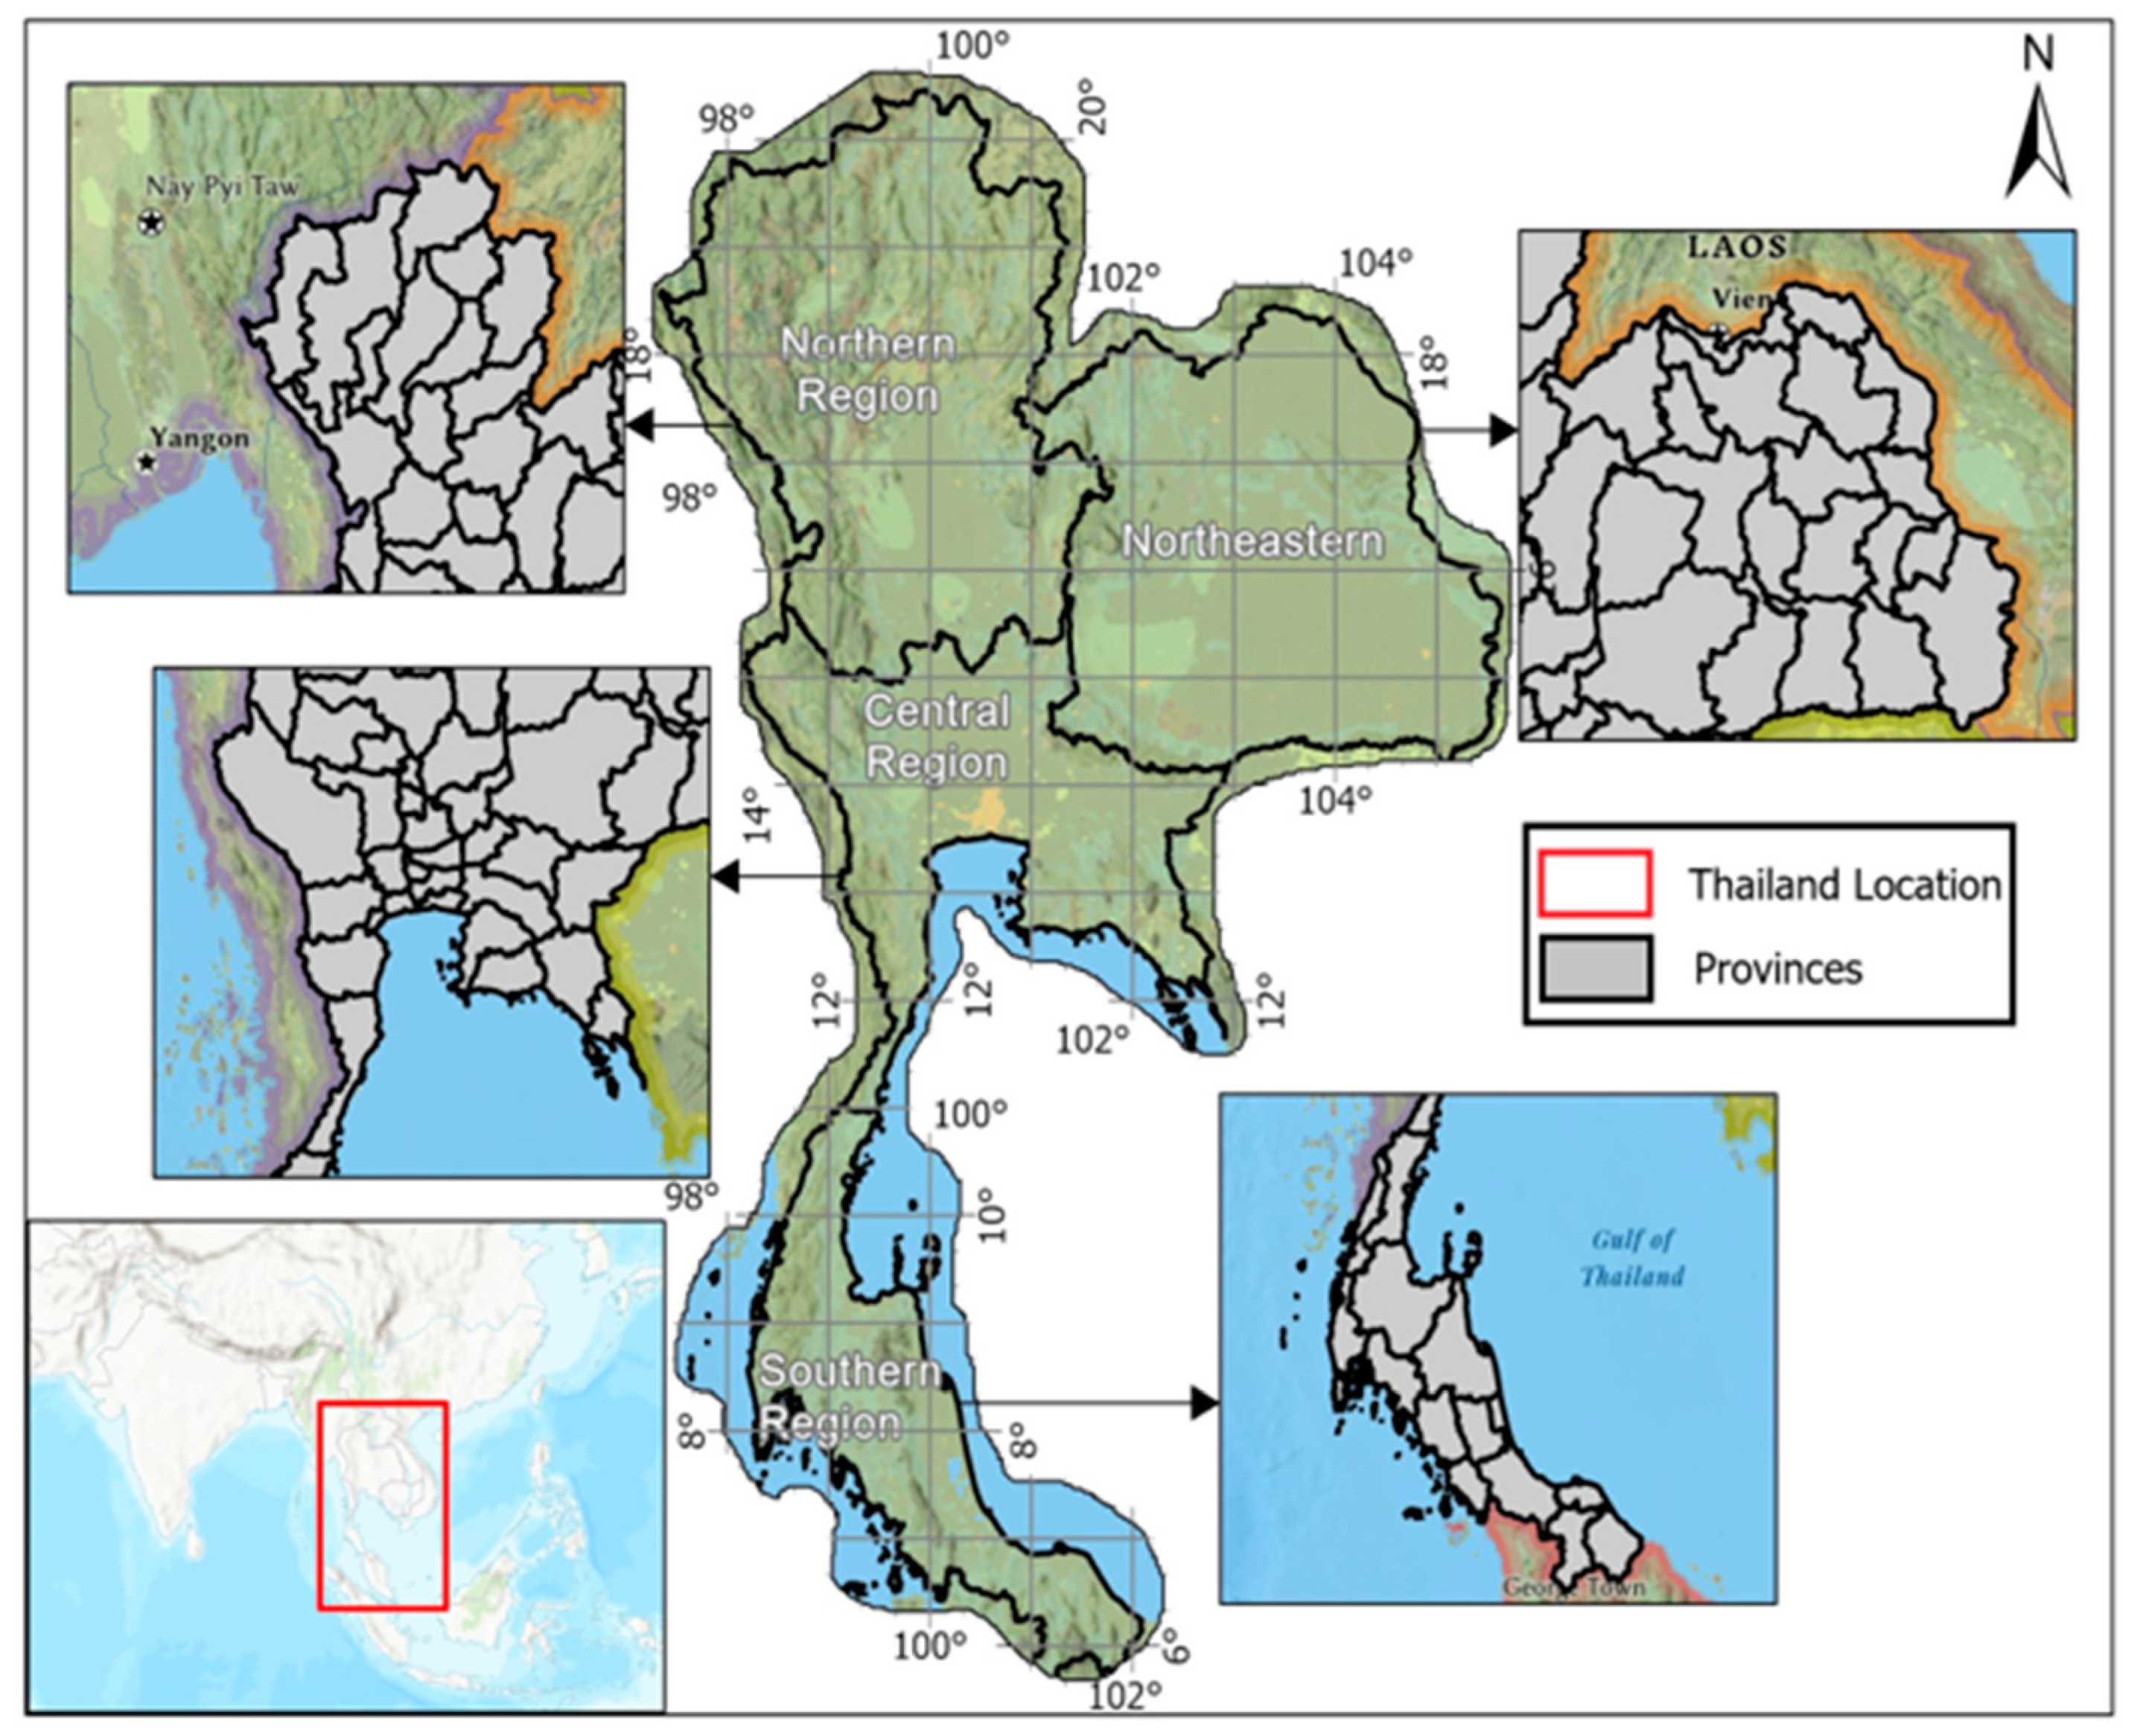
2.1. Study Area

Thailand is a Southeast Asian country situated at latitude 15°52′12″ N and longitude 100°59′33″ E with an altitude ranging from 0~2500 m. The average annual temperature and precipitation of Thailand from 1991~2020 was 26.3 °C and 1542 mm, respectively [33]. Thailand is divided into 77 provinces and 4 regions, namely central, northern, northeastern, and southern regions as shown in Figure 1 [34]. The population of the whole kingdom as of 2020 was about 66.5 million, with a growth rate of 0.023% over 10 years, and the central region (including Bangkok) had a greater population than the other regions [34]. The GDP of Thailand in 2020 was 499.68 billion USD as compared to 126.39 billion USD in 2000 (https://data.worldbank.org/indicator/NY.GDP.MKTP.CD?locations=TH (accessed on 20 April 2023)). This suggests that the country is heading towards a higher rate of economic development.

2.2. Data Collection, Processing, and Analysis

In this study, the land cover datasets of 2000, 2005, 2010, 2015, and 2020 produced by Aerospace Information Research Institute, Chinese Academy of Sciences were adopted. These datasets were produced using the Landsat surface reflectance products with a 30 m resolution at a global scale. The impervious class in the dataset has an accuracy ranging from 73~91% at a global and regional scale [28,29]. Global and long-term coverage, suitable resolution and acceptable accuracy for the built-up class makes this dataset suitable for the monitoring and assessment of urbanization progress. Details regarding the dataset are given in Table S1. Administrative boundaries of Thailand in the form of a vector file were acquired from the Survey Department of Thailand. Provincial Census data of 2000, 2005, 2010, 2015, and 2020 were collected from the National Statistics Office of Thailand. The relationship between the LCR and PGR from 2000 to 2020 for all the provinces in Thailand was tested using Pearson’s correlation coefficient [9,12,25,35,36] and the average growth rate of the built-up area at the regional level of Thailand was computed in SPSS 22 [21,22].

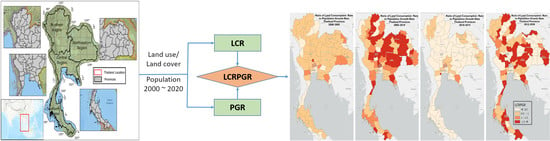
2.3. Evaluation of Urbanization Index: LCR, PGR, and LCRPGR

LCR as an indicator of urbanization shows the varying index value as per the intensity of built-up area expansion. An LCR value over zero indicates a positive change in the expansion of urban land, while a value below zero represents a decrease in urban land compared to the previous years. In this study, the method recommended in [13,37]. was used to calculate LCRs at the province level in Thailand. The workflow of this calculation is given in Figure S1. The obtained built-up classes were calculated as units per square kilometer and were divided into urban, sub-urban and rural classes based on the built-up density. Specifically, the land surface with a built-up coverage less than 20% was referred to as a rural area, ranging between 25~50% was a sub-urban area, and above 50% was defined as an urban area (UN-Habitat, 2018;). Fringe open spaces, i.e., areas within 100 m of urban and sub-urban areas, were identified and included in the urbanization extent. After obtaining the urbanization extent of the initial and final year, the average LCR within the period was calculated for each province using the following equation [37]:
L C R = L N   U r b t 2 U r b t 1   Δ t
where Urbt1 is the total urbanization extent (i.e., urban, sub-urban, and fringe open spaces) in the initial year, Urbt2 is the urbanization extent in the end year, and Δt is the duration within which the LCR is calculated.
PGR is the population growth compared to previous years. A PGR value over zero depicts a positive trend in population growth, while a value below represents a negative population growth. Population data at sub-district level were used to calculate the urban population in each province in Thailand. Since the urban population (population living in urban, sub-urban and fringe open spaces) was needed to calculate PGR, a dasymetric mapping technique was adopted to distribute the population data at the sub-district level into 30 × 30 m pixels. Based on [38], the population count at the sub-district level was divided among all land cover pixels based on the built-up density and habitability of a land cover class. For the appropriate assignment of population count per pixels, relative weights were used [39,40,41]. and are provided in Table S2.
The area of each land cover type and total area were calculated in each sub-district as shown in Figure S2. After that, the proportion of each land cover type was calculated in each sub-district. The expected population per sub-district was calculated based on the proportion of land cover types in each sub-district and relative weights were assigned to each land cover class [13].
E x p e c t e d   P o p . = P r o p o r t i o n   o f   L C × R w
The expected population of a sub-district/census unit is equal to the sum of the proportion of each land cover type multiplied by their relative weights (Rw). Finally, the population per pixel was calculated as shown in Figure S3 using the following equation [13]:
P o p .   p e r   p i x e l = R w × P o p .   C o u n t × P i x e l   s i z e E x p e c t e d   P o p . × A r e a   o f   T o t a l   L C   p i x e l s
The result from this method was a raster with a 30 m spatial resolution in which each pixel value represented the population count. Using this raster, population was identified for the urbanization extents and then aggregated for each province to calculate PGR as [13]:
P G R = L N P o p t 2 P o p t 1   Δ t
where Popt1 is the total population in the initial year, Popt2 is the total population in the end year, and Δt is the period within which PGR is calculated. The land use efficiency, LCRPGR, is calculated as [13]:
L C R P G R = L a n d   C o n s u m t i o n   R a t e   L C R P o p u l a t i o n   g r o w t h   r a t e   P G R

2.4. Built-Up Change Rate

The extracted built-up area was applied to calculate the average annual built-up growth rate at different intervals as follows [21]:
B U   c h a n g e   r a t e = B U t 2 B U t 1 B U t 1 × 100   Δ t
where BUt2 is the built-up area at time t2, BUt1 is the built-up area in the previous year (t1), and Δt is the difference between t2 and t1. This analysis could provide details of the average built-up area change rate at different intervals in all the regions of Thailand, and is the basis for supporting the former analysis on the LCR, PGR and LCRPGR [21,22]. The analysis is usually supported by the existence of some statistical relationships between the variables [42].

3. Results and Discussion

3.1. Spatio-Temporal Variations in LCR and PGR

The LCR and PGR calculated for all provinces in Thailand within the studied periods, i.e., 2000~2005, 2005~2010, 2010~2015, and 2015~2020, are profiled in Figure 2. The results present a varied intensity of built-up area expansion. During 2000~2005, urban expansion in almost all provinces experienced a higher rate with LCRs generally above 0.04. Moving from 2000~2005 to 2015~2020, the built-up area expansion experienced a continuous declining trend. The high-LCR area decreased from covering almost the entire nation to central, northeast, east and south, to central and east. Only the eastern region maintained a high rate of urban land expansion over the past 20 years. A report of [43] indicates that the eastern region of Thailand is concentrated with the development of major industries and has the highest regional per capita income (gross regional product of 7.6 during 1981~2013, compared to Bangkok with 5.5 GRP during the same period). The spatial imbalance in the LCR is attributed to the industrial policy and other related policies of Thailand.
Similarly, the PGR was very high (>0.05) during 2000~2005, which then showed a declining trend, except during 2010~2015 where an obvious massive increase was recorded. The proportion of the aged population over 60 increased from 13.1% in 2005 to 16.6% in 2010, indicating a declining fertility rate and migration in search of better opportunities [44], because of which the PGR decreased during 2005~2010. Meanwhile, from 2010~2015, the PGR showed a large increase across the country. The urban population of Thailand rose by 11.6% between 2010 and 2015, while the rural population increased by 0.8%. The International Organization for Migration revealed that international migration to Thailand rose by 10% between 2010 and 2015 [45]. Additionally, the birth rate exceeded the death rate during 2010~2015 [46]. This led to a massive increase in the PGR in 2010–2015. However, the period 2015 to 2020 was accompanied by a significant decreasing trend in population growth for more than 20 provinces, while other provinces had comparable or slightly higher growths (http://statbbi.nso.go.th/staticreport/page/sector/en/01.aspx (accessed on 22 April 2023)), and COVID-19 in 2020 further caused migration and scattering of the population.
The PGR value of many provinces in Thailand was found to be higher than the LCR during the same period, contrary to previous studies in developing countries [12,18]. This could have exerted more pressure on the limited land resources and infrastructure including land, water and forest, leading to environmental degradation. It also demonstrates the need for comprehensive urban planning in Thailand and its provinces, ensuring the equitable distribution of infrastructure and services. However, it cannot be generalized that the LCR is always greater than the PGR [9,20,25]); it is influenced by multiple of factors including demography and economic development. East Asia, including Thailand, alone is 27% GDP by manufacturing, where a strong positive correlation exists between GDP and the urban land use proportion, which also drives urbanization [47].
Even though the index values of LCR and PGR were different, the PGR followed a similar trend to that of the LCR in the respective years, which at a glance shows that with the increase in population, the built-up area in the provinces increased simultaneously. The statistical test for the correlation between the LCR and PGR in Thailand showed their significant positive correlation for all the year intervals, except for 2015~2020 (Table S3), which is consistent with a few studies in China [12,35].This finding implies that the PGR or population density could be used as an important predictor variable in spatially projecting the built-up area expansion (Estoque et al., 2021). Unlike developing countries such as China and Thailand, developed countries and their cities may not experience a positive correlation in all cases. This is demonstrated by the study in Opole City, Poland, where a strong negative correlation existed between the LCR and PGR from 2000~2010 [25].This indicates that those areas are accompanied by a higher land use per capita and need effective policies for regulating population growth and distribution and enhancing land use efficiency.

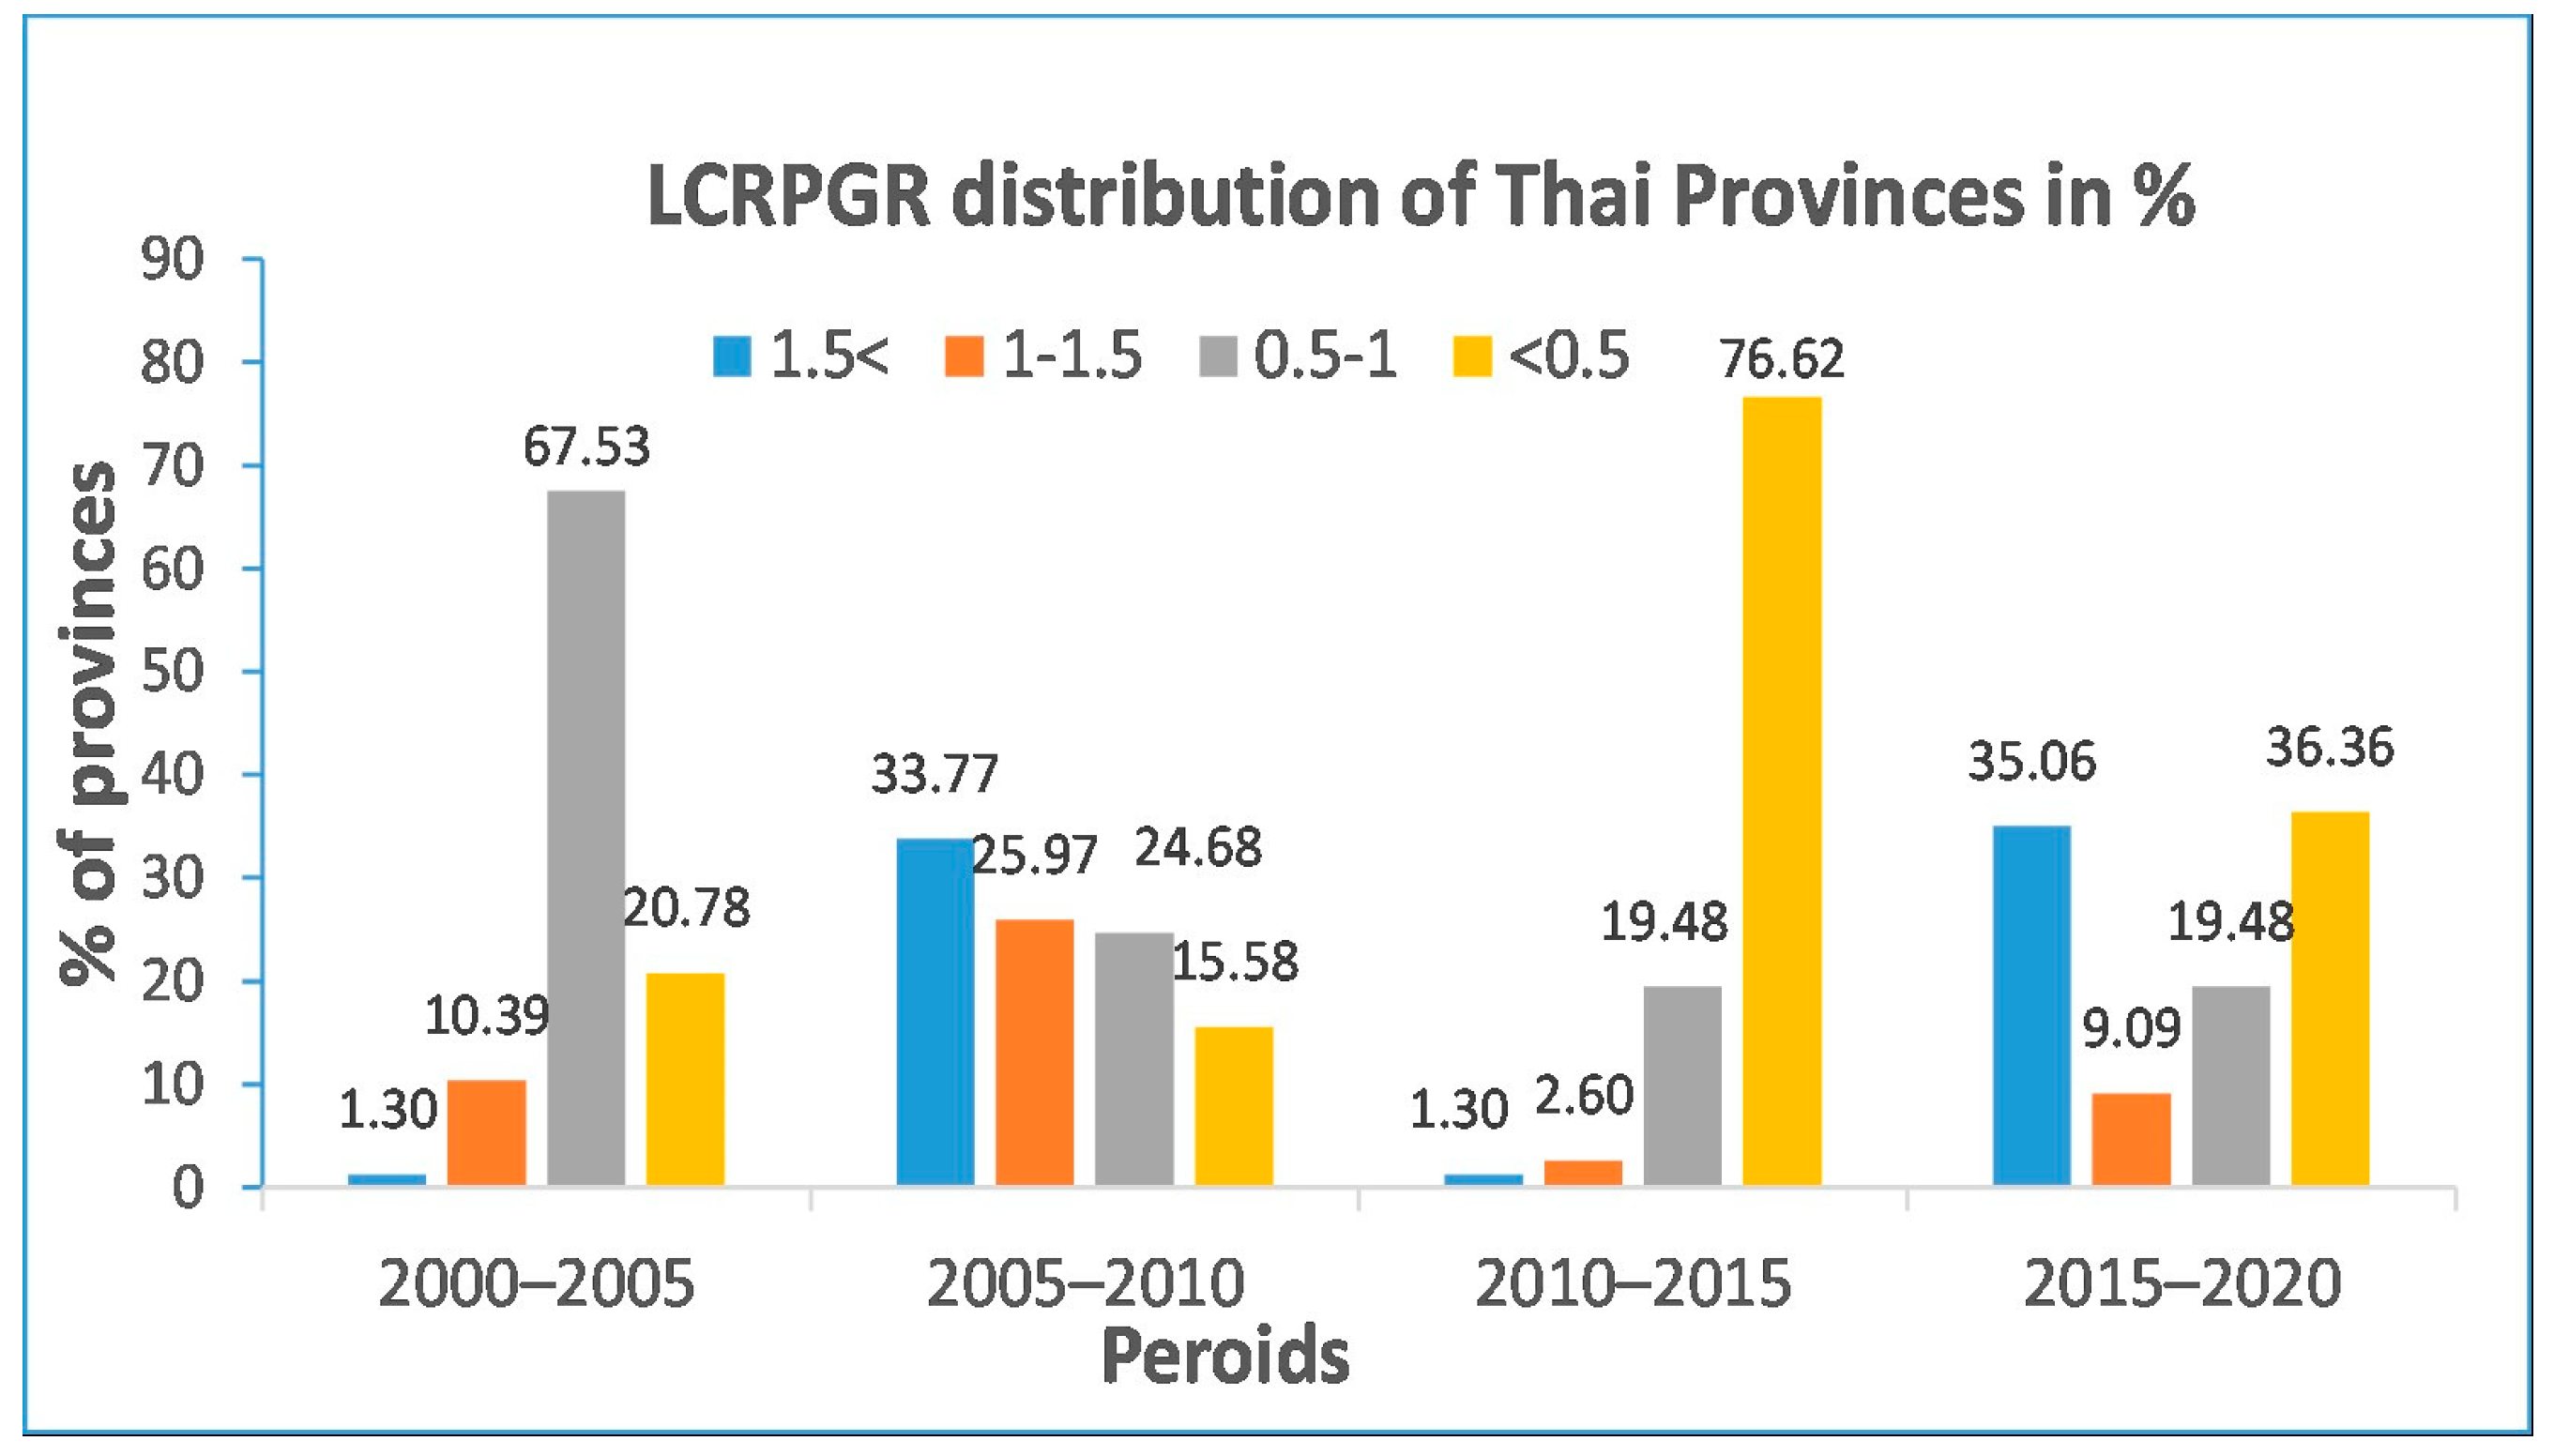
3.2. Spatio-Temporal Variations in LCRPGR

The average LCRPGR value of Thailand was 0.70 in 2000~2005, which increased to 1.6 between 2005 and 2010, demonstrating the increasing land expansion rate in the urban areas compared to the PGR (Figure 3). This indicates inefficient land use in the region that could have environmental as well as socio-economic implications such as changes in land prices and the affordability of housing. It suggests that there is an urgent need for better land use planning and appropriate management strategies in the country to promote the efficient use of land resources. An LCRPGR ratio between 0 and 1 represents a relatively constant land expansion and population growth rate, where the population growth is higher than the consumption of land, indicating a less efficient LCRPGR. Ideally, an LCRPGR ratio around one indicates a good balance between urban expansion and the population growth rate. The LCRPGR decreased to 0.40 in the years 2010~2015, implying that the PGR outstripped the urban expansion rate. During 2010~2015, almost all the provinces experienced an extremely larger PGR than that of urban expansion, showing a higher urban compactness due to population growth. From 2015~2020, in most provinces, inefficient land use was observed as the expansion of urban land was significantly higher than the population growth rate.
During the period of 2000~2005, the proportion of provinces occupying the top positions were 0.5 < LCRPGR ≤ 1 (67.53%), followed by LCRPGR ≤ 0.5 (20.78%), 1 < LCRPGR ≤ 1.5 (10.4%) and LCRPGR > 1.5 (1.3%), respectively, as shown in Figure 4. In these four different studied periods, the proportions of the provinces with LCRPGR > 1 first increased to 2005~2010, which again declined in 2010~2015, followed by a massive increase during 2015~2020, whereas the proportion of number of provinces with LCRPGR < 1 first declined in 2005~2010, followed by large increases in 2010~2015 and was then somewhat relatively constant until 2015~2020. During 2015~2020, the significant differences in the LCRPGRs among provinces were observed as LCRPGR ≤ 0.5 (36.36%), followed by LCRPGR > 1.5 (35%), 0.5 < LCRPGR ≤ 1 (19.48%), and 1 < LCRPGR ≤ 1.5 (9%).
The noteworthy fact was that an increasing proportion of the provinces exhibited inefficient land use disproportionately to the PGR in the recent years. This is consistent with the study by [15] conducted at the city level of China, but the present study focused on a provincial level. For instance, Phuket province of Thailand had an LCRPGR of 0.38 during 2000~2005, which showed a spontaneous decreasing trend in the subsequent intervals with an LCRPGR of 0.37 in 2005~2010, 0.22 during 2010~2015 and 0.16 during 2015~2020. This value indicates a highly compact population throughout the studied periods since Phuket province experienced a rapid PGR higher than 7% per annum between 2000 and 2020 [34]. A surging population at this level in the province could exceed its carrying capacity, leading to the exploitation and degradation of land resources with many socio-economic implications. In Lop Buri province of Thailand, the LCRPGR showed an irregular increasing and decreasing trend in different periods, as the LCRPGR during 2000~2005 was 0.9 and rose to 1.2 in the period 2005~2010, followed by a large decrease to 0.51 during 2010~2015, which was then dominated by increasing values with an LCRPGR of 2.1 during 2015~2020. This demonstrates the fact that some periods were dominated by a high per capita land use consumption, while some by a higher degree of urban compactness and population growth rate, which was influenced by multiple of factors such as economic development and land use policy [9,48]. A majority of the provinces showed either a very high degree of urban compactness or a low degree of compactness with higher PGR in all the studied intervals, while a minority of the provinces showed a relatively stable land use efficiency leading to stability. The disproportionate growth of urban land in comparison to the population growth is due to economic development, which can lead to higher land purchasing power and a high per capita land use consumption [9,48]. Moreover, urban land use policy has been proven to play a crucial role in the urbanization patterns and processes of a country [9,15], which could be expected in the case of Thailand as well. Built-up space expansion should thus be maintained relative to the population in order to achieve efficient land use and implement the SDG 11.3, including other integrated SDGs.
Spatially, the central region of Thailand generally maintained high LCRPGRs over the study periods, with LCRPGR values computed as 0.78, 1.16, 0.55, and 1.32, sequentially (Table 1). An exception was observed during the period of 2005~2010, where the whole nation presented a high LCRPGR with an average of 1.59, and the central region was surpassed by the other regions. Since the central region was dominated by greater economic growth and development, it generally showed a higher value of LCRPGR throughout all the periods, indicating higher urbanization and population growth rates in the region. The easternmost part of Thailand in general maintained a higher LCRPGR, which indicates rapid urban expansion due to faster industrialization in the region [43]. The highly economic hub of the country, Bangkok recorded a relatively low LCRPGR throughout all the studied periods (2000~2020). This is because the significant urbanization in Bangkok occurred between the 1960s and 1990s [49].Moreover, the change in built-up area could be influenced by the adoption of some plans and policies impacting the land use type, industrialization, and economy of a country and its provinces. According to [50], the rapid urban expansion in Thailand can be attributed to the country’s adaptation of the National Economic and Social Development Plan, which put a greater emphasis on industrial development as opposed to agricultural production. Although land use policy (1997~2016) contributed somewhat to improved urbanization by increasing participation and consultation, improving the land use database, and improving land planning and management, it could not achieve significant progress due to its weak enforcement and land inequality issues in rural areas, which was in the hands of a few elite groups. Additionally, the policy could not incorporate the urban issues of informal settlements or balance competing land uses. The shortcomings of the National Land Use Policy (1997~2016) led to the formation of the National Land Use Policy (2017~2036) that aimed to address these challenges and promote sustainable and equitable land use practices in Thailand, with a focus on social and economic dimensions as well.

3.3. Built-Up Area Expansion Rate

The average built-up area growth rate of Thailand and its four different regions from 2000~2020, over 5-year intervals, showed a similar pattern of built-up area growth. The average annual growth rate of the built-up area for the whole kingdom in the 20-year interval (2000~2020) was 3.54%, whereas over the 5-year intervals, the highest growth rate was recorded as 3.99% in 2000~2005, and the lowest as 1.65% in 2015~2020. As in Figure 5, at the regional level of the kingdom, the central region dominated in terms of the higher rate of built-up area expansion in the majority of the studied intervals, which ranged from 1.68% to 3.86%. This is consistent with the study by [35], where the South of Bangkok and its vicinity had a higher urban expansion rate between 2000 and 2020. Likewise, the northern, northeastern, and southern regions experienced a similar annual average increase in built-up area, with values of 1.5~4.37%. A commonly observed trend in all the regions, including the whole kingdom, was that the average annual built-up expansion rate successively decreased in subsequent intervals, i.e., the region has experienced a reduction in the built-up area growth rate in recent years. The rate of urbanization in the more developed region between 2000 and 2020 (projection) ranged between a 0.24~0.43% average annual growth rate, while less developed regions experienced a growth rate of 1~1.46%, with the reduction in growth rate increasing over time [51], which is similar to a study conducted in Thailand that identified a decreasing trend in the growth of the built-up area in recent years. The LULC maps of Thailand for the years 2000, 2005, 2010, 2015 and 2020 are provided in Figure S4. The rate of urbanization in China showed an increasing trend in 1995~2010, and then showed a declining trend during 2010~2015, which shows that the urbanization rate decreased in China after 2010 [19]. However, a study in Romania [21] contradicts this study, as the built-up area growth rate has increased in recent years. During the 2015~2020 interval in Romania, the average annual built-up area growth rates were moderate in all metropolitan areas, ranging between 0.28~1.18% [21], and was lower than the average growth rate of the different regions of Thailand during the same interval.

4. Conclusions

This study assessed the land use efficiency of Thailand at the regional and provincial level by adopting the methodology developed by UN-Habitat for calculating SDG 11.3.1. The global land cover data (GLC_FCS30) of 2000, 2005, 2010, 2015, and 2020, and census population data during the same period of Thailand were used to calculate the LCR, PGR, and LCRPGR, and to analyze their correlations over 5-year intervals in all the Thai provinces and regions for the first time in the country. Urban expansion was disproportionate with the PGR across the spatio-temporal dimensions, illustrating that the majority of provinces were dominated by higher urban compactness, urban shrinkage or high urban land use per capita, and a minority of provinces showed relatively stable land use efficiency leading to stability. The LCR may not always be greater than the PGR, and it cannot be generalized, since the higher or lower value is determined by multiple factors including demography (birth rate, death rate, migration) and economic development. Developing countries such as Thailand and its provinces experienced positive correlation between the LCR and PGR, which may not be true in the case of developed areas/cities where population shrinkage is prevalent. Furthermore, a significant positive correlation was observed between the LCR and PGR in all the studied periods except for 2015~2020, which implies that the PGR can be used as an important predictor in spatially projecting the built-up area expansion across the country and regions.
During the period of 2000~2005, the proportion of provinces occupying the top positions was 0.5 < LCRPGR ≤ 1 (67.53%), followed by LCRPGR ≤ 0.5 (20.78%), 1 < LCRPGR ≤ 1.5 (10.4%) and LCRPGR > 1.5 (1.3%), respectively. Meanwhile, during 2015~2020, the significant differences in the LCRPGR of provinces were observed as LCRPGR ≤ 0.5 (36.36%), followed by LCRPGR > 1.5 (35%), 0.5 < LCRPGR ≤ 1 (19.48%) and 1 < LCRPGR ≤ 1.5 (9%), revealing the urgency to regulate urban expansion and population growth in Thai provinces. At the regional scale, the central region was dominated by the highest average LCRPGR of 0.78, 0.55 and 1.32 during the periods 2000~2005, 2010~2015 and 2015~2020, respectively. A notably observed trend in all the regions of the kingdom was that the average annual built-up expansion rate successively decreased in subsequent intervals, i.e., the region has experienced a reduction in the built-up area growth rate in recent years, indicating that urban areas are moving towards saturation, as well as the influence of economic, demographic and policy factors.
This study provides valuable insights into the urbanization process and its relationship with population growth, enabling urban planners and decision makers to reassess and enforce urban planning policies and make informed decisions on future development strategies. To achieve balanced land use efficiency in Thailand, policymakers are suggested to promote the redevelopment of underutilized areas, equitable infrastructure development, and economic opportunities. Additionally, the formulation of sustainable land use policies at different regional and provincial levels should take into account the present findings regarding urban expansion and population dynamics. These efforts can optimize land resource utilization and foster sustainable and equitable land use practices throughout the country. Further research is recommended to expand the study to the city/municipality level in Thailand, providing more comprehensive information on the urbanization process and its patterns. Future studies should also consider different factors influencing urbanization and population growth while reviewing land use policies, aiming for the overall sustainable development of the country.

Supplementary Materials

The supporting information can be downloaded at: https://www.mdpi.com/article/10.3390/su15129794/s1.

Author Contributions

R.B.: Conceptualization, Methodology, Formal analysis, Investigation, Writing—original draft, Review and editing. W.X.: Conceptualization, Resources, Supervision, Writing—original draft, Writing—review & editing, Project administration, Funding acquisition. S.G.P.V.: Methodology, Writing—review & editing. E.W.: Writing—review & editing. T.P.L.N.: Writing—review & editing. S.J.: Formal analysis. All authors have read and agreed to the published version of the manuscript.

Funding

This research was funded by The National Research Council of Thailand, grant number (168/25).

Institutional Review Board Statement

Not applicable.

Informed Consent Statement

Not applicable.

Data Availability Statement

Data will be made available on request.

Acknowledgments

The authors would like to acknowledge the Aerospace Information Research Institute, Chinese Academy of Sciences for providing the Global Land Cover Fine Classification System land cover dataset.

Conflicts of Interest

The authors declare no conflict of interest.

References

  1. Ritchie, H.; Roser, M. Urbanization. Our World in Data. 2018. Available online: https://ourworldindata.org/urbanization (accessed on 18 March 2023).
  2. Seto, K.C.; Parnell, S.; Elmqvist, T. A global outlook on urbanization. In Urbanization, Biodiversity and Ecosystem Services: Challenges and Opportunities: A Global Assessment; Springer: Berlin/Heidelberg, Germany, 2013; pp. 1–12. [Google Scholar]
  3. Elvidge, C.D.; Sutton, P.C.; Wagner, T.W.; Ryzner, R.; Vogelmann, J.E.; Goetz, S.J.; Nemani, R. Land Change Science: Observing, Monitoring and Understanding Trajectories of Change on the Earth’s Surface; Springer Science & Business Media: Berlin/Heidelberg, Germany, 2004; pp. 315–328. [Google Scholar]
  4. McDonald, R.I.; Mansur, A.V.; Ascensão, F.; Crossman, K.; Elmqvist, T.; Gonzalez, A.; Ziter, C. Research gaps in knowledge of the impact of urban growth on biodiversity. Nature Sustain. 2020, 3, 16–24. [Google Scholar] [CrossRef]
  5. Estoque, R.C.; Murayama, Y. Quantifying landscape pattern and ecosystem service value changes in four rapidly urbanizing hill stations of Southeast Asia. Landsc. Ecol. 2016, 31, 1481–1507. [Google Scholar] [CrossRef]
  6. Wang, L.; Li, C.; Ying, Q.; Cheng, X.; Wang, X.; Li, X.; Hu, L.; Liang, L.; Xu, L.; Huang, H.; et al. China’s urban expansion from 1990 to 2010 determined with satellite remote sensing. Chin. Sci. Bull. 2012, 57, 2802–2812. [Google Scholar] [CrossRef] [Green Version]
  7. Schiavina, M.; Melchiorri, M.; Corbane, C.; Florczyk, A.J.; Freire, S.; Pesaresi, M.; Kemper, T. Multi-scale estimation of land use efficiency (SDG 11.3.1) across 25 years using global open and free data. Sustainability 2019, 11, 5674. [Google Scholar] [CrossRef] [Green Version]
  8. United Nations. Critical Milestones Towards a Coherent, Efficient, and Inclusive Follow-Up and Review of the 2030 Agenda at the Global Level. 2015. Available online: http://www.un.org/ga/search/view_doc.asp?Symbol=A/69/L.85%Lang=E (accessed on 2 February 2023).
  9. Estoque, R.C.; Ooba, M.; Togawa, T.; Hijioka, Y.; Murayama, Y. Monitoring global land-use efficiency in the context of the UN 2030 Agenda for Sustainable Development. Hab. Int. 2021, 115, 102403. [Google Scholar] [CrossRef]
  10. Zoomers, A.; Van Noorloos, F.; Otsuki, K.; Steel, G.; Van Westen, G. The rush for land in an urbanizing world: From land grabbing toward developing safe, resilient, and sustainable cities and landscapes. World Dev. 2017, 92, 242–252. [Google Scholar] [CrossRef]
  11. Shehu, P.; Rikko, L.S.; Azi, M.B. Monitoring urban growth and changes in land use and land cover: A strategy for sustainable urban development. Int. J. Hum. Cap. Urban Manag. 2023, 8, 111–126. [Google Scholar]
  12. Wang, Y.; Huang, C.; Feng, Y.; Zhao, M.; Gu, J. Using earth observation for monitoring SDG 11.3.1-ratio of land consumption rate to population growth rate in Mainland China. Remote Sens. 2020, 12, 357. [Google Scholar] [CrossRef] [Green Version]
  13. UN-Habitat. Module 3 Indicator 11.3.1 Land Consumption Rate to Population Growth Rate. 2018. Available online: https://www.unescap.org/sites/default/files/Module%203_Land%20Consumption%20Rate%20to%20Population%20Growth%20Rate%20for%20indicator%2011.3.pdf (accessed on 5 November 2022).
  14. Ling, Z.; Jiang, W.; Lu, Y.; Ling, Y.; Zhang, Z.; Liao, C. Continuous Long Time Series Monitoring of Urban Construction Land in Supporting the SDG 11.3.1—A Case Study of Nanning, Guangxi, China. Land 2023, 12, 452. [Google Scholar] [CrossRef]
  15. Jiang, H.; Sun, Z.; Guo, H.; Weng, Q.; Du, W.; Xing, Q.; Cai, G. An assessment of urbanization sustainability in China between 1990 and 2015 using land use efficiency indicators. Npj Urb. Sustain. 2021, 1, 1–13. [Google Scholar] [CrossRef]
  16. UN Habitat Programme. Tracking Progress towards Inclusive, Safe, Resilient and Sustainable Cities and Human Settlements, SDG 11 Synthesis Report, High Level Political Forum; United Nations: New York, NY, USA, 2018. [Google Scholar]
  17. Schiavina, M.; Melchiorri, M.; Freire, S.; Florio, P.; Ehrlich, D.; Tommasi, P.; Kemper, T. Land use efficiency of functional urban areas: Global pattern and evolution of development trajectories. Hab. Int. 2022, 123, 102543. [Google Scholar] [CrossRef] [PubMed]
  18. Wang, Y.; Li, B. The Spatial Disparities of Land-Use Efficiency in Mainland China from 2000 to 2015. Int. J. Environ. Res. Pub. Health 2022, 19, 9982. [Google Scholar] [CrossRef] [PubMed]
  19. Song, W.; Cao, S.; Du, M.; Lu, L. Distinctive roles of land-use efficiency in sustainable development goals: An investigation of trade-offs and synergies in China. J. Clean. Prod. 2023, 382, 134889. [Google Scholar] [CrossRef]
  20. Li, C.; Cai, G.; Du, M. Big Data supported the identification of urban land efficiency in Eurasia by indicator SDG 11.3.1. ISPRS Int. J. Geo-Info. 2021, 10, 64. [Google Scholar] [CrossRef]
  21. Holobâcă, I.H.; Benedek, J.; Ursu, C.D.; Alexe, M.; Temerdek-Ivan, K. Ratio of Land Consumption Rate to Population Growth Rate in the Major Metropolitan Areas of Romania. Remote Sens. 2022, 14, 6016. [Google Scholar] [CrossRef]
  22. Koroso, N.H.; Lengoiboni, M.; Zevenbergen, J.A. Urbanization and urban land use efficiency: Evidence from regional and Addis Ababa satellite cities, Ethiopia. Habit. Int. 2021, 117, 102437. [Google Scholar] [CrossRef]
  23. Calka, B.; Orych, A.; Bielecka, E.; Mozuriunaite, S. The ratio of the land consumption rate to the population growth rate: A framework for the achievement of the spatiotemporal pattern in Poland and Lithuania. Remote Sen. 2022, 14, 1074. [Google Scholar] [CrossRef]
  24. Jalilov, S.M.; Chen, Y.; Quang, N.H.; Nguyen, M.N.; Leighton, B.; Paget, M.; Lazarow, N. Estimation of urban land-use efficiency for sustainable development by integrating over 30-year landsat imagery with population data: A case study of Ha Long, Vietnam. Sustainability 2021, 13, 8848. [Google Scholar] [CrossRef]
  25. Wiatkowska, B.; Słodczyk, J.; Stokowska, A. Spatial-temporal land use and land cover changes in urban areas using remote sensing images and GIS analysis: The case study of Opole, Poland. Geosciences 2021, 11, 312. [Google Scholar] [CrossRef]
  26. Cai, G.; Zhang, J.; Du, M.; Li, C.; Peng, S. Identification of urban land use efficiency by indicator-SDG 11.3.1. PLoS ONE 2020, 15, e0244318. [Google Scholar] [CrossRef]
  27. Mudau, N.; Mwaniki, D.; Tsoeleng, L.; Mashalane, M.; Beguy, D.; Ndugwa, R. Assessment of SDG indicator 11.3.1 and urban growth trends of major and small cities in South Africa. Sustainability 2020, 12, 7063. [Google Scholar] [CrossRef]
  28. Wang, H.; Yan, H.; Hu, Y.; Xi, Y.; Yang, Y. Consistency and Accuracy of Four High Resolution LULC Datasets—Indochina Peninsula Case Study. Land 2022, 11, 758. [Google Scholar] [CrossRef]
  29. Zhang, X.; Liu, L.; Chen, X.; Gao, Y.; Xie, S.; Mi, J. GLC_FCS30: Global land-cover product with fine classification system at 30 m using time-series Landsat imagery. Earth Sys. Sci. Data 2021, 13, 2753–2776. [Google Scholar] [CrossRef]
  30. Giri, C.; Pengra, B.; Long, J.; Loveland, T.R. Next generation of global land cover characterization, mapping, and monitoring. Int. J. App. Earth Observ. Geoinfo. 2013, 25, 30–37. [Google Scholar] [CrossRef]
  31. Herold, M.; Woodcock, C.E.; Di Gregorio, A.; Mayaux, P.; Belward, A.S.; Latham, J.; Schmullius, C.C. A joint initiative for harmonization and validation of land cover datasets. IEEE Trans. Geosci. Remote Sens. 2006, 44, 1719–1727. [Google Scholar] [CrossRef]
  32. Statista. Share of the urban population in Thailand from 2010 to 2021. 2012. Available online: https://www.statista.com/statistics/761131/share-of-urban-population-thailand/ (accessed on 2 February 2023).
  33. Climate Change Knowledge Portal (CCKP, 2021). Thailand Climate Data: Historical. Available online: https://climateknowledgeportal.worldbank.org/country/thailand/climate-data-historical (accessed on 8 April 2023).
  34. National Statistical Office. Number of Population from Population and Housing Census by Sex, age group Region, Province and Area (Conducted Every 10 Years) for 2000, 2010 and 2020 respectively. 2023. Available online: http://statbbi.nso.go.th/staticreport/page/sector/en/01.aspx (accessed on 26 April 2023).
  35. Wang, Y.; Li, B.; Xu, L. Monitoring Land-Use Efficiency in China’s Yangtze River Economic Belt from 2000 to 2018. Land 2022, 11, 1009. [Google Scholar] [CrossRef]
  36. Franzese, M.; Iuliano, A. Correlation analysis. Encyclop. Bioinfo. Comput. Bio. 2019, 1, 706–721. [Google Scholar]
  37. UN-Habitat. SDG Indicator 11.3.1 Training Module: Land Use Efficiency. 2018. Available online: https://unhabitat.org/sites/default/files/2021/08/indicator_11.3.1_training_module_land_use_effiiency.pdf (accessed on 5 November 2022).
  38. Holloway, S.; Schumacher, J.; Redmond, R. People and Place: Dasymetric Mapping Using Arc/Info. Cartographic Design Using ArcView and ARC/INFO. High Mountain Press, NM. 1997. Available online: http://pdi.topografia.upm.es/mab/apuntesalumnos/Para%20tema7.PDF (accessed on 5 November 2022).
  39. Bagheri, M.; Zaiton Ibrahim, Z.; Mansor, S.; Manaf, L.A.; Akhir, M.F.; Talaat WI, A.W.; Beiranvand Pour, A. Land-use suitability assessment using Delphi and analytical hierarchy process (D-AHP) hybrid model for coastal city management: Kuala Terengganu, Peninsular Malaysia. ISPRS Int. J. Geo-Info. 2021, 10, 621. [Google Scholar] [CrossRef]
  40. Chaudhary, P.; Chhetri, S.K.; Joshi, K.M.; Shrestha, B.M.; Kayastha, P. Application of an Analytic Hierarchy Process (AHP) in the GIS interface for suitable fire site selection: A case study from Kathmandu Metropolitan City, Nepal. Socio-Eco. Plan. Sci. 2016, 53, 60–71. [Google Scholar] [CrossRef]
  41. Mithun, S.; Sahana, M.; Chattopadhyay, S.; Chatterjee, S.; Islam, J.; Costache, R. Comparative framework for spatially explicit urban growth modeling for monitoring urban land-use efficiency and sustainable urban development (SDG 11.3.1): A study on Kolkata metropolitan area, India. Geocar. Int. 2022, 37, 17933–17970. [Google Scholar] [CrossRef]
  42. Herman, G.V.; Grama, V.; Ilieș, A.; Safarov, B.; Ilieș, D.C.; Josan, I.; Buzrukova, M.; Janzakov, B.; Privitera, D.; Dehoorne, O.; et al. The Relationship between Motivation and the Role of the Night of the Museums Event: Case Study in Oradea Municipality, Romania. Sustainability 2023, 15, 1738. [Google Scholar] [CrossRef]
  43. Asian Development Bank. Thailand: Industrialization and Economic Catch-Up. 2015. Available online: https://www.adb.org/sites/default/files/publication/178077/tha-industrialization-econ-catch.pdf (accessed on 2 February 2023).
  44. World Population Prospects. 2012. Available online: https://population.un.org/wpp/Publications/Files/WPP2012_HIGHLIGHTS.pdf (accessed on 22 April 2023).
  45. Thailand Migration Report. 2019. Available online: https://thailand.iom.int/sites/g/files/tmzbdl1371/files/documents/Thailand%2520Report%25202019_22012019_LowRes.pdf (accessed on 21 April 2023).
  46. Statistical Year Book of Thailand. 2018. Available online: http://service.nso.go.th/nso/nsopublish/pubs/e-book/SYB-2561/index.html (accessed on 21 April 2023).
  47. Henderson, J.V.; Turner, M.A. Urbanization in the developing world: Too early or too slow? J. Econo. Perspec. 2020, 34, 150–173. [Google Scholar] [CrossRef]
  48. Angel, S.; Blei, A.M.; Parent, J.; Lamson-Hall, P.; Galarza-Sanchez, N.; Civco, D.L.; Thom, K. Atlas of Urban Expansion, 2016 ed.; Lincoln Institute of Land Policy: Cambridge, MA, USA, 2016. [Google Scholar]
  49. Lambregts, B.; Panthasen, K.; Mancharem, S. Urbanisation in the Bangkok Metropolitan Region: Trends, Drivers and Challenges; TEI Working Paper; 2015; Volume 4. Available online: https://www.tei.or.th/thaicityclimate/public/work-20.pdf (accessed on 16 March 2023).
  50. Phuttharak, T.; Dhiravisit, A. Rapid Urbanization-Its Impact on Sustainable Development: A Case Study of Udon Thani, Thailand. Asi. Soc. Sci. 2014, 10, 70. [Google Scholar] [CrossRef] [Green Version]
  51. World Urbanization Prospects 2018. Available online: https://population.un.org/wup/publications/Files/WUP2018-Report.pdf (accessed on 22 April 2023).
Figure 1. Administrative boundary of Thailand.
Sustainability 15 09794 g001
Figure 2. Spatio-temporal variations in LCR and PGR in Thailand during 2000–2020.
Sustainability 15 09794 g002
Figure 3. Spatio-temporal variations in LCRPGR in Thailand during 2000–2020.
Sustainability 15 09794 g003
Figure 4. Relative distributions of LCRPGRs among Thai provinces.
Sustainability 15 09794 g004
Figure 5. Annual average growth rate of built-up space.
Sustainability 15 09794 g005
Table 1. Regional distributions of LCRPGR in Thailand.
RegionsLCRPGR
2000~20052005~20102010~20152015~2020
Central0.7881.1590.5521.326
Northern0.6641.5580.3640.802
Northeastern0.7461.7110.3841.119
Southern0.5891.9380.3171.241
Thailand0.6971.5910.4041.122
Disclaimer/Publisher’s Note: The statements, opinions and data contained in all publications are solely those of the individual author(s) and contributor(s) and not of MDPI and/or the editor(s). MDPI and/or the editor(s) disclaim responsibility for any injury to people or property resulting from any ideas, methods, instructions or products referred to in the content.

