

The Influence of Overburden Stress and Molding Water Content on the Microstructure of Remolded Loess
1
Key Laboratory of Shale Gas and Geoengineering, Institute of Geology and Geophysics, Chinese Academy of Sciences, Beijing 100029, China
2
Innovation Academy for Earth Science, Chinese Academy of Sciences, Beijing 100029, China
3
College of Earth and Planetary Sciences, University of Chinese Academy of Sciences, Beijing 100049, China
*
Author to whom correspondence should be addressed.
Sustainability 2023, 15(16), 12401; https://doi.org/10.3390/su151612401
Submission received: 20 June 2023
/
Revised: 3 August 2023
/
Accepted: 11 August 2023
/
Published: 15 August 2023
(This article belongs to the Special Issue Principle of Unsaturated Soil Mechanics for Sustainability in Engineering Practice)
Abstract
:This study aims to reveal the mechanisms of the microstructural evolution of remolded loess under different molding water contents and overburden stresses. Utilizing L6 loess from Yan’an, remolded soil specimens were fabricated under various pressures and moisture contents, followed by conducting one-dimensional consolidation tests. The macroscopic porosity, pore size distribution curves (PSD), and microstructure of these remolded loess samples were examined. Experimental findings indicate that an increase in molding water content leads to an augmentation in macroscopic pore volume and elongated pore shapes, concurrently exerting substantial influence on the primary pore size and pore volume of both macropores (>0.4 μm) and minipores (0.4–4 μm), with minimal impact on micropores (<0.4 μm). The escalation of overburden stress solely contributes to the reduction in pore size and pore volume of macropores. Variations in the Menger fractal dimension occur only beyond the optimal water content, while overburden stress exhibits a minimal effect on the Menger fractal dimension. Furthermore, remolded loess exhibited a certain yield stress, and when the overburden stress was lower than the yield stress, there was almost no change in various types of pores. Finally, a microstructural evolution model of remolded loess under different molding water contents and overburden stresses was proposed. These findings are expected to provide new insights into the microstructural evolution and deformation mechanisms of loess in high embankment construction sites.
1. Introduction
With the rapid advancement of the Chinese economy and the accelerated urbanization process, the sustainable development of cities in the Loess Plateau region is facing an increasing number of challenges, particularly in light of the growing demand for construction land and the scarcity of land resources. Excavation of hillsides and urban construction projects have emerged as responses to these challenges. While these endeavors create substantial land availability, such as in Lanzhou (246 km2) and Yan’an (78 km2) [1], alleviating the pressure on land use and yielding significant economic benefits, they also profoundly alter the topography. These activities disrupt the hydrological and geological equilibrium of sites, leading to a range of environmental and engineering issues such as uneven settlement, wetland subsidence, foundation instability, slope instability, and more [1,2,3,4]. Although they offer significant economic benefits, these projects also substantially modify the landscape and disturb the hydrological and geological balance of the sites. As a result, addressing these concerns has become imperative. The investigation into the hydrological and mechanical properties of remolded loess within these engineering contexts holds paramount importance for disaster reduction and sustainable development in these regions [5,6,7,8,9].
Loess is a Quaternary aeolian deposit widely distributed in arid and semi-arid regions around the world, such as China, Russia, the United States, and other countries [10]. China, in particular, has a loess area exceeding 300,000 square kilometers with a maximum thickness of over 300 m [11,12]. Loess is a silty soil renowned for its elevated silt particle content, surpassing 50%, and minimal occurrence of coarse particles exceeding 250 μm. It possesses unique engineering properties including collapsibility, sensitivity to water, high porosity, loose structure, and development of columnar joints. The mechanical properties of loess are controlled by the microstructure of the soil matrix. Investigating the factors causing variations in the microstructure of loess (including particles, particle–particle contact relationships, cementation, and pores) can unveil the mechanisms underlying soil strength and volume changes [13]. Mercury intrusion porosimetry (MIP) and scanning electron microscopy (SEM) are commonly used methods for observing and measuring the microstructure. MIP utilizes the non-wetting nature of mercury to quantitatively observe the distribution of soil pores by applying pressure to intrude mercury into the soil voids [5,14,15].
Scanning electron microscopy involves the projection of an electron beam onto the specimen, generating two-dimensional micrographs of the soil by analyzing electron reflection intensity. This allows for the observation of the microstructure on the sample’s surface. Through the utilization of image processing software such as IPP, PCAS, Matlab, and others [16,17,18,19,20], quantitative data can be extracted from the images obtained through scanning electron microscopy. Parameters including porosity, fractal dimension, form factor, orientation, and shape coefficient can be quantified using this methodology. However, the process of binary thresholding to distinguish between pores and particles in the images is often tedious and subjective.
In high embankment engineering, the moisture content and overburden stress have the greatest influence on the microstructure of remolded loess. Many researchers have investigated the evolution of loess microstructure under the influence of water and loading. Jiang et al. [5] compared the microstructures of intact loess and remolded loess before and after triaxial tests, revealing that loading compresses the inter-aggregate voids while the changes in intra-aggregate voids (<0.1 μm) can be neglected. Shao et al. [21] conducted graded wetting-induced collapsibility tests on remolded loess samples with different dry densities, and the results showed that the volume changes of inter-aggregate voids dominate during loading and wetting-induced collapse, while the changes in intra-aggregate voids are relatively small. Ng et al. [14] performed loading and wetting tests on intact loess and remolded loess, obtaining similar results. Wang et al. [22] proposed a method to predict the particle size distribution (PSD) of remolded loess at any compaction level using a reference PSD obtained through measurements. Xu et al. [17] found that the content and pore size of macropores and mesopores in remolded loess have a positive effect on permeability, while the content of minipores and micropores, as well as the oriented probability entropy, have a negative impact on permeability. Xiao et al. [23] conducted PSD measurements on remolded loess samples with varying molding water contents and suctions. The results indicated that the molding water contents primarily affect the pore density of macropores (>3 μm) and mesopores (0.2–3 μm), while compaction only influences the pore density of macropores. During the drying process, the roughness of pore surfaces increases. Li et al. [24] performed creep tests on remolded loess and observed changes in the microstructural parameters of the soil during creep deformation. The most significant variations were observed in pore and grain size (pore diameter, grain diameter) and shape (roundness), while other microstructural parameters such as circularity, contour fractal dimension, and probability entropy remained relatively unchanged. Xiao et al. [25] conducted consolidation-drainage (CD) tests on intact and remolded loess and proposed a mechanism for the evolution of loess pore structure based on changes in PSD and fractal dimensions. Yuan et al. [26] found that the bond strength between particles in remolded loess decreases after cycles of wetting and drying. The contact between particles shifts from face-to-face contact to point-to-point contact, leading to an increase in total pore volume and inter-aggregate pore volume, while intra-aggregate pore volume decreases. Zheng et al. [27] investigated the influence of water content on the tensile properties of remolded loess. They determined that the tensile strength of loess is predominantly governed by the hydration/cementation of clay, development of capillary suction, and microstructural evolution associated with changes in water content.
The aforementioned studies have shown significant progress in the research on remolded loess. However, there is limited investigation on the mechanisms underlying the influence of molding water content and overburden stress variations on remolded loess. Moreover, many Mountain Excavation and City Construction Projects are characterized by high embankment heights, short construction periods, large volumes of earthwork, and complex construction environments. The stress paths experienced by the embankment soil are intricate, making it challenging to control the water content. In light of this, the present study utilizes SEM and MIP techniques to investigate the microstructural changes in remolded loess with different molding water contents, and explore the evolution of the microstructure of remolded loess under overburden loading conditions. The research findings will further enrich the understanding of the micro–macro deformation mechanisms of remolded loess, providing theoretical insights for the construction in the Mountain Excavation and City Construction Project. Additionally, they will contribute to the promotion of sustainable development in urban areas of the Loess Plateau region in China.
2. Materials and Methods
2.1. Test Materials
The loess samples used in this study were collected from a 46 m high slope in Yan’an, China (Figure 1). Based on the research conducted by Liu [28] on loess layers, preliminary lithostratigraphic identification was carried out on the profile at the site. The soil profiles at the sampling points consist of loess soils from the Middle Pleistocene (Q2) and Early Pleistocene (Q1) periods. Due to the variation in mineral composition and microstructure of loess from different geological layers, in order to ensure uniformity, all soil samples in the experiment were taken from the same layer, namely the L6 layer of the Middle Pleistocene formation.
Undisturbed intact loess samples with a diameter of approximately 10 cm and a height of about 20 cm were collected at the sampling points and placed in PVC tubes, which were then sealed with plastic wrap and adhesive tape. After transporting the soil samples to the laboratory, various physical properties of the soil samples were tested according to ASTM standards, including bulk density, moisture content, specific gravity, and Atterberg limits. The optimum moisture content was determined to be 16%, and the maximum dry density was measured as 1.80 g/cm3 (Table 1). Particle size analysis of the soil was performed using a laser particle analyzer, and the results indicated that the intact loess primarily consisted of silt (74.8%) and clay (21.5%) (Table 1, Figure 2). Based on soil classification standards, the soil sample was classified as low plasticity clay (CL). X-ray diffraction (XRD) testing revealed that the mineral composition of the intact loess included quartz, feldspar, calcite, and clay minerals (Table 2).
2.2. Sample Preparation
The air-dried loess was crushed using a rubber mallet and sieved through a 0.5 mm sieve. Subsequently, the sieved loess was dried for 8 h at 105 °C. The dried loess was then mixed with a predetermined amount of distilled water to achieve the target moisture content of 10.0%, 13.0%, 16.0%, or 19.0%. The moist soil was placed in a sealed container and maintained for a minimum of 48 h to allow for uniform moisture distribution. Using a mold, the moist soil was compacted into a circular ring knife with a diameter of 61.8 mm and a height of 20 mm, achieving the target dry densities of 1.60 g/cm3 and 1.70 g/cm3. Photographs of soil samples with different molding water content and dry density conditions are shown in Figure 3.
In order to investigate the influence of overburden stress on the microstructure of remolded loess, remolded loess samples with a molding water content of 16.0% (dry densities of 1.60 g/cm3 and 1.70 g/cm3) were prepared for consolidation tests. The samples were subjected to incremental pressures of 100, 200, 400, 800, 1200, 1600, 2400, and 3200 kPa using a consolidation apparatus. Settlement readings were recorded at half-hour intervals until the settlement rate was less than 0.01 mm per hour. Subsequently, the next level of pressure was applied, and the process was repeated until a pressure of 3200 kPa was reached. After the completion of the tests, the samples were carefully removed from the apparatus for SEM and MIP experiments.
2.3. Test Method
SEM and MIP Testing
The samples for SEM and MIP analysis are presented in Table 3. These soil samples were cut into soil bars with dimensions of 10 mm × 10 mm × 20 mm and immediately frozen in liquid nitrogen (boiling point −196 °C) for rapid freezing. Subsequently, the frozen soil bars were placed in a vacuum freeze dryer (−40 °C, 5 Pa) for dehydration, with a duration of 24 h. Compared to oven drying and air drying methods, the vacuum freeze drying method eliminates the influence of matric suction and minimizes the expansion and contraction of the soil samples, resulting in minimal changes to the soil structure [29,30].
The dried soil bars were fractured in the middle, and one half of each soil bar was adhered to an emitter plate using conductive adhesive with the fractured surface facing upwards. The fractured surfaces were then sputter-coated with a thin layer of gold using an ion sputtering device. Microscopic observations of the soil sample sections were conducted using a scanning electron microscope. The instrument model used for obtaining SEM images of the loess samples is the SU8010 scanning electron microscope manufactured by Hitachi Ltd., in Tokyo, Japan, operating at a voltage of 5 kV.
The MIP testing employed the PoreMaster-60 mercury intrusion porosimeter, manufactured by Anton Paar. In the MIP test, the soil samples were subjected to a maximum pressure of 30,000 PSI. The soil bars were placed inside the sample chamber and a vacuum was applied to reduce the pressure to 10 mTorr. Subsequently, non-wetting liquid mercury was injected into the sample chamber, and the pressure was gradually increased to allow mercury to intrude into the pores with radii larger than the corresponding pressure-induced threshold radius. Assuming all pores are cylindrical in shape, the relationship between pressure (P) and pore diameter (d) can be determined using the Washburn equation:
In this equation, PHg represents the pressure required for mercury intrusion into pores with a diameter of d, σHg is the surface tension of mercury, and θ denotes the contact angle between mercury and the pore walls. In this study, σHg was set to 0.48 N/m and θ was set to 140°. To convert PSI to N/m2, multiply by 6894.757.
MIP testing was conducted in two pressure chambers, namely the low-pressure chamber with a pressure range of 1–50 PSI and the high-pressure chamber with a pressure range of 20–30,000 PSI. In the low-pressure chamber, measurements started at a pressure of 1 PSI, corresponding to a pore diameter of 213 μm. Therefore, MIP cannot measure pores larger than 213 μm. Subsequently, the pressure in the low-pressure chamber gradually increased to 50 PSI. In the high-pressure chamber, mercury pressure gradually increased to 30,000 PSI, corresponding to a pore diameter of 7 nm. Therefore, pores smaller than 6 nm cannot be invaded and detected. If a pore has only a small entrance, it can only be fully invaded when the pressure reaches the value corresponding to the maximum entrance radius. In such cases, the calculated pore size distribution will be smaller than the actual pore size. The pore size distribution of the sample can be represented by the cumulative pore volume and pore size density. The pore size density corresponds to the logarithmic derivative of the cumulative pore size with respect to the entrance pore size.
3. Test Results
3.1. Macroscopic Characteristics of Remolded Loess
3.1.1. Macroscopic Pore Space of Remolded Loess
The data presented in Figure 3 clearly indicate that an augmentation in molding moisture content leads to a discernible increase in visible macropores within the remolded loess. Conversely, an escalation in dry density corresponds to a reduction in such pores. While Figure 4a portrays the darker regions as the pores within the loess, the differentiation remains somewhat unclear. Employing Photoshop 2023, as illustrated in the steps outlined in Figure 4b, the image underwent enhancement procedures encompassing the amplification of contrast, highlights, attenuation of shadows, enrichment of texture, and enhancement of clarity, among other techniques. These adjustments aimed to render the pores and loess particles more perceptible, as demonstrated in Figure 4c. Subsequently, an optimal threshold was applied to effectuate image binarization, leading to the complete separation of pores within the loess, as exemplified in Figure 4d.
In order to analyze the specific influence of molding water content on the macroscopic morphology of the remolded loess, PCAS 2.32 was used to analyze the geometric parameters of macroscopic pores. This system offers advantages such as automation, repeatability, and simplicity of operation. It not only accurately determines the geometric parameters of the microstructure of soil, but also provides statistical parameters of the pore system or particles based on these geometric parameters, enabling quantitative evaluation of the microstructure characteristics of soil [20,31]. The analysis using PCAS software yields the relationship between macroscopic pore parameters such as the porosity, probability entropy, average shape factor, fractal dimension, and the molding water content. In PCAS software, the probability entropy (Hm) describes the orientation of particles or pore systems and is defined as follows:
where represents the percentage content of pores with a specific orientation within a given interval. The values of Hm range between 0 and 1, with larger values indicating poorer orientation.
The form factor (F) is commonly used to describe the tendency of pores towards a circular shape and is defined as:
where S is the area of the pore and C is the circumference. Recognizing that the utilization of individual pore shape factors may lead to significant errors and lack meaningful interpretation, the average shape factor (F) is employed for the statistical analysis of pore shape characteristics. The range of F values lies within the interval (0, 1], where higher values signify smoother pore shapes and lower values indicate elongated shapes.
The fractal dimension (D) signifies the intricacy of the pore structure. PCAS software employs the perimeter-area method to characterize the fractal dimension, which is defined as follows:
where C represents the pore perimeter, S is the pore area, and c is a constant. The values of the fractal dimension range between 1 and 2. A higher D value implies a more intricate pore structure and a greater divergence of the spatial morphology of the pores from a smooth surface.
The results of the PCAS software processing are shown in Figure 5. With the increase in molding water content, the porosity and fractal dimension exhibit significant increases, while the probability entropy remains nearly unchanged, and the average shape factor decreases continuously. This is mainly attributed to the increased water content, which leads to the aggregation of more clay particles, forming larger particles. The concentration of particles results in larger pores within the sample, and larger pores contribute to a more complex internal structure of the pores, leading to an increasing fractal dimension. Moreover, the increase in water content softens the particles. During the molding process, the pores between particles are flattened, causing the shape of the pores to become increasingly elongated, resulting in a decrease in the shape factor. However, the orientation of the pores during compaction remains randomly distributed, hence the probability entropy remains nearly unchanged. Additionally, it can be observed from the figure that the porosity and fractal dimension of the soil sample with a dry density of 1.60 g/cm3 are greater than those of the soil sample with a dry density of 1.70 g/cm3, while the shape factor is smaller. This is mainly due to the fact that the soil sample with a lower dry density exhibits more visible large pores compared to the one with a higher dry density, resulting in relatively smoother pores and a smaller average shape factor. The larger pores indicate a more complex pore shape.
3.1.2. Compressibility of Remolded Loess
The relationship between settlement and overburden stress of a specimen can be obtained through one-dimensional high-pressure consolidation tests. The void ratio (ei) can be calculated using the following equation:
where e0 is the initial void ratio, ∆Hi represents the deformation at a certain load increment, H0 denotes the initial height of the specimen.
Figure 6 shows the log e-log P curves for two types of remolded loess. It can be observed that the curves can be approximated by two straight lines, similar to the compression curves of the intact soil. The intersection point of the straight lines corresponds to the yield stress/preconsolidation stress of the remolded loess [32,33]. When the overburden stress of the remolded loess is lower than the yield stress, the deformation is relatively small. However, as the stress exceeds the yield stress, the void ratio of the remolded loess rapidly decreases with increasing overburden stress. From Figure 6, it can be seen that the yield stress for the soil sample with a dry density of 1.60 g/cm3 is 290 kPa, while the yield stress for the soil sample with a dry density of 1.70 g/cm3 is 800 kPa. Both dry density and molding water content have a noticeable impact on the yield stress. However, once the vertical stress surpasses the yield stress, the dry density no longer affects the void ratio.
3.2. Microstructural Characteristics of Remolded Loess
3.2.1. The Influence of Molding Water Content on the Microstructure of Remolded Loess
The MIP test results for remolded loess samples with different molding water contents are shown in Figure 7. Regardless of whether the samples were molded on the dry side or wet side of the optimum water content, all soil samples exhibited a bimodal Pore Size Distribution (PSD), characterized by macropores (4–200 μm), minipores (0.4–4 μm), and micropores (<0.4 μm). The PSD of micropores showed little variation with increasing molding water content, while the peak pore diameter and peak pore density of minipores increased. The peak pore diameter of macropores also increased, but their peak pore density decreased. Additionally, for remolded loess with a dry density of 1.60 g/cm3, both the peak pore diameter and pore density of macropores were larger than those of the soil sample with a dry density of 1.70 g/cm3, and this difference became more pronounced with increasing molding water content. The increase in dry density resulted in a slight increase in the peak pore diameter of minipores, while the pore density distribution showed minimal variation. As for micropores, the pore density distribution for soil samples with dry densities of 1.60 g/cm3 and 1.70 g/cm3 was nearly identical. At the optimum water content of 16.0%, the pore density of macropores and minipores were similar. However, above or below the optimum water content, a certain type of pore became more prominent.
From Figure 8, it can be observed that with an increase in molding water content, the total pore volume slightly decreases. The pore volume of soil samples with dry densities of 1.60 g/cm3 and 1.70 g/cm3 decreased by 8.2% and 5.0%, respectively. The volume of micropores remains almost unchanged with variations in molding water content and dry density, maintaining a range of 0.045–0.051 cc/g, accounting for 21–23% of the total volume. The volume of minipores increases with an increase in water content, ranging from 0.069 cc/g to 0.127 cc/g, representing an increase in volume proportion from 30–33% to 60–64%. The volume of minipores in soil samples with dry densities of 1.60 g/cm3 and 1.70 g/cm3 is nearly the same. On the other hand, the volume of macropores decreases with an increase in molding water content, ranging from 0.092–0.111 cc/g to 0.026–0.041 cc/g, accounting for a volume proportion reduction from 44–52% to 13–19%. The volume of macropores in soil samples with a dry density of 1.60 g/cm3 is significantly larger than that in soil samples with a dry density of 1.70 g/cm3.
In the microstructure of loess, the pores can be classified into intergranular pores (including bracket pores and mosaic pores) and intragranular pores (mainly composed of cementitious pores) [34]. As shown in Figure 9a, the particles surrounding the bracket pores mostly have point-to-point contact and relatively poor cementation, with pore diameters typically larger than the surrounding particles. The particles around the bracket pores are prone to movement and redistribution under load and water action, and their pore diameters are close to the distribution range of macropores. The mosaic pores in Figure 9a,b are concentrated between the face-to-face contact of skeletal particles, with pore diameters usually smaller than the surrounding particles and comparable to the distribution range of minipores. The intragranular pores mainly exist between clay particles or within clay aggregates, as shown in Figure 9b, with pore diameters and distribution range similar to that of micropores [21,22]. Therefore, the macropores, minipores, and micropores in the particle size distribution (PSD) correspond to the bracket pores, mosaic pores, and intragranular pores depicted in Figure 9.
At a molding water content of 10.0%, as shown in Figure 10a,e, the particles of remolded loess exhibit clear outlines with subrounded clay aggregates adhering to their surfaces. The predominant type of pore is the bracket pore, and their distribution is uniform with good connectivity. At a molding water content of 13%, as depicted in Figure 10b,f, the particles of remolded loess display relatively clear skeletal outlines with well-developed clay aggregates. Localized areas show irregularly shaped clusters of cementation. The pores are predominantly bracket pores, with fewer mosaic pores, and their distribution is relatively uniform with good connectivity. At a molding water content of 16%, as illustrated in Figure 10c,g, the outlines of the skeletal particles of remolded loess become less distinct. Numerous clay aggregates form interconnected clusters, and the main types of pores are mosaic pores and bracket pores. At a molding water content of 19%, as seen in Figure 10d,h, the overall integrity of the soil mass is stronger, and the skeletal outlines become blurred. Silt particles are enveloped by clay, and localized regions exhibit granular particles. The main type of pore is the mosaic pore, while the pore connectivity is relatively poor. Overall, with increasing molding water content, the number of bracket pores in remolded loess gradually decreases, while the number of mosaic pores increases. At the same molding water content, the remolded loess samples with a dry density of 1.60 g/cm3 exhibit a significantly higher number of bracket pores compared to samples with a dry density of 1.70 g/cm3. Additionally, the pore diameter is larger, which aligns with the trend observed in Figure 8. Furthermore, when the molding water content is below the optimum water content (16.0%), the clay predominantly acts as cementation in the form of aggregates or clusters of silt particles. However, when the molding water content exceeds the optimum water content, the clay exhibits a flocculated structure, enveloping the silt particles.
3.2.2. The Influence of Overburden Stress on the Microstructure of Remolded Loess
Figure 11 presents the particle size distribution (PSD) curves of remolded loess under varying overburden stresses. Regardless of the magnitude of the applied stress, the bimodal nature of the PSD curve cannot be eliminated. As the stress increases, the PSD of the macropore range noticeably shifts to the left. In the remolded loess with a dry density of 1.60 g/cm3, both the peak density and peak diameter of the macropores significantly decrease. Similarly, in the remolded loess with a dry density of 1.70 g/cm3, the peak diameter of the macropores exhibits a significant decrease, while the change in peak density is less pronounced. The PSD of the minipores and micropores segments, on the other hand, undergoes minimal variation with changes in applied pressure.
From Figure 12, it is evident that, for the soil sample with a dry density of 1.6 g/cm3, the total pore volume and volumes of various pore types show little change when the applied overburden stress is below 200 kPa. Similarly, for the soil sample with a dry density of 1.70 g/cm3, these volumes remain relatively constant when the applied overburden stress is below 800 kPa, which is below the yield stress of the remolded loess. However, once the applied overburden stress exceeds the yield stress, the volume of macropores starts to decrease. The maximum reduction in macropore volume is approximately 65% for the remolded loess with a dry density of 1.60 g/cm3 and 44% for the remolded loess with a dry density of 1.70 g/cm3. The volumes of minipores and micropores show minimal variation with changes in applied overburden stress. Furthermore, when the applied overburden stress exceeds 800 kPa, the total pore volume and volumes of various pore types for both the remolded loess samples with dry densities of 1.60 g/cm3 and 1.70 g/cm3 become nearly identical.
Figure 13 shows the SEM images of remolded loess after consolidation under different overburden pressures. When the overburden pressure is below 800 kPa, a significant amount of aggregated particles form clusters, primarily consisting of bracket pores and mosaic pores. As the overburden pressure exceeds 800 kPa, the overall integrity of the soil mass strengthens, with most of the silt particles being encapsulated within the clay matrix. The dominant pore type becomes the mosaic pore, with a limited distribution of bracket pores. With increasing pressure, more silt particles are encapsulated by the clay matrix, resulting in a reduction in bracket pores. Furthermore, when the overburden pressure is below the yield stress, as observed in Figure 13e,f and Figure 10e, the pore structure exhibits minimal variation. This observation is consistent with the experimental findings of the MIP test.
3.3. Pore Fractal Characteristics of Remodeled Loess
In many porous media, the shape and distribution of pores often exhibit self-similar characteristics, meaning that similar pore structures can be observed at different scales. This self-similarity can be quantified using the fractal dimension. The fractal dimension provides a quantitative measure of the complexity of pore structures. A higher fractal dimension indicates a higher level of detail and complexity in the pore structure, while a lower fractal dimension suggests a relatively simple pore structure. Friesen and Mikula [35] proposed a fractal dimension calculation method based on the Menger sponge model, with the following formula:
In the equation, Vm represents the cumulative volume of pores invaded by mercury, P denotes the mercury injection pressure, Dm represents the fractal dimension, and C is a constant. It can be observed from this equation that log(dVm/dP) exhibits a linear relationship with logP. By fitting the data points of the log(dVm/dP)–logP curve, the slope of the line, denoted as k, can be determined, and the fractal dimension Dm can be calculated as Dm = k + 4. However, in practical measurements, the data points often cannot be fitted by a single straight line, indicating the absence of a uniform fractal dimension across the entire range of pores. For instance, Sun et al. [36] found that bentonite exhibits two fractal regimes, Ou et al. [37] discovered that frozen–thawed sandstone also exhibits two fractal regimes, while Chen et al. [38] observed only one fractal regime in powdered clay after freeze–thaw cycles. The value of Dm typically falls within the range of 2 to 3, where Dm = 2 represents two-dimensional pores such as cracks, and Dm = 3 represents three-dimensional pores such as cylindrical pores [25,39]. As depicted in Figure 14, this study reveals the existence of three fractal regimes in the soil samples, each characterized by a distinct fractal dimension. The fractal dimensions of the three regimes, namely Dm1, Dm2, and Dm3, are presented in Table 4. Notably, the fractal dimension in the Dm2 regime significantly exceeds the range of 2–3, thereby failing to meet the definition of the fractal dimension. Similar to the findings by Xiao et al. [25], the boundaries of the Dm2 and Dm3 fractal regimes correspond to the peak pore diameter of macropores, indicating that the occurrence of macropore peak diameters can alter the fractal dimension and influence the self-similarity of remolded loess.
From Figure 15a, it can be observed that when the molding water content is below the optimum water content, both the molding water content and dry density have little influence on Dm1 and Dm3 of the remolded loess. However, when the molding water content exceeds 16.0%, Dm1 increases sharply, while Dm3 decreases significantly. The magnitude of these changes is more pronounced in soil samples with a dry density of 1.70 g/cm3 compared to those with a dry density of 1.60 g/cm3. From Figure 15b, it is evident that the overburden stress has minimal impact on Dm1 and Dm3 of the remolded loess.
4. Discussion
By integrating the outcomes from SEM, MIP, and other experimental techniques, a comprehensive understanding of the microstructural modifications in remolded loess can be attained. With the escalation of moisture content, the volume of macropores diminishes while their pore diameter expands. Conversely, both the volume and diameter of small pores experience augmentation, a conclusion similarly drawn by Hou et al. [4]. Figure 10 conspicuously demonstrates that molding moisture content predominantly governs pore characteristics and microstructure through its influence on the clay’s state. Li et al. [40] postulate that molding moisture content impacts the size of remolded loess aggregates, thereby influencing the dimensions of aggregate pores. Liu et al. [41] suggest that an elevation in molding moisture content fosters the emergence of interconnected mesopores and macropores, with this phenomenon becoming more pronounced in loosely packed soils. Correspondingly, our study also unveils that an increase in molding moisture content results in more elongated pore shapes, accompanied by a substantial augmentation in the connectivity of macropores.
Based on this understanding, a conceptual model is proposed to describe the evolution of the microstructure of remolded loess under increasing molding water content or imposed stress. Figure 16 illustrates the schematic representation of the microstructural evolution of remolded loess under different molding water content conditions. The molding water content significantly influences the state of the clay in remolded loess [4,42]. At lower molding water content, the interparticle bonding between clay particles is strong, leading to the formation of smaller clay aggregates. These clay aggregates adhere to the silt particles, and the pore distribution is relatively uniform. The contact between skeletal particles is primarily point-to-point, resulting in a granule type of microstructure of the soil sample, as shown in Figure 16a. As the molding water content increases, the clay particles undergo hydration, causing expansion of the double electric layer on their surfaces. Simultaneously, the cohesive forces are reduced. The friction angle of the clay decreases, causing particle rotations, displacements, and sliding during the compaction process of remolded loess. This leads to the detachment of clay aggregates from the skeletal particles [43], which then gather together and bond between the silt particles, forming larger clusters. The volume of these clusters continuously increases, and the pore diameter between the clusters gradually enlarges. The contact between skeletal particles involves both point-to-point and point-to-face interactions, as depicted in Figure 16b,c. At this stage, the microstructure is aggregate type. When the water content exceeds the optimum value, the clay undergoes significant expansion and exists in the form of a clay paste, burying the silt particles as the base material and forming a flocculated structure. The presence of bracket pores between particles is nearly absent, gradually transitioning into a matrix-type microstructure [16,43], as shown in Figure 16d.
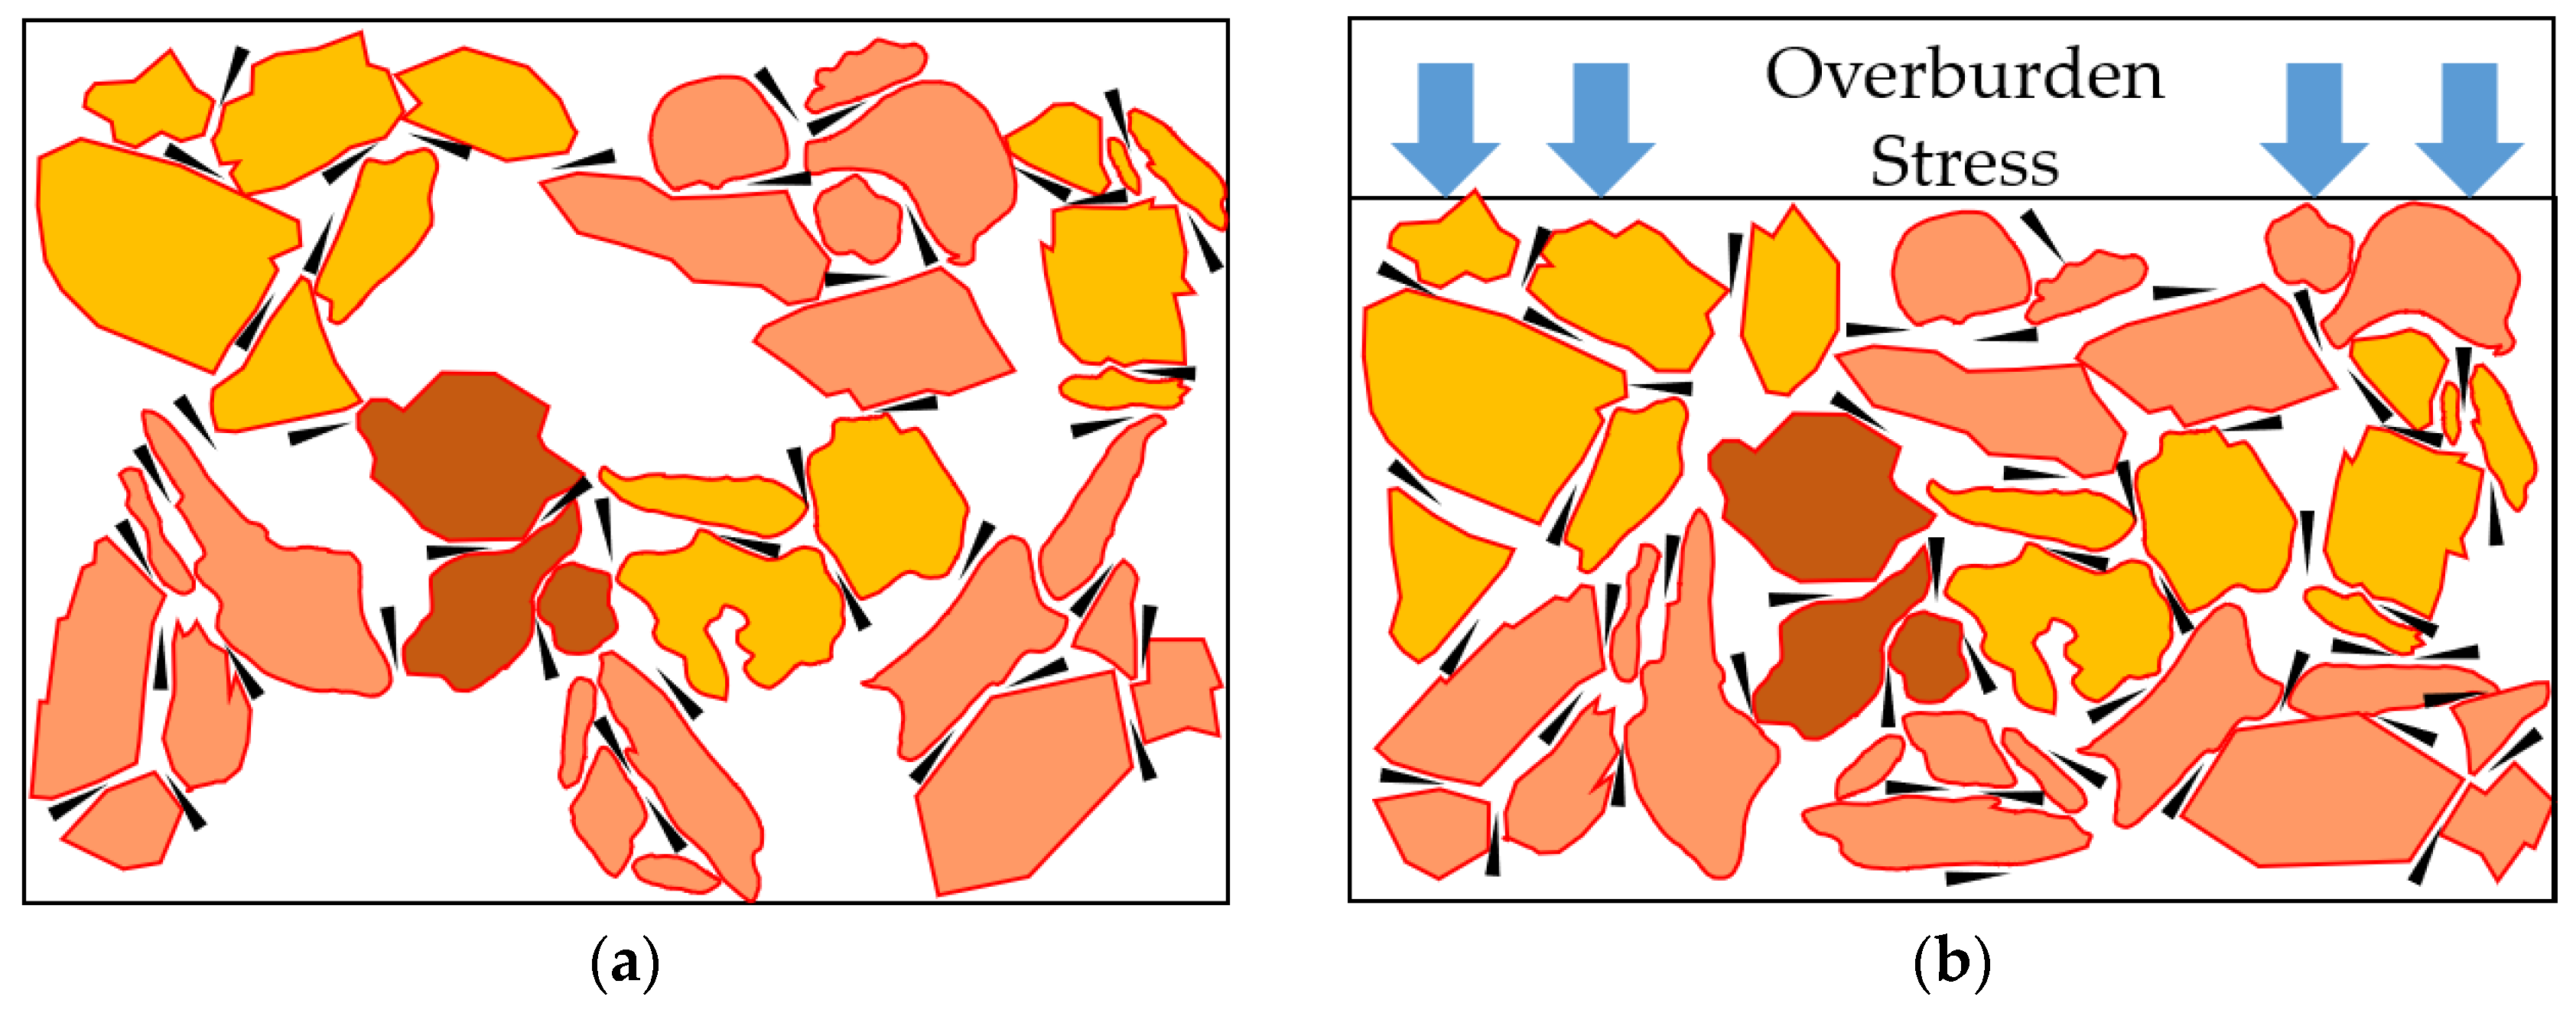
From Figure 11, it is evident that the overburden pressure only affects macropores. Li, Jiang, Shao, and Ng [5,14,21,40] have also reached the same conclusion: loading only affects inter-aggregate pores, while intra-aggregate pores are hardly affected. The impact of dry density (compaction degree) on pores is similar to the influence of load [40]. Under the influence of overburden stress, remolded loess always undergoes the fracture of inter-particle bonding and reorganization of soil particles. Additionally, it adjusts internal forces to adapt to external changes. Generally, the application of load leads to the evolution of remolded loess towards a denser structure [16]. The stress distribution of particles around pores is relatively uniform, resulting in the overall inward collapse of the pores. As a result, the fractal dimension of the pores does not change significantly, which is consistent with the findings of Xiao et al. [25]. Figure 17 presents a schematic diagram illustrating the microstructural evolution of remolded loess under different overburden stresses. When the overburden stress is lower than the yield stress, the evolution of pores is not very significant. This is because the particles of remolded loess are bonded by clay, and even if the remolded loess has larger pores, they are difficult to collapse when the overburden stress does not exceed the bonding force of clay. However, as the dry density decreases and the diameter of bracket pores increases, the concentration of stress in the bonding material becomes greater under the influence of overburden stress, allowing smaller consolidation to disrupt the bonding between these bracket pores, resulting in a lower yield stress.
When the overburden stress exceeds the yield stress, the framework particles of the remolded loess undergo movements such as rotation, displacement, sliding, and fragmentation, causing the transition from point-to-point or point-to-face contacts to face-to-face contacts [24]. Under the influence of the applied stress, weakly bonded skeleton granules are separated, and clay aggregates and clusters are fragmented and re-aggregated into new clusters. With increasing overburden stress, more clusters are decomposed into smaller particles that fill the bracket pores, while clay aggregates near the skeleton granules continue to increase and gradually become surrounded by clay, as shown in Figure 17b.
5. Conclusions
This study determined the microstructure of reconstituted loess at different molding water contents and investigated the evolution of pore characteristics under overburden stress. The main findings are as follows:
- An increase in molding water content results in the enlargement of visually discernible pore volume and leads to a slenderization of their shape. However, the pore distribution consistently maintains a bimodal pattern. The volume and peak aperture of minipores (0.4–4 μm) increase, while the volume of macropores (4–200 μm) decreases, albeit with an enlargement of their peak aperture. Micropores (<0.4 μm) remain minimally affected. Changes in the pore Menger fractal dimension occur only when the molding water content surpasses the optimal level. Molding water content primarily governs the microstructure and pore distribution of remolded loess by controlling the morphology of clay;
- An increase in overburden stress or dry density results in a reduction in the volume and peak aperture of macropores, while small and micropores experience negligible changes. The Menger fractal dimension also remains largely unaltered. Remolded loess exhibits a specific yield stress, wherein higher dry density leads to increased contact area between clay particles, subsequently elevating yield stress. Beyond the yield stress, significant movement of skeletal particles occurs, thereby reducing macropore volume;
- A microstructural evolution model for remolded loess under varying overburden stress and molding water content is proposed. With increasing molding water content, the microstructure of remolded loess transitions from a granule-type to an aggregate-type and, ultimately, to a matrix-type structure. Moreover, as overburden pressure surpasses yield stress, the displacement of skeletal particles in remolded loess triggers the disintegration and recombination of aggregates, leading to a progressive reduction in bracket pores.
Author Contributions
Conceptualization, Z.L.; methodology, Z.L.; software, Z.Q.; validation, Z.Q.; formal analysis, Z.Q.; investigation, Z.Q.; resources, Z.L.; data curation, Z.Q.; writing—original draft preparation, Z.Q. and Z.L.; writing—review and editing, Z.L.; visualization, Z.Q. and Z.L.; supervision, Z.L.; project administration, Z.L.; funding acquisition, Z.L. All authors have read and agreed to the published version of the manuscript.
Funding
This work was financed by the Second Tibetan Plateau Scientific Expedition and Research Program (STEP) (Grant No. 2019QZKK0904), the National Natural Science Foundation of China (Grant No. 42177146), and the Science and the Key Research and Development Plan of Yunnan Province (Grant No. 202103AA080013).
Data Availability Statement
Some or all data that support the findings of this study are available from the corresponding authors upon reasonable request.
Conflicts of Interest
The authors declare no conflict of interest.
References
- Juang, C.H.; Dijkstra, T.; Wasowski, J.; Meng, X. Loess geohazards research in China: Advances and challenges for mega engineering projects. Eng. Geol. 2019, 251, 1–10. [Google Scholar] [CrossRef]
- Chen, G.; Zhang, Y.; Zeng, R.; Yang, Z.; Chen, X.; Zhao, F.; Meng, X. Detection of Land Subsidence Associated with Land Creation and Rapid Urbanization in the Chinese Loess Plateau Using Time Series InSAR: A Case Study of Lanzhou New District. Remote Sens. 2018, 10, 270. [Google Scholar] [CrossRef] [Green Version]
- Wang, F.; Li, G.; Mu, Y.; Wu, Y.; Fan, S. Study on collapse characteristic of compacted loess subjected to cyclic drying and wetting. J. Glaciol. Geocryol. 2016, 38, 416–423. [Google Scholar] [CrossRef]
- Hou, X.; Qi, S.; Li, T.; Guo, S.; Wang, Y.; Li, Y.; Zhang, L. Microstructure and soil-water retention behavior of compacted and intact silt loess. Eng. Geol. 2020, 277, 105814. [Google Scholar] [CrossRef]
- Jiang, M.; Zhang, F.; Hu, H.; Cui, Y.; Peng, J. Structural characterization of natural loess and remolded loess under triaxial tests. Eng. Geol. 2014, 181, 249–260. [Google Scholar] [CrossRef]
- Xu, L.; Coop, M.R.; Zhang, M.; Wang, G. The mechanics of a saturated silty loess and implications for landslides. Eng. Geol. 2018, 236, 29–42. [Google Scholar] [CrossRef]
- Ng, C.W.W.; Sadeghi, H.; Jafarzadeh, F.; Sadeghi, M.; Zhou, C.; Baghbanrezvan, S. Effect of microstructure on shear strength and dilatancy of unsaturated loess at high suctions. Can. Geotech. J. 2019, 57, 221–235. [Google Scholar] [CrossRef]
- Vanapalli, S.K.; Fredlund, D.G.; Pufahl, D.E. The influence of soil structure and stress history on the soil-water characteristics of a compacted till. Géotechnique 1999, 49, 143–159. [Google Scholar] [CrossRef] [Green Version]
- Li, P.; Qian, H.; Wu, J. Environment: Accelerate research on land creation. Nature 2014, 510, 29–31. [Google Scholar] [CrossRef] [PubMed] [Green Version]
- Rogers, C.D.F.; Dijkstra, T.A.; Smalley, I.J. Hydroconsolidation and subsidence of loess: Studies from China, Russia, North America and Europe: In memory of Jan Sajgalik. Eng. Geol. 1994, 37, 83–113. [Google Scholar] [CrossRef]
- Tan Tjong, K. Fundamental properties of loess from Northwestern China. Eng. Geol. 1988, 25, 103–122. [Google Scholar] [CrossRef]
- Derbyshire, E. Geological hazards in loess terrain, with particular reference to the loess regions of China. Earth-Sci. Rev. 2001, 54, 231–260. [Google Scholar] [CrossRef]
- Li, P.; Vanapalli, S.; Li, T. Review of collapse triggering mechanism of collapsible soils due to wetting. J. Rock. Mech. Geotech. 2016, 8, 256–274. [Google Scholar] [CrossRef]
- Ng, C.W.W.; Sadeghi, H.; Hossen, S.K.B.; Chiu, C.F.; Alonso, E.E.; Baghbanrezvan, S. Water retention and volumetric characteristics of intact and re-compacted loess. Can. Geotech. J. 2016, 53, 1258–1269. [Google Scholar] [CrossRef]
- Wen, B.P.; Yan, Y.J. Influence of structure on shear characteristics of the unsaturated loess in Lanzhou, China. Eng. Geol. 2014, 168, 46–58. [Google Scholar] [CrossRef]
- Xie, W.L.; Li, P.; Zhang, M.S.; Cheng, T.-e.; Wang, Y. Collapse behavior and microstructural evolution of loess soils from the Loess Plateau of China. J. Mt. Sci.-Engl. 2018, 15, 1642–1657. [Google Scholar] [CrossRef]
- Xu, P.; Zhang, Q.; Qian, H.; Li, M.; Yang, F. An investigation into the relationship between saturated permeability and microstructure of remolded loess: A case study from Chinese Loess Plateau. Geoderma 2021, 382, 114774. [Google Scholar] [CrossRef]
- Yuan, K.; Ni, W.; Lü, X.; Zhu, M.; Wang, H.; Nie, Y. Mechanical properties and microstructure evolution of Malan loess. Quatern. Int. 2022, 637, 74–84. [Google Scholar] [CrossRef]
- Li, P.; Xie, W.; Pak, R.Y.S.; Vanapalli, S.K. Microstructural evolution of loess soils from the Loess Plateau of China. CATENA 2019, 173, 276–288. [Google Scholar] [CrossRef]
- Liu, C.; Tang, C.S.; Shi, B.; Suo, W.B. Automatic quantification of crack patterns by image processing. Comput. Geosci. 2013, 57, 77–80. [Google Scholar] [CrossRef]
- Shao, X.; Zhang, H.; Tan, Y. Collapse behavior and microstructural alteration of remolded loess under graded wetting tests. Eng. Geol. 2018, 233, 11–22. [Google Scholar] [CrossRef]
- Wang, J.D.; Li, P.; Ma, Y.; Vanapalli, S.K. Evolution of pore-size distribution of intact loess and remolded loess due to consolidation. J. Soils Sediment. 2019, 19, 1226–1238. [Google Scholar] [CrossRef]
- Xiao, T.; Li, P.; Pan, Z.; Wang, J. Effect of compaction condition on the water retention capacity, microstructure and its evolution during drying of compacted loess. Geoenviron. Disasters 2022, 9, 27. [Google Scholar] [CrossRef]
- Li, Z.; Wang, J.; Yang, S.; Liu, S.; Li, Y. Characteristics of Microstructural Changes of Malan Loess in Yan’an Area during Creep Test. Water 2022, 14, 438. [Google Scholar] [CrossRef]
- Xiao, T.; Li, P.; Shao, S. Fractal dimension and its variation of intact and compacted loess. Powder Technol. 2022, 395, 476–490. [Google Scholar] [CrossRef]
- Yuan, K.; Ni, W.; Lü, X.; Vecchia, G.D.; Wang, H.; Li, L.; Nie, Y. Influence of wetting-drying cycles on the compression behavior of a compacted loess from microstructure analysis. Bull. Eng. Geol. Environ. 2022, 81, 348. [Google Scholar] [CrossRef]
- Zheng, P.; Wang, J.; Wu, Z.; Huang, W.; Li, C.; Liu, Q. Effect of Water Content Variation on the Tensile Characteristic of Clayey Loess in Ili Valley, China. Appl. Sci. 2022, 12, 8470. [Google Scholar] [CrossRef]
- Liu, D. Loess and the Environment; Science Press: Beijing, China, 1985. [Google Scholar]
- Romero, E.; Simms, P.H. Microstructure Investigation in Unsaturated Soils: A Review with Special Attention to Contribution of Mercury Intrusion Porosimetry and Environmental Scanning Electron Microscopy. Geotech. Geol. Eng. 2008, 26, 705–727. [Google Scholar] [CrossRef]
- Delage, P.; Audiguier, M.; Cui, Y.-J.; Howat, M.D. Microstructure of a compacted silt. Can. Geotech. J. 1996, 33, 150–158. [Google Scholar] [CrossRef]
- Liu, C.; Shi, B.; Zhou, J.; Tang, C. Quantification and characterization of microporosity by image processing, geometric measurement and statistical methods: Application on SEM images of clay materials. Appl. Clay Sci. 2011, 54, 97–106. [Google Scholar] [CrossRef]
- Prakash, K.; Sridharan, A. Log-Log Method of Pre-consolidation/Yield Stress Determination: An Appraisal. Geotech. Geol. Eng. 2020, 38, 947–959. [Google Scholar] [CrossRef]
- Jose, B.T.; Sridharan, A.; Abraham, B. Log-log method for determination of preconsolidation pressure. Geotech. Test. J. 1989, 12, 230–237. [Google Scholar] [CrossRef]
- Lei, X. Pore types of loess soils in China and its collapsibility. Sci. China B 1987, 12, 1310–1316. [Google Scholar]
- Friesen, W.I.; Mikula, R.J. Fractal dimensions of coal particles. J. Colloid Interface Sci. 1987, 120, 263–271. [Google Scholar] [CrossRef]
- Sun, H.; Mašín, D.; Najser, J.; Neděla, V.; Navrátilová, E. Fractal characteristics of pore structure of compacted bentonite studied by ESEM and MIP methods. Acta Geotech. 2020, 15, 1655–1671. [Google Scholar] [CrossRef]
- Ou, K.; Wang, C.; Cao, R.-H.; Lin, H.; Fang, L. Experimental investigation of the pore fractal characteristics and damage degradation mechanism of sandstone after cyclic Freeze-thaw treatments. J. Mater. Res. Technol. 2023, 23, 4843–4859. [Google Scholar] [CrossRef]
- Chen, Z.; Chen, H.; Li, J.; Li, H.; Ma, W. Study on the Changing Rules of Silty Clay’s Pore Structure under Freeze-Thaw Cycles. Adv. Civ. Eng. 2019, 2019, 7493872. [Google Scholar] [CrossRef]
- Pfeifer, P.; Avnir, D. Chemistry in noninteger dimensions between two and three. I. Fractal theory of heterogeneous surfaces. J. Chem. Phys. 1983, 79, 3558–3565. [Google Scholar] [CrossRef]
- Li, P.; Pan, Z.; Xiao, T.; Wang, J. Effects of molding water content and compaction degree on the microstructure and permeability of compacted loess. Acta Geotech. 2023, 18, 921–936. [Google Scholar] [CrossRef]
- Liu, J.; Xu, Q.; Li, P.; He, P.; Pu, C.; Zhao, K.; Peng, D.; Wang, Z. Saturated permeability of compacted loess based on low-field nuclear magnetic resonance (NMR). Bull. Eng. Geol. Environ. 2022, 81, 464. [Google Scholar] [CrossRef]
- Sasanian, S.; Newson, T.A. Use of mercury intrusion porosimetry for microstructural investigation of reconstituted clays at high water contents. Eng. Geol. 2013, 158, 15–22. [Google Scholar] [CrossRef]
- Liu, Z.; Liu, F.; Ma, F.; Wang, M.; Bai, X.; Zheng, Y.; Yin, H.; Zhang, G. Collapsibility, composition, and microstructure of loess in China. Can. Geotech. J. 2016, 53, 673–686. [Google Scholar] [CrossRef] [Green Version]
Figure 1.
(a) Sampling site of Yan’an on the Loess Plateau of China; (b) Sampling site on the slope.
Figure 1.
(a) Sampling site of Yan’an on the Loess Plateau of China; (b) Sampling site on the slope.

Figure 2.
Particle size distribution curve and cumulative particle size distribution curve of the sample.
Figure 2.
Particle size distribution curve and cumulative particle size distribution curve of the sample.
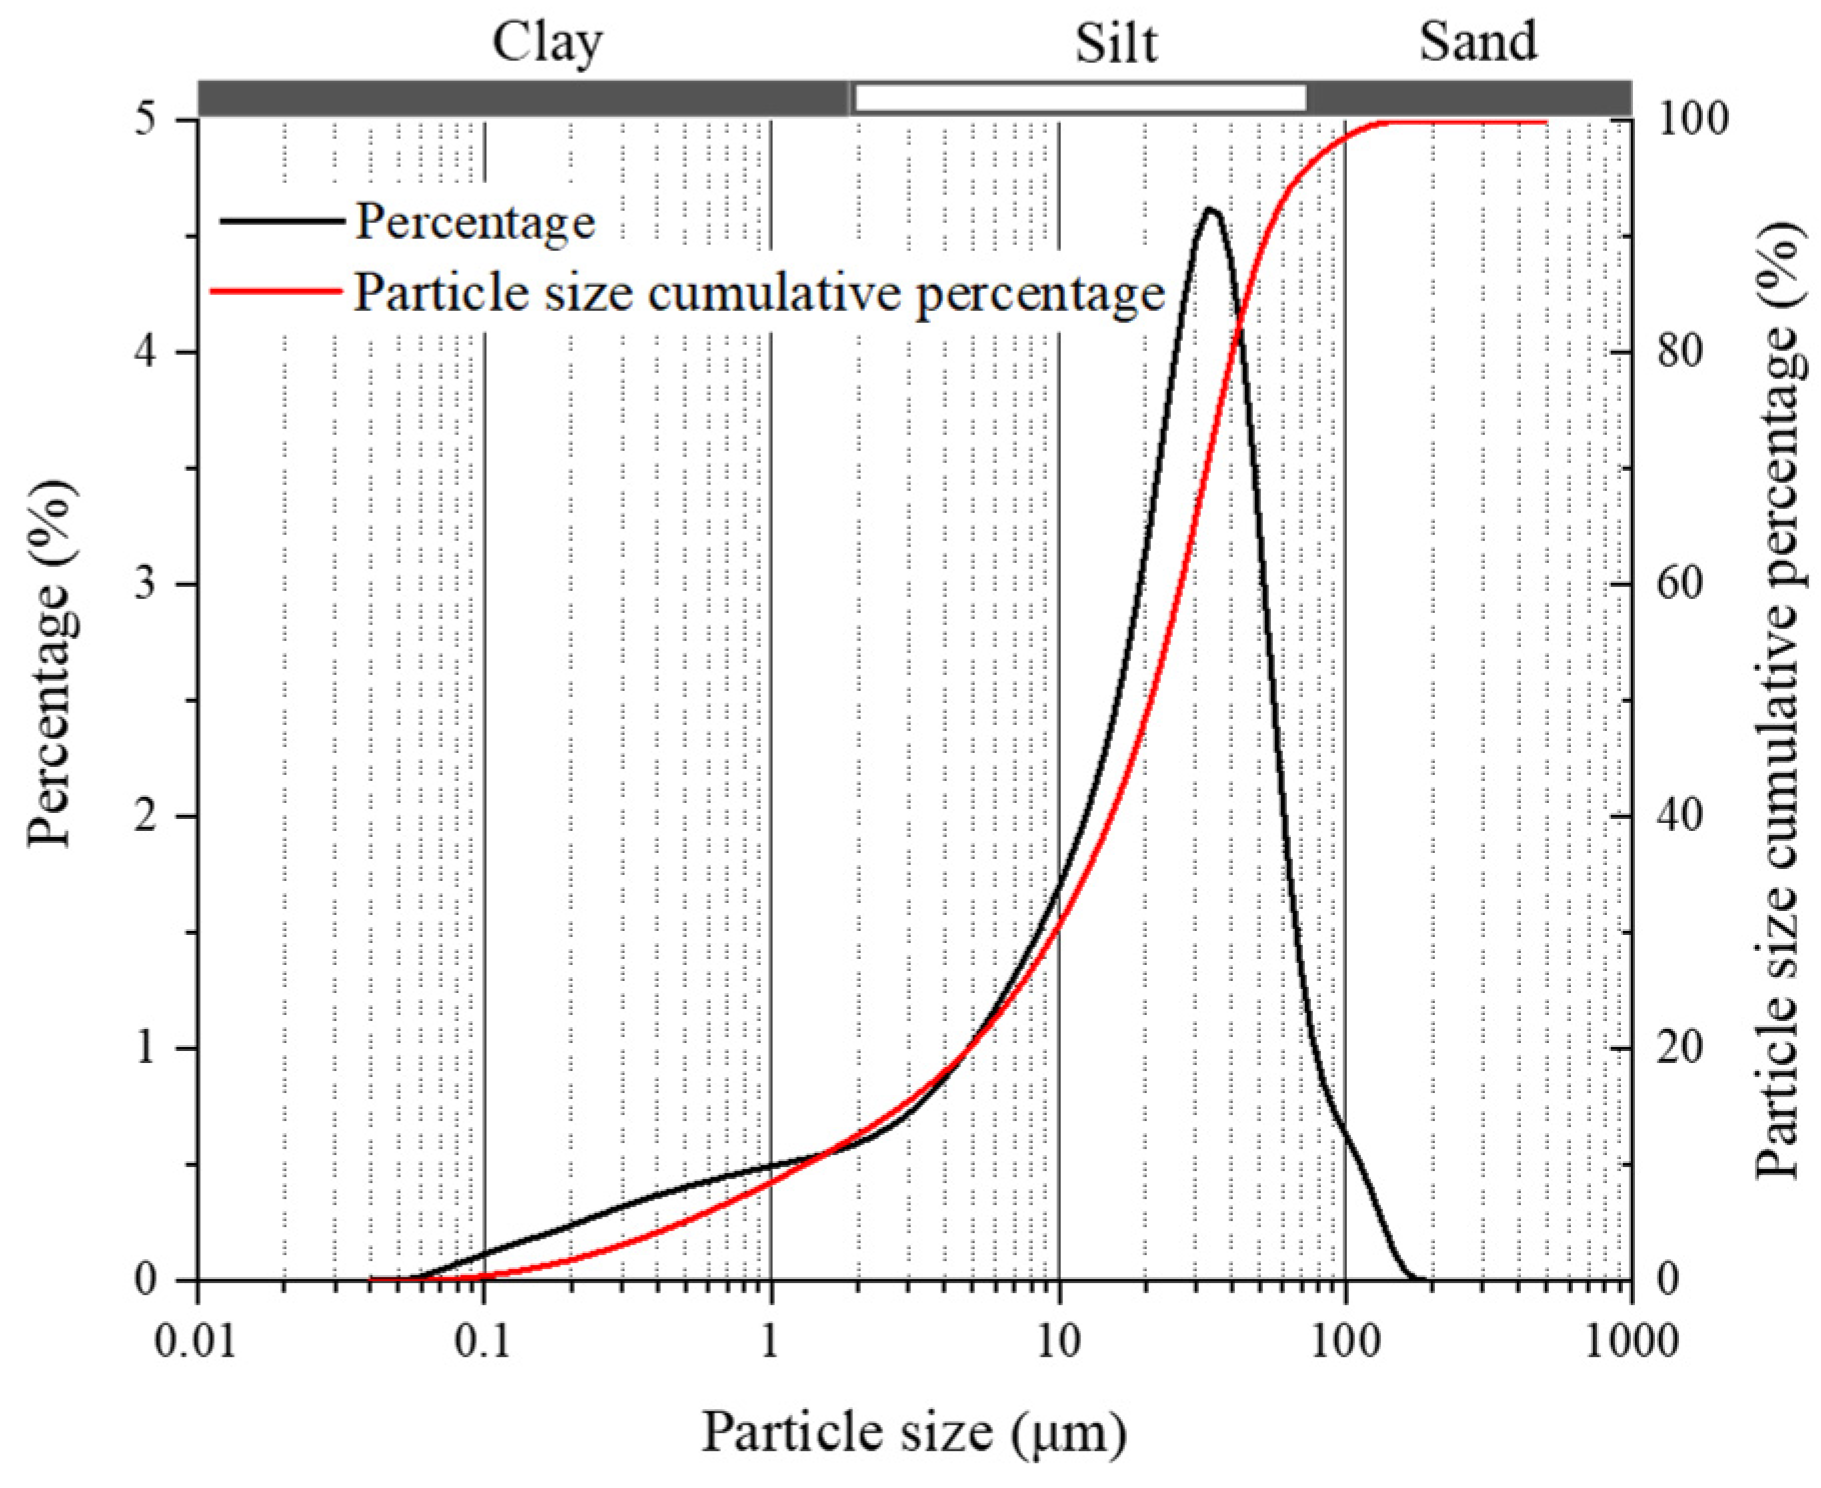
Figure 3.
Macroscopic photographs of soil samples under different molding water contents.
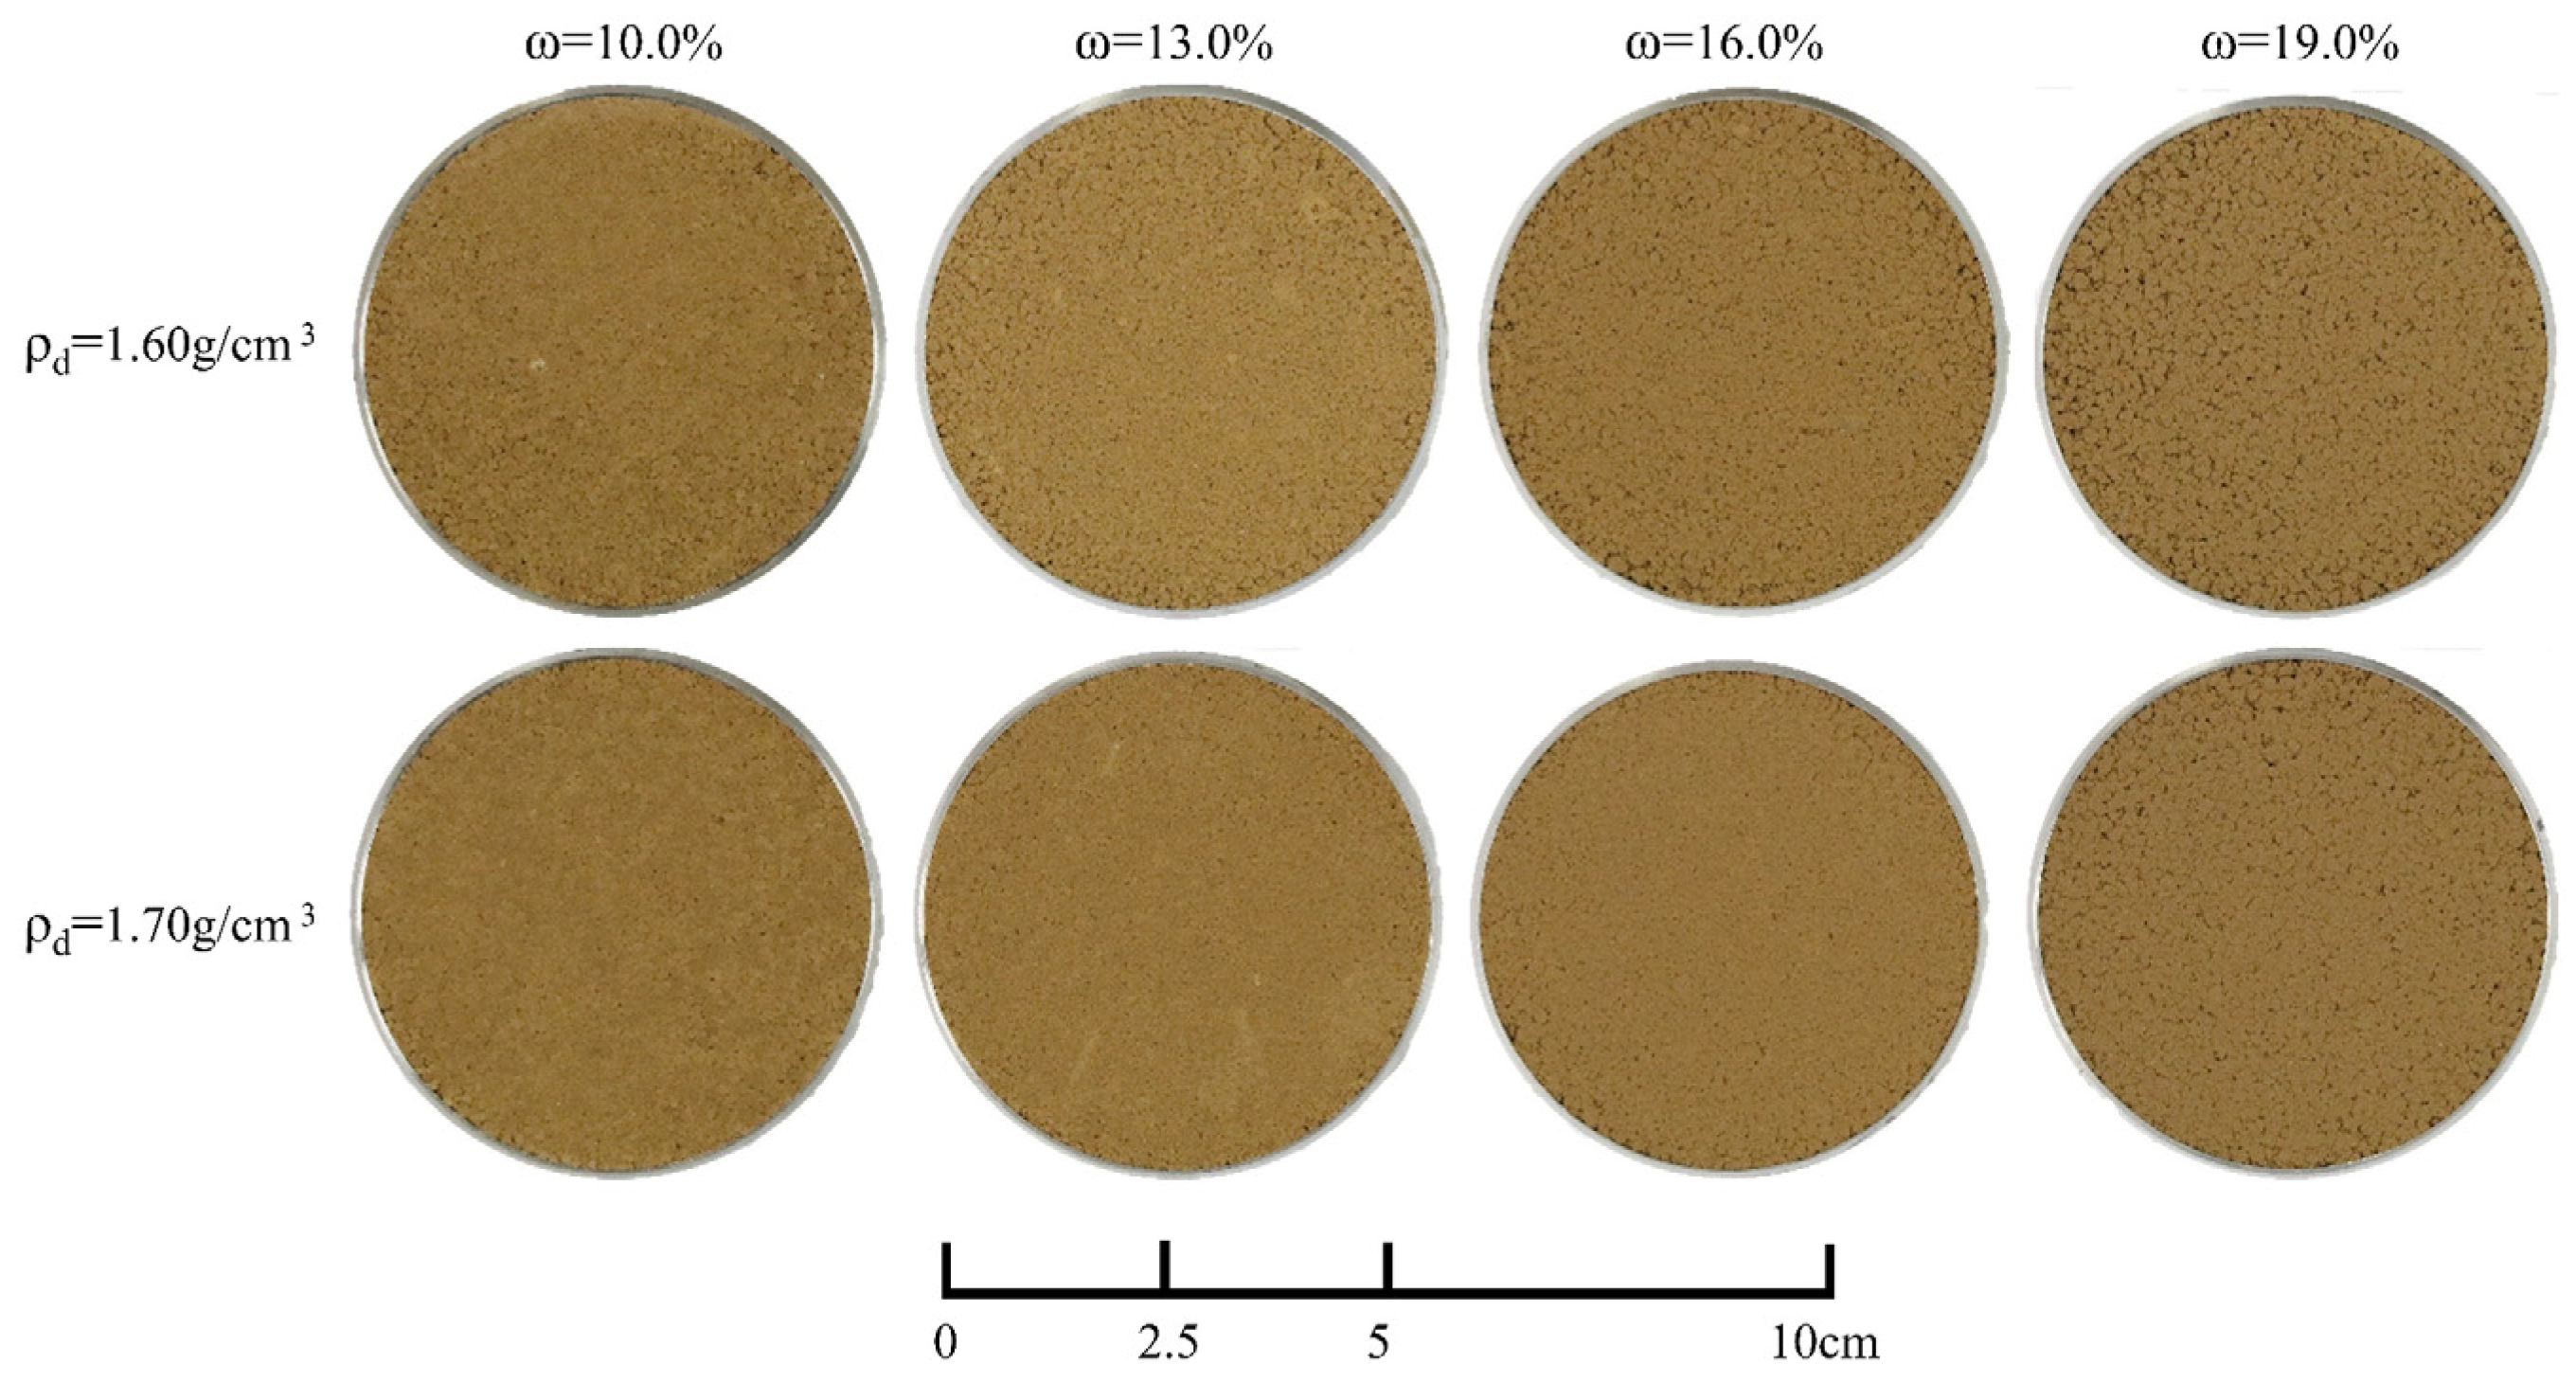
Figure 4.
Photoshop processing techniques: (a) original image prior to processing; (b) steps of Photoshop processing; (c) image after Photoshop processing; (d) binarized image after threshold application.
Figure 4.
Photoshop processing techniques: (a) original image prior to processing; (b) steps of Photoshop processing; (c) image after Photoshop processing; (d) binarized image after threshold application.
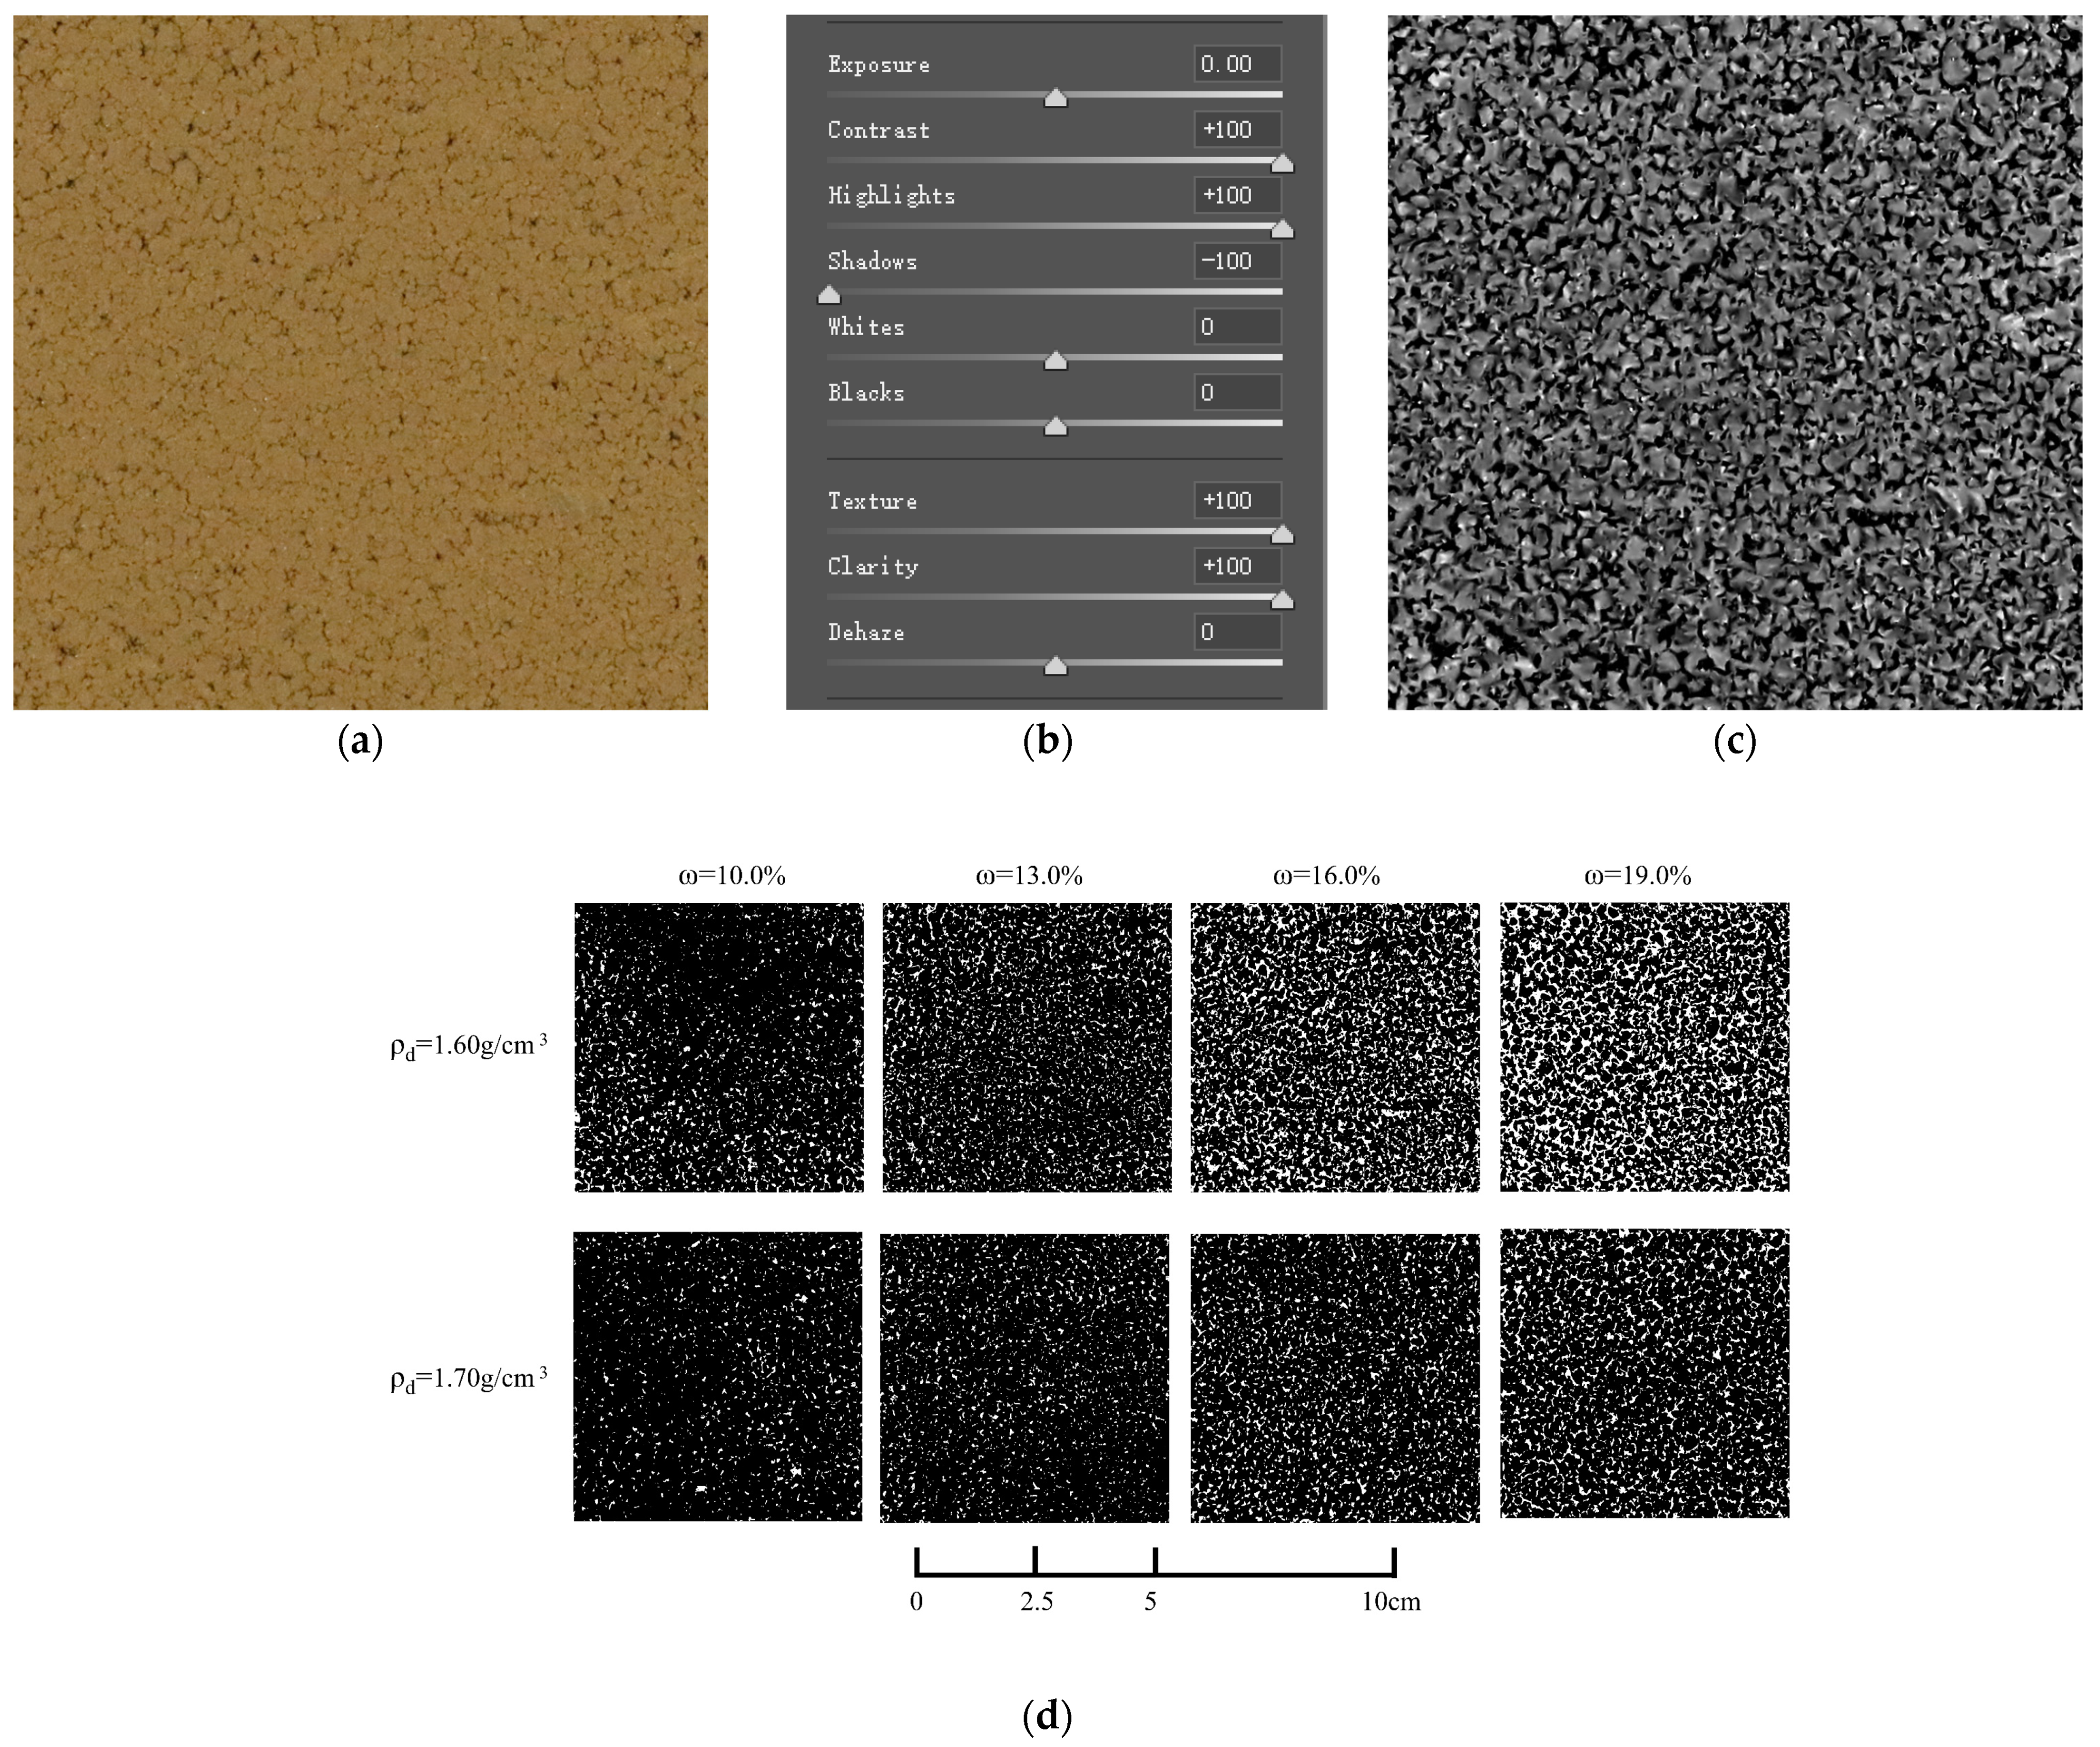
Figure 5.
The analysis results of macroscopic pore characteristics of remolded loess: (a) the relationship between probability entropy, porosity, and molding water content; (b) the relationship between average shape factor, fractal dimension, and molding water content.
Figure 5.
The analysis results of macroscopic pore characteristics of remolded loess: (a) the relationship between probability entropy, porosity, and molding water content; (b) the relationship between average shape factor, fractal dimension, and molding water content.

Figure 6.
The log e–log P curve for remolded loess.

Figure 7.
PSD curves of soil samples with different molding water contents: (a) ρd = 1.6 g/cm3; (b) ρd = 1.7 g/cm3.
Figure 7.
PSD curves of soil samples with different molding water contents: (a) ρd = 1.6 g/cm3; (b) ρd = 1.7 g/cm3.
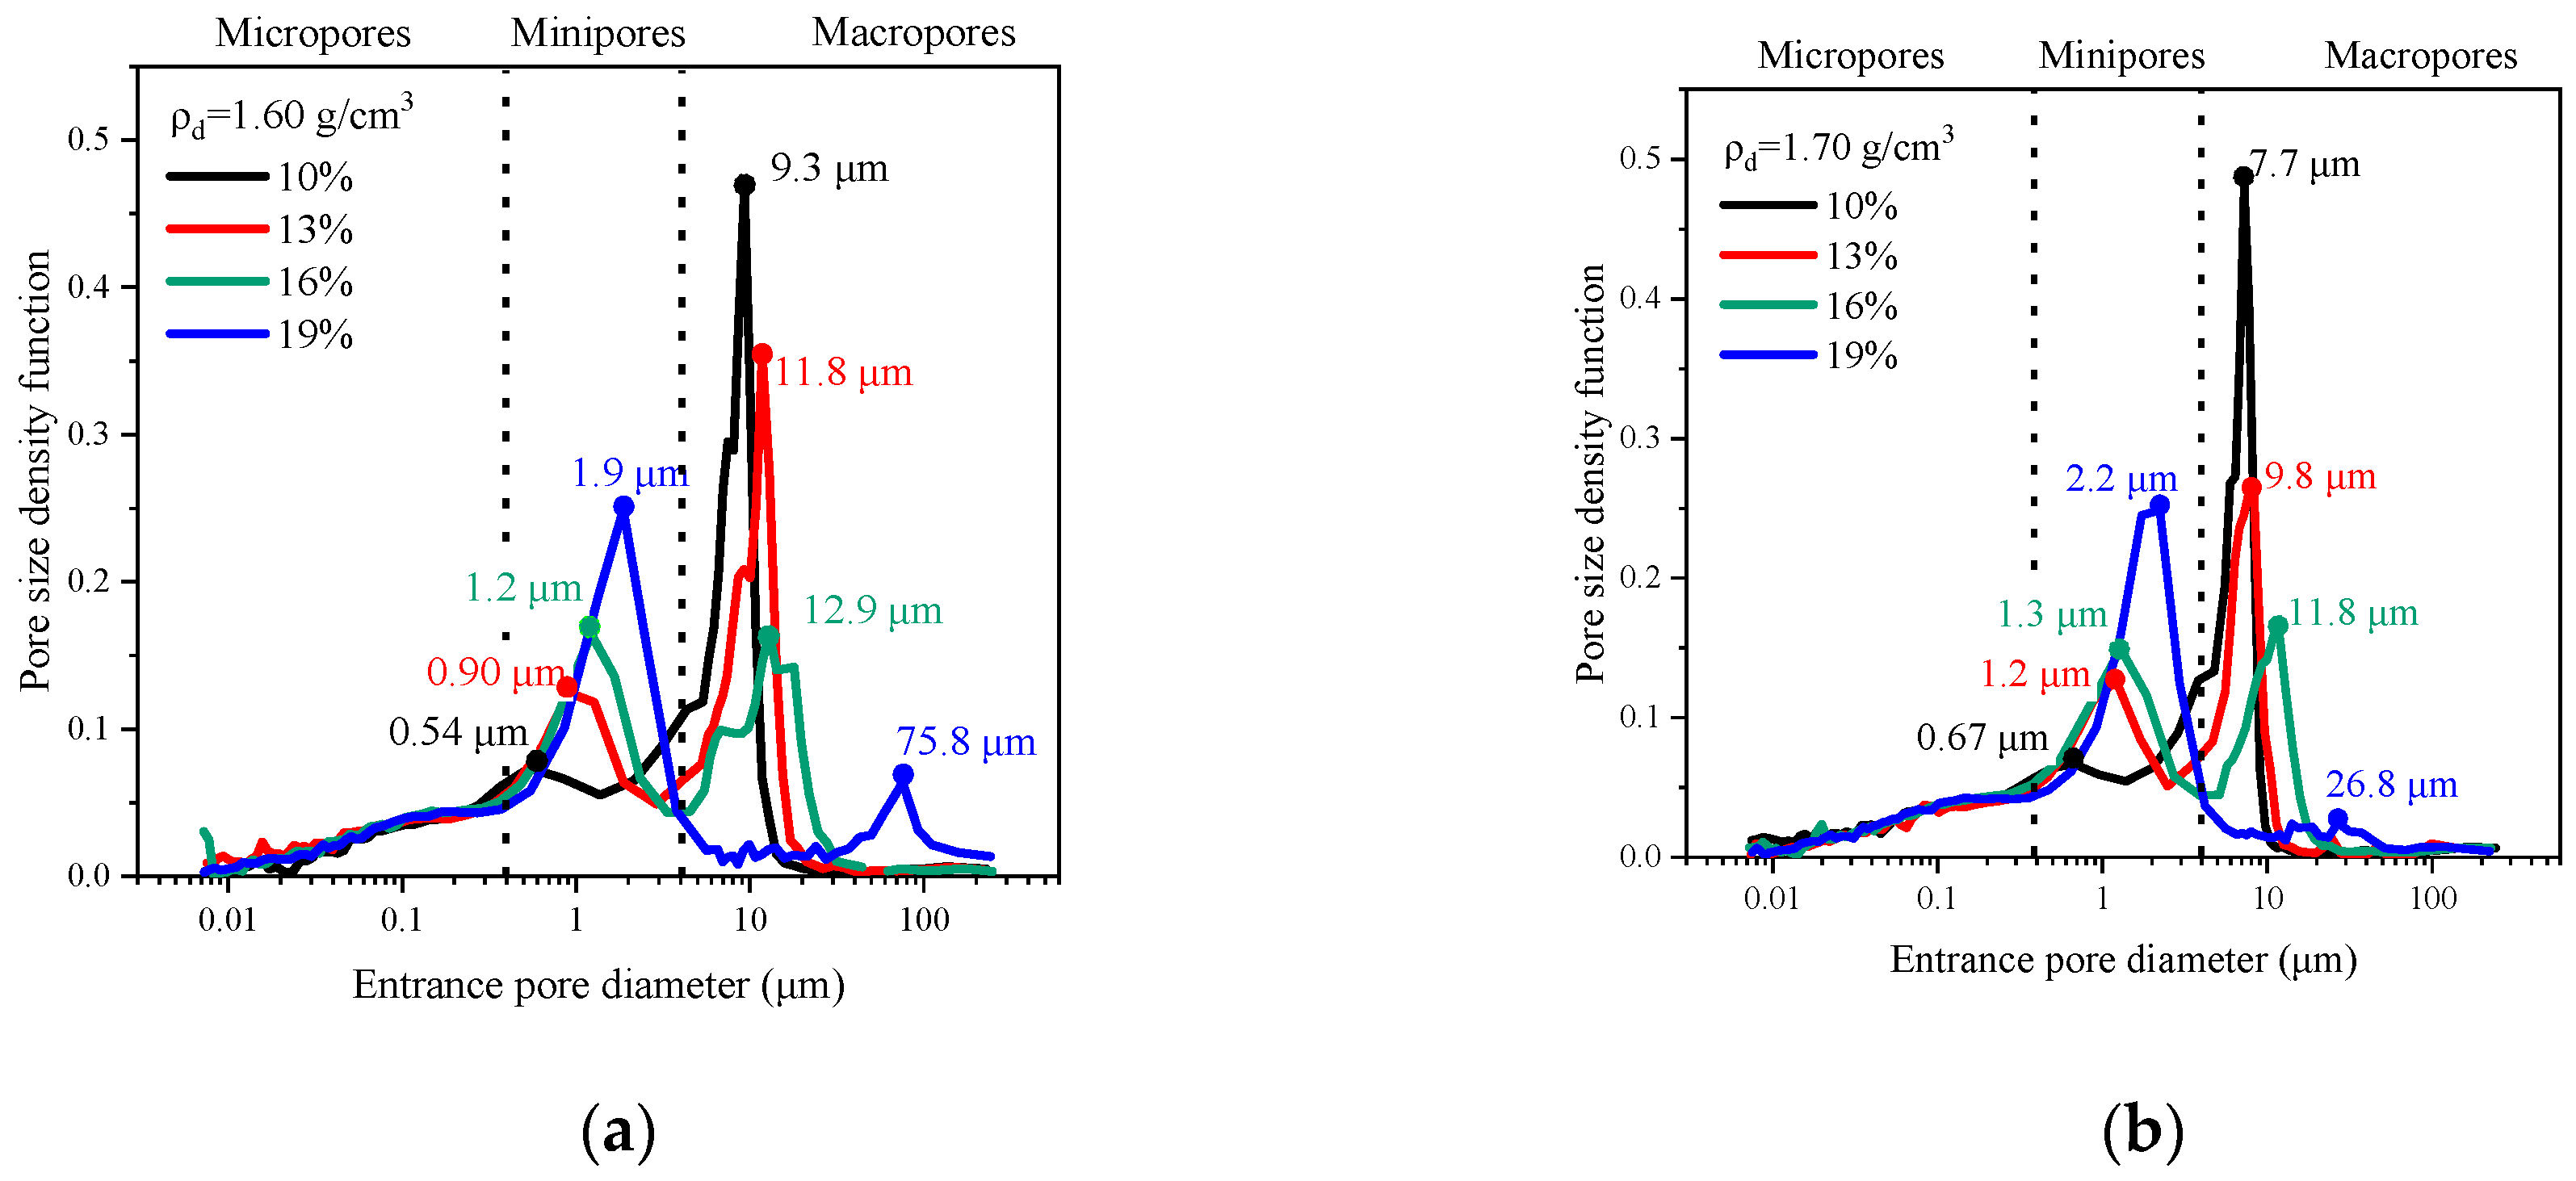
Figure 8.
Variations in pore volume with molding water content for different pore categories (the histogram shows the three types of pore volume. The pie chart shows the percentage of the three types of pore volume): (a) ρd = 1.60 g/cm3; (b) ρd = 1.70 g/cm3.
Figure 8.
Variations in pore volume with molding water content for different pore categories (the histogram shows the three types of pore volume. The pie chart shows the percentage of the three types of pore volume): (a) ρd = 1.60 g/cm3; (b) ρd = 1.70 g/cm3.
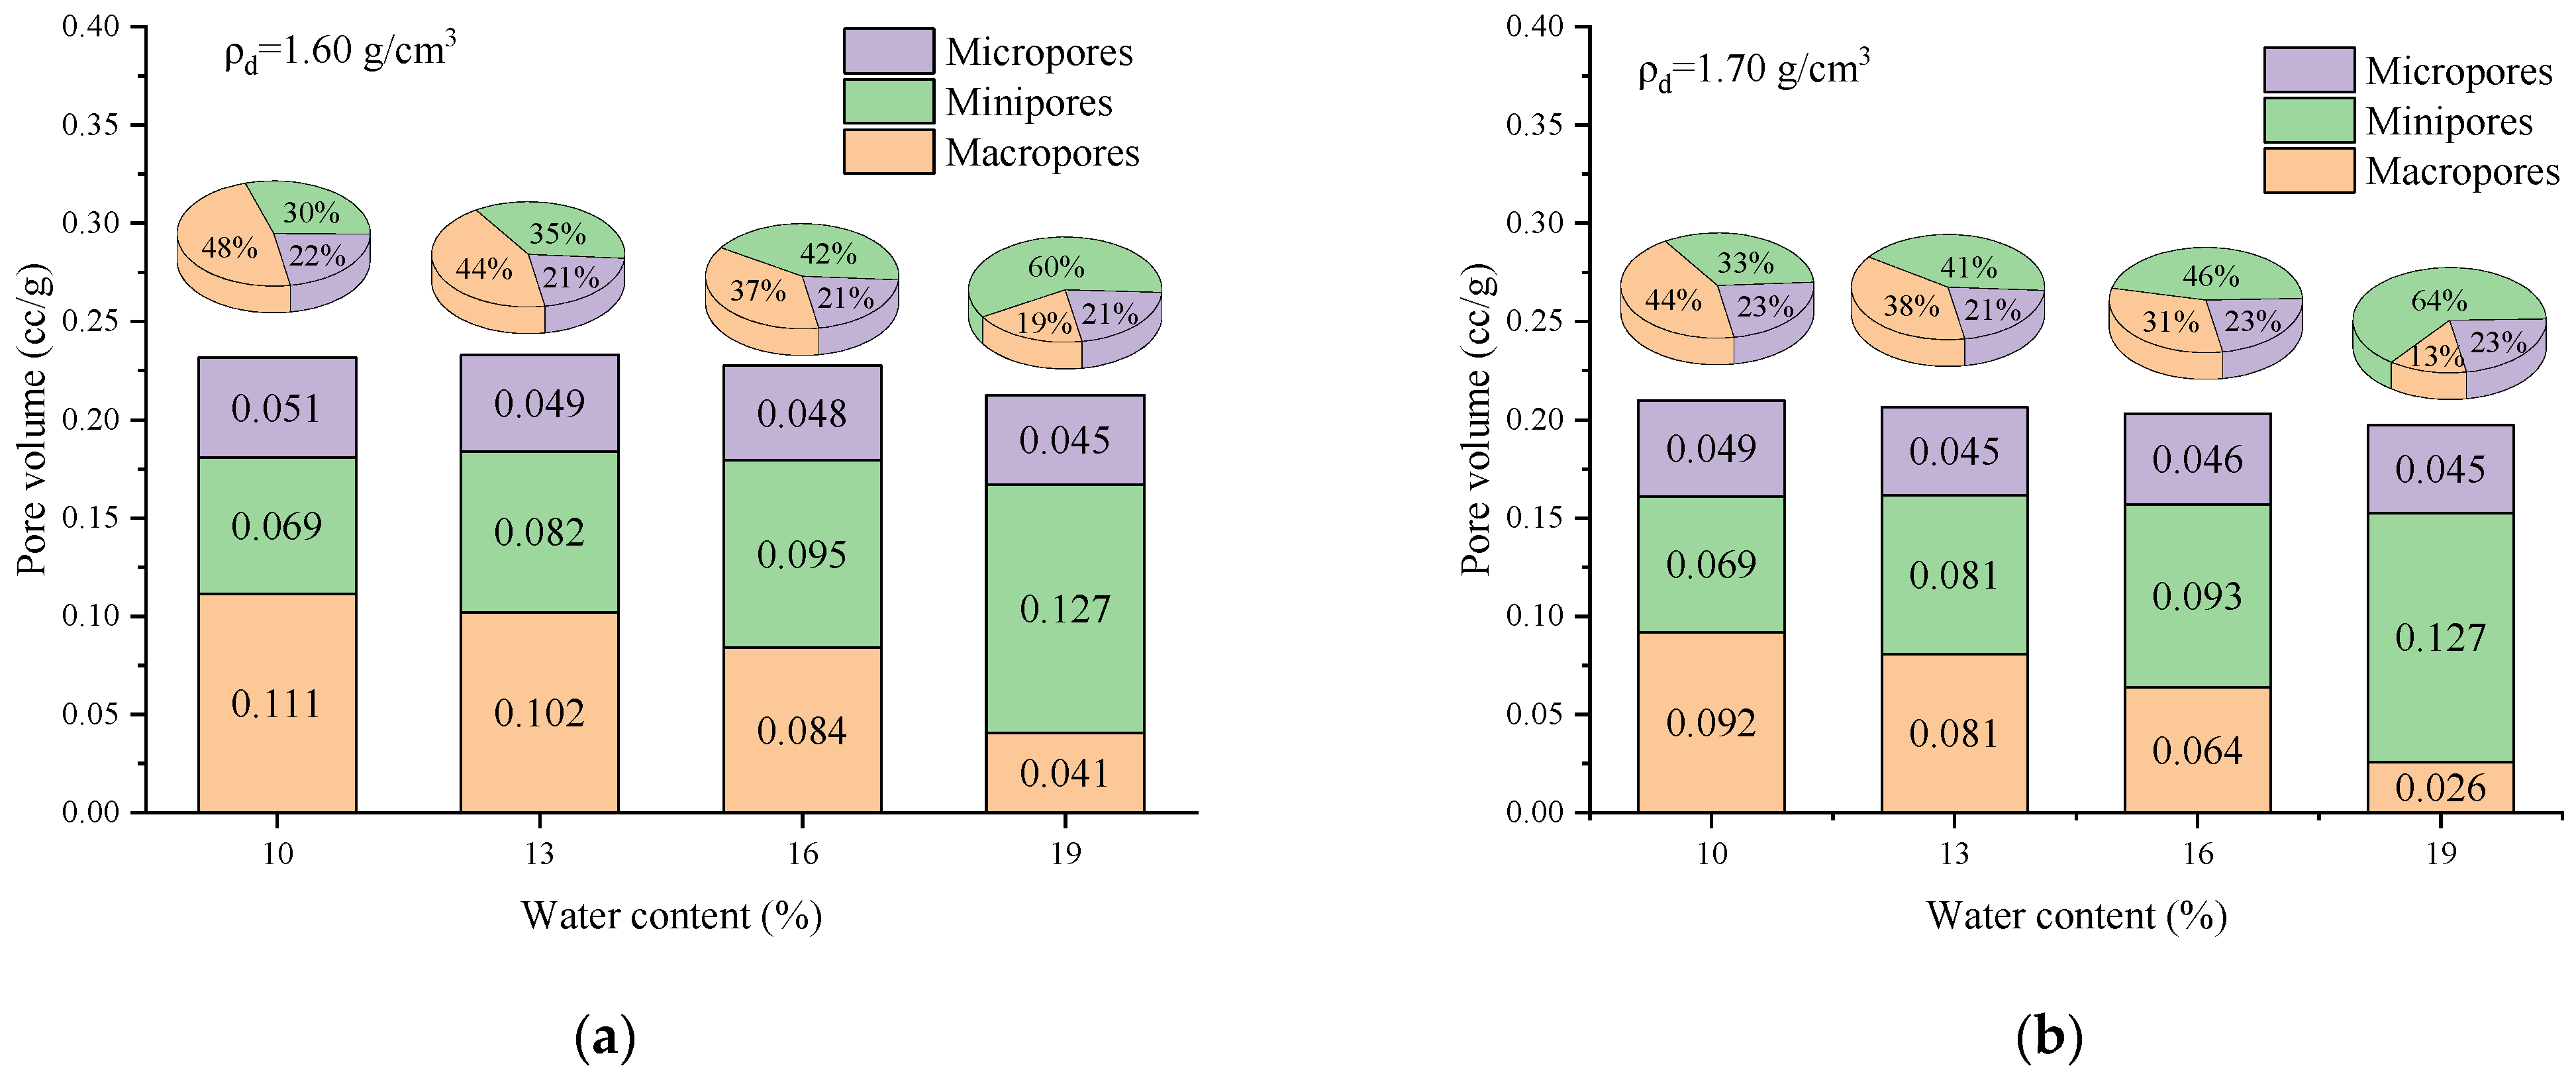
Figure 9.
SEM images of remolded loess: (a) intergranular pores in remolded loess; (b) mosaic pores and intragranular pores in remolded loess.
Figure 9.
SEM images of remolded loess: (a) intergranular pores in remolded loess; (b) mosaic pores and intragranular pores in remolded loess.

Figure 10.
SEM images of different molding water content: (a) ρd = 1.60 g/cm3, ω = 10.0%; (b) ρd = 1.60 g/cm3, ω = 13.0%; (c) ρd = 1.60 g/cm3, ω = 16.0%; (d) ρd = 1.60 g/cm3, ω = 19.0%; (e) ρd = 1.70 g/cm3, ω = 10.0%; (f) ρd = 1.70 g/cm3, ω = 13.0%; (g) ρd = 1.70 g/cm3, ω = 16.0%; (h) ρd = 1.70 g/cm3, ω = 19.0%.


Figure 11.
PSD curves of remodeled loess under different overburden stresses: (a) ρd = 1.60 g/cm3; (b) ρd = 1.70 g/cm3.
Figure 11.
PSD curves of remodeled loess under different overburden stresses: (a) ρd = 1.60 g/cm3; (b) ρd = 1.70 g/cm3.

Figure 12.
Variation of various types of pores under different overburden stress: (a) ρd = 1.60 g/cm3; (b) ρd = 1.70 g/cm3.
Figure 12.
Variation of various types of pores under different overburden stress: (a) ρd = 1.60 g/cm3; (b) ρd = 1.70 g/cm3.
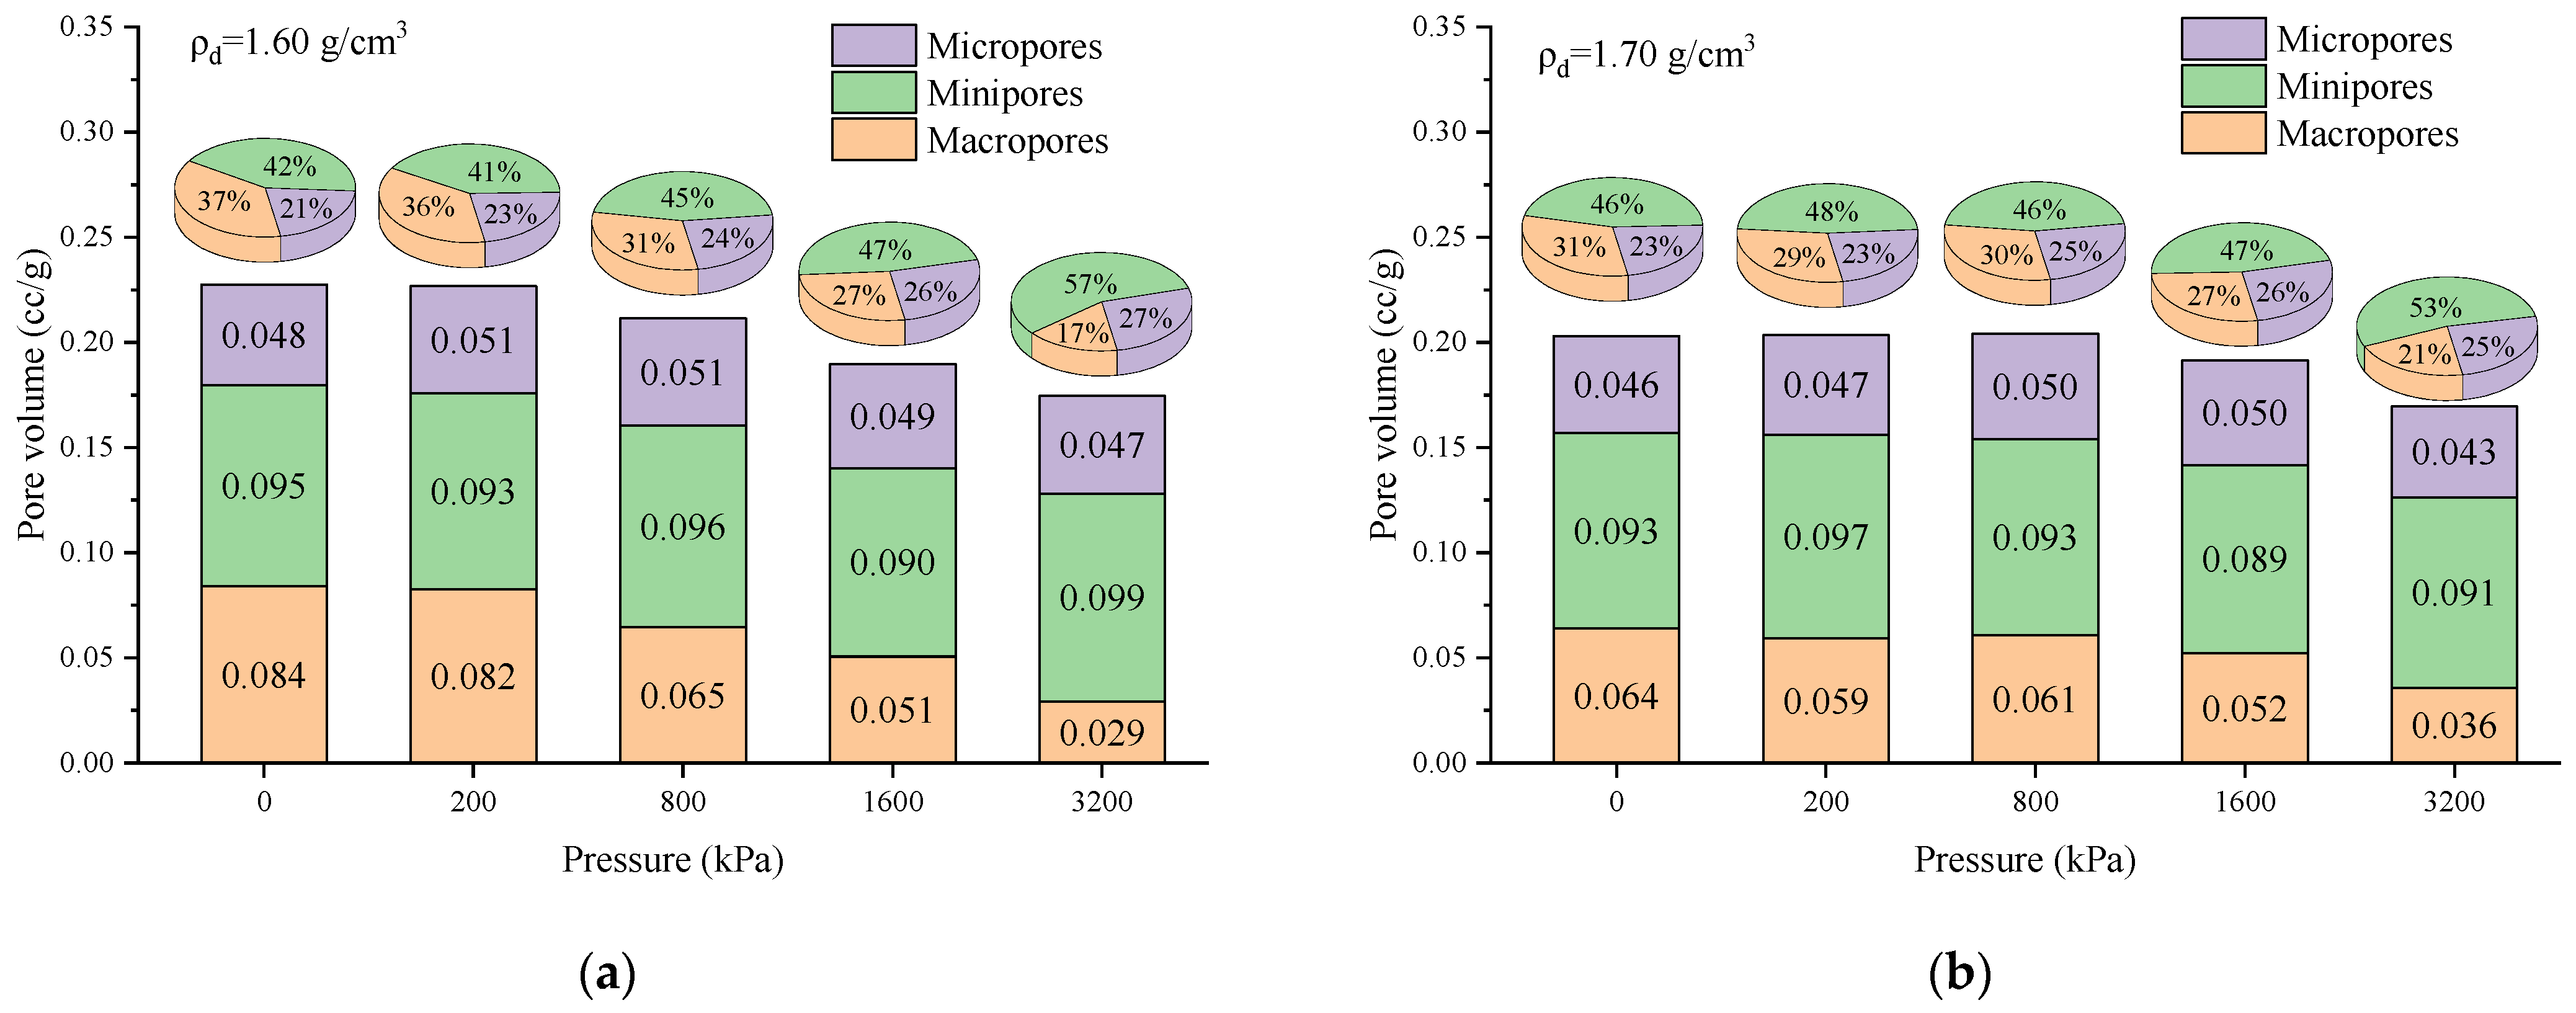
Figure 13.
SEM images of remodeled loess consolidated under different overburden stresses: (a) ρd = 1.60 g/cm3, P = 200 kPa; (b) ρd = 1.60 g/cm3, P = 800 kPa; (c) ρd = 1.60 g/cm3, P = 1600 kPa; (d) ρd = 1.60 g/cm3, P = 3200 kPa; (e) ρd = 1.70 g/cm3, P = 200 kPa; (f) ρd = 1.70 g/cm3, P = 800 kPa; (g) ρd = 1.70 g/cm3, P = 1600 kPa; (h) ρd = 1.70 g/cm3, P = 3200 kPa.
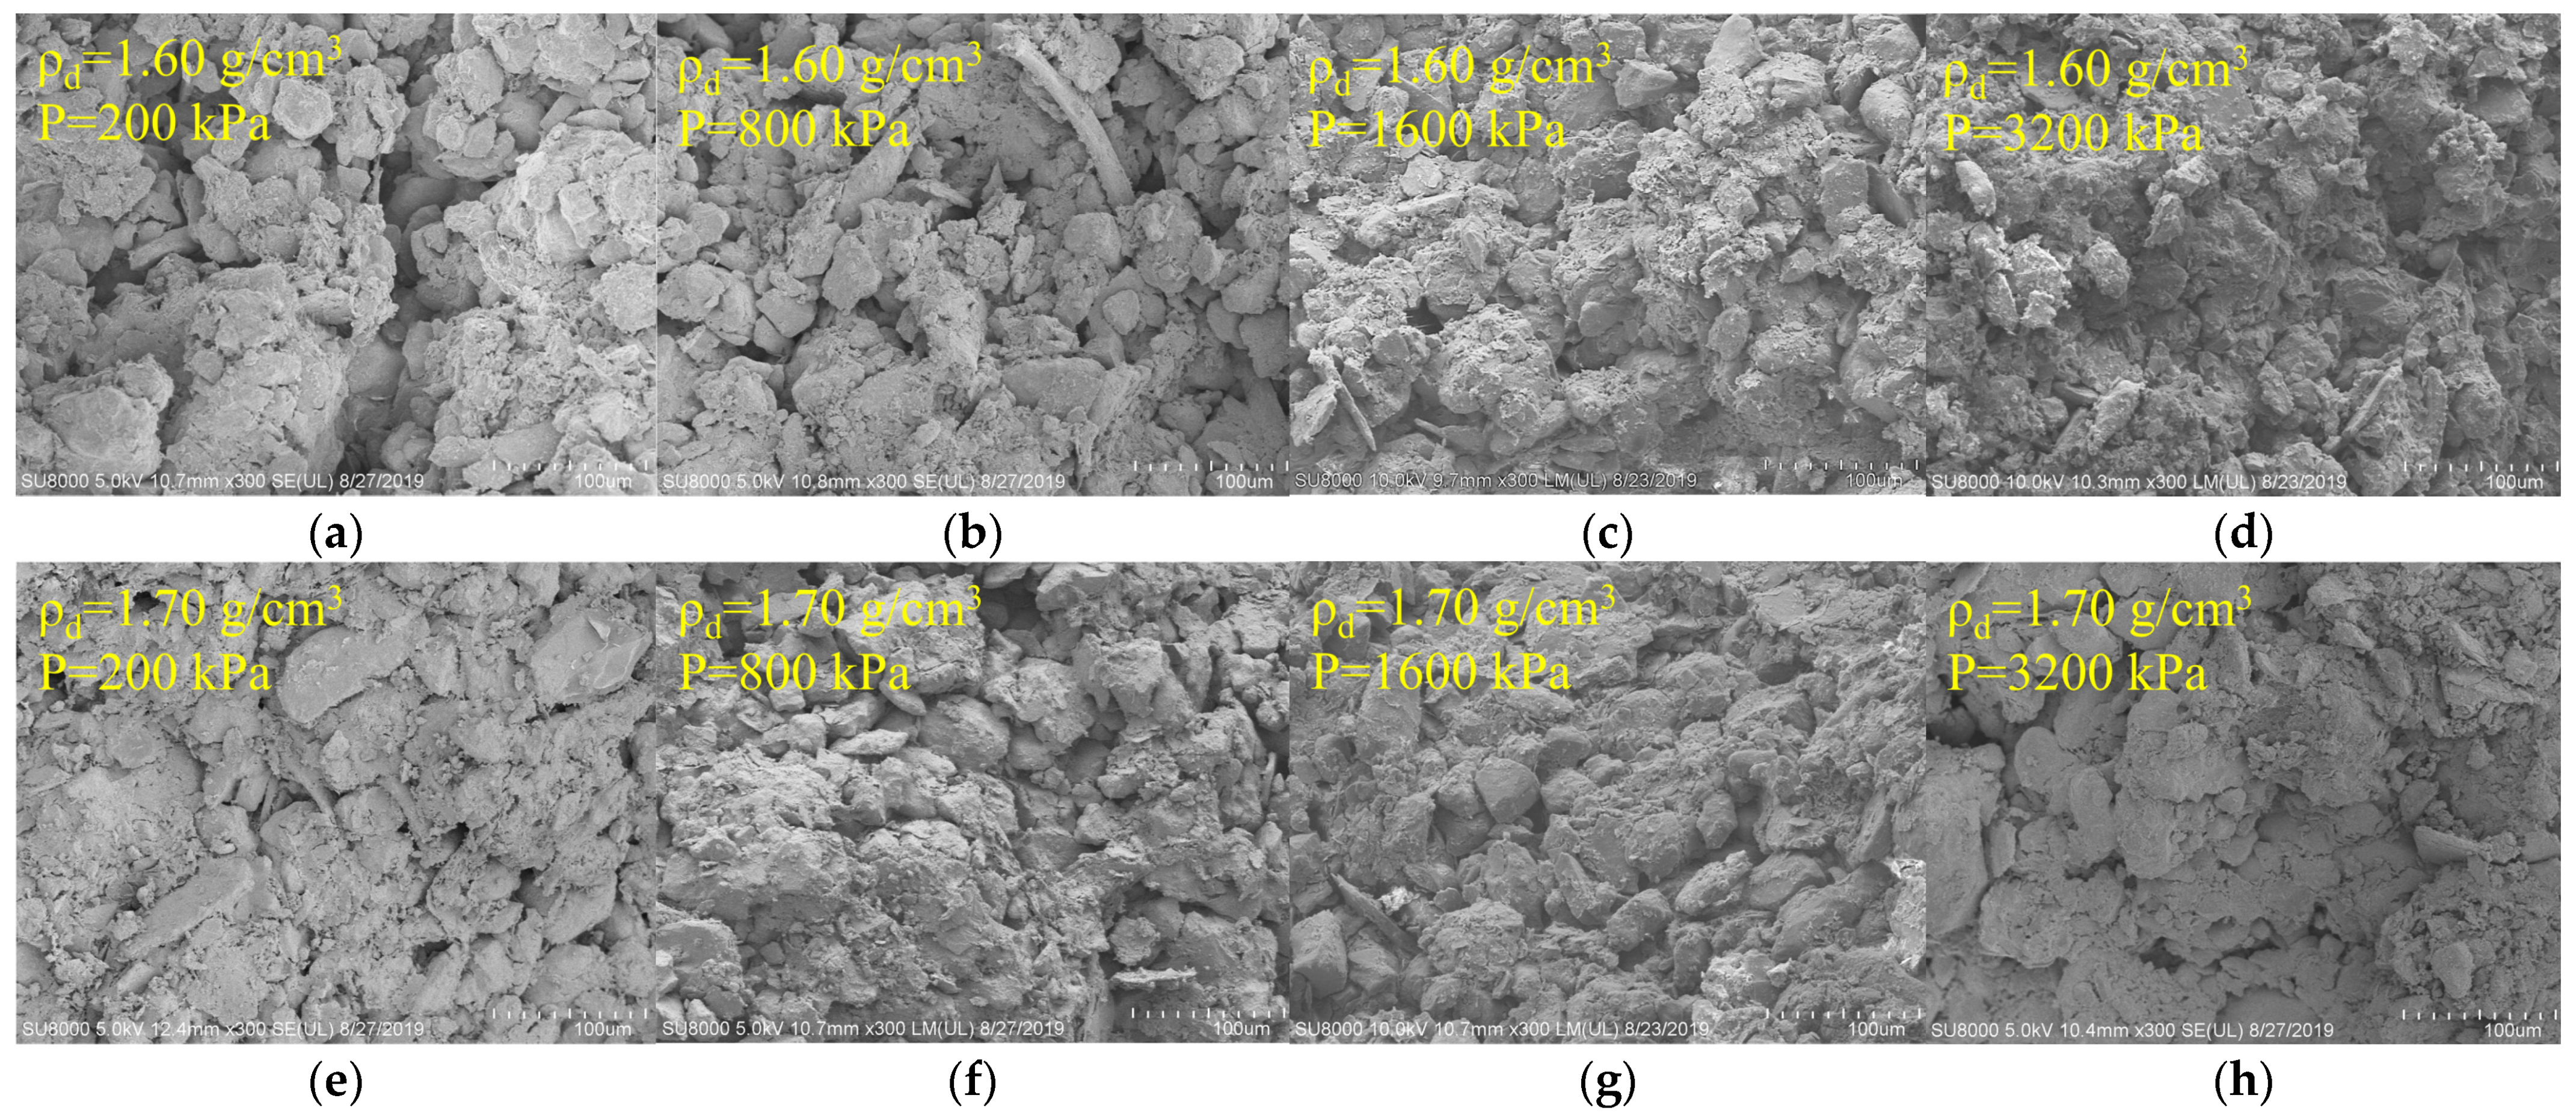
Figure 14.
Calculation of fractal dimension based on Menger model.
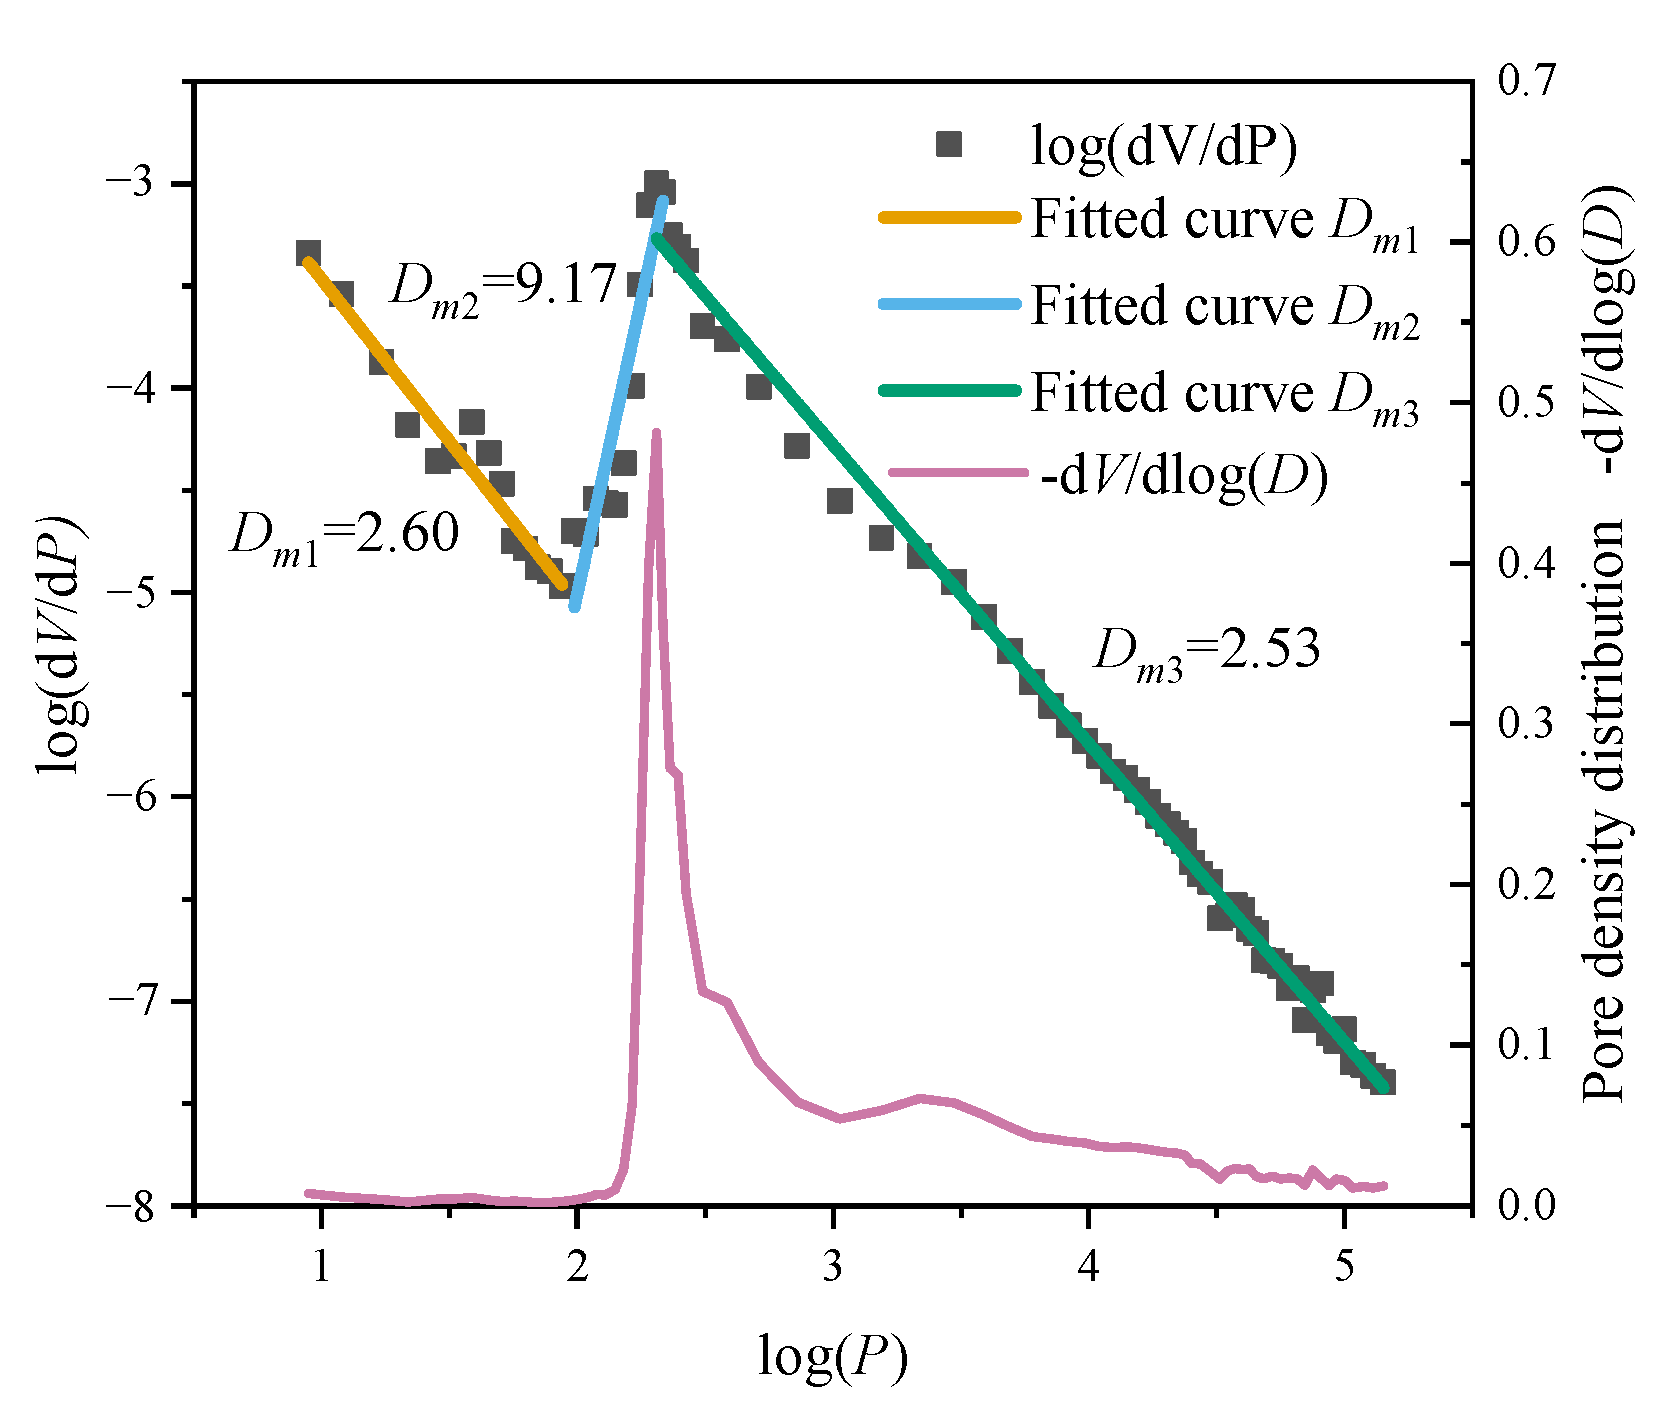
Figure 15.
(a) Relationship between fractal dimension Dm and molding water content; (b) relationship between fractal dimension Dm and overburden stress.
Figure 15.
(a) Relationship between fractal dimension Dm and molding water content; (b) relationship between fractal dimension Dm and overburden stress.

Figure 16.
Conceptual diagram illustrating the microstructure of remolded loess under different molding water content conditions: (a) significantly lower than the optimum water content; (b) slightly lower than the optimum water content; (c) optimum water content; (d) higher than the optimum water content.

Figure 17.
Conceptual illustration of microstructure evolution in remolded loess under different overburden stresses: (a) overburden stress below yield stress. (b) overburden stress above yield stress.
Figure 17.
Conceptual illustration of microstructure evolution in remolded loess under different overburden stresses: (a) overburden stress below yield stress. (b) overburden stress above yield stress.

Table 1.
Physical properties of the test material.
| Moisture Content ω (%) | Dry Density ρ (g/cm3) | Specific Gravity Gs | Atterberg Limits (%) | Grain-Size Distribution (μm, %) | Optimum Moisture Content ω (%) | Maximum Dry Density (g/cm3) | ||||
|---|---|---|---|---|---|---|---|---|---|---|
| Liquid Limit ωL | Plastic Limit ωP | Plasticity Index IP | Sand (>75) | Silt (75–5) | Clay (<5) | |||||
| 13.3 | 1.54 | 2.71 | 28.5 | 18.7 | 9.8 | 3.7 | 74.8 | 21.5 | 16 | 1.80 |
Table 2.
Mineralogical composition of the test material.
| Mineral | Quartz | K-Feldspar | Plagioclase | Calcspar | Dolomite | Pyrite | Total Amount of Caly Minerals |
|---|---|---|---|---|---|---|---|
| Content (%) | 38.9 | 4.0 | 12.5 | 16.8 | 3.9 | 2.4 | 21.5 |
Table 3.
SEM and MIP test samples.
| Sample ID | Dry Density g/cm3 | Water Content % | Consolidation Pressure kPa |
|---|---|---|---|
| W-1.6-10 | 1.60 | 10.0 | 0 |
| W-1.6-13 | 13.0 | ||
| W-1.6-16 | 16.0 | ||
| W-1.6-19 | 19.0 | ||
| W-1.7-10 | 1.70 | 10.0 | 0 |
| W-1.7-13 | 13.0 | ||
| W-1.7-16 | 16.0 | ||
| W-1.7-19 | 19.0 | ||
| C-1.6-200 | 1.60 | 16.0 | 200 |
| C-1.6-800 | 800 | ||
| C-1.6-1600 | 1600 | ||
| C-1.6-3200 | 3200 | ||
| C-1.7-200 | 1.70 | 16.0 | 200 |
| C-1.7-800 | 800 | ||
| C-1.7-1600 | 1600 | ||
| C-1.7-3200 | 3200 |
Table 4.
Fractal dimensions of remolded loess.
| Sample ID | Dm1 | Dm2 | Dm3 |
|---|---|---|---|
| W-1.6-10 | 2.61048 | 7.43070 | 2.54722 |
| W-1.6-13 | 2.62053 | 7.81859 | 2.62541 |
| W-1.6-16 | 2.64831 | 6.31308 | 2.68520 |
| W-1.6-19 | 2.77874 | 5.24280 | 2.37166 |
| W-1.7-10 | 2.5961 | 8.54381 | 2.52552 |
| W-1.7-13 | 2.59564 | 9.81093 | 2.58307 |
| W-1.7-16 | 2.57450 | 7.35865 | 2.68182 |
| W-1.7-19 | 3.29024 | 5.64443 | 2.08718 |
| C-1.6-200 | 2.58117 | 7.16689 | 2.72107 |
| C-1.6-800 | 2.60997 | 8.12846 | 2.71913 |
| C-1.6-1600 | 2.69288 | 9.68280 | 2.66771 |
| C-1.6-3200 | 2.55239 | 8.02293 | 2.63612 |
| C-1.7-200 | 2.62184 | 7.37648 | 2.68542 |
| C-1.7-800 | 2.61201 | 7.80125 | 2.72574 |
| C-1.7-1600 | 2.64515 | 9.95030 | 2.6769 |
| C-1.7-3200 | 2.60360 | 9.55646 | 2.65292 |
Disclaimer/Publisher’s Note: The statements, opinions and data contained in all publications are solely those of the individual author(s) and contributor(s) and not of MDPI and/or the editor(s). MDPI and/or the editor(s) disclaim responsibility for any injury to people or property resulting from any ideas, methods, instructions or products referred to in the content. |
© 2023 by the authors. Licensee MDPI, Basel, Switzerland. This article is an open access article distributed under the terms and conditions of the Creative Commons Attribution (CC BY) license (https://creativecommons.org/licenses/by/4.0/).
Share and Cite
MDPI and ACS Style
Qi, Z.; Li, Z. The Influence of Overburden Stress and Molding Water Content on the Microstructure of Remolded Loess. Sustainability 2023, 15, 12401. https://doi.org/10.3390/su151612401
AMA Style
Qi Z, Li Z. The Influence of Overburden Stress and Molding Water Content on the Microstructure of Remolded Loess. Sustainability. 2023; 15(16):12401. https://doi.org/10.3390/su151612401
Chicago/Turabian StyleQi, Zhiyu, and Zhiqing Li. 2023. "The Influence of Overburden Stress and Molding Water Content on the Microstructure of Remolded Loess" Sustainability 15, no. 16: 12401. https://doi.org/10.3390/su151612401
Note that from the first issue of 2016, this journal uses article numbers instead of page numbers. See further details here.