

An Experimental and Numerical Investigation of the Characteristics and Mechanism of Spacing Cracks in Loess Considering the Size Effect
School of Human Settlements and Civil Engineering, Xi’an Jiaotong University, Xi’an 710049, China
*
Author to whom correspondence should be addressed.
Sustainability 2023, 15(16), 12482; https://doi.org/10.3390/su151612482
Submission received: 20 June 2023
/
Revised: 26 July 2023
/
Accepted: 26 July 2023
/
Published: 16 August 2023
(This article belongs to the Special Issue Principle of Unsaturated Soil Mechanics for Sustainability in Engineering Practice)
Abstract
:Loess is a special soil with high water sensitivity which covers a large area in Northwest China. Cracks are prone to generate in loess under the arid and semiarid climates, which will provide a preferential channel for water and reduce the mechanical properties of soils. It is of great significance to understand the evolution characteristics and mechanisms of the cracks in loess areas. At present, research on cracks in soils mainly concentrates on the characteristics of different cracking patterns. However, spacing cracks are mostly discussed in materials like rock and concrete rather than soils. The cracking characteristics and mechanisms of spacing cracks in loess are still inadequate. In this research, drying tests of loess are carried out with different sizes of specimens. The parameters of spacing cracks and local strain distributions of the loess samples are obtained via PCAS and DIC methods during desiccation, respectively. The cracking modes, spacing cracking laws like insertion, and the saturation of spacing cracks are revealed. Finally, the size effect on the characteristics of spacing cracks is verified with the discrete element software MatDEM.
1. Introduction
Loess is an Aeolian soil formed during the Quaternary geological period. It is widely distributed in Northwestern China, where the Loess Plateau is located, covering an area of about 640,000 km2 [1]. Loess is a highly water-sensitive soil with large pores and unstable structures. As a special soil, collapsibility is an important property of loess and can be described as a sudden decrease in strength in response to wetting. Loess collapse can be attributed to the open metastable microstructure in which the bonding strength is greatly weakened by water. In the arid and semiarid climates of the Loess Plateau in China, the moisture field in the loess changes dramatically due to water evaporation [2]. The decrease in water content leads to an increase in suction in loess. Once the suction exceeds the tensile strength of loess, which is greatly weakened due to collapse, cracks appear. Therefore, microcracks, pores, cracks, and joints are frequently and randomly distributed in loess. Vertical joints and cracks are frequently developed in loess, which result in the collapse of the loess under the condition of rainfall or irrigation [3,4,5]. Various construction project applications in the Loess Plateau of China provide many development opportunities. However, they also bring many unprecedented geotechnical problems due to the special characteristics of loess [6,7,8].
There are different patterns of cracks in soils, among which cracks in networks or circle forms are more frequently observed. Interval parallel cracks, also called spacing cracks, are more commonly observed in layered rocks and bar-like soils. The presence of cracks can significantly affect the behavior of the soil, including soil volume variations, disintegration, permeability, residual shear, tensile strength, etc. [9,10]. These changes greatly reduce the mechanical properties of soils. Cracks related to desiccation also destroy soil integrity and provide a preferential path for water infiltration, reducing the stability of slopes or hydraulic construction [11,12,13,14,15,16]. Therefore, it is particularly important to explore the influencing factors and mechanisms of cracks related to drying in soils.
During drying, soils are prone to cracking when the tensile stress of the soil exceeds its tensile strength [17,18,19,20,21]. In order to understand the cracking mechanism of soil during drying, the factors affecting the evolution of cracks have been well studied. The main internal factors include the physical properties and mineral composition of soils, etc. [22,23]. The main external factors are layer thickness [9,24,25], boundary conditions [19,26], temperature [24,27,28], relative humidity, etc. [21,29,30]. However, in-depth studies about the characteristics and mechanisms of spacing cracks are still inadequate.
Spacing cracks, a special case during the drying of soils, have been determined to be a series of parallel cracks at an interval distance. At present, research on spacing cracks is mainly concentrated on materials with high stiffness such as rocks or concrete. Wu et al. (1995) pointed out that the spacing distribution must have at least three cracks [31]. A series of theoretical results have been obtained. Tang et al. (2006) used RFPA2D-Basic (Version 1.63) software to model the development of spacing cracks in layered materials [32]. Meanwhile, the development of cracks was observed by applying different principal stress ratios on layered materials. The results showed that the material usually breaks with parallel cracks under mechanical layer-parallel tensile forces. Under loads with different principal stress ratios, cracks show a continuous transition from a parallel to a polygonal pattern. Xu et al. (1989) established a mechanical model of narrow and generalized spacing cracks from some typical geological phenomena [33]. By applying tensile strain to the boundary of the model, three factors affecting the initiation of spacing cracks were derived. Bai et al. (2000) studied the phenomenon of spacing cracks and saturation mode in layered materials (sedimentary rocks, etc.) [34]. The true specific fracture energy of a concrete mix was determined in the research by Karihaloo et al. (2003) [35]. During the cracking process, when the distances between two adjacent cracks reach a certain value, more cracks cannot be formed, even if the tensile strains keep increasing. Additional strain is used for widening the existing crack. This phenomenon can be defined as “crack saturation” [31,36]. However, experimental research is relatively rare and spacing cracks in soils are less discussed in research. The studies concentrating on the conditions of crack formation, the law of crack initiation and propagation, the microscopic mechanism, etc., are still insufficient.
There are many theories about spacing cracks, especially in models such as shear lag models, stress transfer models, energy balance theory, etc. [37,38]. Compared with experiments, simulation is another efficient method to interpret the mechanisms of spacing cracks. Most of the modeling materials in research are materials which are idealized by setting parameters. Karihaloo et al. (1990) proposed an effective crack model to predict fracture toughness values [37]. Bažant et al. (1997) took the formulated time-dependent R-curve model to simulate the lifetime of concrete [38]. The above theorical research about modelling provides valuable suggestions for investigating cracking mechanisms in geomaterials.
This research studied the characteristics and mechanism of spacing cracks in loess during drying. As a homogeneous geomaterial, remolded loess is appropriate to demonstrate the spacing cracking laws considering the size effect. Desiccation tests were carried out on five sets of loess samples with different dimensions. The local displacements and strains of the soil samples were obtained with the digital image correlation (DIC) method. The objective of the present paper was to (i) show the variations in the cracking parameters of different loess samples; (ii) reveal the spacing cracking modes of loess; (iii) highlight spacing cracking laws such as the appearance order and the saturation of cracks in loess; (iv) verify the influence of specimen dimension on the characteristics of spacing cracks based on discrete element method.
2. Experimental Materials and Methods
2.1. Materials
In this research, the loess was collected at a depth of 50 m in Jingyang, Shaanxi Province, which is Q4 loess. Shaanxi Province is in Northwestern China, where the Chinese Loess Plateau is located. The material source of the loess is from Mu Us Desert. The physical properties and mineralogy of loess vary greatly in Chinese Loess Plateau. Loess particles with finer size and smaller density are prone to be transferred with longer distances. Therefore, loess can be classified into three types: clayey loess, silty loess, and sandy loess [1]. The soil used in this research is clayey loess. Jingyang is located near the center of Shaanxi Province. According to precipitation distribution map of China, the climate of Shaanxi Province is arid and semi-arid (Figure 1). The temperatures change dramatically during different seasons. Recently, the impact of climate change has been studied widely. A more intense, more frequent, and longer-lasting drought or rainfall has appeared in the last few years [1]. The drought-induced cracks can be observed on the surface of loess plateau.
The particle size distribution of loess is shown in Figure 2. The silt and clay content of Jingyang loess is 82.7% and 17%, respectively. According to Uniform Soil Classification System (ASTM 2021), it is classified as low plastic clay (CL) [39]. The physical properties of loess are summarized in Table 1. The soil sample used in this research is remolded loess. The initial water content of soil sample is 36%, which equals its liquid limit. Before they were put into the plastic mold, the soil samples were placed in a sealed container for about 24 h in order to reach homogenous state.
2.2. Experimental Set-Ups
The confined drying tests were carried out in an air-conditioned room with a temperature of 25 °C and a relative humidity of 30 ± 5%. The length of the soil samples is constant. The ratio of height and width of the soil samples are constant, equal to 1. The dimensions of the soil samples are 1 cm × 1 cm × 30 cm, 2 cm × 2 cm × 30 cm, 3 cm × 3 cm × 30 cm, 4 cm × 4 cm × 30 cm, and 5 cm × 5 cm × 30 cm, respectively. Different volumes of soil samples were set for the purpose of exploring the effect of size on the characteristics of spacing cracks. Dry density of all the samples is controlled at 1.43 g/cm3.
The schematic diagram of the detachable mold for the soil samples is shown in Figure 3a. The mold is made of plexiglass with little friction. It provides boundary limits for the samples. Support a, boundaries b and c are detachable, of which support a is fixed with boundary c by three nails. The length of the mold is 30 cm, which is determined by two fixed plates e and f. They are both stuck on the lower support d. The blue vectors in Figure 3a indicate the sliding direction of plate b. The position of plate a determines the width of the soil sample. The height of plates b and c determines the height of the soil sample. Five sets of plates (b and c) with different heights were made in order to change the height of the soil samples. Remolded loess samples were filled in this mold and compacted in three layers so that the samples can be homogeneous. An example of loess samples with spacing cracks at the end of desiccation is presented in Figure 3b. The experimental set-up for the observation of spacing cracks is shown in Figure 4. A high-speed camera is installed above the soil sample to record the evolution of spacing cracks at regular intervals. A lamp provides a light source for the photos. The specimens and mold are placed on an electronic balance to record the variations in water contents. Detailed information about the experimental setup is presented in Table 2.
2.3. Digital Image Correlation (DIC) Method
The digital image correlation (DIC) method is used for analyzing a series of the specimen photos during desiccation [21,40]. This method requires the surface of the sample to be prepared with random speckled patterns. Therefore, the program can calculate the displacements and strains of the pointes [41,42]. The random dot patterns on the surface of the sample were made by black paint that was sprayed from a distance of about 30 cm. The DIC method permits the correlation of the subsets of pixels in the reference image with their consistent ones in the deformed image (Figure 5). The analytical process used to realize the image correlation is as follows: (i) observation of the image at the beginning of desiccation; (ii) observation of the deformed image at interval time during desiccation; (iii) choosing several cracks of different types to be analyzed in detail; and (iv) precise analysis of the displacement and strains in the vicinity of the chosen cracks. A commercial software VIC-2D (version 7.0) is used to calculate the local displacements and strains between the reference image (before deformation) and the deformed image. Finally, the local strains and displacements on the surface of the soil specimen are obtained using Lagrange interpolation algorithm based on VIC-2D (version 7.0) software.
With VIC-2D, 2 displacement components and 3 strain components can be obtained: U(mm)-longitudinal displacement along the x-axis, V (mm)-transversal displacement along the y-axis, (%)-longitudinal strain along the x direction, (%)-transversal strain along the y direction, and shear strain (%). With these five components, the variations in local displacements and strains on the surface of the sample can be analyzed during the drying process, allowing the interpretations of the cracking mechanism. As an example, Figure 6 shows the result of longitudinal strain of loess samples with the dimension of 5 cm × 5 cm × 30 cm at t = 25 h. The maximum is 4.7% and the minimum is −5.05%. The positive value represents tensile strain while the negative value represents compressive strain. The white vectors on the specimen surface show the global directions of local displacements.
2.4. Discrete Element Method Based on MatDEM Software
The numerical modeling in this research is realized with MatDEM 2.0 developed by Nanjing University, which is a discrete element simulation software based on Newton’s second law [43]. In MatDEM, a discrete element model that couples the moisture field to the stress field is shown in Figure 7. Each unit shown in Figure 7a is composed of soil particles, pores, and pore water. When the water evaporates, the water content of the surface unit gradually decreases and is lower than that of the adjacent unit. As a result of the hydraulic gradient, the water flows from the unit with higher water content to the unit with smaller water content.
The air entry value refers to the suction when the air begins to enter during the desaturation of the soil. When the water content is higher than that related to the air entry value, the soil is saturated, and the water flow obeys Darcy’s law. The equation is as follows:
where is the permeability coefficient; A is the equivalent area of the permeation pathway, taking the average area of the two-element large circle, as shown in Figure 7b; is the difference between the water content of the two adjacent units; presents their bulbar center spacing.
The mechanical properties of the soil also vary with the water content. At the microscopic scale, the connections between different units are correspondingly strengthened. If the strength of the connection is less than the tensile force caused by dry shrinkage, the connection will break. Herein, there will be no water migration between the two units. As the desiccation simulation progresses, the connections among units will break one after the other. Therefore, many micro-cracks are generated in a certain direction to form a macroscopic crack. The numerical modeling of spacing cracks in loess samples with different dimensions was carried out with MatDEM 2.0.
In the corresponding discrete element model, five cuboids of the same size as those used in the experiments were created. The models are composed of a different number of elements with uniform radii. The initial model is made up of default soft balls. Then, the physical properties of loess, such as water content, Young’s modulus and tensile strength, etc., are assigned to the specimen. Following the iterative calculation of drying and shrinkage, the desiccation tests on loess with different dimensions can be simulated by MatDEM software.
3. Experimental Results
3.1. Influence of Sample Size on the Characteristics of Spacing Cracks
3.1.1. Variations of Spacing Cracking Parameters
Figure 8 shows the final patterns of spacing cracks of specimens with different dimensions. The number of cracks decreases as the specimen volume increases. At the end of drying tests, the variations in water contents and parameters of cracks, including the average width, the average spacing of the cracks, the cracking ratio, etc., of samples with different dimensions are analyzed (Figure 9). The cracking ratio is calculated as , where is the surface of the cracks, is the surface of the soil sample. The above parameters are calculated via PCAS (version 2324), an image processing software developed by Nanjing University [44]. The results of the spacing cracks parameters of different loess samples are presented in Table 3.
The relationships between the number of cracks, the average spacing of the cracks and the specimen volume are presented in Figure 9a. It is obvious that as the volume of the specimen increases, the number of spacing cracks decreases. Since the length of the specimen is controlled at 30 cm, the average spacing of the cracks tends to increase with increasing volume. The difference between the crack spacing of loess samples with the dimensions of 4 cm × 4 cm × 30 cm and 5 cm × 5 cm × 30 cm is not obvious, which is due to the small number of spacing cracks. The variations in cracking ratio and the average width of spacing cracks as a function of specimen volume are approximately the opposite (Figure 9b). For the specimen with the dimension of 1 cm × 1 cm × 30 cm, the crack ratio is the largest as it is equal to 4% due to the relatively large cracking area. However, its average width of spacing cracks is 19.87 mm, which is the smallest. Although the volume is the smallest, the number of cracks is the largest, reaching 14. For loess samples with smaller dimensions, spacing cracks are more easily initiated compared with those with larger dimensions. The stresses between two adjacent cracks are continuously released. More cracks are generated, and the width of the pre-existing cracks is not able to increase. When the dimension of the soil sample increases to 2 cm × 2 cm × 30 cm, the number of cracks decreases greatly with decreasing cracking ratio. When the dimension reaches 3 cm × 3 cm × 30 cm, the evolution of the spacing crack is nearly stable. It is concluded that the dimensions of soil samples obviously influence the parameters of spacing cracks in loess. With increasing soil volume, the effect of basal friction on soil shrinkage is gradually weakened [45]. It is found that the crack intensity decreases with increasing sample volume.
3.1.2. Variations of Water Contents
The characteristics of spacing cracks are affected by water content variations. The result of water content variations is shown in Figure 10. Water content is an important factor related to the suction of soils. Their relationship is presented in Soil Water Characteristic Curve (SWCC) of soils [40]. As water content decreases, soil matrix suction increases. Once the suction exceeds the tensile strength of soil, cracks will be generated. The overall water content variation trends of all the specimens are similar. The initial water content of all specimens is 36%. At the beginning of desiccation, the water content decreases rapidly, then it decreases gradually. At the end of desiccation, the water content reaches a stable state, with a residual water content of about 13–15%. However, the evaporation rates are not the same for soil samples with different dimensions. The water content of soil samples with small dimensions easily reaches stability. The distance between the upper and lower interfaces, i.e., thickness of the soil samples, influences greatly the evaporation rates. The migration path of pore water in the subsoil to the top surface is longer in the samples with larger volume. Therefore, the subsoil has a higher water content and a smaller mechanical strength compared with the upper soil. Herein, the time it takes to reach the residual water content of samples with different dimensions is different. Soil samples with larger dimensions need more time to reach stabilization.
3.2. Spacing Cracking Modes in Loess
Generally, there are three cracking modes in soil: opening mode, sliding mode, and tearing mode [21,40]. In this research, the first two cracking modes were observed in spacing cracks of loess.
3.2.1. Spacing Cracks in Opening Mode
The contour map of the longitudinal strain of the loess sample with a dimension of 5 cm × 5 cm × 30 cm was taken as an example. The typical opening mode of spacing cracks are analyzed in Figure 11, where two spacing cracks, 1 and 2, are observed. Maximum and minimum at different times are summarized in Table 4. Crack 1 is well developed, and the evolution of crack 2 is analyzed. At t = 58 h, in the area where crack 2 will generate is larger than that in the other area (Figure 11a). is positive, which indicates that the new crack 2 is likely caused by tensile strains in this area. At t = 58.17 h, maximum increases from 0.548% to 1.225% (Figure 11b). With increasing , crack 2 initiates at t = 58.5 h (Figure 11c). After about 10 min, maximum decreases to 1.87% with the evolution of crack 2 (Figure 11d). Crack 2 penetrates the cross-section of the sample. However, the width of crack 2 continuously increases under the tensile strains until all the energy is released. It is obvious that the direction of crack 2 is perpendicular to the directions of local displacements around crack 2, according to Figure 12. Herein, crack 2 is classified as opening mode.
3.2.2. Spacing Cracks in Mixed Opening-Sliding Mode
The mixed opening-sliding mode of spacing crack is also observed in the soil specimen with the dimension of 3 cm × 3 cm × 30 cm. The contour map of of the specimen is presented in Figure 13. The values of maximum and minimum at different times are indicated in Table 5. At t = 8.67 h, the crack has not yet formed on the surface of the sample (Figure 13a). The maximum in zone A equals 0.51%. After 20 min, crack 3 grows from the bottom of zone A. on both sides of crack 3 decreases because the energy around crack 3 is released with the development of the crack (Figure 13b). However, at the tip of crack 3 is 0.51%, which remains large. It indicates that crack 3 will continue to evolve following the distribution of tensile strains. At t = 9.33 h, crack 3 continues developing towards the northeast, and it has grown to about half the width of the specimen (Figure 13c).
For the purpose of interpreting the cracking modes of crack 3 in zone A, the white vectors presenting the local displacements of soils are decomposed in Figure 14. The directions of local displacements on the left side of crack 3 are not parallel to the evolution direction of the crack, with an angle of about 30°. While on the right side of crack 3, the direction of local displacement is parallel to the direction of crack 3. The local displacement D can be decomposed into two components: DPA, which is parallel to the direction of crack 3, and DPE, which is perpendicular to the direction of crack 3. It is concluded that DPA has a sliding effect on crack 3. Meanwhile, crack 3 is also submitted to tension due to DPE. Therefore, crack 3 is in mixed opening-sliding mode.
3.3. Spacing Crack Laws in Loess
With these five series of desiccation tests in loess, two laws can be concluded from the spacing cracks characteristics.
3.3.1. The Appearance Order of Spacing Cracks
The first law is that a new spacing crack is prone to appear between two pre-existing spacing cracks. If the distance between two adjunct spacing cracks is larger, the possibility of a new crack generating between them is higher [46]. The sample with the dimension of 4 cm × 4 cm × 30 cm is taken as an example (Figure 15). The maximum and minimum at different times are shown in Table 6. At the beginning of desiccation, there is no crack (Figure 15a). When t = 13.33 h, crack 4 on the right bottom side of the soil sample can be observed with a maximum of 0.8%. The maximum concentrates at the tip of crack 4, indicating that crack 4 will continue to evolute upwards (Figure 15b). With increasing , crack 5 gradually appears on the left side of the soil sample, which is approximately parallel to crack 4 (Figure 15c). At t = 21 h, these two spacing cracks are well developed along the north direction. Meanwhile, in the zone between these two cracks are relatively large and will continue to increase afterwards. When maximum reaches 0.38%, crack 6 forms at the bottom of the soil sample (Figure 15d). After about 4.67 h, crack 6 evolves and finally inserts between the two pre-existing spacing cracks 4 and 5 (Figure 15e).
3.3.2. The Saturation of Spacing Cracks
During desiccation, when the number of cracks reaches a certain value, the energy in the soil is released so that no more cracks are generated. The number and the characteristics of pre-existing cracks reach a stable state, which can be identified as “the saturation of cracks”. Since the number of spacing cracks is limited and the spacing cracks are generally parallel in this study, the “saturation of cracks” is more obvious. As we all know, energy is related to the stress state in soils. In this study, the local suction distributions on the surface of soil samples are calculated with the VG model for the purpose of interpreting the saturation of spacing cracks.
- Estimation of local water content
The distribution of water content in the soil affects the distribution of suction, which results in the formation of cracks [47,48]. The distribution of water content in the specimen is calculated using the following Equation (2):
where is the local water content; is the local void ratio correspondent to ; is the saturation degree of soil.
In order to obtain , the void ratio is obtained with the following Equation (2). The relationship between void ratio and volumetric strains is as follows:
where is the volumetric strains of soil; is the initial void ratio, which can be deduced from the SWCC curve of loess [40].
Therefore, the local void ratio on the surface of soil sample can be calculated by the following Equation (4):
where is the local volumetric strains of soil, which can be calculated with VIC results [49].
Combining Equations (2) and (4), the local water content on the surface of soil sample can be deduced with the volumetric strains obtained with the DIC method. Herein, the suctions can be obtained.
- 2.
- Estimation of the local suction
With VG model, the local suctions of soil can be deduced:
where is the volumetric water content; is the saturated volumetric water content; is the residual volumetric water content; s is the suction; m, n, and are the coefficients related to the types of soils. and can be determined from Figure 11, which shows the results of water content variations.
The value of is necessary for the calculation of s. In order to obtain , the following Equation is adopted:
where w is the mass water content; is the specific gravity of loess, equals 2.69 [40]; e is the void ratio.
- 3.
- Interpretation of saturation of spacing cracks
The sample with a dimension of 4 cm × 4 cm × 30 cm is taken as an example to interpret the saturation of spacing cracks. The distribution of the local suctions of loess samples is obtained based on the estimations of local water content (Figure 16). Once the suction exceeds the tensile strength of the soil, cracks will appear. At t = 12 h, crack 4 is formed. At the tip of crack 4, the suction is relatively large, which indicates that crack 4 will evolve continuously (Figure 16a). At t = 14.67 h, crack 4 develops upwards, and crack 5 appears (Figure 16b). Similar to the distributions of local strains, the suctions around crack 5 are relatively larger than the neighboring areas. About 20 min later, the suctions in the middle of cracks 4 and 5 increase, which are presented in red color (Figure 16c). It can be predicted that a new crack may generate in this area. Crack 6 appears when t = 21 h, which verifies that cracks are prone to initiate in the domains with large suctions (Figure 16d). It can be concluded that the initiation of cracks is related to the increase in energy, while the stability of cracks is related to energy release. Therefore, when the energy between two cracks is not enough to support the development of a new crack, the cracks will be in a stable state, and the number of cracks will no longer increase. In Figure 15e, the maximum between cracks 4 and 6 and cracks 5 and 6 are just 0.06%. No more cracks will appear due to the release of energy. The number of cracks in the samples with a dimension of 3 cm × 3 cm × 30 cm stabilized at three and will not increase during the afterwards desiccation process.
4. Numerical Simulation Results
In order to verify the effect of size on the characteristics of spacing cracks and to better illustrate the spacing cracking mechanism, the numerical simulations of specimens with different dimensions are carried out based on the MatDEM software. In order to compare with the experimental results, the initial water content of the model is set as 36%, which is the same as that in the experiments. The simulation results of spacing cracks from the side view with the dimension of 2 cm × 2 cm × 30 cm are presented in Figure 17. The desiccation process with different water contents is simulated. At w = 28%, the sample begins to shrink, and no crack are formed (Figure 17a). When w decreases to 18%, the connections between the soil particles are broken. Two cracks, a and b, appear in the soil (Figure 17b). Crack c also initiates in the middle of the soil sample. With the decrease in water content, the pre-existing cracks a, b and the developing crack c continue to evolve upwards. When w = 13%, the fourth crack e, on the right side, gradually develops. Finally, five cracks are formed in soil samples with a dimension of 2 cm × 2 cm × 30 cm, which can be seen obviously in the micro-connection results (Figure 17b). Although the positions of these five cracks are not exactly consistent with those of the experiments, the number of cracks is consistent (Figure 17c). In addition, the appearance order of spacing cracks is identified in the numerical modeling example. Crack c appears between cracks a and b, verifying the “insertion phenomenon” of spacing cracks.
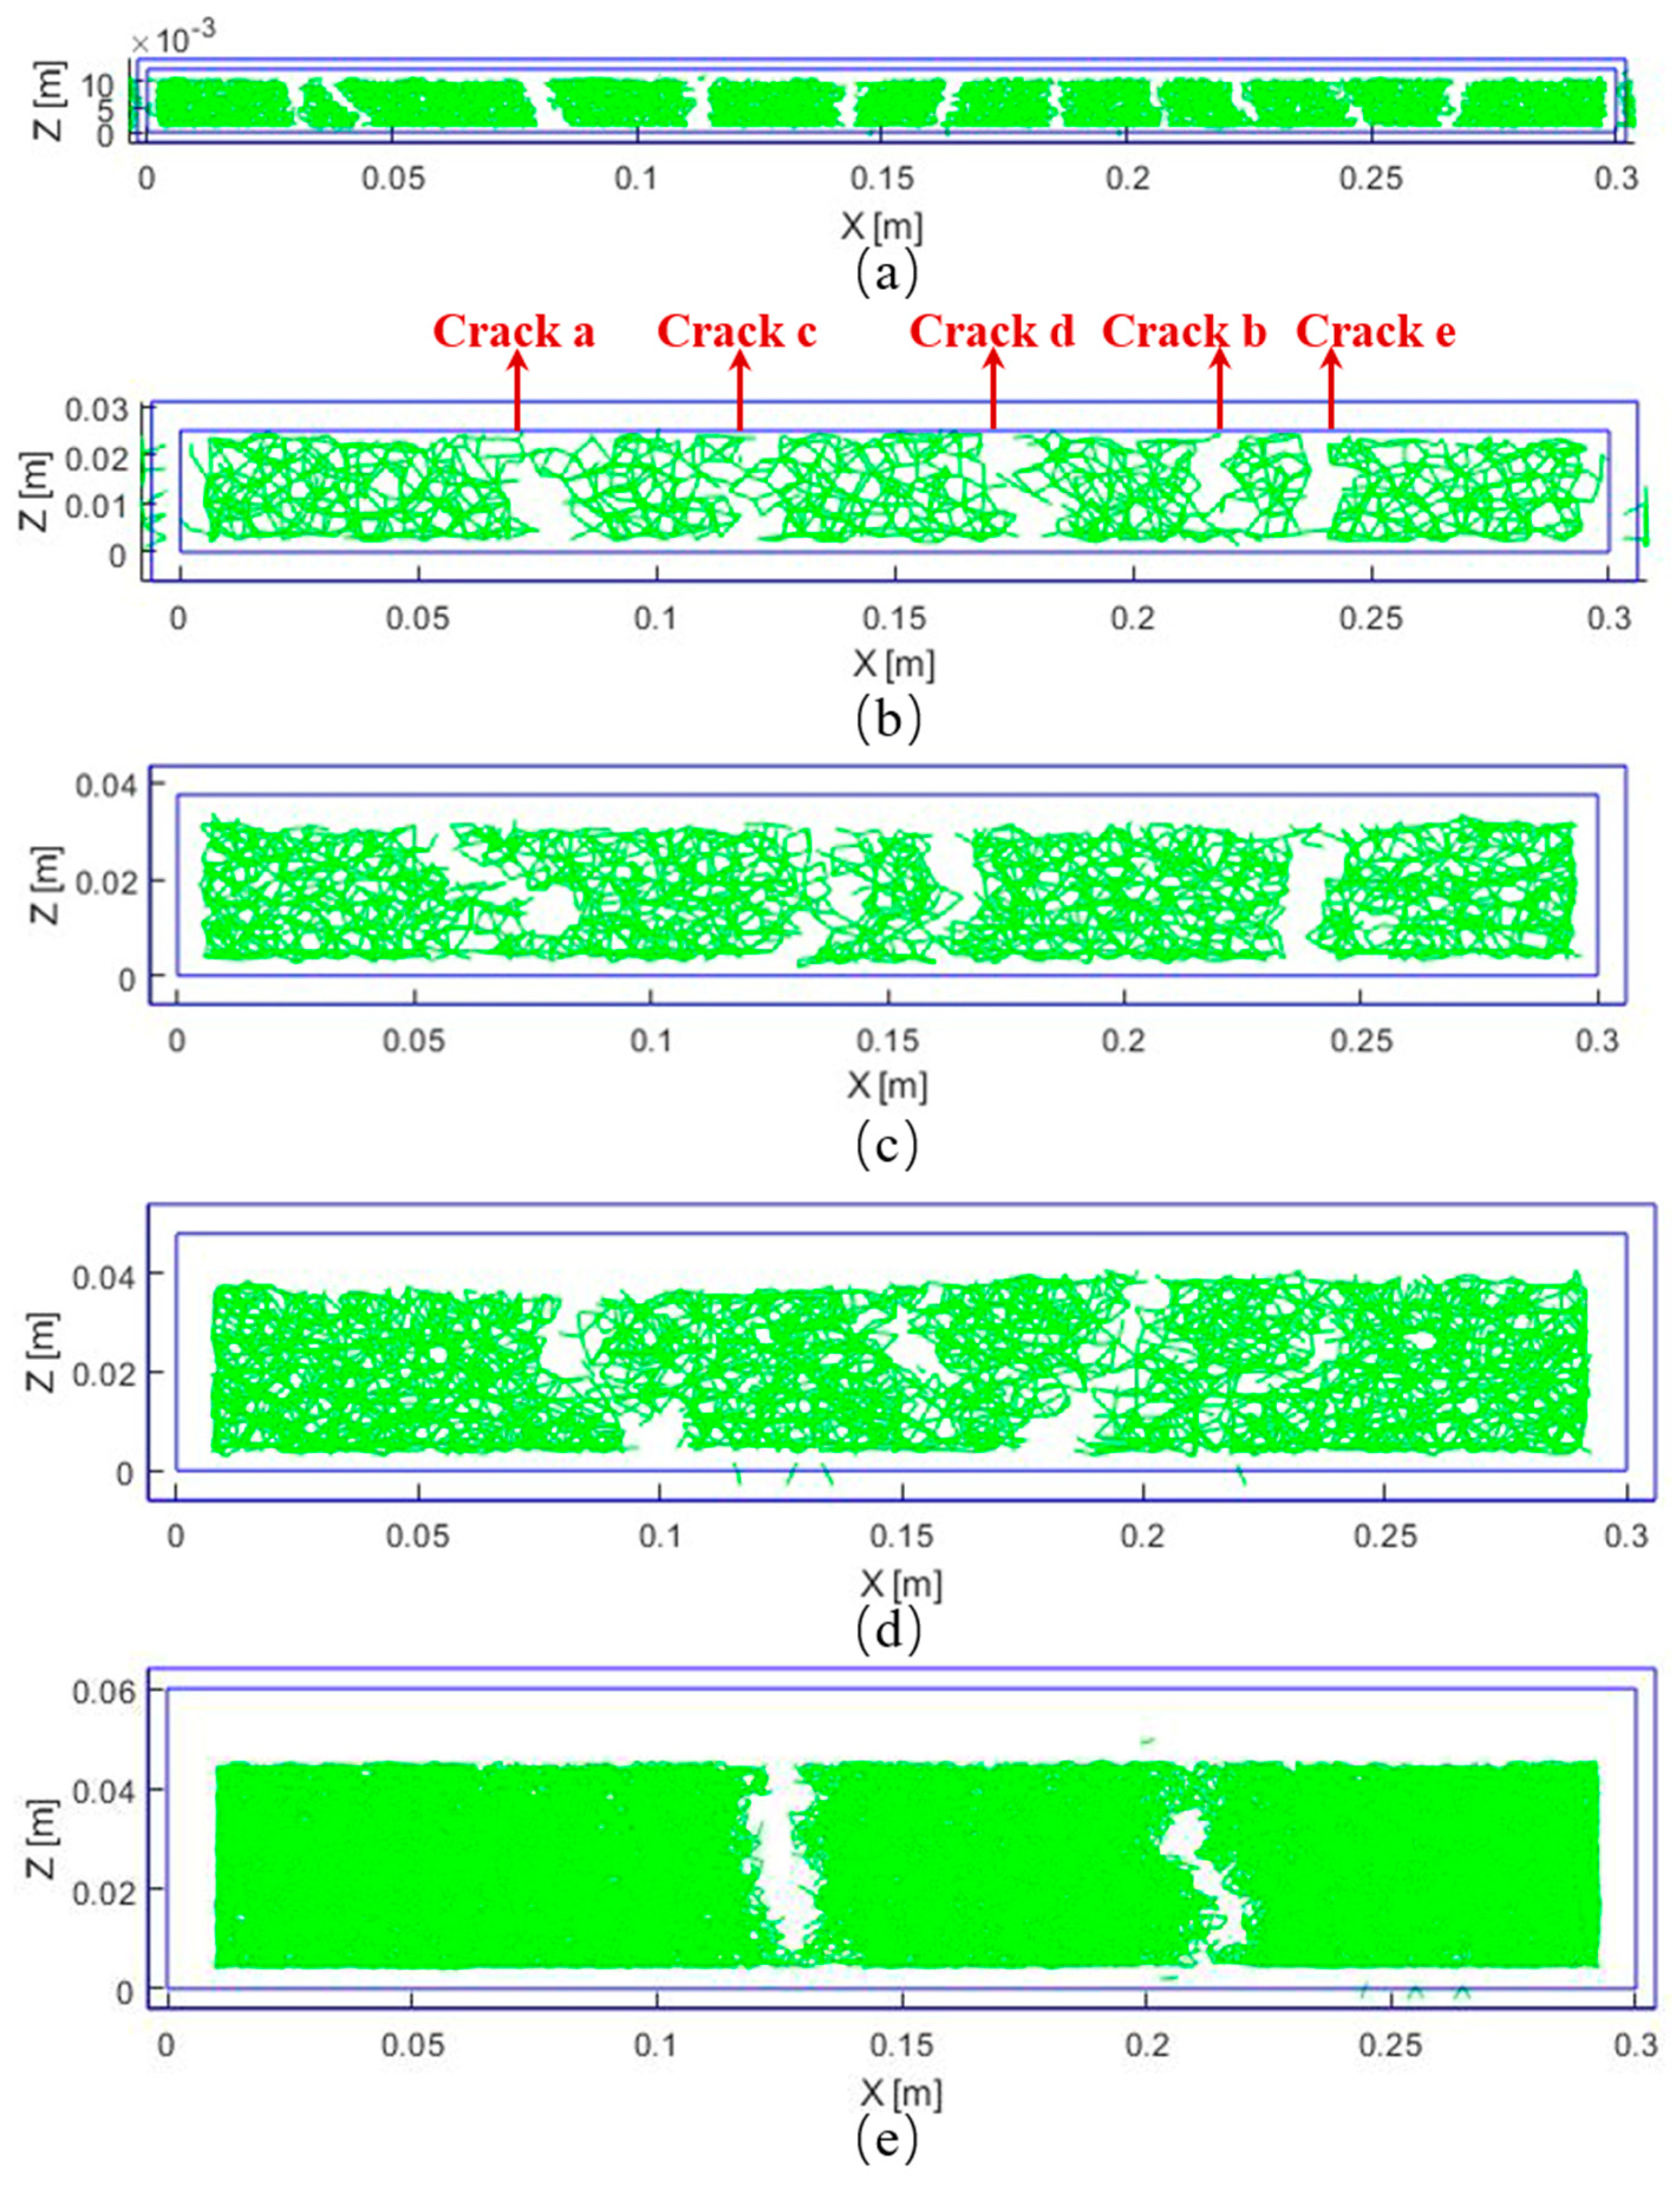
The micro-connection diagrams of soil samples with different dimensions at the end of desiccation are presented in Figure 18, which presents the bonding forces between the particles. The green lines represent the bonding between soil particles, while the voids among them identify the bonding failures of soils. The number and positions of cracks in the specimen can be better observed in the micro-connection diagram. The number of cracks in different soil samples are 11, 5, 4, 3, and 2, respectively. The number of spacing cracks observed in the experiments and numerical simulations are presented in Table 7, respectively. The simulation crack number is nearly consistent with that observed in the experiments. Since the contact model in MatDEM is linearly elastic, the simulation crack patterns are not exactly the same as those generated in the experiments. Generally, the simulation results indeed reflect the size effect on the characteristics of spacing cracks. The crack number is smaller in soil samples with larger dimensions. Two important laws of the “insertion of cracks” and the “saturation of cracks” in loess are also observed in the simulation results.
5. Discussion
Previous research on spacing cracks mainly focused on in situ observations. The characteristics of spacing cracks were analyzed. The initiation of spacing cracks was predicted. However, the entire cracking process and mechanism are less researched. This study performs the formation, propagation, penetration, and stabilization of spacing cracks. Unlike the other geo-materials, the physical and mechanical properties of soils also greatly impact the characteristics of spacing cracks.
In the beginning of desiccation, few spacing cracks are initiated without mutual interferences. Therefore, the spacing cracks are randomly or uniformly distributed. It is well known that each crack has its own evolution domain. With the evolution of spacing cracks, the main objective is to hinder the adjacent cracks into their own evolution domain. Therefore, the development of spacing cracks in the soil is constrained. The energy around the cracks is released, leading to the “saturation of spacing cracks”. The uniformity of spacing crack distribution gradually improves.
The cracking parameters and patterns are influenced by the factors such as physical properties or stress states. The stress field is redistributed, and the stress is concentrated at the tip of the crack [32,34]. The stress intensity gradually decreases in the vicinities of cracks. However, it gradually recovers away from the pre-existing cracks. The influence of macrocracks is greater than microcracks. The lateral stress of small cracks can recover quickly, resulting in a new crack. On the other hand, a macrocrack must accumulate sufficient stress over a long distance to induce a new crack. When a crack is formed, the stress intensity near it decreases. Slightly further away from the same crack, the strength recovers, resulting in another new crack. The stress intensity near the new crack reduces again. In this way, the stress intensity in soils presents a strong-weak-strong-weak waveform, forming a series of spacing cracks.
Due to the constant cracking strength of soils, the spacing of cracks with the same scale should theoretically be a constant value. Therefore, the spacing cracks initiate in groups and keep an equal distance from each other. It is believed that as long as the cracking strength conditions are met, the spacing cracks will form. The predictions of spacing cracks based on the principle of equal distance can be assured.
6. Conclusions
This paper mainly explores the spacing crack characteristics and cracking mechanism of Jingyang loess, considering the effect of size. Free drying tests of five samples with different sizes were carried out in order to record the evolution of spacing cracks. VIC-2D software is used to calculate the local displacements and strains of soil samples. The conclusions are as follows:
- (1)
- The characteristics of spacing cracks are greatly influenced by the dimensions of soil samples. As the volume of the specimen increases, the number of spacing cracks tends to decrease. Meanwhile, the average spacing between cracks also increases. The average crack width also increases with the increase in the average spacing of cracks. Once the volume of the specimen reaches 270 cm3 (3 cm × 3 cm × 30 cm), the number of spacing cracks does not increase anymore. The variations in crack ratio and the number of spacing cracks show the same tendency.
- (2)
- Different spacing cracking modes and laws in loess are interpreted in this research. Based on the digital image correlation (DIC) method, opening mode and mixed opening-sliding mode in spacing cracks are detected. In addition, two spacing cracking laws are interpreted. The first law is that a new crack is prone to appear between two pre-existing cracks. If the distance between two adjunct cracks is larger, the possibility of the generation of a new crack between them is larger. The second law is that when the number of cracks reaches a certain value, the energy in the soil is released so that no more cracks will be generated during the following desiccation. The number and the characteristics of existing cracks reach a stable state, which can be considered, as the “saturation of cracks”.
- (3)
- The numerical simulations were carried out on loess samples with different dimensions based on the discrete element method. The size effect on the characteristics of spacing cracks is verified, and the spacing cracking mechanism is better illustrated. In discrete element models, the number of spacing cracks increases with the increasing soil volume, which is consistent with the experimental results. In addition, the laws of the “insertion of cracks” and the “saturation of cracks” in loess are also observed in the simulation results.
- (4)
- The spacing cracks are concerned in the domains of geological, earth, materials, and engineering science. It is a mechanical phenomenon and scientific problem with multiple disciplines. The initiation, evolution, interaction, and stabilization of spacing cracks will decrease the strength of soil, damage the stability of the slope, and trigger geological disasters. Therefore, the study of the characteristics and mechanisms of spacing cracks is of great significance both in theory and engineering applications. However, there are some improvements that could be accomplished in this research. For example, the model used in the numerical simulation is linear elastic, which could be improved for a more precise simulation. In addition, the cracking mechanism under drying-wetting cycles could be investigated in the future.
Author Contributions
Conceptualization, X.W.; methodology, X.W.; software, Y.Z.; validation, Y.Z. and X.C.; investigation, Y.Z. and X.C.; resources, X.W.; data curation, Y.Z.; writing—original draft preparation, Y.Z.; writing—review and editing, X.W. and Y.Z.; supervision, X.W.; project administration, X.W.; funding acquisition, X.W. All authors have read and agreed to the published version of the manuscript.
Funding
This research was funded by the National Natural Science Foundation of Youth, grant number 42007278 and the Fundamental Research Funds for the Central Universities, grant number xhj032021017-02.
Institutional Review Board Statement
Not applicable.
Informed Consent Statement
Not applicable.
Data Availability Statement
The data that support the findings of this study are available within the article.
Acknowledgments
Ling. X. of the School of Human Settlements and Civil Engineering, Xi’an Jiaotong University provided the experimental devices and aided with the field investigation. The authors would like to extend their deepest gratitude to him.
Conflicts of Interest
The authors declare no conflict of interest.
References
- Liu, T.S.; Ding, Z.L.; Guo, Z.T. Loess, Environment and Global Change; Science Press: Beijing, China, 1991. [Google Scholar]
- Zhang, J.M.; Luo, Y.; Zhou, Z.; Victor, C.; Duan, M.D. Research on the rainfall-induced regional slope failures along the Yangtze River of Anhui, China. Landslides 2021, 18, 1801–1821. [Google Scholar] [CrossRef]
- Derbyshire, E. Geological hazards in loess terrain, with particular reference to the loess regions of China. Earth-Sci. Rev. 2011, 54, 231–260. [Google Scholar] [CrossRef]
- Wang, X.; Jiao, F.; Li, X.; An, S. The Loess Plateau. In Multifunctional Land-Use Systems for Managing the Nexus of Environmental Resources; Zhang, L., Schwarzel, K., Eds.; Springer: Cham, Switzerland, 2017. [Google Scholar] [CrossRef]
- Tsunekawa, A.; Liu, G.; Yamanaka, N.; Du, S. Ecological Research Monographs. In Restoration and Development of the Degraded Loess Plateau, China; Climate of the Loess Plateau, Chapter 2; Springer: Tokyo, Japan, 2014; pp. 23–33. [Google Scholar] [CrossRef]
- Xu, J.; Wu, Z.P.; Chen, H.; Shao, L.T.; Zhou, X.G.; Wang, S.H. Influence of dry-wet cycles on the strength behavior of basalt-fiber reinforced loess. Eng. Geol. 2022, 302, 106645. [Google Scholar] [CrossRef]
- Ma, P.; Peng, J.B.; Wang, Q.; Duan, Z.; Zhuang, J.Q. Loess landslides on the south Jingyang platform in Shaanxi Province, China. Q. J. Eng. Geol. Hydrogeol. 2019, 52, 547–556. [Google Scholar] [CrossRef]
- Zheng, X.X.; Xu, J.L.; Wang, H.X.; Liu, X.J.; Yao, D.F.; Lv, J. Health risk assessment of a reservoir-type water source in the northeastern region of China. Hum. Ecol. Risk Assess. 2017, 23, 751–766. [Google Scholar] [CrossRef]
- Nahlawi, H.; Kodikara, J.K. Laboratory experiments on desiccation cracking of thin soil layers. Geotech. Geol. Eng. 2006, 24, 1641–1664. [Google Scholar] [CrossRef]
- Trabelsi, H.; Hadrich, B.; Guiras, H. Evaporation, shrinkage and intrinsic permeability of unsaturated clayey soil: Analytical modelling versus experimental data. Arab. J. Geosci. 2018, 11, 184. [Google Scholar] [CrossRef]
- Vahedifard, F.; Robinson, J.D.; AghaKouchak, A. Can protracted drought undermine the structural integrity of California’s earthen levees? J. Geotech. Geoenviron. Eng. 2016, 142, 02516001. [Google Scholar] [CrossRef]
- Zuo, L.; Xu, L.; Baudet, B.A.; Gao, C.Y.; Huang, C. The structure degradation of a silty loess induced by long-term water seepage. Eng. Geol. 2020, 272, 105634. [Google Scholar] [CrossRef]
- Jiang, N.J.; Tang, C.S.; Yin, L.Y.; Xie, Y.H.; Shi, B. Applicability of Microbial Calcification Method for Sandy-Slope Surface Erosion Control. J. Mater. Civil Eng. 2019, 31, 04019250. [Google Scholar] [CrossRef]
- Zeng, H.; Tang, C.S.; Cheng, Z.; Vahedifard, F.; Cheng, Q.; Shi, B. Desiccation cracking of soil subjected to different environmental relative humidity conditions. Eng. Geol. 2022, 297, 106536. [Google Scholar] [CrossRef]
- Lu, Y.; Xu, J.L.; Wang, H.X.; Liu, X.J.; Li, W. Distribution, sources and health risk assessment of contaminations in water of urban park: A case study in Northeast China. Environ. Geochem. Health 2019, 41, 2473–2489. [Google Scholar] [CrossRef]
- Wang, Y.; Xia, A.; Qin, G. Probabilistic modeling for reliability analysis of buried pipelines subjected to spatiotemporal earthquakes. Probabilist. Eng. Mech. 2022, 69, 103315. [Google Scholar] [CrossRef]
- Corte, A.; Higashi, A. Experimental Research on Desiccation Cracks in Soil; Research Report U.S. Army Snow Ice & Permafrost Research Establishment: Wilmette, IL, USA, 1960. [Google Scholar]
- Morris, P.H.; Graham, J.; Williams, D.J. Cracking in drying soils. Can. Geotech. J. 1992, 29, 263–277. [Google Scholar] [CrossRef]
- Péron, H.; Hueckel, T.; Laloui, L.; Hu, L. Fundamentals of desiccation cracking of fine-grained soils: Experimental characterisation and mechanisms identification. Can. Geotech. J. 2009, 46, 1177–1201. [Google Scholar] [CrossRef]
- Tang, C.S.; Cui, Y.J.; Shi, B.; Tang, A.M.; Liu, C. Desiccation and cracking behaviour of clay layer from slurry state under wetting–drying cycles. Geoderma 2011, 166, 111–118. [Google Scholar] [CrossRef]
- Wei, X.; Hattab, M.; Taibi, S.; Bicalho, K.V.; Xu, L.; Fleureau, J.M. Crack development and coalescence process in drying clayey loess. Geomech. Eng. 2021, 25, 535–552. [Google Scholar] [CrossRef]
- Tang, C.S.; Shi, B.; Liu, C.; Zhao, L.; Wang, B. Influencing factors of geometrical structure of surface shrinkage cracks in clayey soils. Eng. Geol. 2008, 101, 204–217. [Google Scholar] [CrossRef]
- Costa, S.; Kodikara, J.; Shannon, B. Salient factors controlling desiccation cracking of clay in laboratory experiments. Géotechnique 2013, 63, 18–29. [Google Scholar] [CrossRef]
- Tang, C.S.; Cui, Y.J.; Tang, A.M.; Shi, B. Experiment evidence on the temperature dependence of desiccation cracking behavior of clayey soils. Eng. Geol. 2010, 114, 261–266. [Google Scholar] [CrossRef]
- Lakshmikantha, M.R.; Prat, P.C.; Ledesma, A. Experimental evidence of size effect in soil cracking. Can. Geotech. J. 2012, 49, 264–284. [Google Scholar] [CrossRef]
- Lakshmikantha, M.R.; Prat, P.C.; Ledesma, A. Boundary effects in the desiccation of soil layers with controlled environmental conditions. Geotech. Test. J. 2018, 41, 675–697. [Google Scholar] [CrossRef]
- Salimi, K.; Cerato, A.; Vahedifard, F.; Miller, G.A. Tensile Strength of Compacted Clays during Desiccation under Elevated Temperatures. Geotech. Test. J. 2021, 44, 1119–1134. [Google Scholar] [CrossRef]
- Salimi, K.; Cerato, A.; Vahedifard, F.; Miller, G.A. A temperature-dependent model for tensile strength characteristic curve of unsaturated soils. Geomech. Energy Environ. 2021, 28, 100244. [Google Scholar] [CrossRef]
- Kindle, E.M. Some factors affecting the development of Mud-Cracks. J. Geol. 1917, 25, 135–144. [Google Scholar] [CrossRef]
- Li, J.H.; Li, L.; Chen, R.; Li, D.Q. Cracking and vertical preferential flow through landfill clay liners. Eng. Geol. 2016, 206, 33–41. [Google Scholar] [CrossRef]
- Wu, H.Q.; Pollard, D.D. An experimental study of the relationship between joint spacing and layer thickness. J. Struct. Geol. 1995, 17, 887–905. [Google Scholar] [CrossRef]
- Tang, C.A.; Zhang, Y.B.; Liang, Z.Z.; Xu, T.; Tham, L.G.; Lindqvist, P.A.; Kou, S.Q.; Liu, H.Y. Fracture spacing in layered materials and pattern transition from parallel to polygonal fractures. Phys. Rev. E. Stat. Nonlin. Soft Matter. Phys. 2006, 73, 056120. [Google Scholar] [CrossRef]
- Xu, J.M. A study on formation conditions and mechanism of equal spacing fractures. Adv. Geosci. 1989, 1, 58–70. [Google Scholar]
- Bai, T.; Pollard, D.D. Fracture spacing in layered rocks: A new explanation based on the stress transition. J. Struct. Geol. 2000, 22, 43–57. [Google Scholar] [CrossRef]
- Karihaloo, B.L.; Abdalla, H.M.; Imjai, T. A simple method for determining the true specific fracture energy of concrete. Mag. Concrete Res. 2003, 55, 471–481. [Google Scholar] [CrossRef]
- Aveston, J.; Cooper, G.A.; Kelly, A. The Properties of Fiber Composites. In Proceedings of the National Physical Laboratory Conference, London, UK, 14–16 July 1971; IPC Science and Technology Press: Guildford, England, 1971; pp. 1254–1262. [Google Scholar]
- Karihaloo, B.L.; Nallathambi, P. Effective crack model for the determination of fracture toughness (KICe) of concrete. Eng. Fract. Mech. 1990, 35, 637–645. [Google Scholar] [CrossRef]
- Bažant, Z.P.; Xiang, Y. Crack growth and lifetime of concrete under long time loading. J. Eng. Mech. 1997, 123, 350–358. [Google Scholar] [CrossRef]
- ASTM Standard D2487; Standard Practice for Classification of Soils for Engineering Purposes (Unified Soil Classification System). American Society for Testing and Materials: West Conshohocken, PA, USA, 2021.
- Trabelsi, H.; Jamei, M.; Zenzri, H.; Olivella, S. Crack patterns in clayey soils: Experiments and Modeling. Int. J. Numer. Anal. Methods Geomech. 2012, 36, 1410–1433. [Google Scholar] [CrossRef]
- Imjai, T.; Kefyalew, F.; Aosai, P.; Garcia, R.; Kim, B.; Abdalla, H.M.; Raman, S.N. A new equation to predict the shear strength of recycled aggregate concrete Z push-off specimens. Cement Concrete Res. 2023, 169, 107181. [Google Scholar] [CrossRef]
- Lorenzino, P.; Beretta, G.; Navarro, A. Application of Digital Image Correlation (DIC) in resonance machines for measuring fatigue crack growth. Frat. Ed Integrità Strutt. 2014, 8, 369–374. [Google Scholar] [CrossRef]
- Le, T.C.; Liu, C.; Tang, C.S.; Zhang, X.Y.; Shi, B. Numerical Simulation of Desiccation Cracking in Clayey Soil Using a Multifield Coupling Discrete-Element Model. Geotech. Geol. Eng. 2022, 148, 04021183. [Google Scholar] [CrossRef]
- Zhang, G.H.; Yu, Q.C.; Wei, G.Q.; Chen, B.; Yang, L.S.; Hu, C.Y.; Li, J.P.; Chen, H.H. Study on the basic properties of the soda-saline soils in Songnen plain. Hydrogeol. Eng. Geol. 2007, 2, 37–40. [Google Scholar]
- Fang, H.Q.; Ding, X.M.; Jiang, C.Y.; Peng, Y.; Wang, C.Y. Effects of layer thickness and temperature on desiccation cracking characteristics of coral clay. B. Eng. Geol. Environ. 2022, 81, 391. [Google Scholar] [CrossRef]
- Bao, C.Y.; Tang, C.A.; Tang, S.B.; Cai, M.; Yu, Q. Study on the formation mode and mechanism of cracks on the surface of layered rock under uniaxial tension. Chin. J. Rock Mech. Eng. 2013, 32, 474–482. (In Chinese) [Google Scholar]
- Mu, Q.Y.; Dong, H.; Liao, H.J.; Zhou, C.; Li, S.B.; Zhang, J.W. Effects of in-situ wetting-drying cycles on the mechanical behaviour of an intact loess. Can. Geotech. J. 2022, 59, 1281–1284. [Google Scholar] [CrossRef]
- Yang, Z.T. Etude Expérimentale de la Fissuration Hydrique d’un sol Argileux; Univeristy of Lorraine: Nancy, France, 2022. (In French) [Google Scholar]
- Wei, X.; Hattab, M.; Bompard, P. Highlighting some mechanisms of crack formation and propagation in clays on drying path. Géotechnique 2016, 66, 287–300. [Google Scholar] [CrossRef]
Figure 1.
Sample site of Jingyang, Shaanxi Province, China.

Figure 2.
Particle size distribution of Jingyang loess, China.
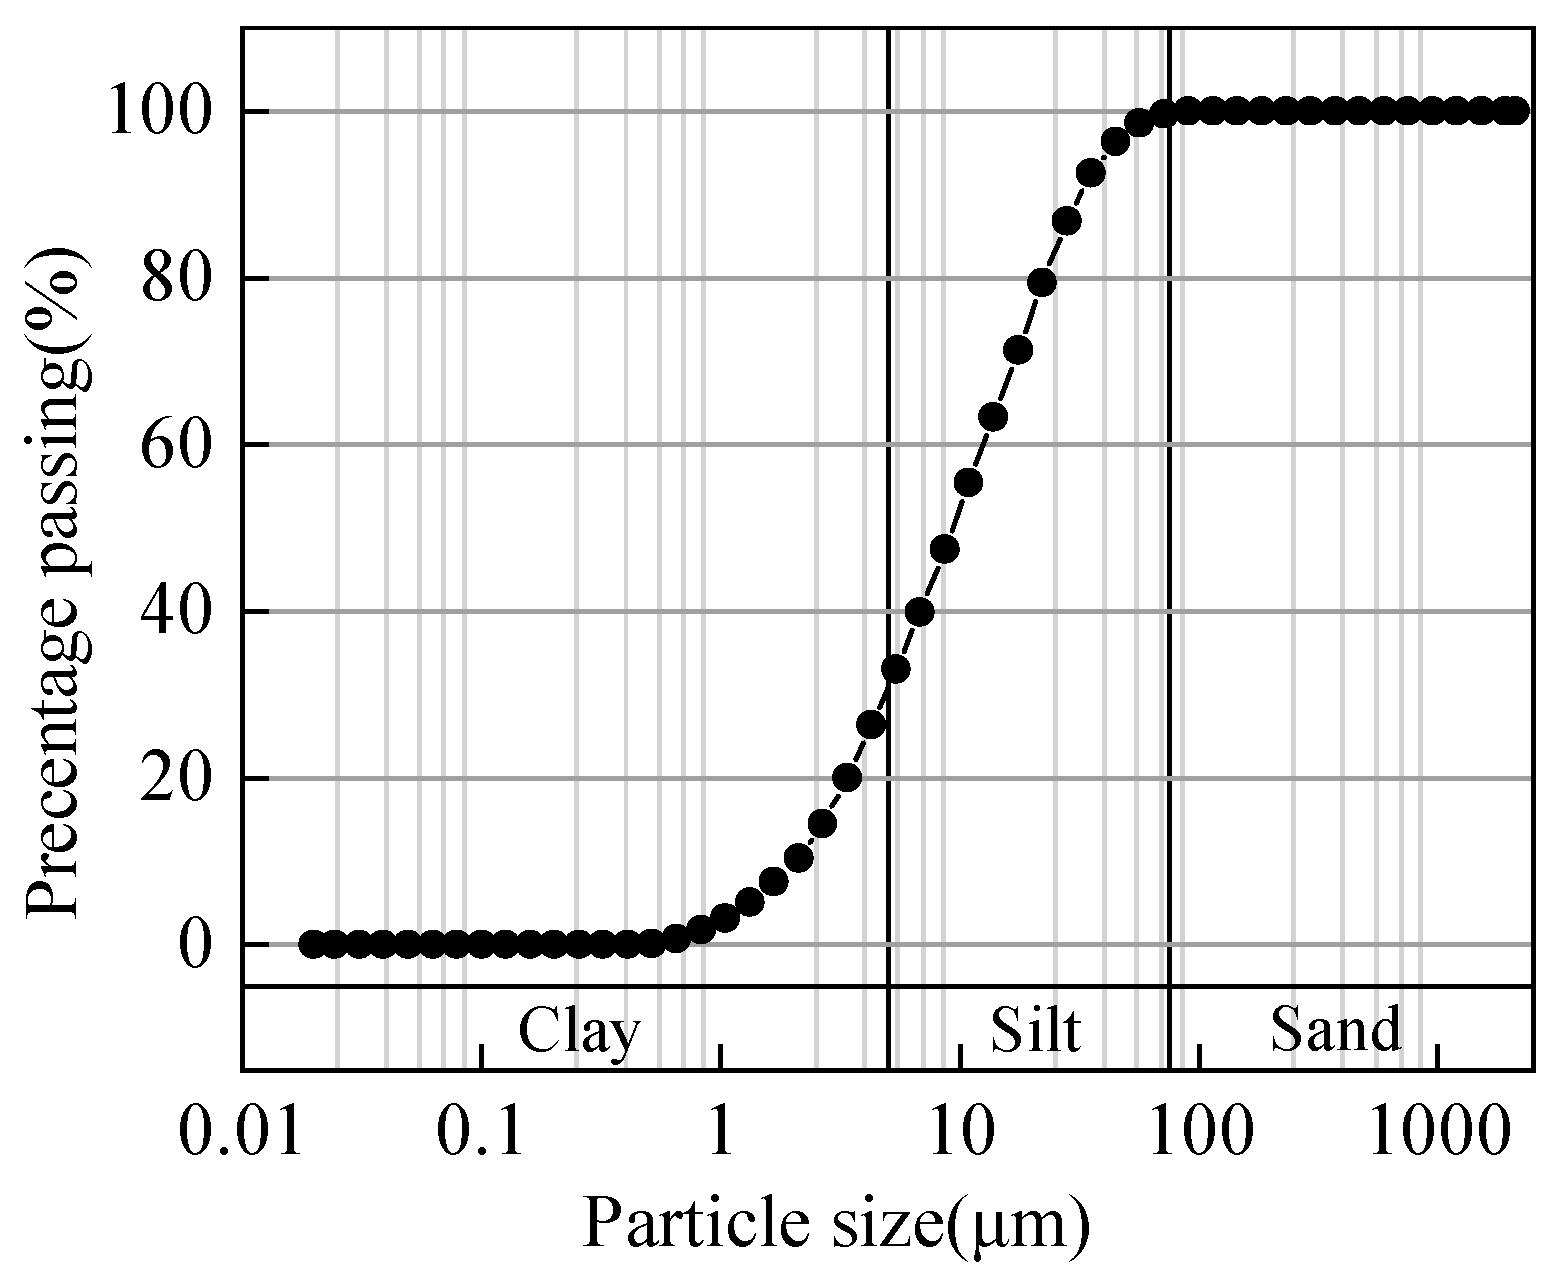
Figure 3.
Presentation of the experimental mold: (a) Schematic diagram of the mold (a presents horizontal support; b and c present detachable boundaries; d presents lower horizontal support; e and f present fixed vertical plates); (b) Loess samples in the mold at the end of desiccation (with dimension of 5 cm × 5 cm × 30 cm).

Figure 4.
Schematic drawing of the experimental setup.
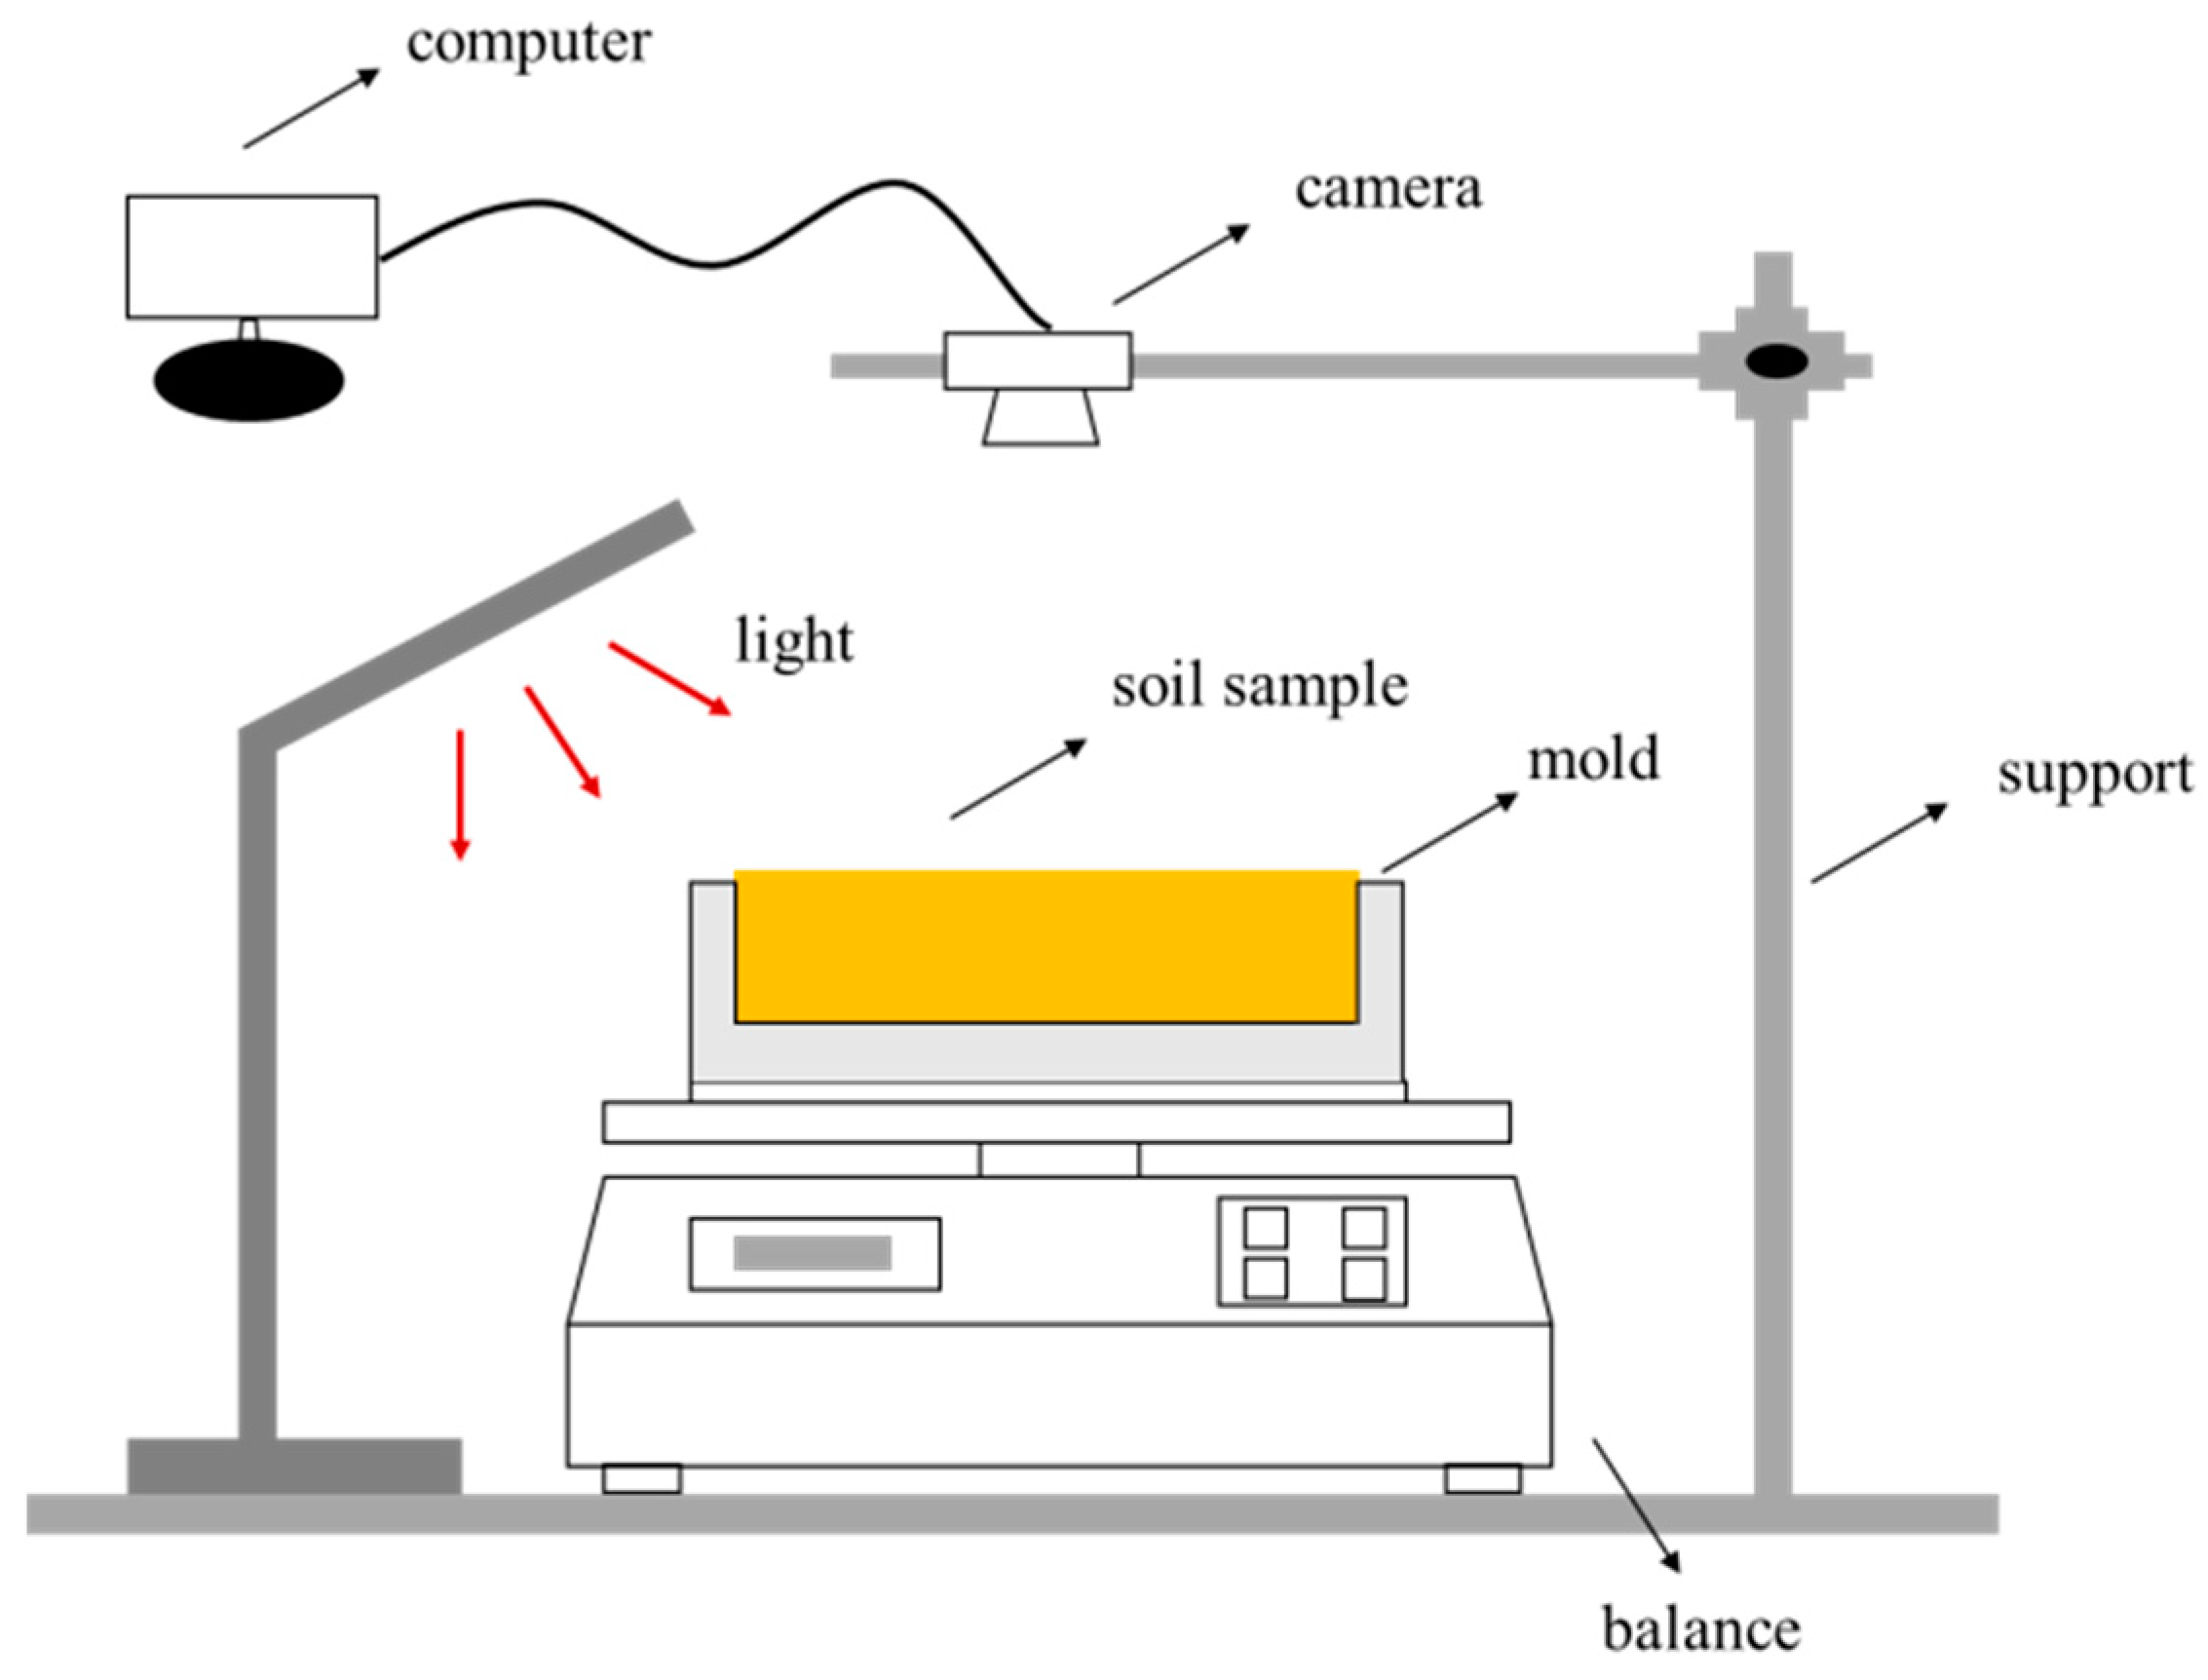
Figure 5.
Implementation of DIC analysis (pixel 100 = grey; pixel 0 = black; yellow dashed cube presents the subset size for the analysis; red presents the center of the subset; yellow arrow presents the deformation of the same subset).
Figure 5.
Implementation of DIC analysis (pixel 100 = grey; pixel 0 = black; yellow dashed cube presents the subset size for the analysis; red presents the center of the subset; yellow arrow presents the deformation of the same subset).
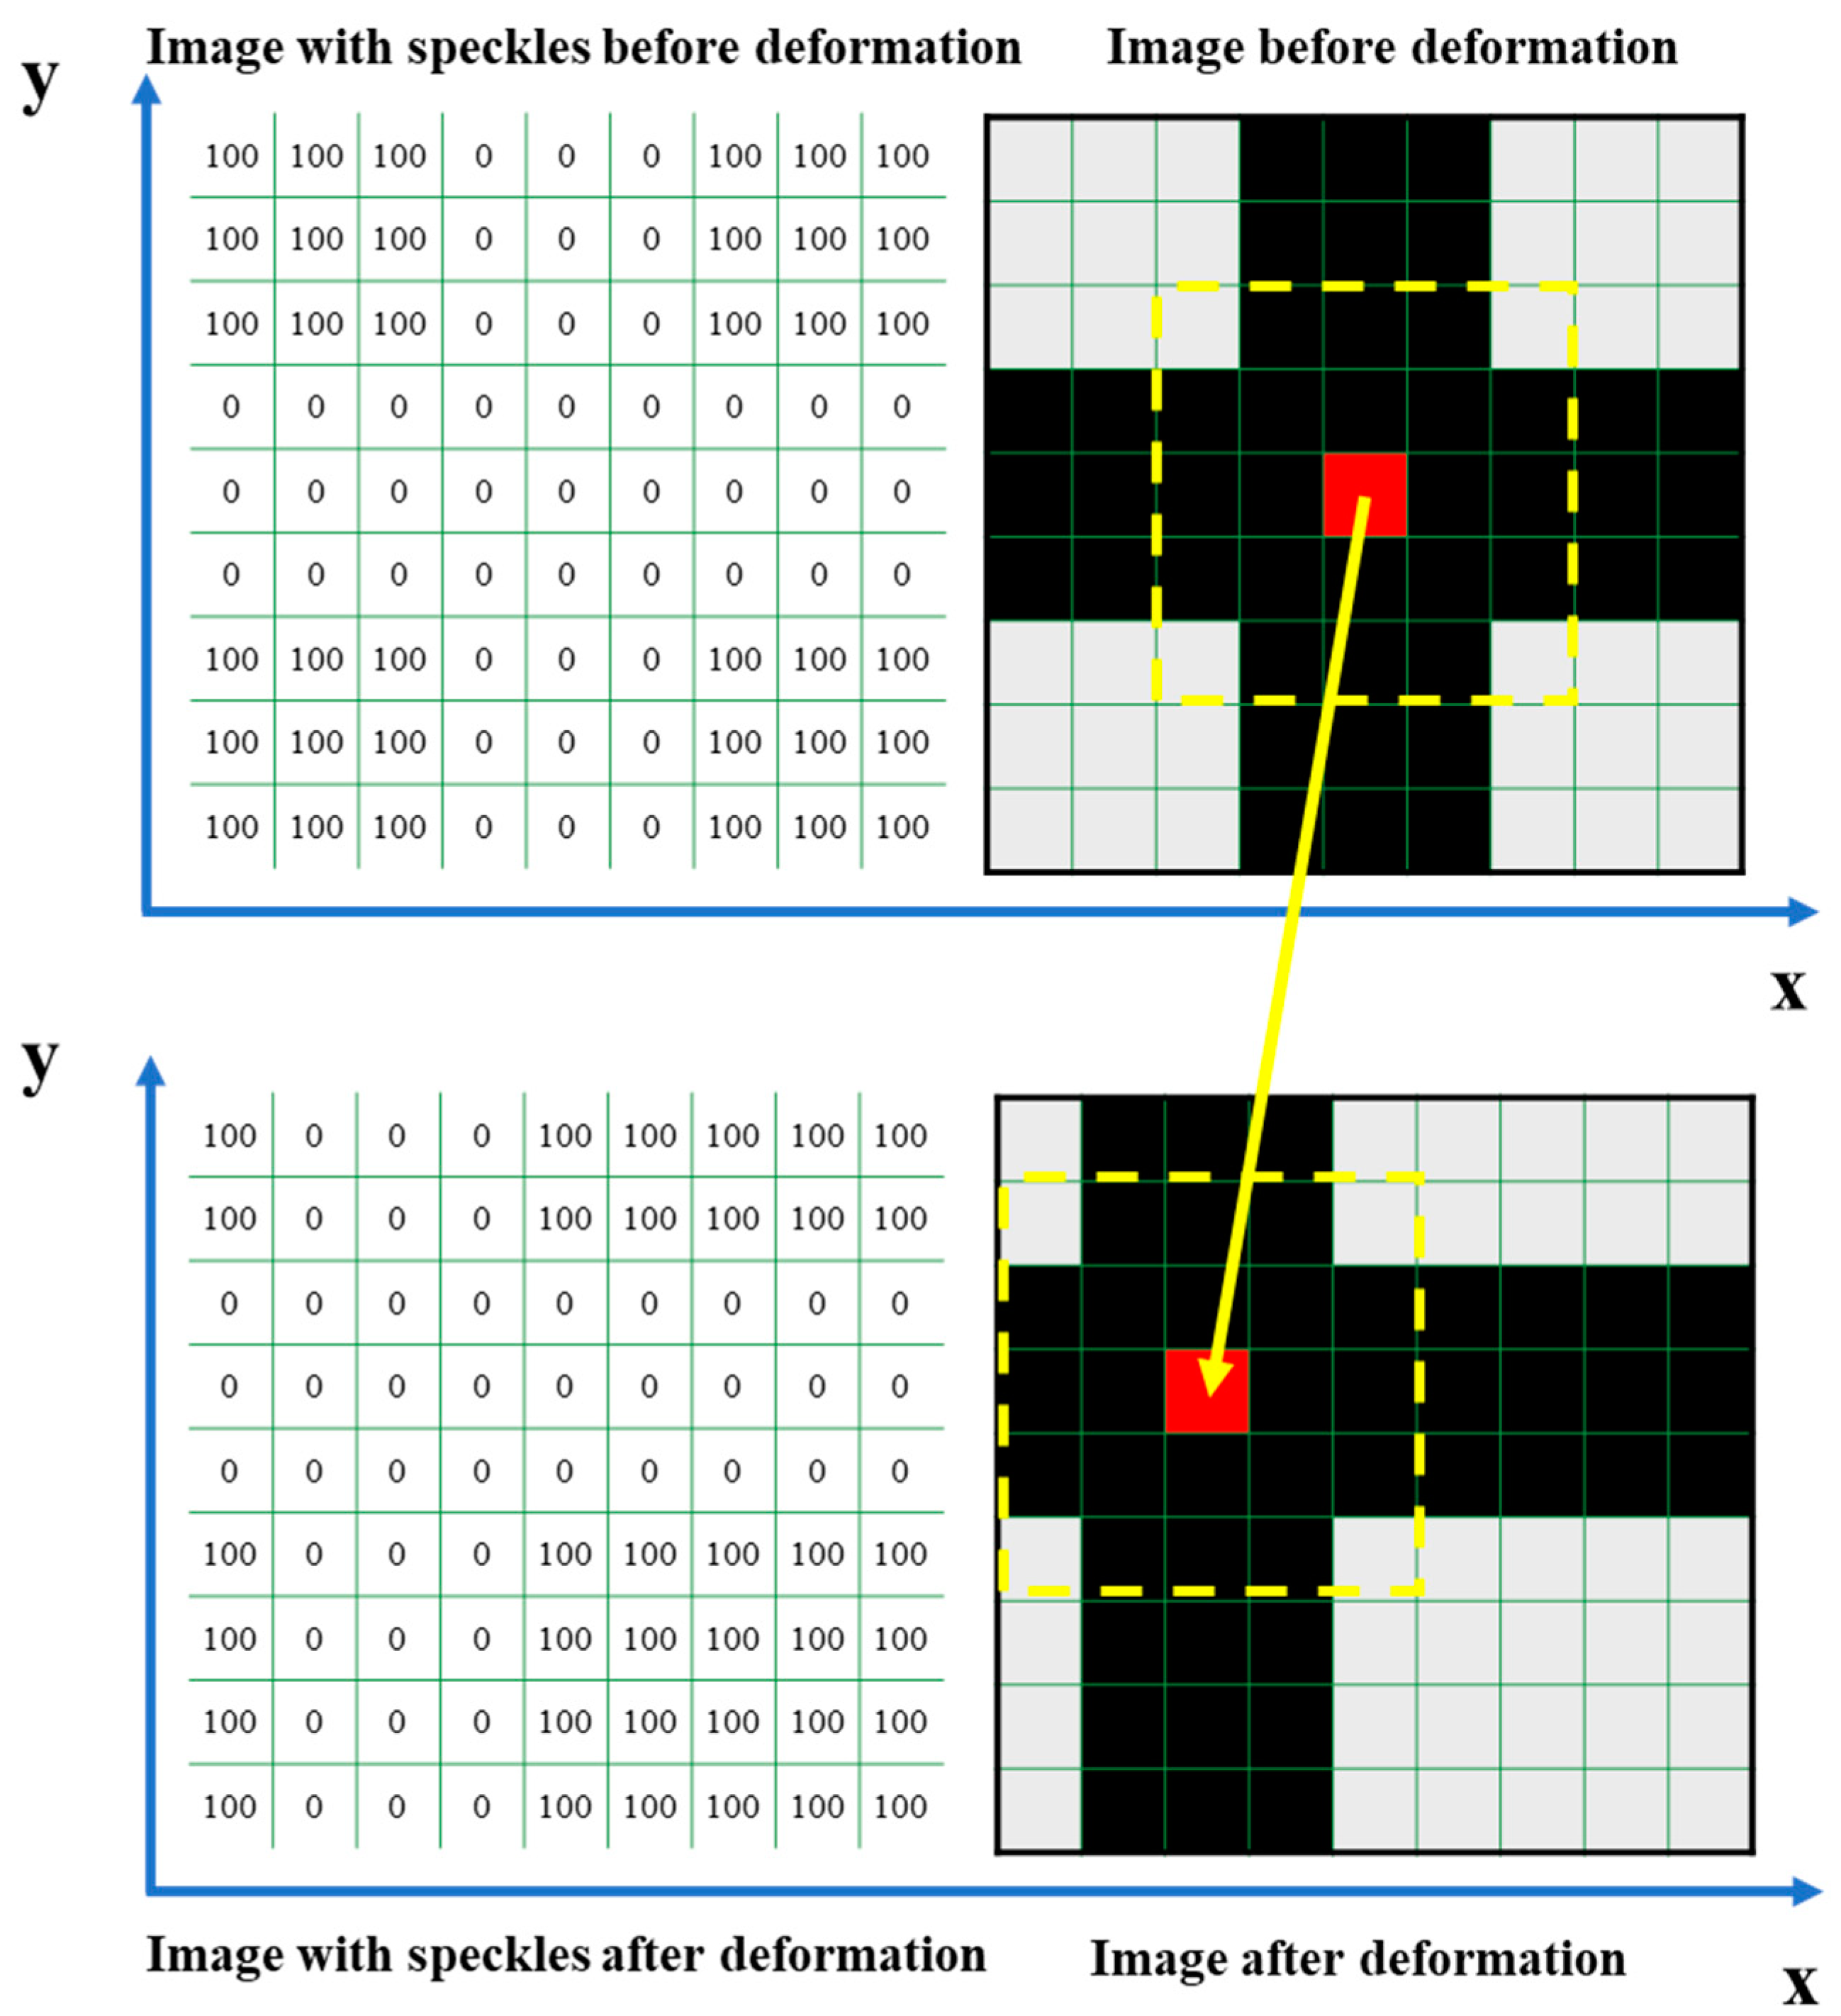
Figure 6.
The result of longitudinal strain of loess (with dimension of 5 cm × 5 cm × 30 cm).
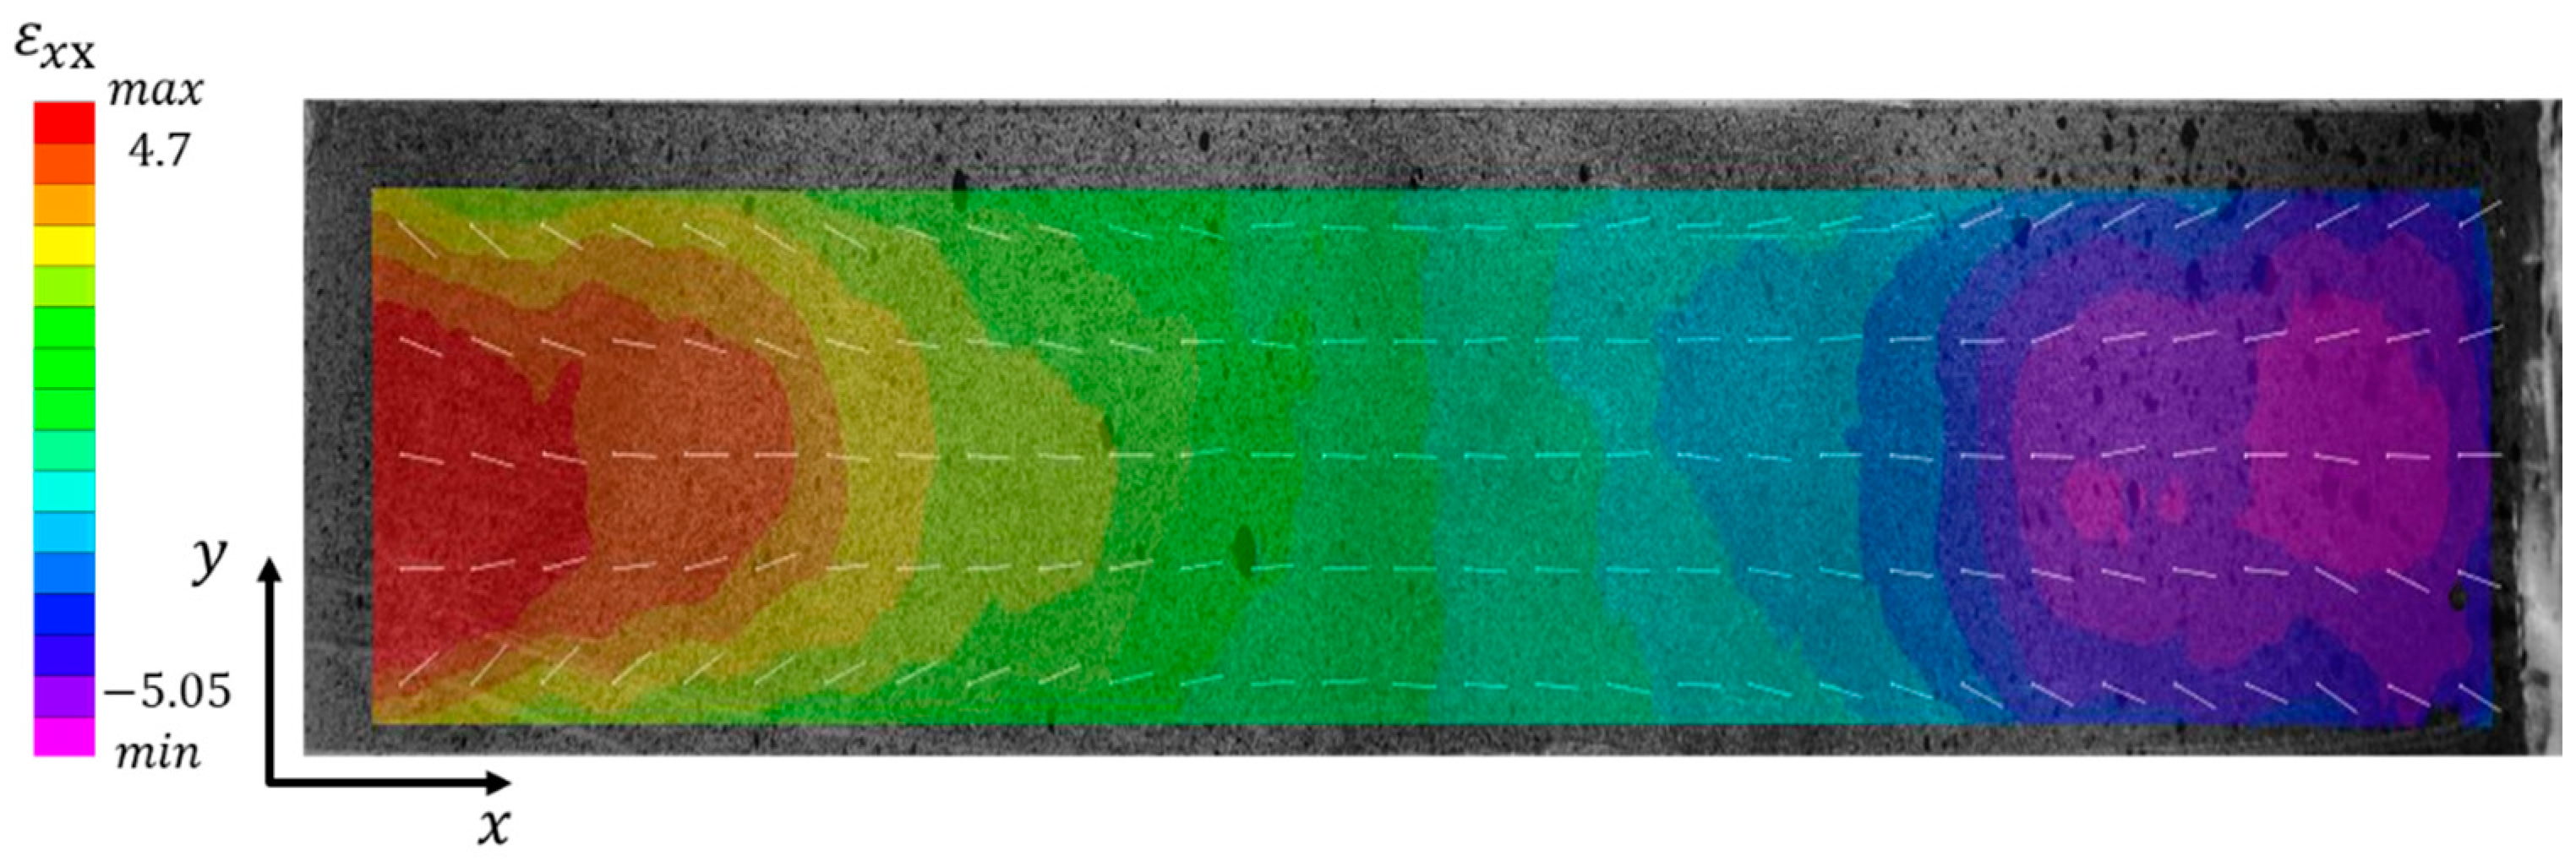
Figure 7.
Schematic presentation of DEM model used in MatDEM: (a) Multifield coupling discrete element model (red arrows present the directions of water flow; white dash lines present the shrinkage of soil particles due to evaporation); (b) Schematic of water migration (red arrows present the directions of moisture transfer).

Figure 8.
Final patterns of spacing cracks in loess samples with different dimensions: (a) 1 cm × 1 cm × 30 cm; (b) 2 cm × 2 cm × 30 cm; (c) 3 cm × 3 cm × 30 cm; (d) 4 cm × 4 cm × 30 cm; (e) 5 cm × 5 cm × 30 cm.
Figure 8.
Final patterns of spacing cracks in loess samples with different dimensions: (a) 1 cm × 1 cm × 30 cm; (b) 2 cm × 2 cm × 30 cm; (c) 3 cm × 3 cm × 30 cm; (d) 4 cm × 4 cm × 30 cm; (e) 5 cm × 5 cm × 30 cm.

Figure 9.
The relationship between the parameters of spacing cracks versus volume of soil samples: (a) cracking ratio, average crack width versus volume of soil samples; (b) number of cracks, average crack spacing versus volume of soil samples.
Figure 9.
The relationship between the parameters of spacing cracks versus volume of soil samples: (a) cracking ratio, average crack width versus volume of soil samples; (b) number of cracks, average crack spacing versus volume of soil samples.
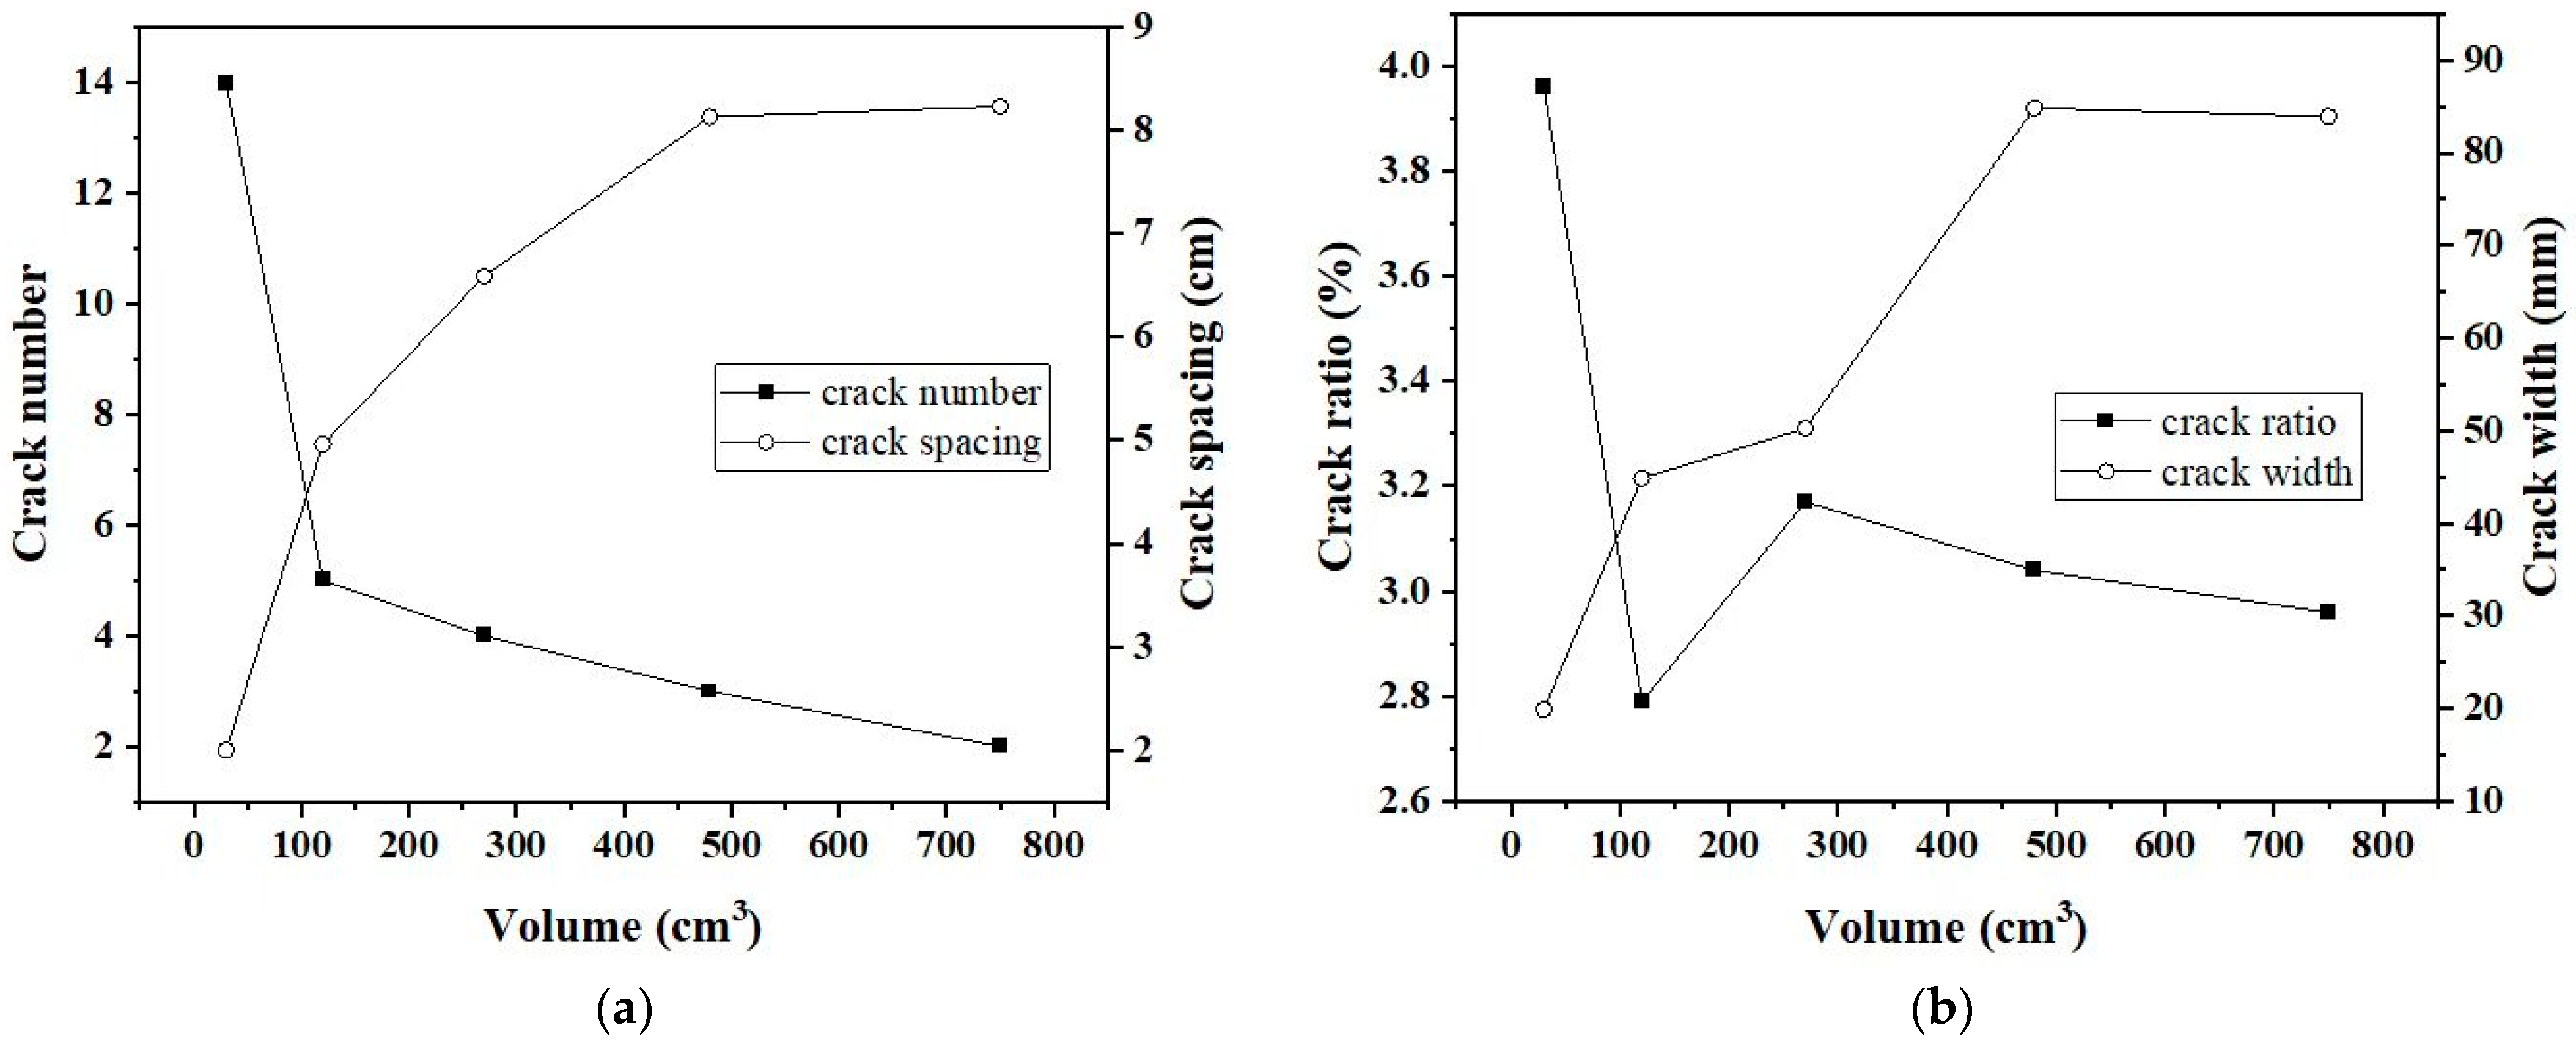
Figure 10.
Variations of water content of different specimens versus time.
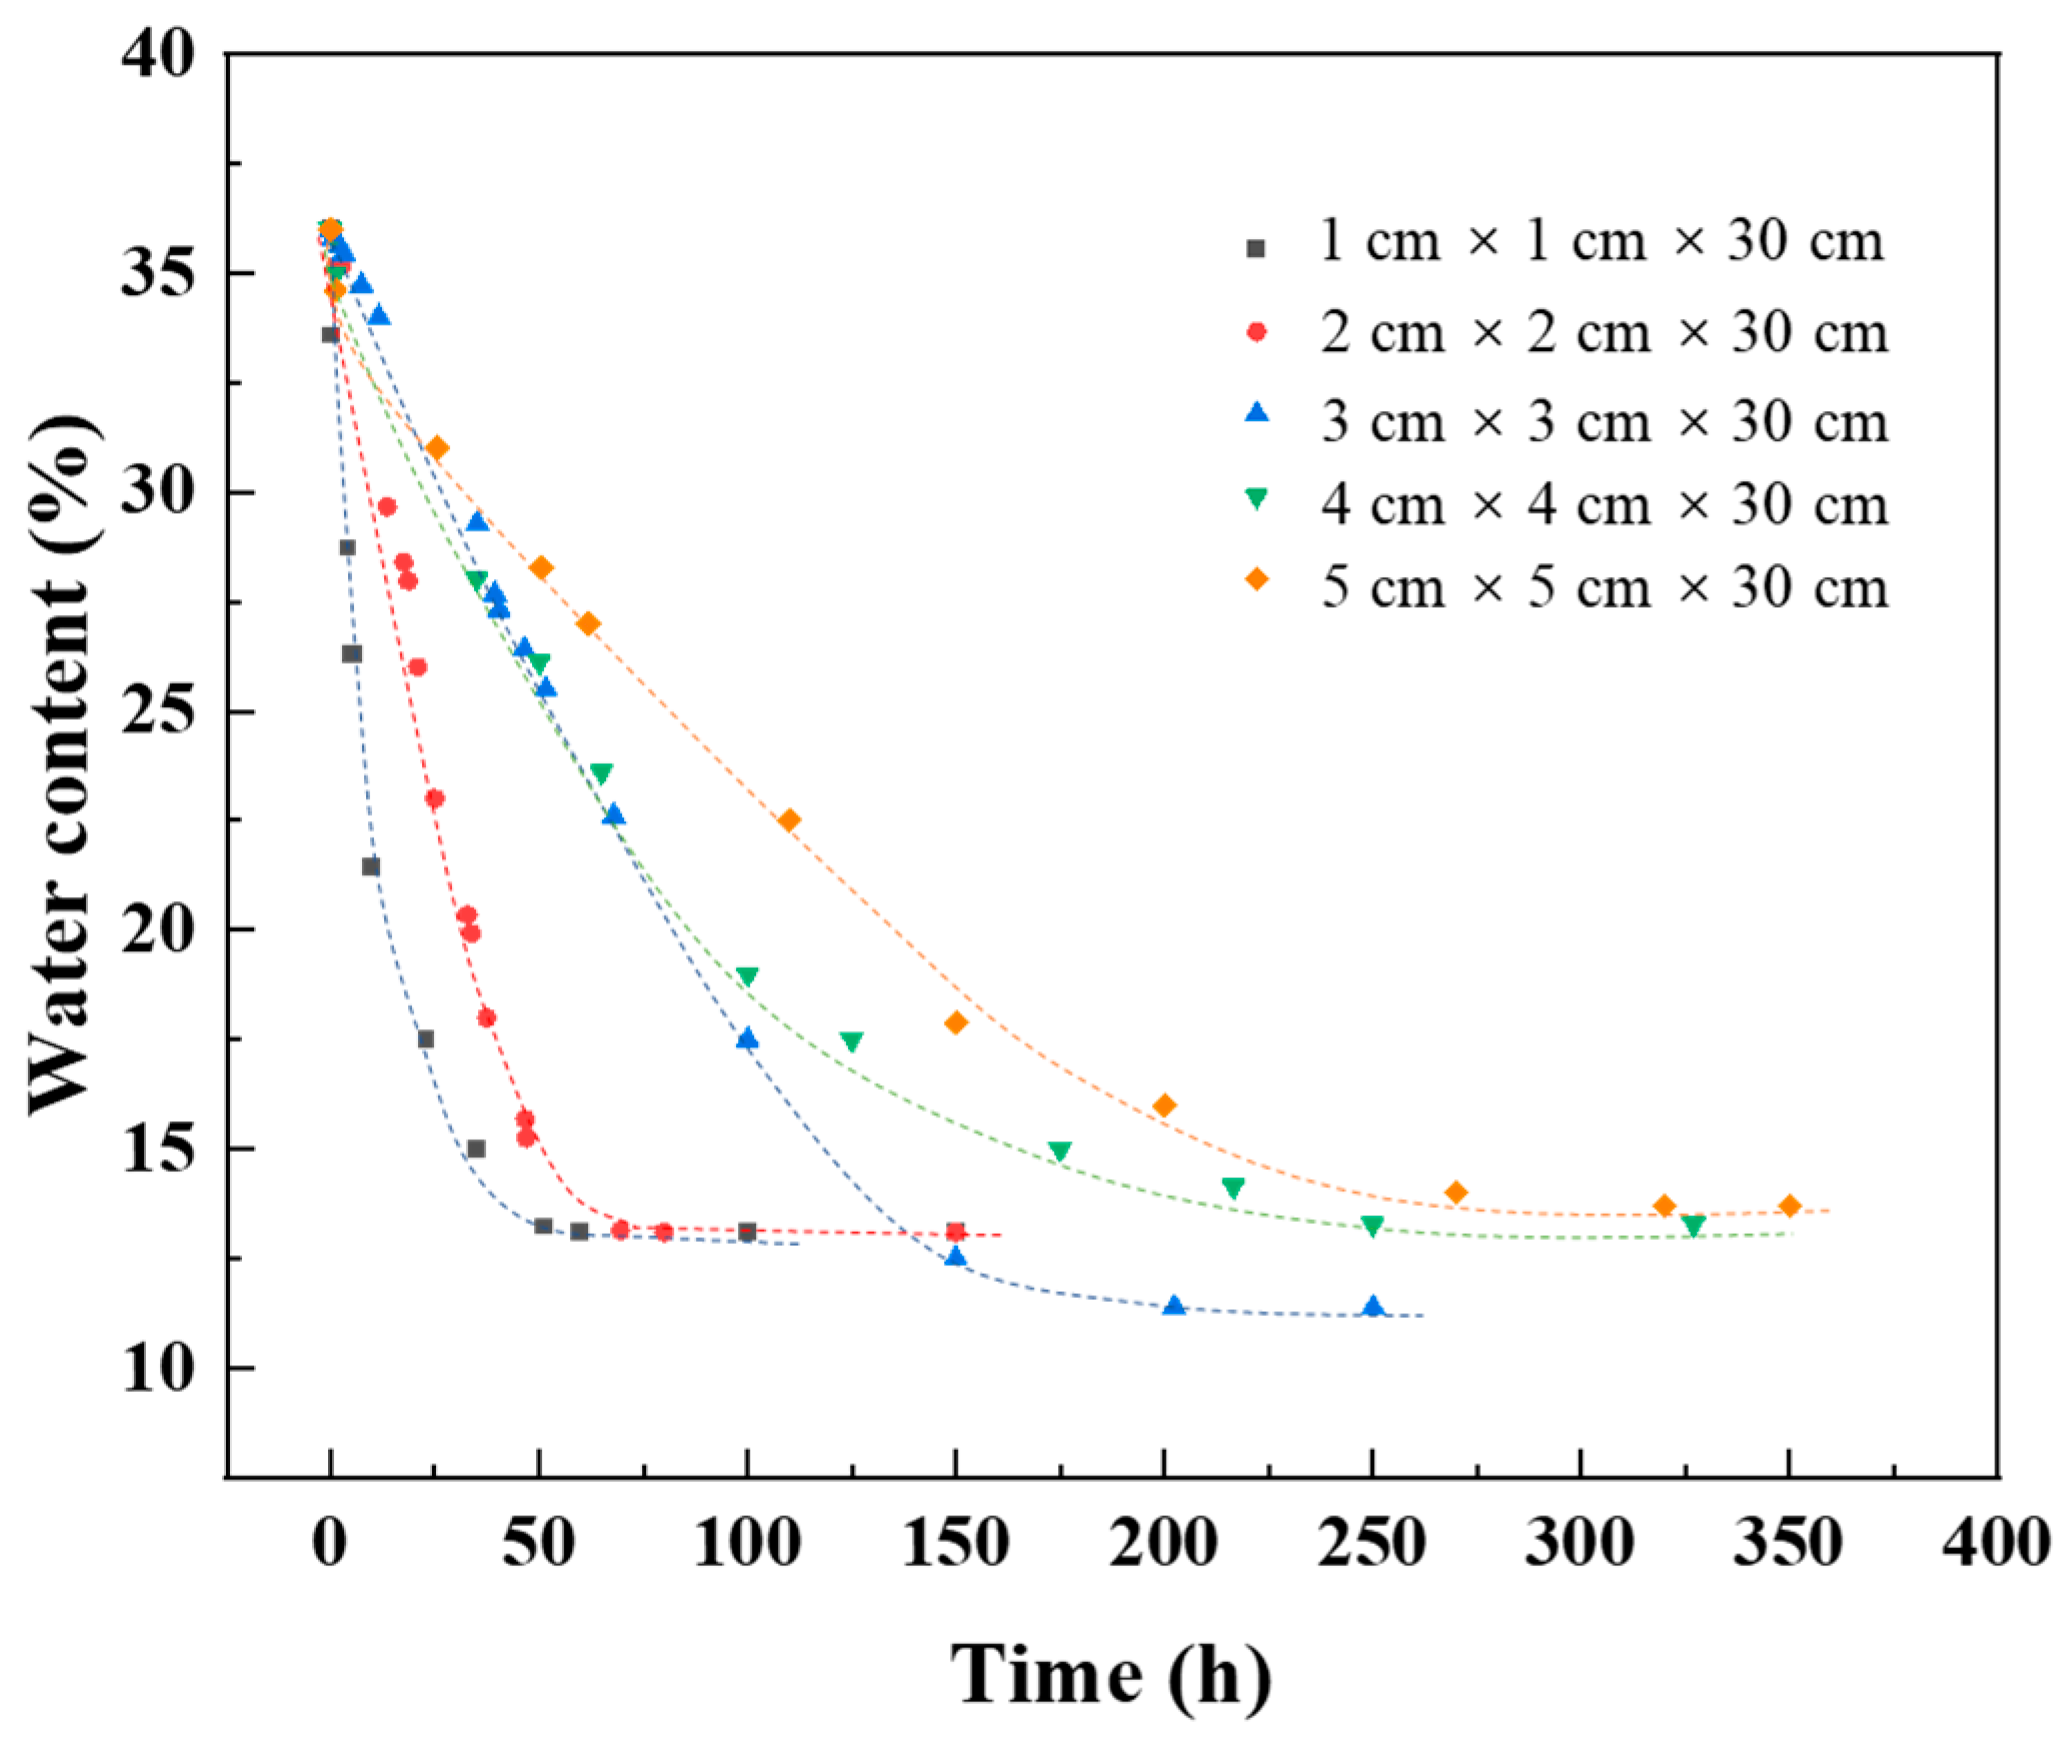
Figure 11.
Contour map of of loess samples with the dimension of 5 cm × 5 cm × 30 cm at different times: (a) t = 58 h; (b) t = 58.17 h; (c) t = 58.5 h; (d) t = 58.67 h.
Figure 11.
Contour map of of loess samples with the dimension of 5 cm × 5 cm × 30 cm at different times: (a) t = 58 h; (b) t = 58.17 h; (c) t = 58.5 h; (d) t = 58.67 h.

Figure 12.
Displacement vectors around crack 2 (t = 58.67 h).
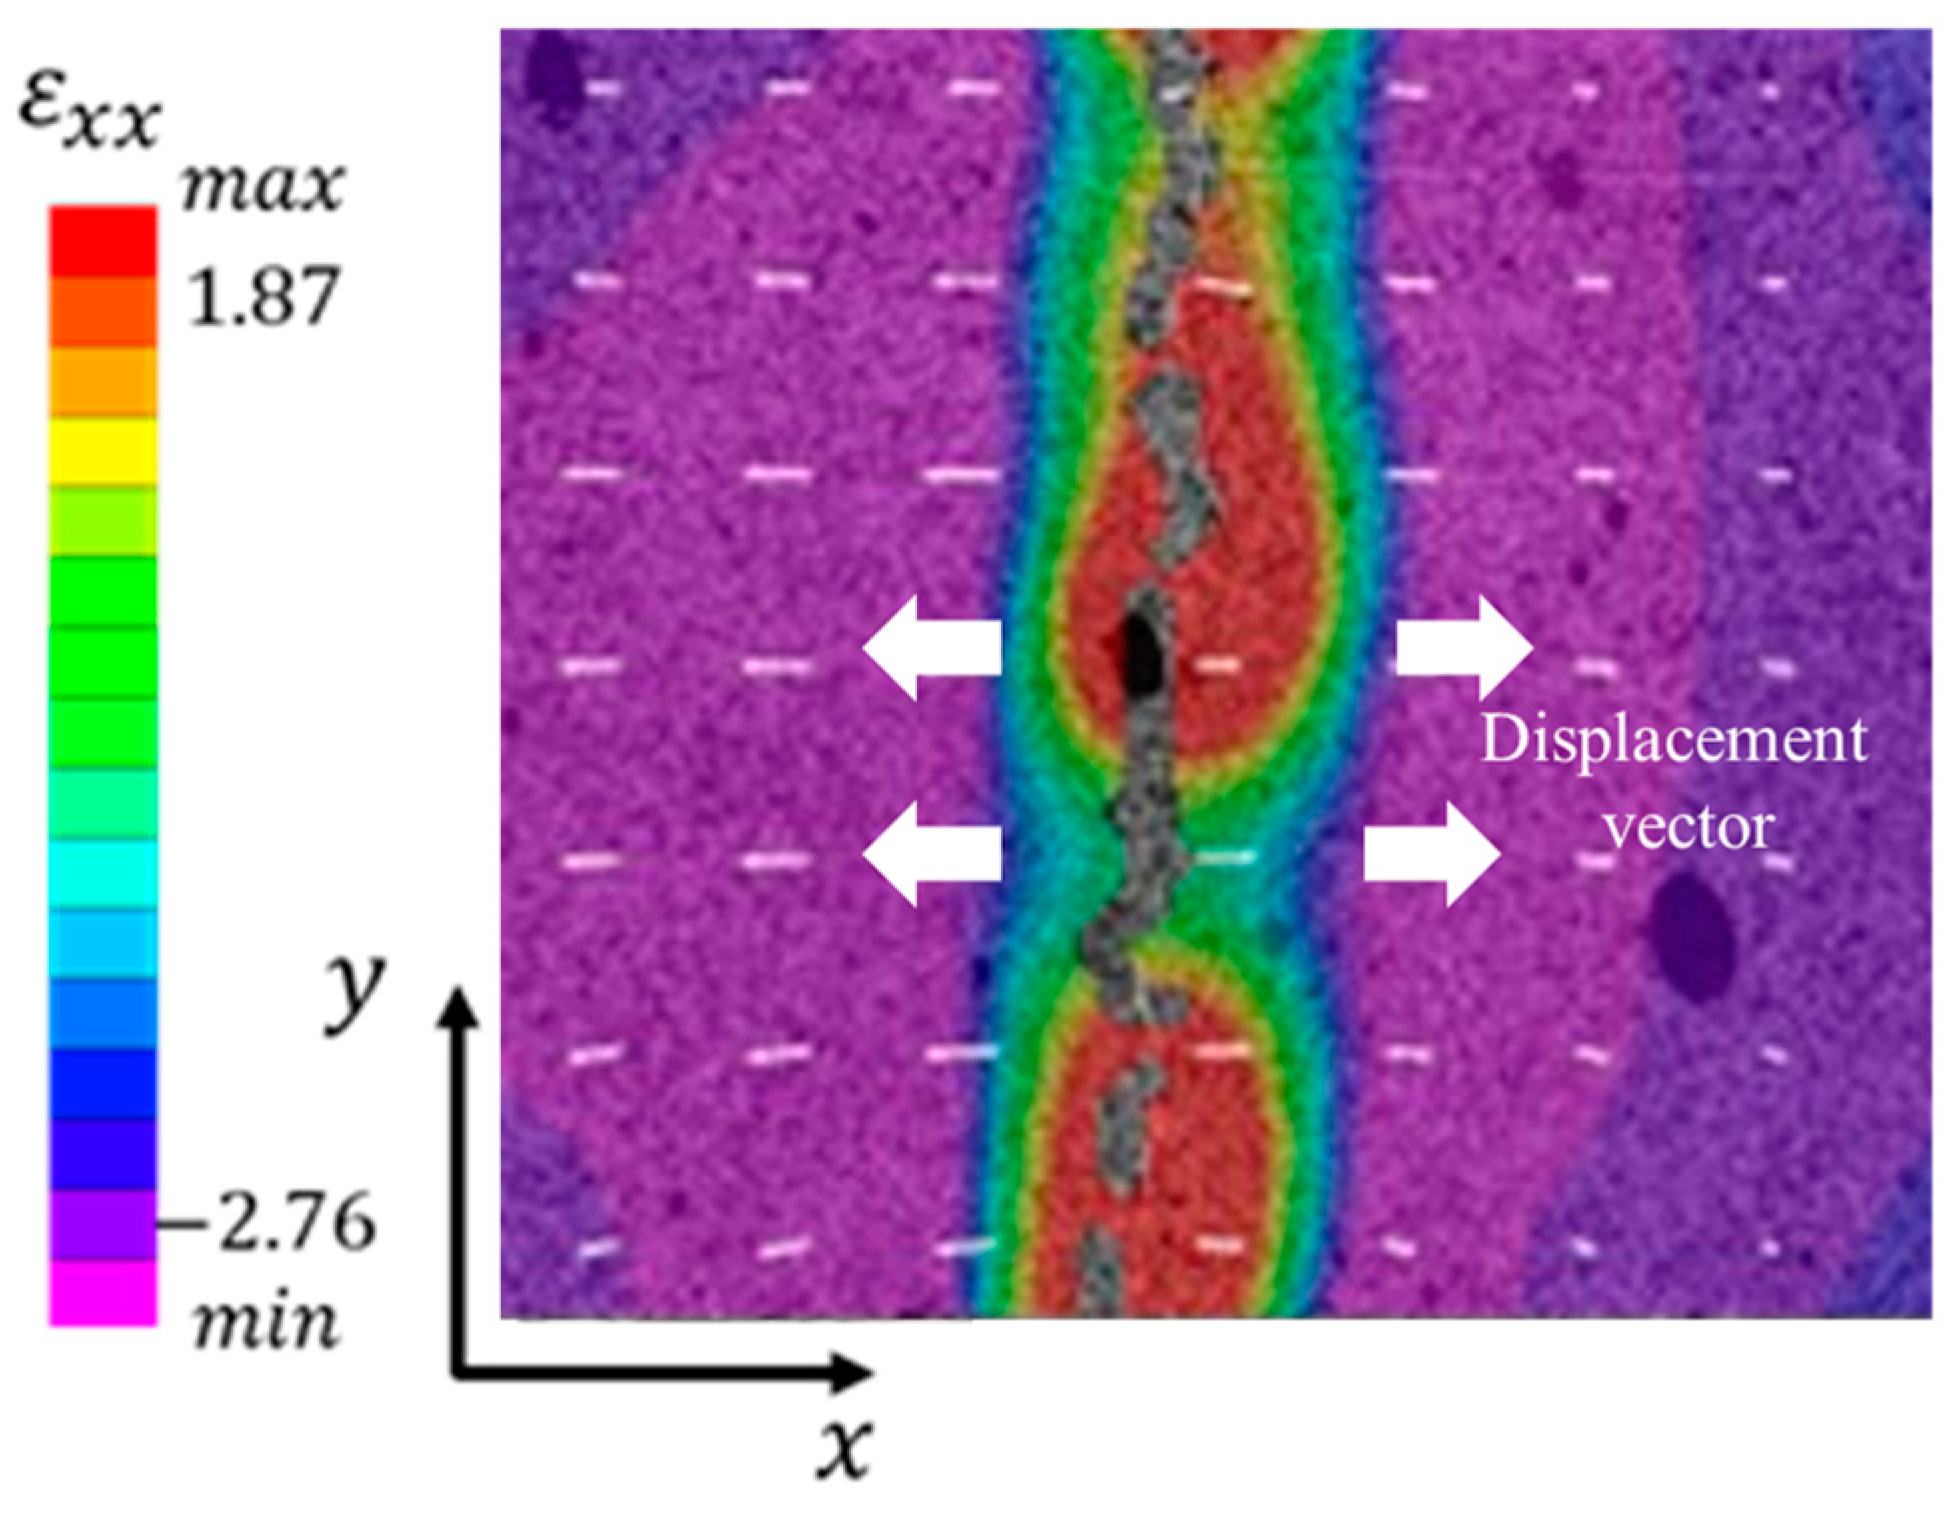
Figure 13.
Transversal strains of the samples with a dimension of 3 cm × 3 cm × 30 cm at different times: (a) t = 8.67 h; (b) t = 9 h; (c) t = 9.33 h.
Figure 13.
Transversal strains of the samples with a dimension of 3 cm × 3 cm × 30 cm at different times: (a) t = 8.67 h; (b) t = 9 h; (c) t = 9.33 h.
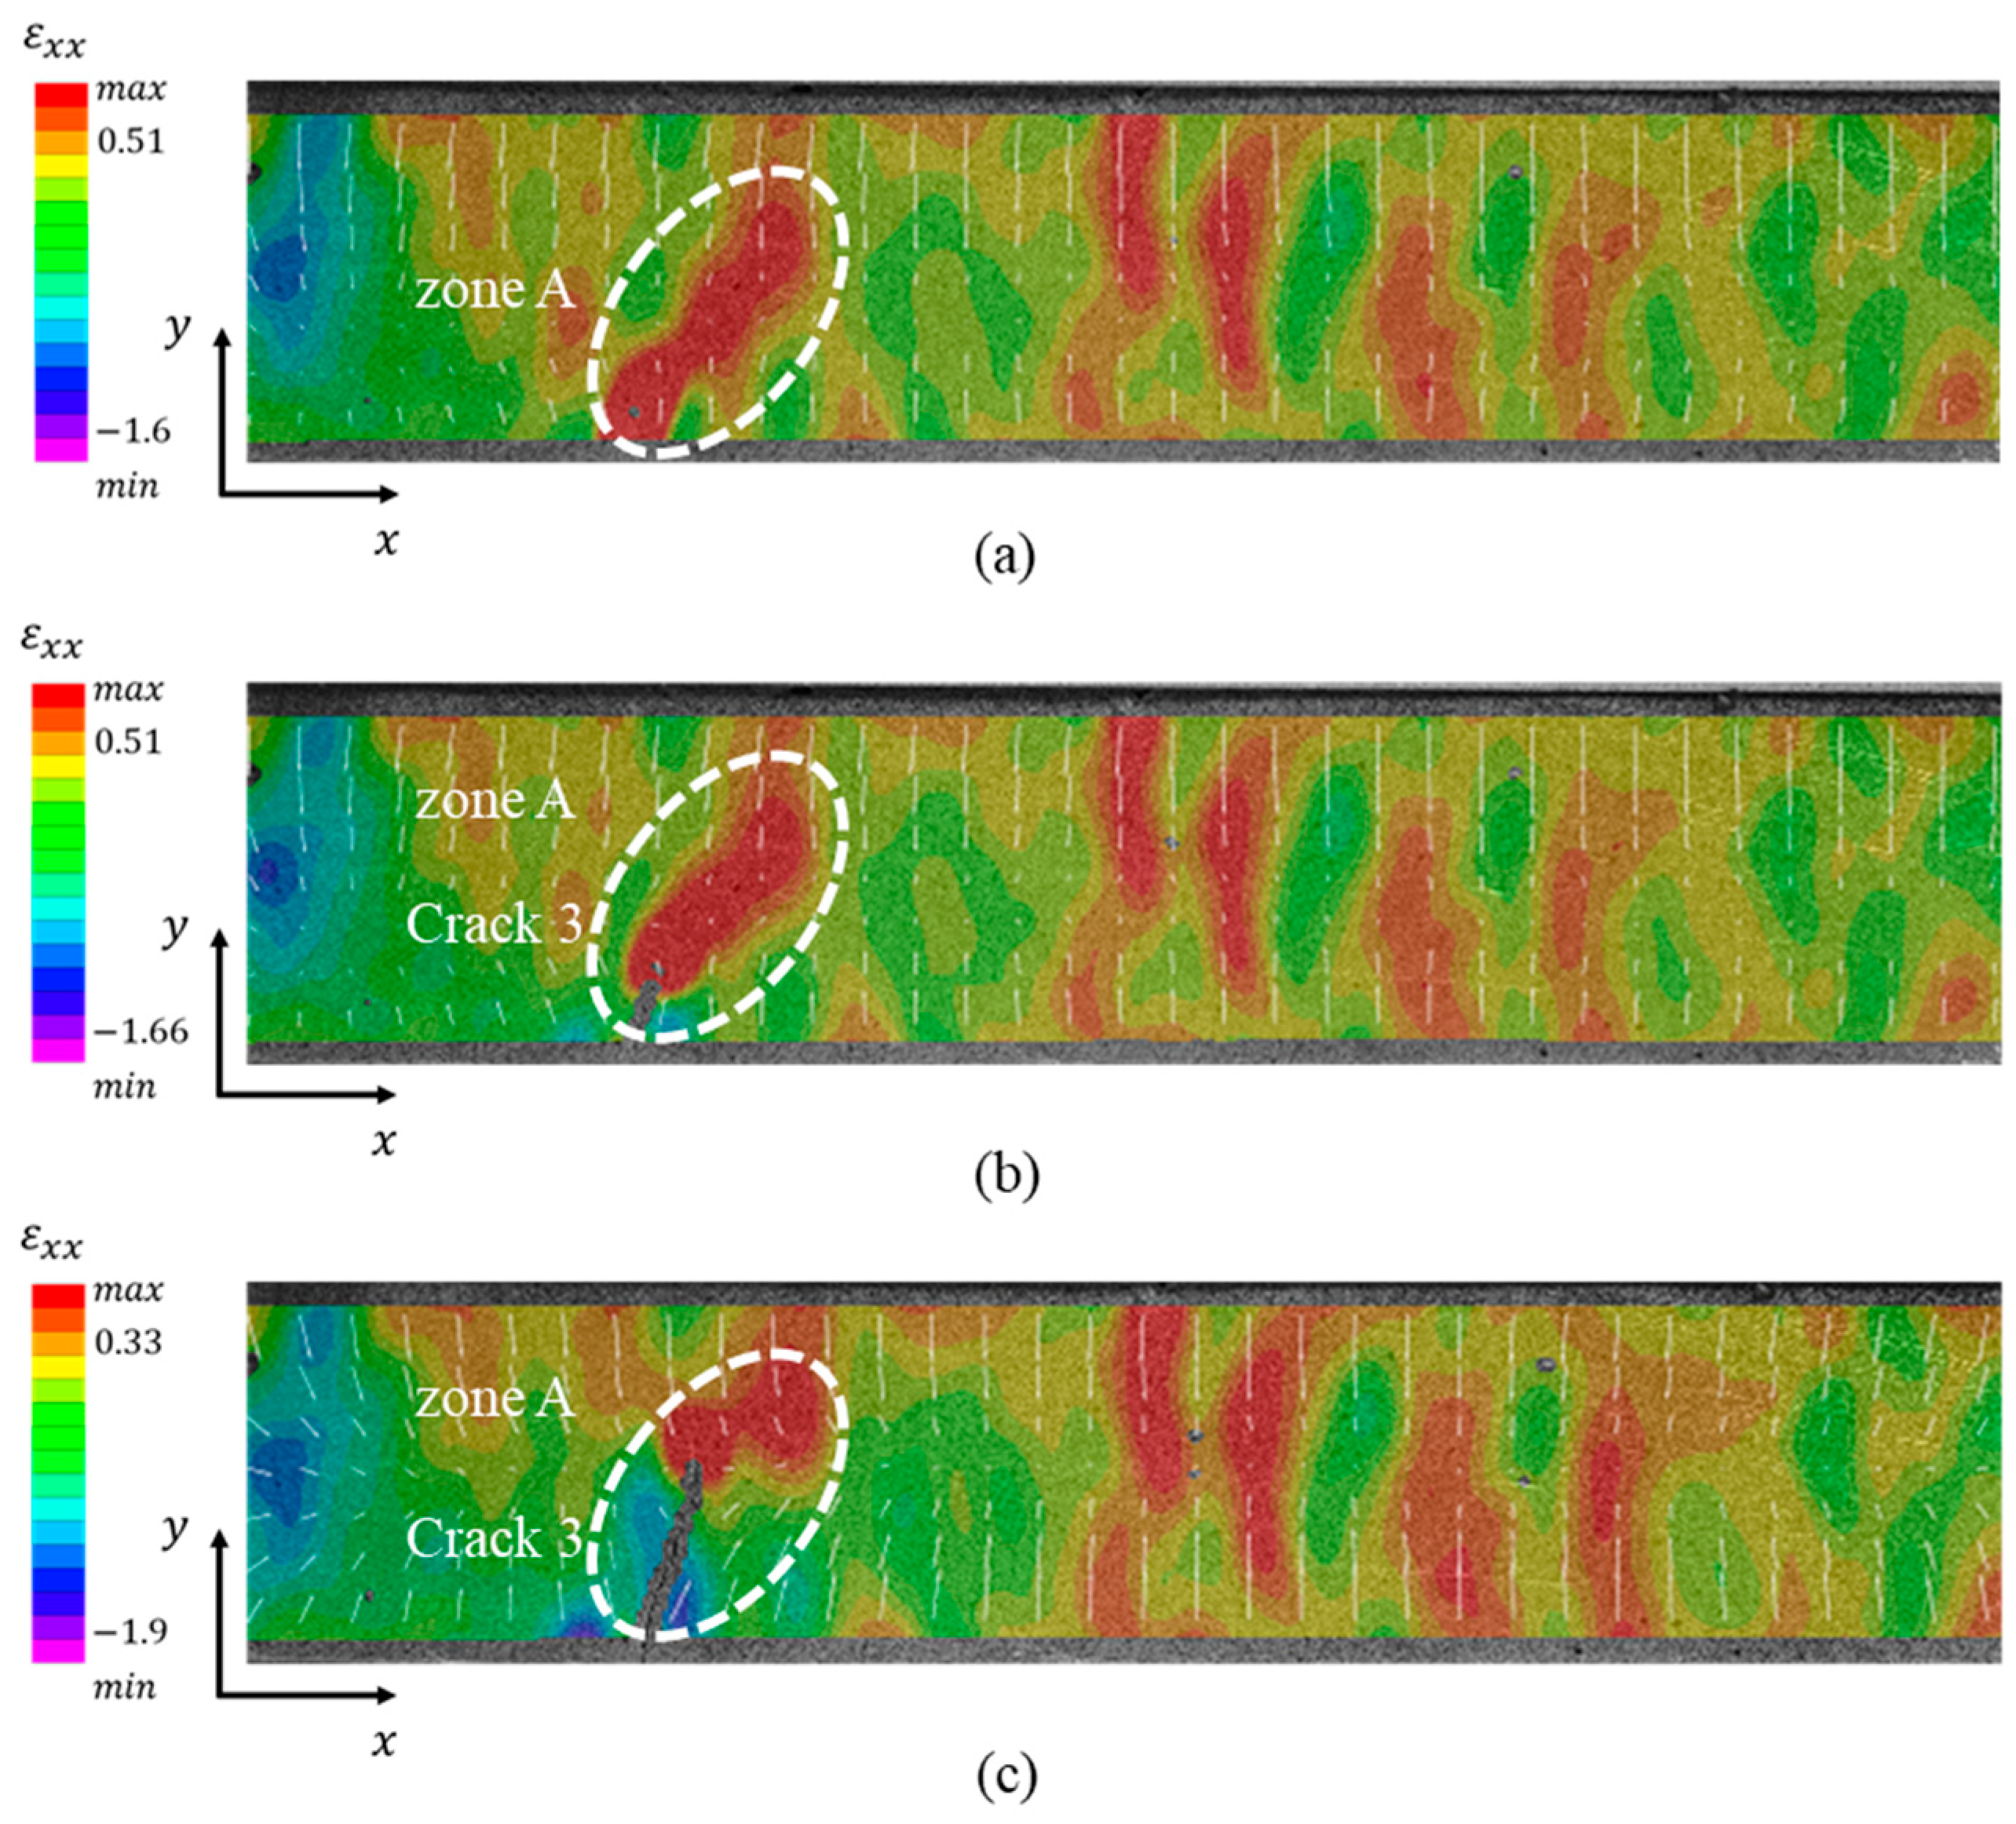
Figure 14.
Decomposition of the displacement vectors around crack 3 in zone A (t = 9.33 h).
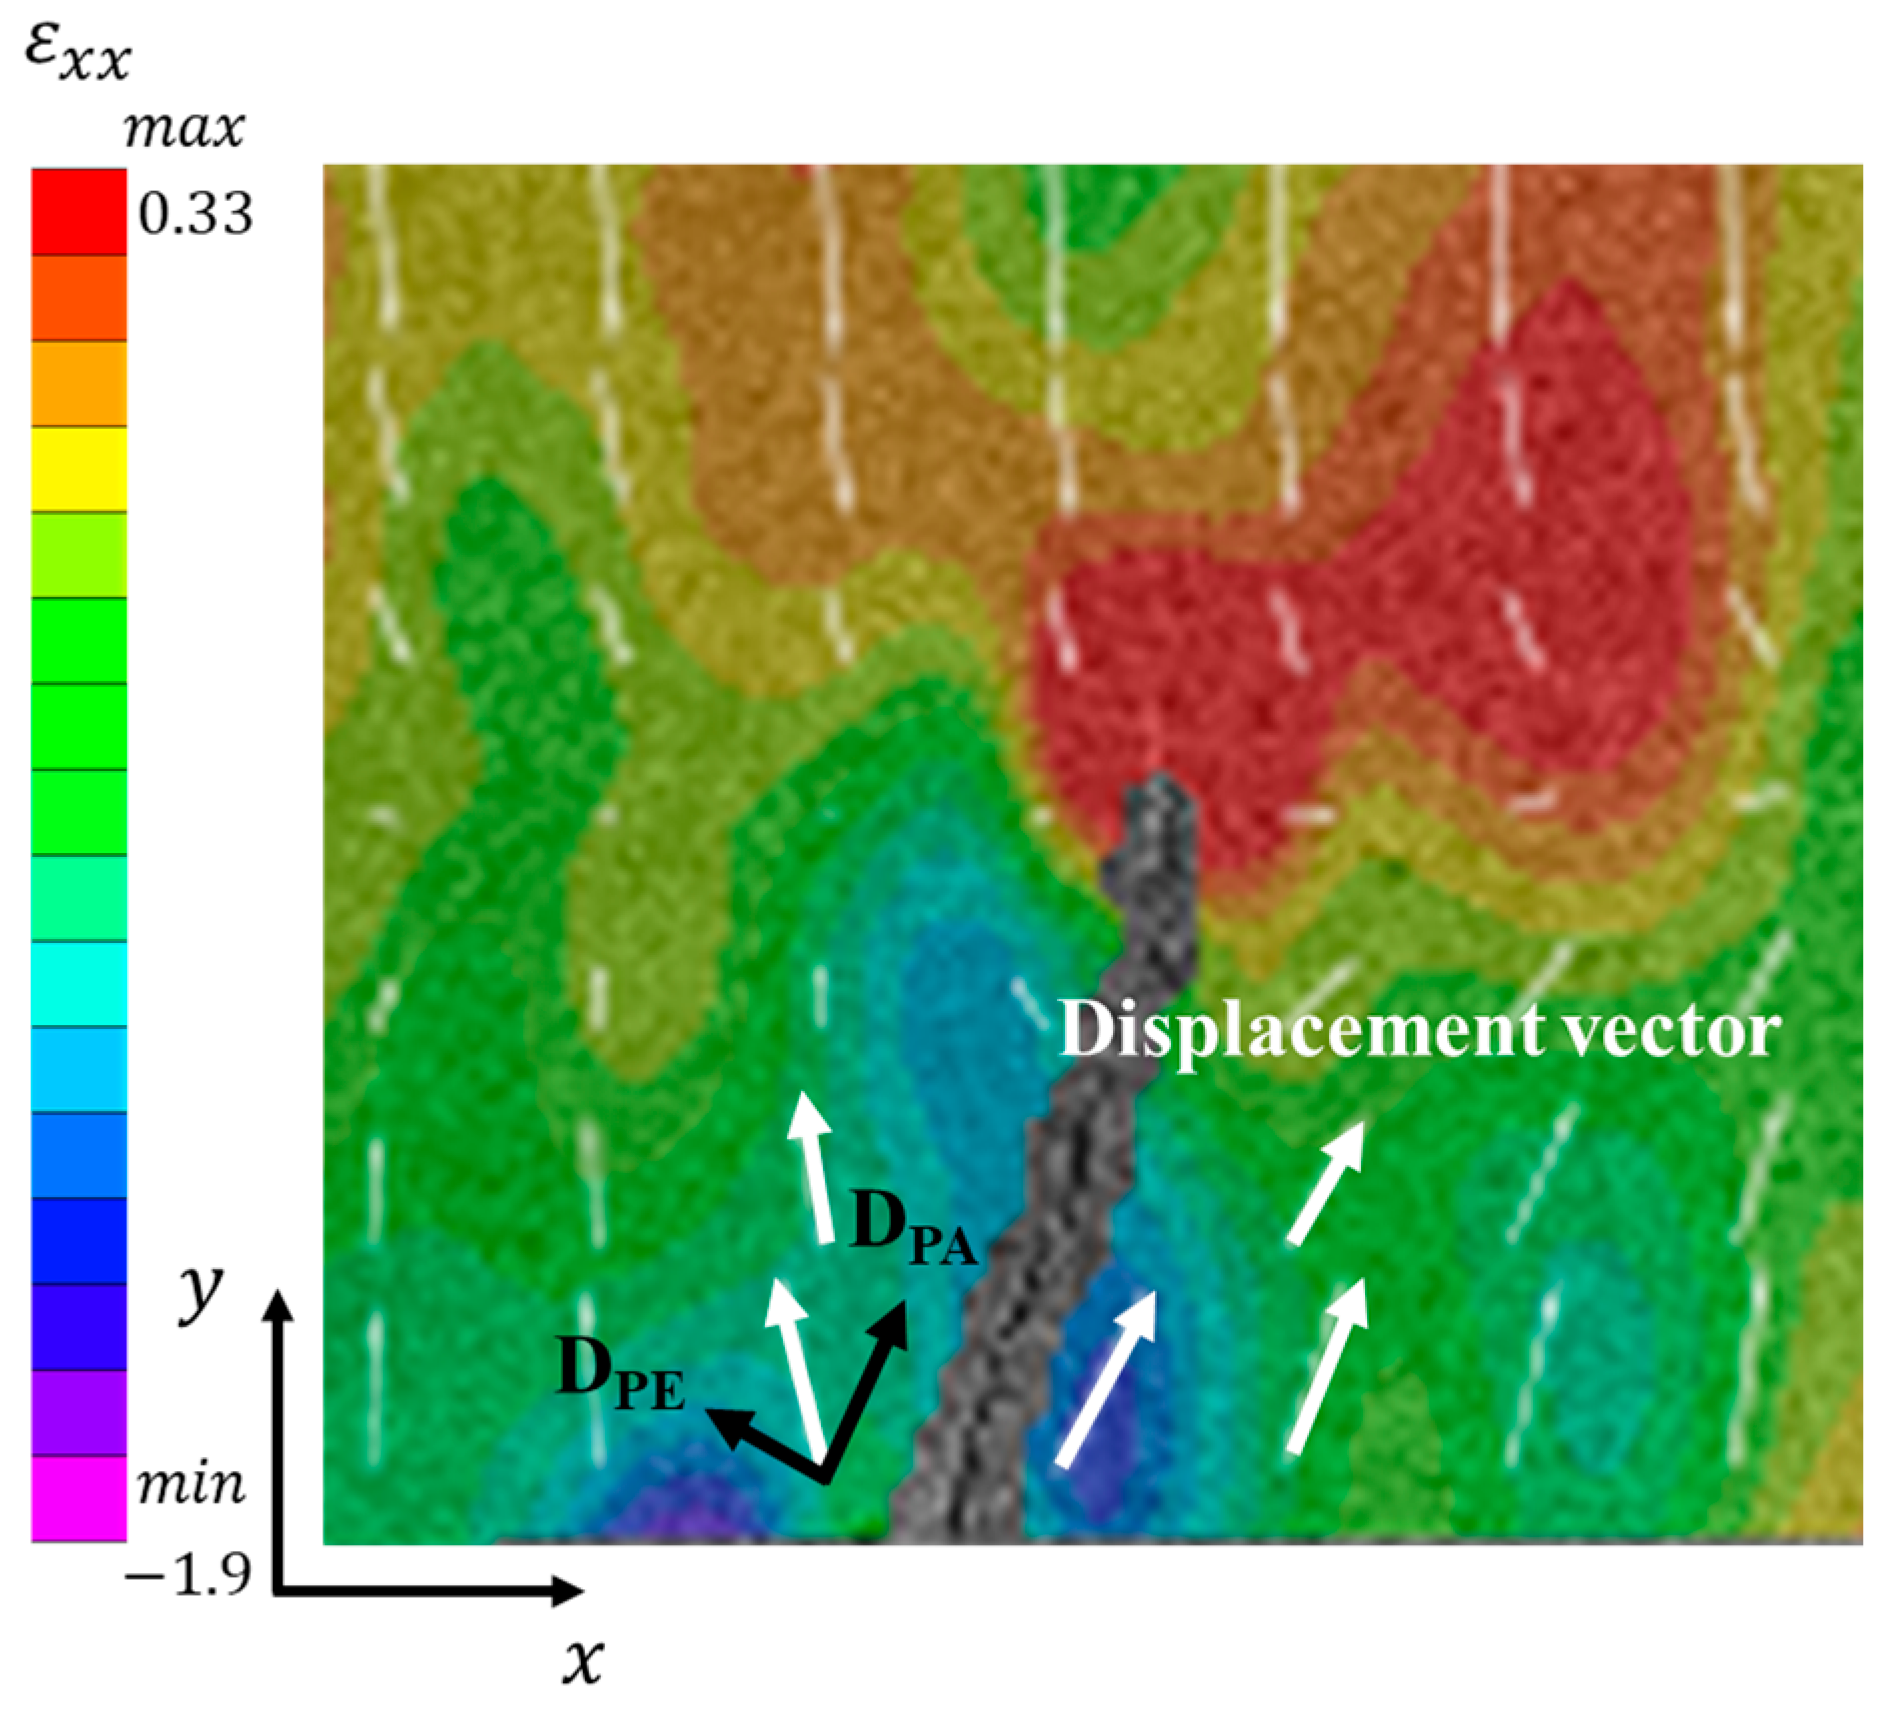
Figure 15.
The appearance order of spacing cracks of the soil sample with a dimension of 3 cm × 3 cm × 30 cm at different times: (a) t = 11 h; (b) t = 13.33 h; (c) t = 15 h; (d) t = 21 h; (e) t = 25.67 h.
Figure 15.
The appearance order of spacing cracks of the soil sample with a dimension of 3 cm × 3 cm × 30 cm at different times: (a) t = 11 h; (b) t = 13.33 h; (c) t = 15 h; (d) t = 21 h; (e) t = 25.67 h.
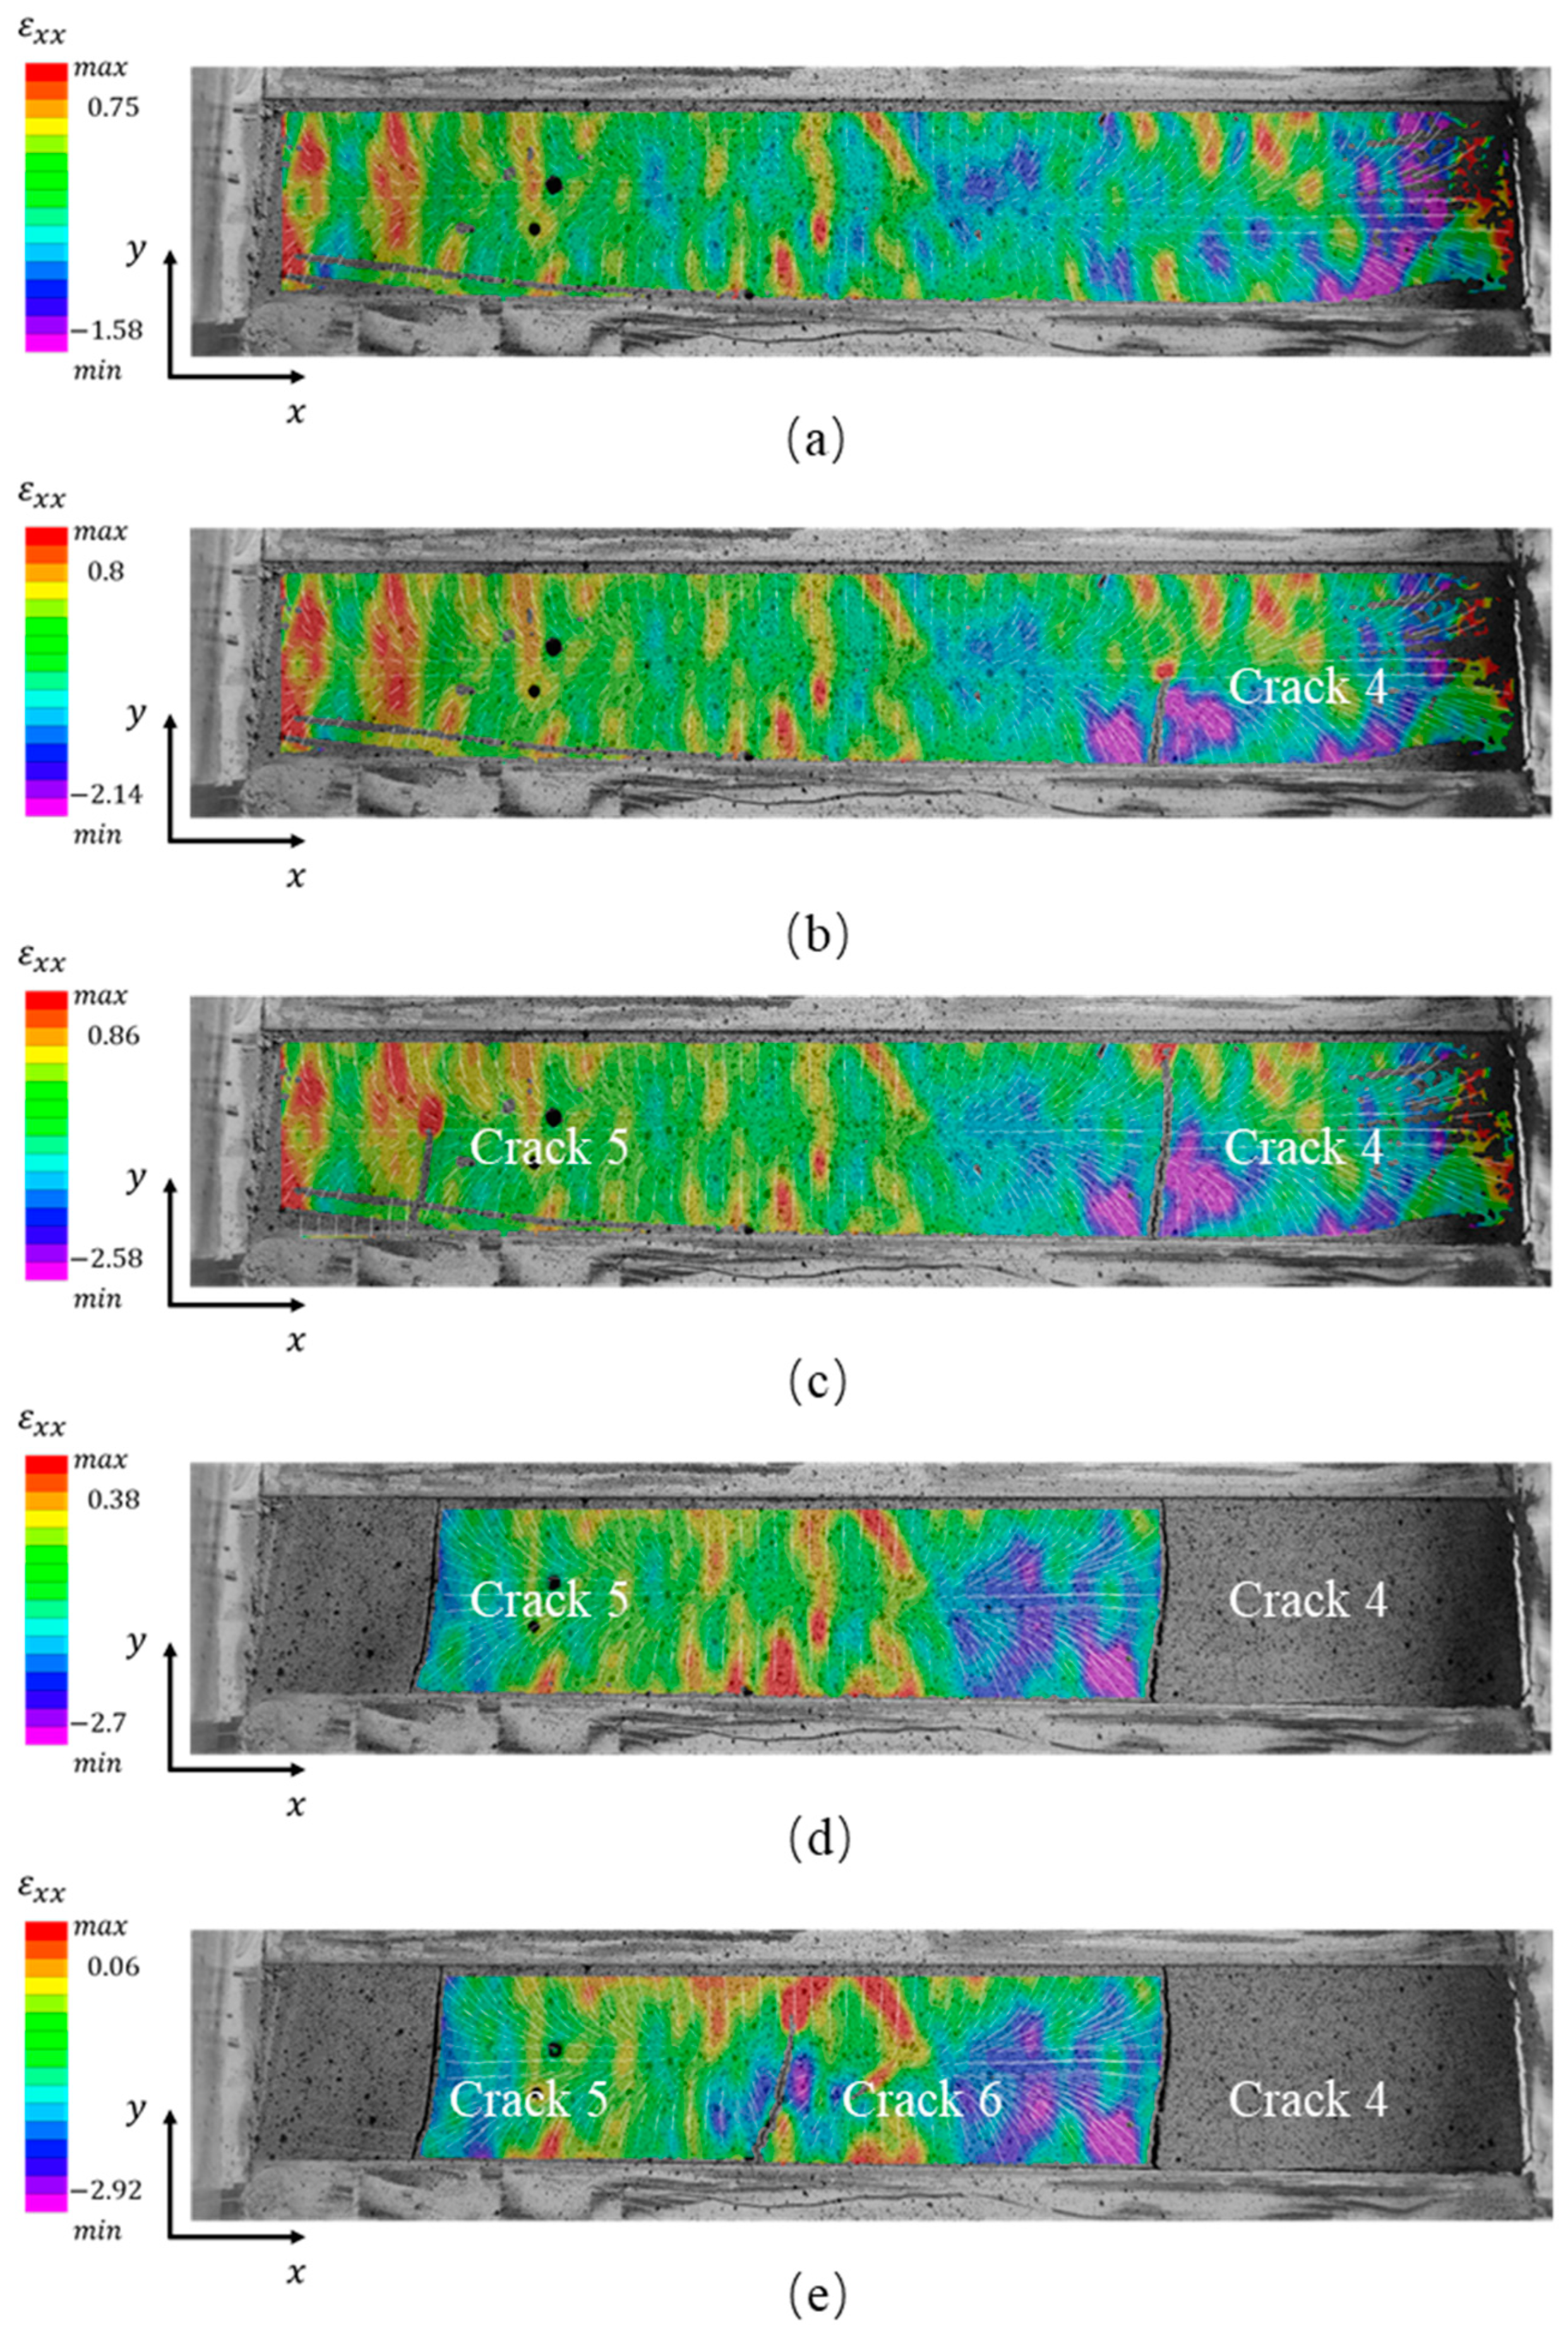
Figure 16.
Contour map of local suction distribution: (a) t = 12 h; (b) t = 14.67 h; (c) t = 15 h; (d) t = 25.67 h.
Figure 16.
Contour map of local suction distribution: (a) t = 12 h; (b) t = 14.67 h; (c) t = 15 h; (d) t = 25.67 h.
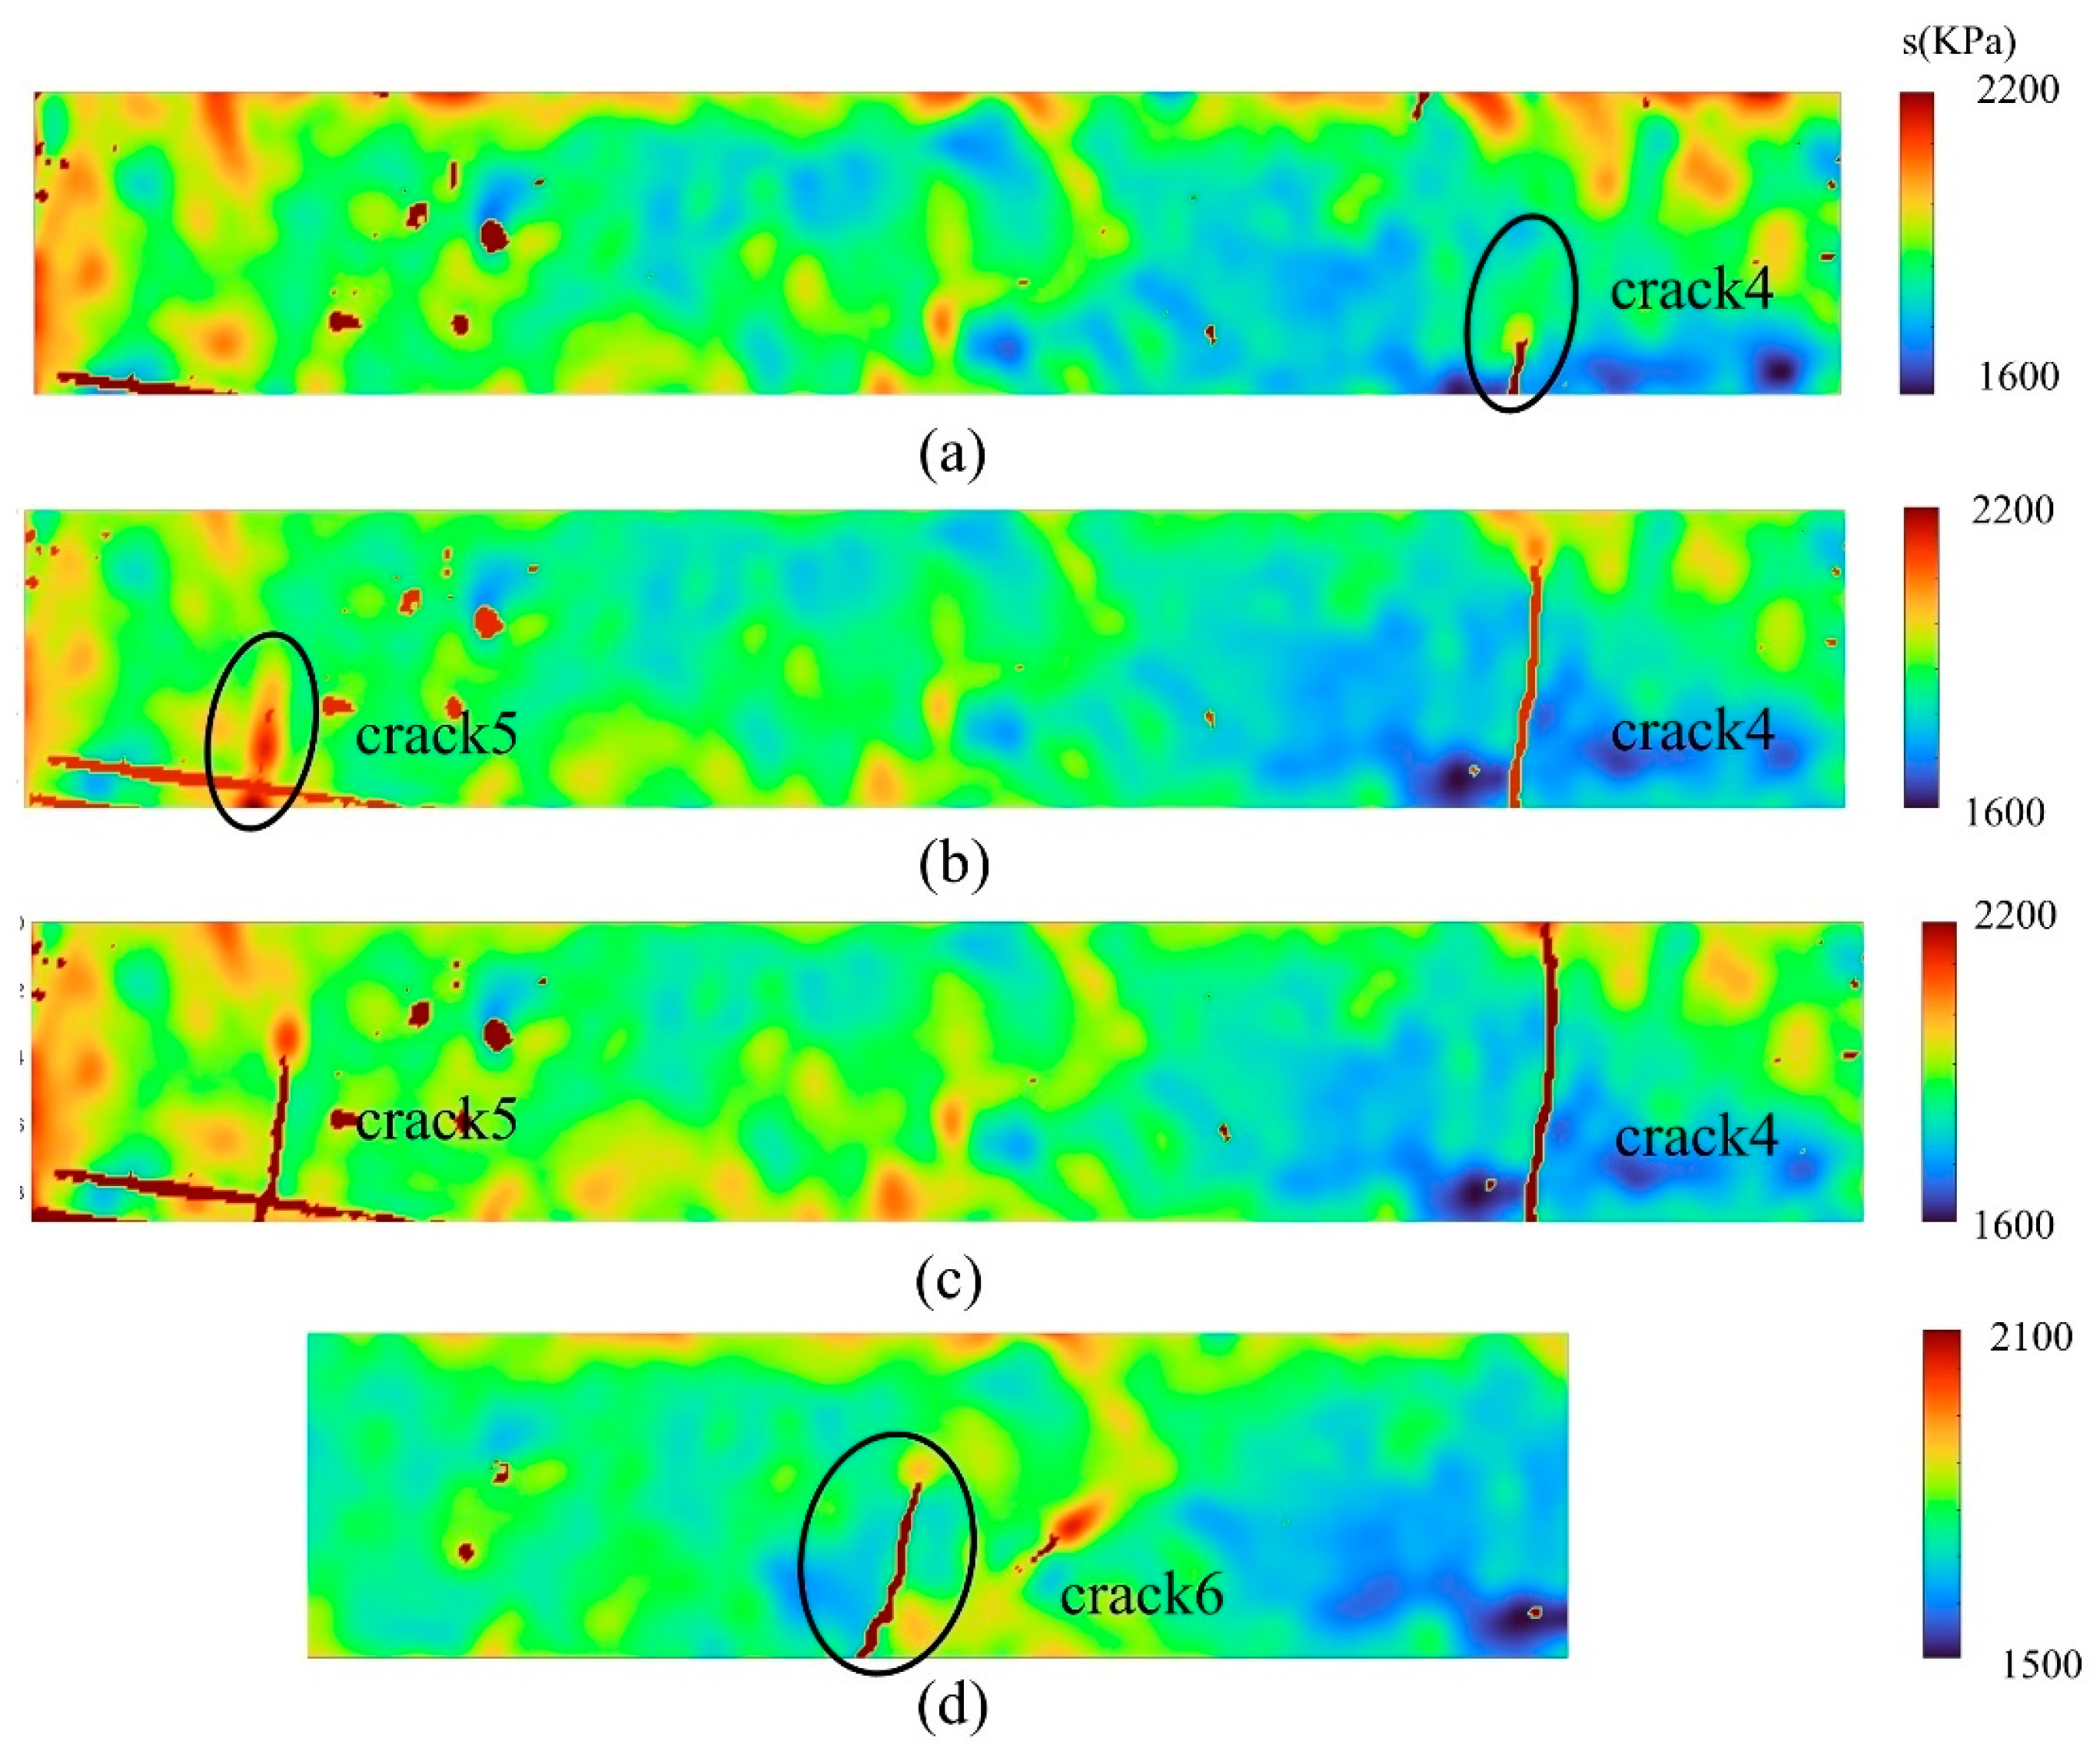
Figure 17.
Discrete element models of loess sample with a dimension of 2 cm × 2 cm × 30 cm during drying (Different colors of balls present different diameters of soil particles): (a) w = 28%; (b) w = 18%; (c) w = 13%.
Figure 17.
Discrete element models of loess sample with a dimension of 2 cm × 2 cm × 30 cm during drying (Different colors of balls present different diameters of soil particles): (a) w = 28%; (b) w = 18%; (c) w = 13%.

Figure 18.
Influence of the sample size on crack patterns: (a) 1 cm × 1 cm × 30 cm; (b) 2 cm × 2 cm × 30 cm; (c) 3 cm × 3 cm × 30 cm; (d) 4 cm × 4 cm × 30 cm; (e) 5 cm × 5 cm × 30 cm.
Figure 18.
Influence of the sample size on crack patterns: (a) 1 cm × 1 cm × 30 cm; (b) 2 cm × 2 cm × 30 cm; (c) 3 cm × 3 cm × 30 cm; (d) 4 cm × 4 cm × 30 cm; (e) 5 cm × 5 cm × 30 cm.

Table 1.
Physical properties of Jingyang loess.
| Specific Gravity | Dry Density (g·cm−3) | Liquid Limit (%) | Plastic Limit (%) | Plasticity Index | Granulometry (%) | ||
|---|---|---|---|---|---|---|---|
| Sand Content (4.75–0.075 mm) | Silt Content (0.075–0.002 mm) | Clay Content (≤0.002 mm) | |||||
| 2.69 | 1.57 | 35.6 | 17.1 | 18.5 | 0.3 | 82.7 | 17 |
Table 2.
The parameters of the experimental set-up.
| Items | Parameters | |
|---|---|---|
| Camera | Brand | Nikon |
| Maximum resolution | 6000 × 4000 pixel | |
| Field of View | 90° | |
| Aperture | F16 | |
| Light | Brand | Opple |
| Power | 11 W | |
| Color temperature | 3900 k | |
| Balance | Brand | Lichen |
| Precision | 0.01 g | |
Table 3.
The parameters of spacing cracks in loess samples with different sizes.
| Dimension of Soil Samples | 1 cm × 1 cm × 30 cm | 2 cm × 2 cm × 30 cm | 3 cm × 3 cm × 30 cm | 4 cm × 4 cm × 30 cm | 5 cm × 5 cm × 30 cm |
|---|---|---|---|---|---|
| Volume of soil samples (cm3) | 30 | 120 | 270 | 480 | 750 |
| Number of spacing cracks | 14 | 5 | 4 | 3 | 2 |
| Cracking ratio R (%) | 3.96 | 2.79 | 3.17 | 3.04 | 2.96 |
| Average width of cracks (cm) | 1.987 | 4.488 | 5.025 | 8.487 | 8.392 |
| Average spacing of cracks (cm) | 2 | 4.96 | 6.59 | 8.13 | 8.23 |
Table 4.
Maximum and minimum of loess samples at different times (corresponding to Figure 12).
Table 4.
Maximum and minimum of loess samples at different times (corresponding to Figure 12).
| Time | t = 58 h | t = 58.17 h | t = 58.5 h | t = 58.67 h |
|---|---|---|---|---|
| Max. (%) | 0.548 | 1.225 | 2.22 | 1.87 |
| Min. (%) | −2.448 | −2.505 | −2.67 | −2.76 |
Table 5.
Maximum and minimum of loess samples at different times (corresponding to Figure 14).
Table 5.
Maximum and minimum of loess samples at different times (corresponding to Figure 14).
| Time | t = 8.67 h | t = 9 h | t = 9.33 h |
|---|---|---|---|
| Max. (%) | 0.51 | 0.51 | 0.33 |
| Min. (%) | −1.6 | −1.66 | −1.9 |
Table 6.
Maximum and minimum of loess samples at different times (corresponding to Figure 16).
Table 6.
Maximum and minimum of loess samples at different times (corresponding to Figure 16).
| Time | t = 11 h | t = 13.33 h | t = 15 h | t = 21 h | t = 25.67 h |
|---|---|---|---|---|---|
| Max. (%) | 0.75 | 0.8 | 0.86 | 0.38 | 0.06 |
| Min. (%) | −1.58 | −2.14 | −2.58 | −2.7 | −2.92 |
Table 7.
Comparisons of the number of spacing cracks observed in the experiments and numerical simulations, respectively.
Table 7.
Comparisons of the number of spacing cracks observed in the experiments and numerical simulations, respectively.
| Number of Cracks | Experiments | Numerical Simulations |
|---|---|---|
| 1 cm × 1 cm × 30 cm | 14 | 11 |
| 2 cm × 2 cm × 30 cm | 5 | 5 |
| 3 cm × 3 cm × 30 cm | 4 | 4 |
| 4 cm × 4 cm × 30 cm | 3 | 3 |
| 5 cm × 5 cm × 30 cm | 2 | 2 |
Disclaimer/Publisher’s Note: The statements, opinions and data contained in all publications are solely those of the individual author(s) and contributor(s) and not of MDPI and/or the editor(s). MDPI and/or the editor(s) disclaim responsibility for any injury to people or property resulting from any ideas, methods, instructions or products referred to in the content. |
© 2023 by the authors. Licensee MDPI, Basel, Switzerland. This article is an open access article distributed under the terms and conditions of the Creative Commons Attribution (CC BY) license (https://creativecommons.org/licenses/by/4.0/).
Share and Cite
MDPI and ACS Style
Wei, X.; Zhou, Y.; Chen, X. An Experimental and Numerical Investigation of the Characteristics and Mechanism of Spacing Cracks in Loess Considering the Size Effect. Sustainability 2023, 15, 12482. https://doi.org/10.3390/su151612482
AMA Style
Wei X, Zhou Y, Chen X. An Experimental and Numerical Investigation of the Characteristics and Mechanism of Spacing Cracks in Loess Considering the Size Effect. Sustainability. 2023; 15(16):12482. https://doi.org/10.3390/su151612482
Chicago/Turabian StyleWei, Xin, Yunru Zhou, and Xuanyi Chen. 2023. "An Experimental and Numerical Investigation of the Characteristics and Mechanism of Spacing Cracks in Loess Considering the Size Effect" Sustainability 15, no. 16: 12482. https://doi.org/10.3390/su151612482
Note that from the first issue of 2016, this journal uses article numbers instead of page numbers. See further details here.