

Mechanical Properties of Fiber-Reinforced High-Volume Fly-Ash-Based Cement Composite—A Long-Term Study

Department of Civil Engineering, Manipal Institute of Technology, Manipal Academy of Higher Education, Manipal 576104, Karnataka, India
*
Author to whom correspondence should be addressed.
Sustainability 2023, 15(17), 13128; https://doi.org/10.3390/su151713128
Submission received: 3 August 2023
/
Revised: 19 August 2023
/
Accepted: 22 August 2023
/
Published: 31 August 2023
(This article belongs to the Special Issue Sustainability of Reinforced Concrete)
Abstract
:This article presents the long-term mechanical properties of a novel cement composite, no-aggregate concrete (NAC), containing 80% of low-calcium (class F) fly ash (F-FA) and 20% ordinary Portland cement (OPC) without aggregates. The study investigates the effect of adding polypropylene fibers (PPFs) in varying volume fractions to NAC by conducting compressive, splitting tensile, flexural, bond strength, and sorptivity tests, emphasizing the morphological features over a curing duration of up to three years. The results indicate that adding PPF has an insignificant effect on compressive strength. However, flexural, splitting tensile, and bond strength improve with an increasing volume fraction of PPF. The addition of PPF achieves a ductile failure which is desirable. The initial and final water absorption rate (sorptivity) reduces with the addition of PPF. Further, scanning electron microscopy (SEM) images reveal dense precipitation of C-S-H, while energy-dispersive X-ray spectroscopy (EDS) quantifies the hydration products. The ultrasonic pulse velocity (UPV) affirms the composite’s excellent quality.
1. Introduction
Sustainability in the construction industry is the progress that responds to the needs of society, economic development, the preservation of the environment, and efficient use of resources [1]. Apart from the economic benefit, the aggregates in concrete provide the desired dimensional stability, influence concrete strength and durability, and contain the heat of hydration. The building sector consumes a third of raw materials and 40% of energy resources and is responsible for a third of the world’s greenhouse gas (GHG) emissions [2]. Cement is the most used binder in concrete and mortar globally. Its manufacturing is not only a high-energy consuming process but is one of the significant CO2-emitting industries [3,4]. Such factors refute the construction industry’s sustainability and economic goals. CO2 emission being a factor in climate change, incorporating higher proportions of supplementary cementitious materials (SCMs) into concrete mixes will significantly help reduce the impact.
As the world’s second-largest market, India is estimated to produce more than 500 million tonnes of cement by 2050 [4]. While concrete production is estimated to increase by 20% in 2050, using locally sourced industrial byproducts to supplement the conventional binder and aggregate of concrete will positively impact the industry [5,6]. Coal-fired power plants in India fulfill much of the energy demand, producing 232.56 million metric tonnes of fly ash (FA) in 2020–2021. Approximately 92% is utilized for manufacturing cement, bricks, and tiles and land reclamation [7]. While various standards restrict the incorporation of FA in cement and concrete manufacturing to 35% [8,9], increasing it to 50% results in better utilization [8,10]. For instance, a 25% FA replacement of cement alone contributes to an about 300 kg/m3 reduction in CO2 exhaust, while a higher replacement level is more rewarding for the environment [11].
The sustainability of concrete is a crucial factor in green building concepts that work toward consuming less energy and natural resources by optimizing the design and construction processes [12]. Modern concretes must address sustainability issues by carefully selecting materials and employing a mix-proportioning approach backed up with research data. The design of high-volume FA (HVFA) concrete incorporating more than 50% of FA has been there for recent decades. Geopolymer concrete that uses little to no cement is still being researched [3,4,13]. Such approaches warrant the production of concrete that minimizes environmental damage. There have been significant attempts to use recycled aggregates in concrete production [14,15,16,17]. However, the effect of the complete elimination of aggregate fraction on the mechanical properties of the concrete is not yet studied.
Given the preceding context, this paper introduces a novel high-volume fly-ash-based cement composite, no-aggregate concrete (NAC), invented by Dr. N. Bhanumathidas and N. Kalidas at the Institute for Solid Waste Research and Ecological Balance (INSWAREB) labs [18]. The no-aggregate concrete utilizes 80% class F FA, 20% OPC, and zero natural aggregates. The F-FA serves a dual purpose of binder and filler.
1.1. Factors Affecting Mechanical Properties of Concrete
The strength of concrete depends on the concrete mix proportion, water to binder (w/b) ratio, curing condition, ingredients used, etc. Much research aims to optimize each parameter to extract the maximum performance.
A linear relationship exists between the degree of hydration, compressive strength, and the modulus of elasticity [19]. There is a correlation between compressive strength and the w/b ratio at an early curing period [20]. Immersion curing using tap water reduces the compressive strength of concrete samples due to the leaching of calcium hydroxide [21]. The pore diameter of less than 10 nm is insignificant in reducing the compressive strength, but the amount of pore water significantly improves the strength. Pore structures in concrete exert capillary forces that cause water absorption in concrete, critically affecting concrete durability [22,23,24]. Analytical methods help supplement the mechanical properties of hardened concrete [19]. The early-age compressive strength for FA blended mortar is a factor of packing effect, while at later ages, the strength gain is a factor of pozzolanic activity. The amorphous phases of F-FA react with CaOH2 to produce a secondary C-S-H gel densifying the matrix and developing its strength [25].
1.2. Effect of Pozzolans on Mechanical Properties of Concrete
The F-FA used in the present study has a pozzolanic activity index (PAI) > 1, indicating good reactivity. The median particle size of FA directly influences the strength activity index at 90 days of curing age [26]. Concrete with FA of up to 60%, tested at one year, shows less compressive strength than a mix without FA. However, there is an uptick in the compressive strength for mixes, irrespective of the amount of FA content. The UPV test results indicate a similar trend [27]. Blending FA with Portland cement paste increases the total and capillary porosity, resulting in a lower compressive strength. However, adding finer FA reduces total and capillary porosity, improving the compressive strength of the blended paste [28]. Though there is a significant improvement in the compressive strength of cement mortar blended with various SCMs, the replacement in high volumes increases porosity [29]. The concrete mix prepared from induction furnace slag results in inferior compressive and tensile strengths compared to those that contain natural aggregates. Adding silica fume (SF) and other SCMs may improve these shortcomings [30].
1.3. Effect of PPF on Mechanical Properties of Concrete and Composites
The presence of aggregates and fibers in concrete is self-contradicting in nature. The ‘inclusion’ of the former might initiate the cracks, and the latter helps mitigate its propagation. Adding fibrillated PPF to cementitious composites improves tensile strength and flexural capacity, while monofilament PPF improves the ductility of concrete samples [31]. Adding PPF reduces stress concentration at cracktips due to restraining and delaying crack propagation, thus enhancing concrete’s mechanical properties. Including PPF in various fractions also reduces water absorption due to pore refinement and limited pore connectivity [32]. Incorporating PPF in fractions >1% reduces compressive, flexural, and splitting tensile strengths compared to non-fiber-reinforced concrete. However, the hydration products near PPF increase the physical bond, improving the strength. SEM images reveal increased pores with higher PPF fractions [24].
Incorporating PPF enhances concrete’s flexural toughness and resistance to drying shrinkage and mitigates other crack-related defects [33,34,35,36]. But it may increase the voids in the concrete, negatively impacting the density, compressive strength, and ultrasonic pulse velocity (UPV) compared to concrete without PPF [37,38,39]. In contrast, the hybrid combination of steel and PPF improves the tensile properties due to bridging the diametrical cracks. However, the researchers point out the inability of non-metallic fibers to sustain large cracks [40,41]. Adding PPF controls shrinkage stresses without participating in the hydration reaction. However, an amount of PPF > 0.7 kg/m3 decreases the splitting tensile and flexural strength [33,38,42].
The influence of PPF on compressive strength is favorable only up to 0.20%. However, the indirect tensile and flexural strength increases even for 0.50% PPF [43]. The inclusion of 1.5% PPF results in attaining maximum compressive and tensile strengths. However, the elastic modulus of concrete suffers due to the addition of PPF [44,45]. The influence of fibers on the mechanical properties of concrete decreases with the increase in matrix strength. The poor fiber–matrix interface and numerous voids influence the ineffectiveness of PPF in improving compressive strength [35,37,38,39,42,43,46,47]. However, contradictions exist, primarily where ultrafine pozzolans are used [26,28,48].
The tensile and ultimate tensile strains for an engineered cementitious composite (ECC) are higher with the inclusion of PPF than with polyvinyl alcohol (PVA) fibers. The compressive strength and elastic moduli reduce [49]. In a cement–glass composite, the addition of PPF is more significant in improving the splitting tensile strength than the flexural strength [50]. The permeability and sorptivity test results follow a similar trend, although the values are inferior to the concrete without PPF. Adding 0.5% basalt fiber gives lower flexural strength than 0.3%, possibly due to inefficient distribution, while the total volume of pores and porosity is higher for concrete with fibers [41]. The lower density and the ability of PPF to restrict the formation and development of cracks prove its preference over steel fibers as internal reinforcement in lightweight concrete (LWC) [33,46]. The bond between the surface of the reinforcement and the rest of the matrix depends on PPF content, the strength of the concrete, and FA content [51,52,53]. The extensive literature review reveals a lack of substantial research on using very high volumes of F-FA and its influence on the mechanical properties of cementitious composites. The use of higher volume fractions of PPF in fiber-reinforced cementitious composites is also limited. This article aims to assess the synergetic effect of incorporating a higher volume of F-FA and PPF on mechanical properties over the long term.
2. Research Significance
The literature review reveals extensive research on the influence of PPF on high-volume fly-ash concretes of various proportions. Using natural aggregates as ‘fillers’ is persistent in most of the research. Though there is a sizeable effort to replace natural aggregates with artificial ones by various researchers, total elimination is absent. The long-term effect of adding PPF (>0.5%) and F-FA (>60%) in a cement composite on mechanical properties is unexplored. This study investigates the long-term mechanical properties and water absorption of a novel high-volume fly-ash-based cementitious composite, ‘NAC’, with 80% F-FA, 20% OPC, zero aggregates, and PPF in three volume fractions.
3. Materials and Methods
3.1. Material Characteristics and Mix Proportioning
This study uses F-FA from a specific electrostatic precipitator field of a thermal power plant, 43-grade OPC, superplasticizer, PPF 12 mm length, and 40 µm diameter, shown in Figure 1. The specific gravity is 0.92 g/cc. Table 1 and Table 2 present the physical characteristics of OPC and the chemical characteristics of F-FA. Figure 2 illustrates OPC and F-FA’s laser particle size distribution (PSD). The specific surface area of the OPC is 806.6 m2/kg, while for the F-FA, it is 724.5 m2/kg. The reactivity of F-FA is a factor of bulk element oxides, crystalline or amorphous phases, particle size and dosage, w/b ratio, and curing temperature [8]. Most of the factors mentioned are well considered at various stages of this study. Four mixes, viz., PPF0, PPF0.6, PPF0.8, and PPF1.0, were prepared from the proportions mentioned in Table 3.
The study has four mixes: three test groups (with PPF) and a control group (without PPF). The materials are proportioned and mixed in a unique mixer to get the desired consistent mix. The PPF is added at this stage to ensure efficient fiber distribution [6]. Figure 3 shows test specimens cured in the tank after demolding, and Figure 4 demonstrates the research plan adopted for the study. Table 4 details the sample details and tests conforming to BIS and ASTM standards.
3.2. Testing Parameters
3.2.1. Compression Test
A total of 112 cubes of 100 mm are cast, divided into two groups subjected to immersion and moist curing for up to three years to assess the progression in compressive strength. One group is covered with wet gunny bags to maintain the humidity. The rationale for adopting this curing method is to avoid possible leaching of lime from the concrete when immersed. The rest of the test specimens are immersion-cured. The compression test of specimens of each group is assessed at 7, 28, 90, 180, 270, 365, and 1095 days as per IS: 516 [61]. On removal from the curing, the specimens are cleaned to remove any excess water or loose material, placed on the compression testing machine (CTM), and loaded to the opposite side of the as-cast specimen without shock at a constant rate of 140 kg/cm2/min.
3.2.2. Ultrasonic Pulse Velocity Test
The test involves appraising the quality of the concrete mix by emitting and measuring an ultrasonic pulse wave via electroacoustic transducers. The higher the velocities, the better the quality of concrete. The factors influencing concrete’s homogeneity, density, and uniformity impact the pulse velocity (V) given by
where V = pulse velocity (km/s), L = distance between the transducers (m), and T = transit time (µs). The average of the three cubes’ UPV value is recorded at 28 and 365 days of curing age [39]. Figure 2 shows a sample being UPV-tested.
3.2.3. Flexural Strength Test
Beams of size 500 × 100 × 100 mm are cast to evaluate the flexural strength of the specimens. Three samples are taken on the testing day, wiped clean, and placed on the flexural testing machine. Four-point setup applies the load on the rollers placed at a third of the 400 mm span without shock at a rate of 7 kg/cm2/min until failure. The modulus of rupture of specimens is assessed at 28, 90, 180, 270, and 365 days [61].
3.2.4. Splitting Tensile Strength Test
Three 150 mm diameter and 300 mm height cylinders are cast for each test duration per batch. On the day of testing, the samples are removed from the curing tank, wiped to remove excess water, and placed on the CTM along with the standard splitting apparatus. The load is applied at a constant rate of 1.2–2.4 N/mm2/min until failure, and the splitting tensile strength is computed for all the samples at 28, 90, 180, and 365 days [63].
3.2.5. Bond Strength (Pull-Out) Test
The bond between the surface of the reinforcement and the rest of the matrix depends on PPF, the strength of the concrete, and FA content [52,53,54]. A set of three 150 mm cubes centered with a 16 mm diameter ribbed steel rod embedded up to a depth of 20 mm from the bottom of the specimen are cast for each batch. On the day of testing, the specimens are removed from the curing tank and wiped to clean off any excess water, and the surface of the specimen is finished to make it even. The specimen is placed suitably on the universal testing machine, which applies a pull-out load on the steel bar. The ultimate bond strength is determined for all the samples at 28, 90, 180, and 365 by applying the maximum tensile force to the reinforcement during the test [64].
3.2.6. Sorptivity
An increase in the mass of the specimen resulting from water absorption as a function of time determines the sorptivity of concrete. This test measures the susceptibility of unsaturated concrete to water penetration by the capillary. Three 100 mm diameter and 50 mm length disc samples per mix are cut from cast cylindrical molds of 100 mm dia. The sample preparation, curing, conditioning, and testing are as per ASTM C1585 [65]. Table 4 summarizes the tests, codes, and specimen details used for the present study. Figure 5 shows various test setups for testing the mechanical parameters of the composite.
3.2.7. Morphology
Scanning electron microscopy (SEM) uses a focused beam of electrons to scan the surface of samples to assess the surface characteristics. It gathers information about concrete microstructure, disclosing useful qualitative information on spatial variations in hydration products and chemical analysis. SEM, combined with a chemical microanalysis technique called energy-dispersive X-ray spectroscopy (EDS), measures the X-rays radiated from the sample during electron beam irradiation to describe the elemental analysis of the examined volume.
4. Results and Discussion
4.1. Compressive Strength
Figure 6 and Figure 7 illustrate the compressive strength of all concrete mixes tested over 7 to 1065 days of moist and immersion curing. Generally, moist-cured specimens develop superior compressive strength than immersion-cured specimens. The leaching of portlandite from fly-ash-rich concrete mixes may cause a difference in strength [41]. The compressive strength gain is attributed to the low w/b ratio, pore refinement, higher surface area of the crystal sizes of hydration products [65], and formation of secondary hydration products.
Interestingly, although continuous, the strength gained for samples in both curing conditions is not linear. The compressive strength gain beyond 28 days predominantly results from the pozzolanic reaction, along with the high reactivity of the F-FA. The immersion-cured PPF0 mixes gain approximately 3%, 14%, 28%, 39%, and 64% over 1065 days of curing. In contrast, moist-cured PPF0 samples gain 25%, 30%, 30%, 70%, and 86%.
There is an insignificant influence of PPF on compressive strength at all curing ages which may be due to increased porosity with fiber content [20,21,42]. However, the immersion-cured specimens at 365 and 1065 days tend otherwise. A slight reduction in the compressive strength for samples with PPF occurs compared to equivalent PPF0 samples at later ages. For instance, the compressive strength for immersion-cured samples reduces by 5.3% (PPF0.6 at 90 days) and 13% (PPF1.0 at 180 days), whereas for moist-cured samples, the reduction in compressive strength is 15.27% (PPF0.8 at 56 days), 13.9% (PPF1.0 at 90 days), 14% (PPF1.0 at 180 days), 12.3% (PPF1.0 at 365 days), and 5.9% (PPF1.0 at 1095 days).
The comparison finds moist curing to be the preferred method for high-volume fly-ash-based cement composites. The composite contains 100% paste volume, contributing to pore refinement and achieving a higher compressive strength on prolonged curing. Eventually, the compressive strength of the moist-cured PPF0, PPF0.6, PPF0.8, and PPF1.0 specimens ameliorated by 86.56%, 76.25%, 78.83%, and 75.44% at three years of curing, respectively, whereas the corresponding immersion-cured specimens are better by 64.26%, 92.08%, 78%, and 76.12%.
The weight gain (%) at each curing age reveals perhaps an indirect picture of the possible rate of hydration. Figure 8a shows the post-immersion-curing weight gain trend for all mixes, which attains quiescency at 180 days and continues to rise afterward. A close sequence exists between the compressive strength progression and the samples’ weight gain.
4.2. UPV Test
Figure 8b illustrates the UPV test values for all specimens for the initial and long term. The pulse velocity decreases with the inclusion of PPF, which is also the outcome in [66]. The influence of PPF on the pulse velocity for concrete with aggregates and the composite follows a similar trend. However, the quality of all the composites at 28 days of age is ‘good’; after three years, it improves to ‘excellent’ according to [62], which reasons the excellent strength gain at three years of age.
4.3. Flexural Strength Test
Figure 9 demonstrates the flexural strength for control and test mixes for all curing ages. The flexural strength of PPF0 samples improves consistently with the curing mainly due to an improved transition zone attributed to the pozzolanic reaction of the F-FA [3]. The flexural strength of PPF0 improves approximately by 10%, 33%, 39%, 80%, and 92% during the curing period from 56 to 365 days.
The addition of PPF demonstrates the crack-bridging mechanism confirming the direct correlation between flexural strength and the addition of PP fibers [67]. The PPF0.6 mix exhibits superior flexural strength, approximately by 58%, 38%, 31%, 21%, (−3%), and 6% between 28 and 365 days of age, implying that the flexural strength improvement is inverse to the volume of PPF, which various researchers also acclaim. The higher volume fraction of PPF in the PPF0.8 and PPF1.0 mixes may have a weaker interface causing a lower flexural strength than PPF0.6, making it an optimum mix.
However, at later curing ages, the addition of PPF, irrespective of the volume fraction, ceases to influence flexural strength as the improvement in the quality of the matrix may supersede the incremental improvement in the strength caused by adding PPF. Adding PP fibers thus improves the plain composite’s flexural strength; however, PPF0.6 results in the best outcome.
4.4. Splitting Tensile Strength Test
The splitting tensile strength is generally lower than the flexural strength, which is no different for the composite under study. Figure 10 shows the splitting tensile strength for all mixes at all curing ages. The tensile strength of the PPF0 mix improves for up to 180 days of curing age and then drops, which is uncharacteristic of the mix. The impact of PPF is more pronounced in improving the tensile stress than the modulus of rupture of the plain composite [3].
Adding 1% PPF (PPF1.0) improves the splitting tensile strength by approximately 169%, 70%, 76%, 43%, and 93% for 28, 56, 90, 180, and 365 days. Unlike flexural strength, the improvement in tensile strength is a function of the volume fraction of PPF. The splitting tensile strength of the PPF0.6, PPF0.8, and PPF1.0 mixes is superior to PPF0. While mix PPF0.6 shows the peak tensile strength at 180 days, the PPF0.8 and PPF1.0 mixes show no such peaks.
4.5. Bond Strength
Figure 11 illustrates the pull-out test results to determine the bond strength of all concrete mixes [62]. The PPF0 mix offers the least resistance to pull-out compared to all mixes with PPF. However, there is an increase in bond strength beyond 28 days, approximately 137%, 85%, and 212% for 90, 180, and 365 days, respectively. The improvement in the strength is due to the finer gel within a higher specific surface, the improvement of microstructure due to secondary C-S-H, and pore refinement.
Adding PPF improves the bond strength, which is proportional to the increase in the volume fraction. The PPF1.0 mix exhibits the best results overall for all curing ages barring 180 days of curing age which may be a bias in the experiment. The bond strength of the PPF1.0 samples is higher by approximately 342%, 114%, and 132% for 28, 90, and 365 days. At 180 days of curing age, however, the results at 180 days do not fit the trend which may be due to experimental errors. The improvement in the bond strength with an increase in the PPF volume may be due to the improvement in the fiber–matrix interface. The highly reactive F-FA present in the matrix enhances the later-age pozzolanic reaction resulting in pore refinement.
4.6. Sorptivity
The sorptivity test measures the effect of PPF on the tendency of the composite to absorb and transmit water by capillary action. Figure 12 presents the water absorption (mm) for all mixes throughout the test duration. The incorporation of PPF has a direct influence on controlling absorption. The initial absorption (mm) reduces by approximately 30% and 38% with the addition of 0.8 and 1% PPF. However, the PPF0.6 mix shows a slight uptick (6%) in absorption, which may not be significant. The final absorption (mm) decreases by 6.8%, 41%, and 49% for the corresponding increase in the PPF volume.
The slope of the best-fit line of absorption vs. √time for test points from 1 min to 6 h and 1 day to 7 days determines the initial and secondary water absorption rate (sorptivity). Table 5 shows the initial and secondary sorptivity values. The addition of PPF decreases both the initial and secondary sorptivity of the PPF0 mix by 28% and 45% for PPF0.8 and PPF1.0 and 17%, 53%, and 56% for the PPF0.6, PPF0.8, and PPF1.0 mixes compared to the PPF0 mix.
4.7. Failure Patterns
4.7.1. Compressive Strength Test
The control mix (PPF0) specimens exhibit a brittle failure followed by the complete disintegration of the specimens under compressive stresses. Though this failure pattern is typical of high-strength concretes, the crack propagates rapidly due to the high paste volume, resulting in a sudden failure of the PPF0 specimens. The addition of PPF prevents such sudden failures by presenting a ductile failure, retaining the form of the specimen by providing excellent spalling resistance (Figure 13). Such an improved failure pattern with insignificant loss in compressive strength is highly desirable.
4.7.2. Flexural Strength Test
Adding PPF in various volume fractions significantly improves failure patterns under bending stresses as well; the comparison is shown in Figure 14a,b. The cracks on the PPF specimens are visually more vertical than on the PPF0 specimens, which are inclined. The PPF0 mix specimens fail suddenly as the tensile cracks rapidly propagate and reach the top of the inherent brittle PPF0 specimens. In contrast, the fibers act as a ‘bridge’ to the cracks, preventing them from connecting further and reaching the top suddenly, retaining the specimen integrity post-failure. The PPF0 specimens fail suddenly due to rapid crack propagation, while despite the failure, the cracks do not propagate to the top in all specimens with PPF mixes.
4.7.3. Splitting Tensile Strength Test
The failure pattern of the specimens with the PPF0 mix improves considerably under tensile stresses. The addition of PP fibers, irrespective of the volume fraction, successfully bridges the tensile crack propagation and prevents sudden failure, as Figure 15a illustrates. The post-crack load-carrying capacity of the samples improves significantly, and the catastrophic splitting of the specimen due to tensile stresses is absent. The addition of PP fibers hence significantly improves the tensile strength and failure pattern of the plain composite (Figure 15b).
4.7.4. Bond Strength (Pull-Out) Test
Prolonged hydration improves the microstructure and the interface between the fibers and the rest of the matrix, which may improve surface friction and performance. Improved resistance to crack propagation due to the fiber ‘stitching’ effect delays the propagation of macro-cracks and improves failure behavior by preventing sudden failures, as shown in Figure 16.
4.8. Microstructure Analysis of the Sample
Figure 17 shows SEM images of the PPF0 mix taken at 28 days, 90 days, one year, and three years. A large amount of unreacted FA (bright spheres) with partially reacted FA particles is evident, with precipitation of C-S-H around it at 28 days (a), revealing a dense matrix with fewer voids and no micro-cracks. However, zones show an interface between FA and the matrix. At 90 days (b), there is more precipitation of C-S-H compared to 28 days. The image also reveals a continuous and homogeneous matrix with most of the FA–matrix interface filled by the C-S-H. The microstructure also reveals the continuation of hydration by consuming more FA, thus leaving fewer unreacted FA particles. The improvement in hydration correlates with the improvement in the mechanical properties beyond 28 days.
At a prolonged curing duration of 1 year and beyond (c and d), the microstructure of the mix shows further improvement with the deposition of C-S-H all over the surface (dark—denser beneath; light—porous on the surface) (c). The aluminate phases of the FA start reacting to form C-A-S-H, the structure of which is different from C-S-H in the form of ‘fibril,’ resembling a honeycomb (d). The hydration continues after one year of curing, consistently improving the microstructure, which credits the unabated gain in compressive strength.
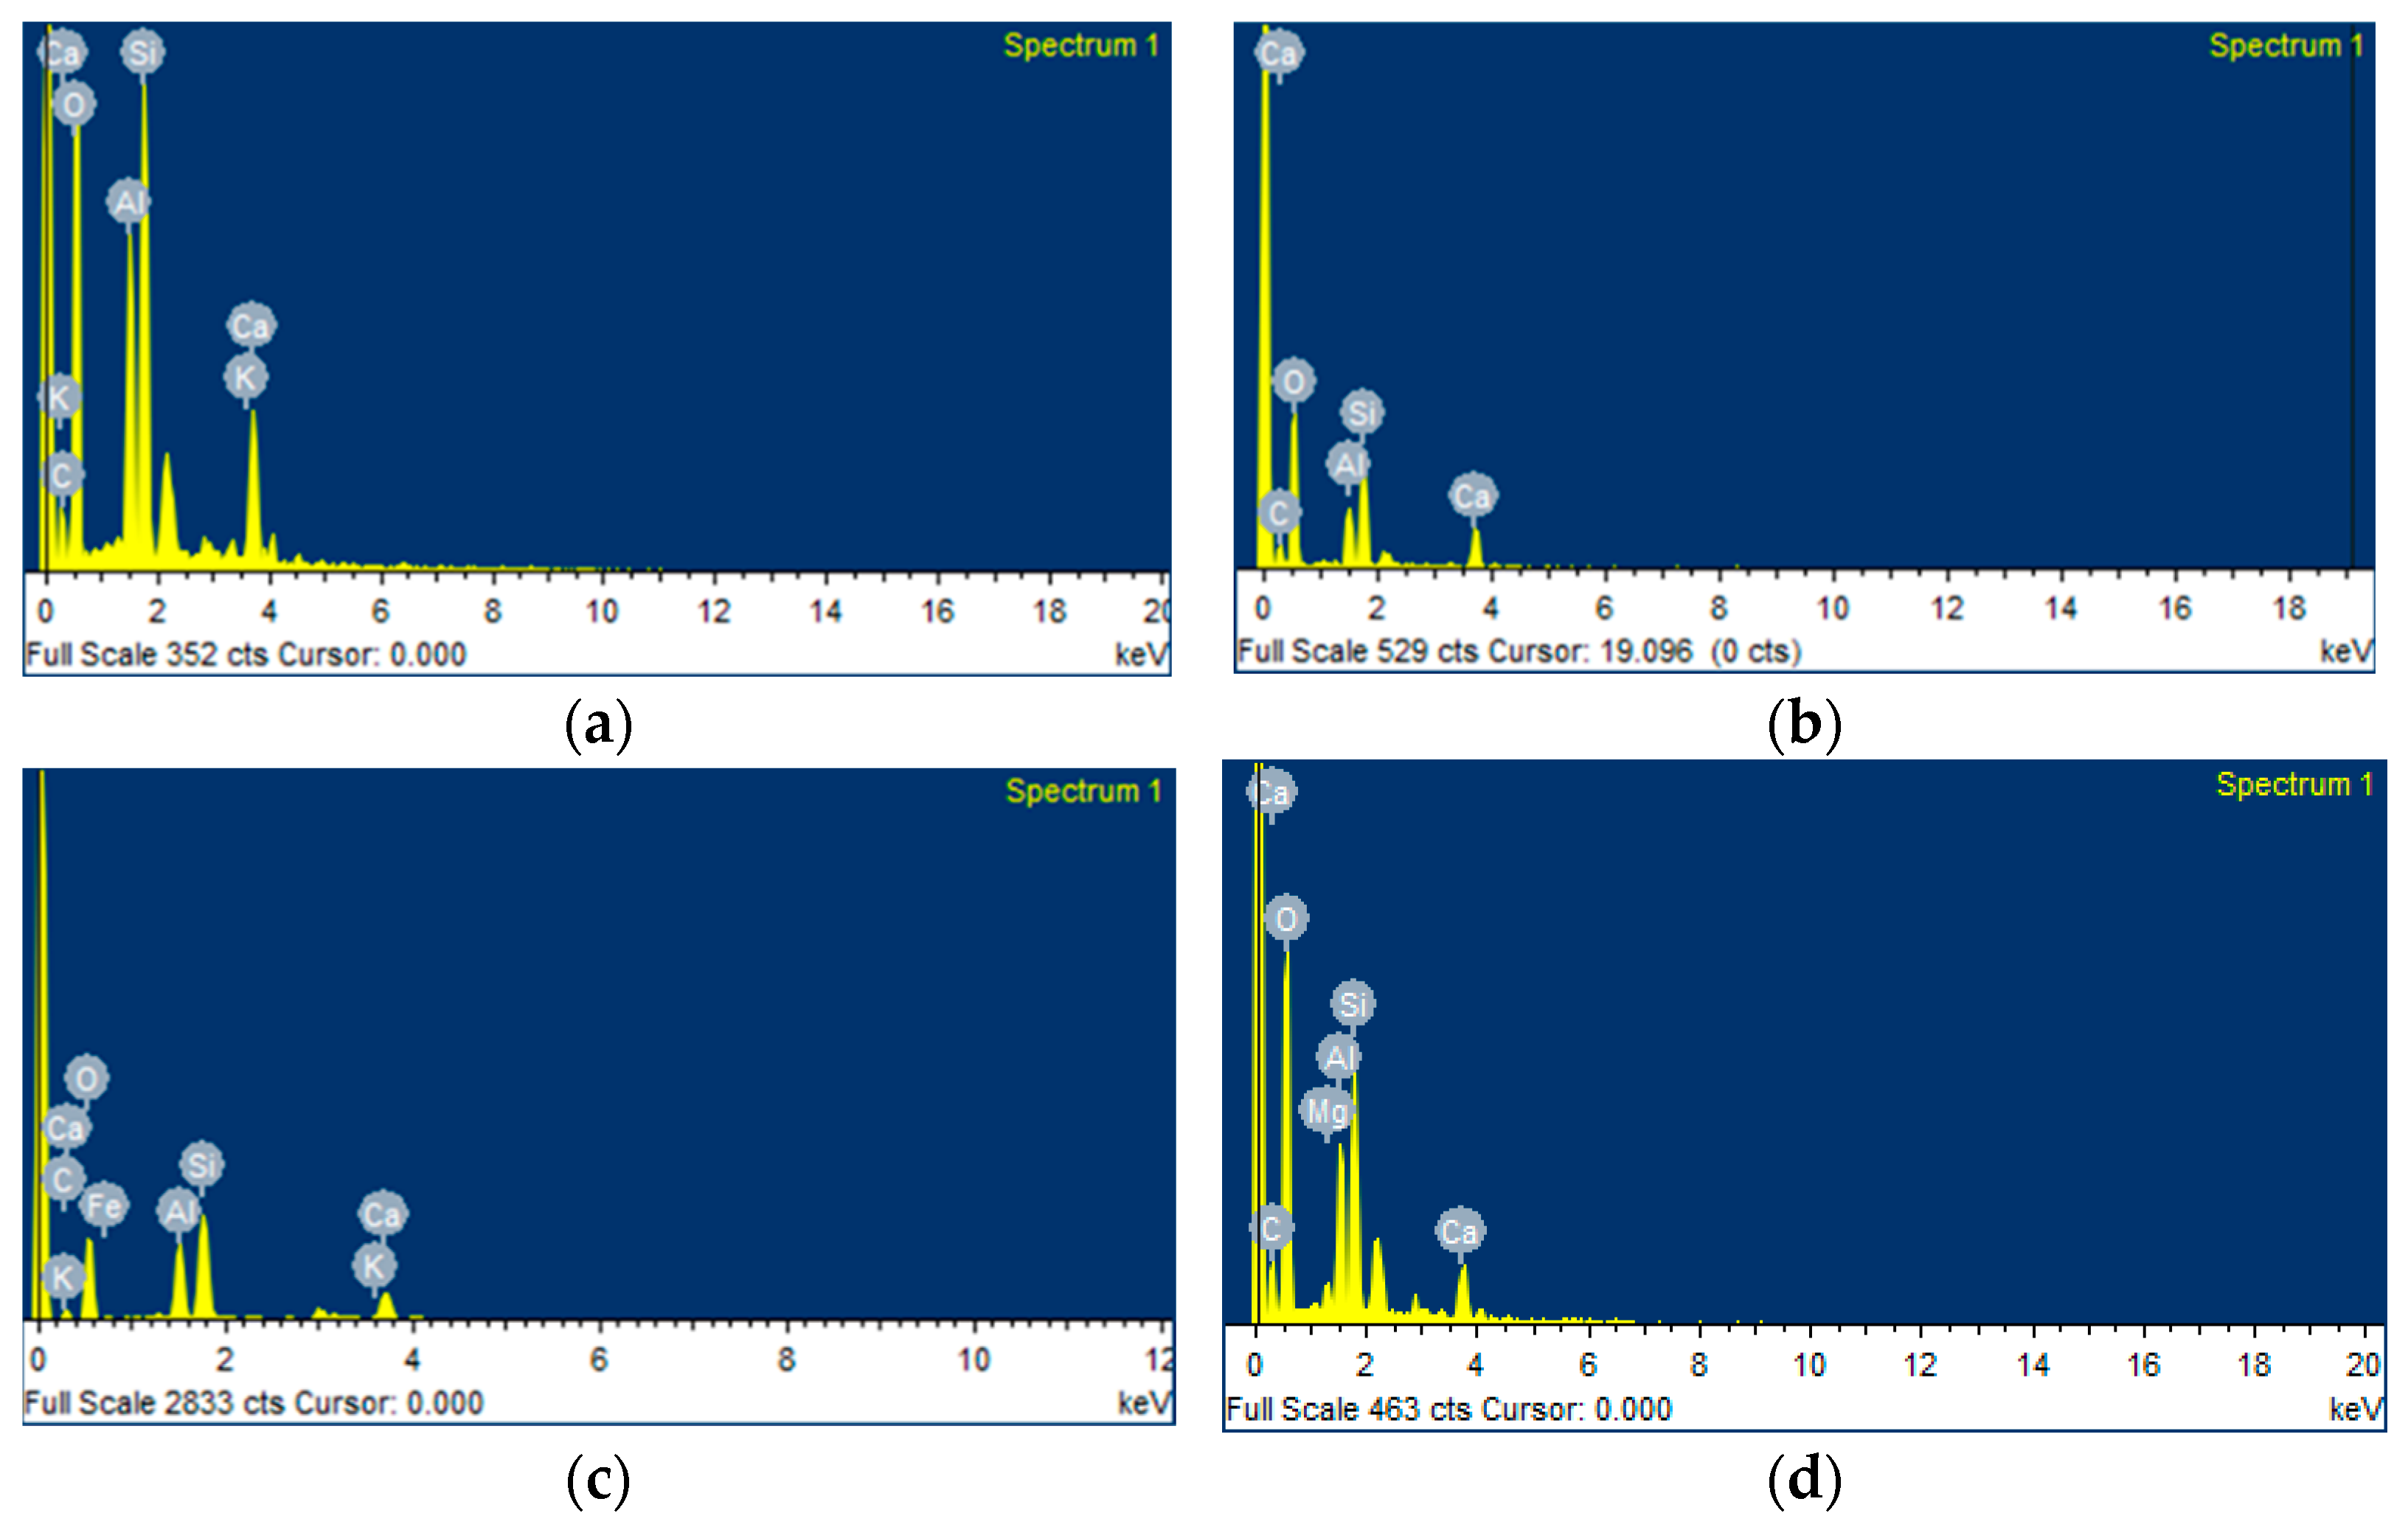
The EDS spectrums shown in Figure 18 for the PPF0 mix identify calcium (Ca), silica (Si), and alumina (Al) as chief elements that aid the progression of C-S-H and C-A-S-H gel formation as supplemented by SEM images in Figure 17. Table 6 presents Ca/Si and Ca/(Si + Al) ratios based on the atomic weight of the elements. At 28 days, the C-S-H gel has a Ca/Si ratio of 0.611 and a Ca/(Si + Al) ratio of 0.387. However, further curing of the samples decreases the ratios to 0.453 and 0.276, 0.368 and 0.226, and 0.341 and 0.223 for 90 days, one year, and three years, respectively. The decreasing Ca/Si ratio trend indicates continuous hydration [29].
5. Conclusions
This study assesses the influence of PPF in 0.6%, 0.8%, and 1.0% volume fractions on the long-term mechanical properties of plain composites by subjecting the samples to compression, splitting, flexural, and bond strength tests for up to three years. The sorptivity test examines water absorption. The microstructure of the composites reveals surface characteristics and hydration products. Based on the experimental investigation, the study concludes the following:
- The addition of PPF, irrespective of volume fraction, does not improve compressive strength. The gain in compressive strength is ceaseless for both immersion and moist-cured samples. The persistent increase in weight, hydration, and resulting microstructure refinement are credited for this strength gain. The UPV test affirms the quality of all the mixes.
- The mixes with PPF display remarkable improvement in the tensile strength to compressive strength due to the ‘bridging’ of the crack and delay in propagation, improving the tensile capacity. The increase in the tensile strength corresponds to an increase in the volume fraction of PPF. However, the composite’s flexural strength trend differs from the splitting tensile strength. The PPF0.6 mix achieves the highest flexural strength compared to the other PPF mixes.
- The PPF0 mix fails catastrophically due to the ‘brittle’ nature of the high-paste-containing composite. Adding PPF, irrespective of the volume fractions, is significant in achieving a more ductile failure under compression stresses. The PPF also significantly improves the resistance to spalling of the composite.
- The improvement in the bond strength of the plain composite is ascribed to the continuous hydration by forming C-S-H, refining the microstructure, and increasing the adhesion between the reinforcement and the paste. Adding PPF to the mix improves the bond strength of the composite.
- The water absorption of the composite varies inversely with the addition of PPF. The composite’s initial and secondary water absorption rate (sorptivity) significantly reduces with the increase in the volume fraction of PPF, demonstrating the excellent durability of the composite.
- The microstructure of PPF0 continuously refines with age. The presence of F-FA in large amounts in the composite not only contributes to the hydration but also acts as a filler refining the pore to evince the purpose of the composite mixture.
All mechanical properties and failure patterns of the high-volume fly-ash-based cement composite improve significantly with the addition of PPF for all curing ages. The synergetic effect of PPF and F-FA showed promising outcomes for the composite in the long-term experimental investigation to allude to the promises of the composite’s usability.
Author Contributions
Conceptualization, L.P.K., G.N. and K.K.S.; methodology, L.P.K.; investigation, L.P.K. and H.K.S.; resources, H.K.S.; data curation, L.P.K.; writing—original draft preparation, L.P.K.; writing—review and editing, H.K.S., G.N. and K.K.S.; visualization, L.P.K.; supervision, G.N. and K.K.S.; project administration, G.N. All authors have read and agreed to the published version of the manuscript.
Funding
This research received no external funding, and the APC was funded by the Manipal Academy of Higher Education, Manipal 576104, Karnataka, India.
Institutional Review Board Statement
Not applicable.
Informed Consent Statement
Not applicable.
Data Availability Statement
Not applicable.
Acknowledgments
The authors credit the inventors, Bhanumathidas and N. Kalidas, INSWAREB, Vishakhapatnam, Andhra Pradesh, India, for allowing our team to work on no-aggregate concrete and offering technical and technological support at various stages of the study. They hold the IP rights to no-aggregate concrete. We also acknowledge Prasanna Shenoy, M. Tech (Structural Engineering), and Sanket S. Shixankar, B. Tech (Civil Engineering), for offering support during the experimental works.
Conflicts of Interest
The authors declare no conflict of interest.
References
- Sobolev, K. Sustainable Development of the Cement Industry and Blended Cements to Meet Ecological Challenges. Sci. World J. 2003, 3, 308–318. [Google Scholar] [CrossRef] [PubMed]
- Tirth, V. Greenhouse Gas Emissions Due to the Construction of Residential Buildings in Moradabad, India. Appl. Ecol. Environ. Res. 2019, 17, 12111–12126. [Google Scholar] [CrossRef]
- Sharp, J.H. Surely We Know All about Cement—Don’t We? Adv. Appl. Ceram. 2006, 105, 162–174. [Google Scholar] [CrossRef]
- Ganesh, A.C.; Muthukannan, M. Development of High Performance Sustainable Optimized Fiber Reinforced Geopolymer Concrete and Prediction of Compressive Strength. J. Clean. Prod. 2021, 282, 124543. [Google Scholar] [CrossRef]
- Liu, Z.; Takasu, K.; Koyamada, H.; Suyama, H. A Study on Engineering Properties and Environmental Impact of Sustainable Concrete with Fly Ash or GGBS. Constr. Build. Mater. 2022, 316, 125776. [Google Scholar] [CrossRef]
- Laxman Kudva, P.; Nayak, G.; Shetty, K.K.; Sugandhini, H.K. A Sustainable Approach to Designing High Volume Fly Ash Concretes. Mater. Today Proc. 2022, 65, 1138–1145. [Google Scholar] [CrossRef]
- CEA Ministry of Power Government of India. CEA Annual Report 2021-22. 2022. Available online: https://cea.nic.in/wp-content/uploads/annual_reports/2022/AR_2021_22_dated_03.11.2022.pdf (accessed on 28 November 2022).
- Hemalatha, T.; Ramaswamy, A. A Review on Fly Ash Characteristics—Towards Promoting High Volume Utilization in Developing Sustainable Concrete. J. Clean. Prod. 2017, 147, 546–559. [Google Scholar] [CrossRef]
- Na, L. ACI 318M-11 Building Code Requirements for Structural Concrete (ACI 318M-11) and Commentary; ACI: Farmington Hills, MI, USA, 2011. [Google Scholar]
- Karimi Pour, A.; Mohajeri, Z.; Noroozinejad Farsangi, E. Impact of Polypropylene Fibers on the Mechanical and Durability Characteristics of Rubber Tire Fine Aggregate Concrete. Materials 2022, 15, 8043. [Google Scholar] [CrossRef]
- Yoo, S.-W.; Ryu, G.-S.; Choo, J.F. Evaluation of the Effects of High-Volume Fly Ash on the Flexural Behavior of Reinforced Concrete Beams. Constr. Build. Mater. 2015, 93, 1132–1144. [Google Scholar] [CrossRef]
- Weerasinghe, A.S.; Ramachandra, T.; Rotimi, J.O.B. Comparative Life-Cycle Cost (LCC) Study of Green and Traditional Industrial Buildings in Sri Lanka. Energy Build. 2021, 234, 110732. [Google Scholar] [CrossRef]
- Hasan, N.M.; Sobuz, M.H.; Khan, M.M.; Mim, N.J.; Meraz, M.M.; Datta, S.D.; Rana, M.J.; Saha, A.; Akid, A.S.; Mehedi, M.T.; et al. Integration of Rice Husk Ash as Supplementary Cementitious Material in the Production of Sustainable High-Strength Concrete. Materials 2022, 15, 8171. [Google Scholar] [CrossRef] [PubMed]
- Sobuz, M.H.R.; Datta, S.D.; Akid, A.S.M. Investigating the Combined Effect of Aggregate Size and Sulphate Attack on Producing Sustainable Recycled Aggregate Concrete. Aust. J. Civ. Eng. 2022, 1–16. [Google Scholar] [CrossRef]
- Sobuz, M.H.R.; Datta, S.D.; Rahman, M. Evaluating the Properties of Demolished Aggregate Concrete with Non-Destructive Assessment. In Advances in Civil Engineering; Arthur, S., Saitoh, M., Pal, S.K., Eds.; Lecture Notes in Civil, Engineering; Springer: Singapore, 2022; Volume 184, pp. 223–233. ISBN 9789811655463. [Google Scholar]
- Sobuz, M.H.R.; Datta, S.D.; Akid, A.S.M.; Tam, V.W.Y.; Islam, S.; Rana, M.J.; Aslani, F.; Yalçınkaya, Ç.; Sutan, N.M. Evaluating the Effects of Recycled Concrete Aggregate Size and Concentration on Properties of High-Strength Sustainable Concrete. J. King Saud Univ. Eng. Sci. 2022, in press. [Google Scholar] [CrossRef]
- Siddique, R.; Aggarwal, P.; Aggarwal, Y. Influence of Water/Powder Ratio on Strength Properties of Self-Compacting Concrete Containing Coal Fly Ash and Bottom Ash. Constr. Build. Mater. 2012, 29, 73–81. [Google Scholar] [CrossRef]
- Irrational Concrete with Rational Performance. Available online: https://fal-g.com/wp-content/uploads/2022/05/Press-Note-on-Concrete-without-C.Ag-180110.pdf (accessed on 28 November 2022).
- Prem, P.R.; Bharatkumar, B.H.; Iyer, N.R. Influence of Curing Regimes on Compressive Strength of Ultra High Performance Concrete. Sadhana 2013, 38, 1421–1431. [Google Scholar] [CrossRef]
- Verma, N.; Misra, A.K. Bond Characteristics of Reinforced TMT Bars in Self Compacting Concrete and Normal Cement Concrete. Alex. Eng. J. 2015, 54, 1155–1159. [Google Scholar] [CrossRef]
- Bediako, M.; Kevern, J.T.; Amankwah, E.O. Effect of Curing Environment on the Strength Properties of Cement and Cement Extenders. Mater. Sci. Appl. 2015, 06, 33–39. [Google Scholar] [CrossRef]
- Röβler, M.; Odler, I. Investigations on the Relationship between Porosity, Structure and Strength of Hydrated Portland Cement Pastes I. Effect of Porosity. Cem. Concr. Res. 1985, 15, 320–330. [Google Scholar] [CrossRef]
- Odler, I.; Rößler, M. Investigations on the Relationship between Porosity, Structure and Strength of Hydrated Portland Cement Pastes. II. Effect of Pore Structure and of Degree of Hydration. Cem. Concr. Res. 1985, 15, 401–410. [Google Scholar] [CrossRef]
- Yuan, Z.; Jia, Y. Mechanical Properties and Microstructure of Glass Fiber and Polypropylene Fiber Reinforced Concrete: An Experimental Study. Constr. Build. Mater. 2021, 266, 121048. [Google Scholar] [CrossRef]
- Liu, B.; Xie, Y.; Zhou, S.; Yuan, Q. Influence of Ultrafine Fly Ash Composite on the Fluidity and Compressive Strength of Concrete. Cem. Concr. Res. 2000, 30, 1489–1493. [Google Scholar] [CrossRef]
- Tangpagasit, J.; Cheerarot, R.; Jaturapitakkul, C.; Kiattikomol, K. Packing Effect and Pozzolanic Reaction of Fly Ash in Mortar. Cem. Concr. Res. 2005, 35, 1145–1151. [Google Scholar] [CrossRef]
- Kumar, M.; Sinha, A.K.; Kujur, J. Mechanical and Durability Studies on High-Volume Fly-Ash Concrete. Struct. Concr. 2021, 22, E1036–E1049. [Google Scholar] [CrossRef]
- Chindaprasirt, P.; Jaturapitakkul, C.; Sinsiri, T. Effect of Fly Ash Fineness on Compressive Strength and Pore Size of Blended Cement Paste. Cem. Concr. Compos. 2005, 27, 425–428. [Google Scholar] [CrossRef]
- Chindaprasirt, P.; Rukzon, S. Strength, Porosity and Corrosion Resistance of Ternary Blend Portland Cement, Rice Husk Ash and Fly Ash Mortar. Constr. Build. Mater. 2008, 22, 1601–1606. [Google Scholar] [CrossRef]
- Chandru, P.; Karthikeyan, J.; Sahu, A.K.; Sharma, K.; Natarajan, C. Performance Evaluation between Ternary Blended SCC Mixes Containing Induction Furnace Slag and Crushed Stone as Coarse Aggregate. Constr. Build. Mater. 2021, 267, 120953. [Google Scholar] [CrossRef]
- Deb, S.; Mitra, N.; Majumder, S.B.; Maitra, S. Improvement in Tensile and Flexural Ductility with the Addition of Different Types of Polypropylene Fibers in Cementitious Composites. Constr. Build. Mater. 2018, 180, 405–411. [Google Scholar] [CrossRef]
- Afroughsabet, V.; Ozbakkaloglu, T. Mechanical and Durability Properties of High-Strength Concrete Containing Steel and Polypropylene Fibers. Constr. Build. Mater. 2015, 94, 73–82. [Google Scholar] [CrossRef]
- Leong, G.W.; Mo, K.H.; Loh, Z.P.; Ibrahim, Z. Mechanical Properties and Drying Shrinkage of Lightweight Cementitious Composite Incorporating Perlite Microspheres and Polypropylene Fibers. Constr. Build. Mater. 2020, 246, 118410. [Google Scholar] [CrossRef]
- Pakravan, H.R.; Ozbakkaloglu, T. Synthetic Fibers for Cementitious Composites: A Critical and in-Depth Review of Recent Advances. Constr. Build. Mater. 2019, 207, 491–518. [Google Scholar] [CrossRef]
- Fu, Q.; Xu, W.; Bu, M.; Guo, B.; Niu, D. Effect and Action Mechanism of Fibers on Mechanical Behavior of Hybrid Basalt-Polypropylene Fiber-Reinforced Concrete. Structures 2021, 34, 3596–3610. [Google Scholar] [CrossRef]
- Karahan, O.; Atiş, C.D. The Durability Properties of Polypropylene Fiber Reinforced Fly Ash Concrete. Mater. Des. 2011, 32, 1044–1049. [Google Scholar] [CrossRef]
- Ghazy, A.; Bassuoni, M.; Maguire, E.; O’Loan, M. Properties of Fiber-Reinforced Mortars Incorporating Nano-Silica. Fibers 2016, 4, 6. [Google Scholar] [CrossRef]
- Ramezanianpour, A.A.; Esmaeili, M.; Ghahari, S.A.; Najafi, M.H. Laboratory Study on the Effect of Polypropylene Fiber on Durability, and Physical and Mechanical Characteristic of Concrete for Application in Sleepers. Constr. Build. Mater. 2013, 44, 411–418. [Google Scholar] [CrossRef]
- Das, C.S.; Dey, T.; Dandapat, R.; Mukharjee, B.B.; Kumar, J. Performance Evaluation of Polypropylene Fibre Reinforced Recycled Aggregate Concrete. Constr. Build. Mater. 2018, 189, 649–659. [Google Scholar] [CrossRef]
- Sivakumar, A.; Santhanam, M. Mechanical Properties of High Strength Concrete Reinforced with Metallic and Non-Metallic Fibres. Cem. Concr. Compos. 2007, 29, 603–608. [Google Scholar] [CrossRef]
- Jiang, C.; Fan, K.; Wu, F.; Chen, D. Experimental Study on the Mechanical Properties and Microstructure of Chopped Basalt Fibre Reinforced Concrete. Mater. Des. 2014, 58, 187–193. [Google Scholar] [CrossRef]
- Tian, H.; Zhang, Y.X. Ageing Effect on Tensile and Shrinkage Behaviour of New Green Hybrid Fibre-Reinforced Cementitious Composites. Cem. Concr. Compos. 2017, 75, 38–50. [Google Scholar] [CrossRef]
- Zeyad, A.M.; Khan, A.H.; Tayeh, B.A. Durability and Strength Characteristics of High-Strength Concrete Incorporated with Volcanic Pumice Powder and Polypropylene Fibers. J. Mater. Res. Technol. 2020, 9, 806–818. [Google Scholar] [CrossRef]
- Sohaib, N.; Mamoon, R.; Sana, G.; Seemab, F. Using Polypropylene Fibers in Concrete to Achieve Maximum Strength. In Proceedings of the Eighth International Conference On Advances in Civil and Structural Engineering—CSE 2018, Institute of Research Engineers and Doctors, Kuala Lumpur, Malaysia, 3–4 February 2018; pp. 37–42. [Google Scholar]
- Najimi, M.; Farahani, F.M.; Pourkhorshidi, A. Effects of Polypropylene Fibers on Physical and Mechanical Properties of Concretes. In Proceedings of the Third International Conference on Concrete and Development, Tehran, Iran, 27 April 2009; pp. 1073–1081. [Google Scholar]
- Kakooei, S.; Akil, H.M.; Jamshidi, M.; Rouhi, J. The Effects of Polypropylene Fibers on the Properties of Reinforced Concrete Structures. Constr. Build. Mater. 2012, 27, 73–77. [Google Scholar] [CrossRef]
- Bagherzadeh, R.; Pakravan, H.R.; Sadeghi, A.-H.; Latifi, M.; Merati, A.A. An Investigation on Adding Polypropylene Fibers to Reinforce Lightweight Cement Composites (LWC). J. Eng. Fibers Fabr. 2012, 7, 155892501200700. [Google Scholar] [CrossRef]
- Kan, L.; Shi, R.; Zhu, J. Effect of Fineness and Calcium Content of Fly Ash on the Mechanical Properties of Engineered Cementitious Composites (ECC). Constr. Build. Mater. 2019, 209, 476–484. [Google Scholar] [CrossRef]
- Lin, J.-X.; Song, Y.; Xie, Z.-H.; Guo, Y.-C.; Yuan, B.; Zeng, J.-J.; Wei, X. Static and Dynamic Mechanical Behavior of Engineered Cementitious Composites with PP and PVA Fibers. J. Build. Eng. 2020, 29, 101097. [Google Scholar] [CrossRef]
- Małek, M.; Łasica, W.; Kadela, M.; Kluczyński, J.; Dudek, D. Physical and Mechanical Properties of Polypropylene Fibre-Reinforced Cement–Glass Composite. Materials 2021, 14, 637. [Google Scholar] [CrossRef]
- Mohebi, Z.H.; Bahnamiri, A.B.; Dehestani, M. Effect of Polypropylene Fibers on Bond Performance of Reinforcing Bars in High Strength Concrete. Constr. Build. Mater. 2019, 215, 401–409. [Google Scholar] [CrossRef]
- Arezoumandi, M.; Looney, T.J.; Volz, J.S. Effect of Fly Ash Replacement Level on the Bond Strength of Reinforcing Steel in Concrete Beams. J. Clean. Prod. 2015, 87, 745–751. [Google Scholar] [CrossRef]
- Looney, T.J.; Arezoumandi, M.; Volz, J.S.; Myers, J.J. An Experimental Study on Bond Strength of Reinforcing Steel in High-Volume Fly-Ash Concrete. Adv. Civ. Eng. Mater. 2012, 1, 20120026. [Google Scholar] [CrossRef]
- IS 4031-1; Methods of Physical Tests for Hydraulic Cement, Part 1: Determination of Fineness by Dry Sieving. Bureau of Indian Standards: New Delhi, India, 1996.
- IS 4031-4; Methods of Physical Tests for Hydraulic Cement, Part 4: Determination of Consistency of Standard Cement Paste. Bureau of Indian Standards: New Delhi, India, 1988.
- IS 4031-11; Methods of Physical Tests for Hydraulic Cement, Part 11: Determination of Density. Bureau of Indian Standards: New Delhi, India, 1988.
- IS 4031-5; Methods of Physical Tests for Hydraulic Cement, Part 5: Determination of Initial and Final Setting Times. Bureau of Indian Standards: New Delhi, India, 1988.
- IS 4031-6; Methods of Physical Tests for Hydraulic Cement, Part 6: Determination of Compressive Strength of Hydraulic Cement (Other than Masonry Cement). Bureau of Indian Standards: New Delhi, India, 1988.
- IS 1727; Methods of Test for Pozzolanic Materials. Bureau of Indian Standards: New Delhi, India, 1967.
- IS 3812-1; Specification for Pulverized Fuel Ash, Part 1: For Use as Pozzolana in Cement, Cement Mortar and Concrete. Bureau of Indian Standards: New Delhi, India, 2003.
- IS 516; Method of Tests for Strength of Concrete. Bureau of Indian Standards: New Delhi, India, 1959.
- IS 516-5; Non-Destructive Testig of Concrete Section 1 Ultrasonic Pulse Velocity Testing. Bureau of Indian Standards: New Delhi, India, 2018.
- IS 5816; Method of Test Splitting Tensile Strength of Concrete. Bureau of Indian Standards: New Delhi, India, 1999.
- IS 2770-1; Methods of Testing Bond in Reinforced Concrete, Part 1: Pull-Out Test. Bureau of Indian Standards: New Delhi, India, 1967.
- Standard Test Method for Measurement of Rate of Absorption of Water by Hydraulic-Cement Concretes. Available online: https://www.astm.org/c1585-20.html (accessed on 30 July 2023).
- Sadeghi Nik, A.; Lotfi Omran, O. Estimation of Compressive Strength of Self-Compacted Concrete with Fibers Consisting Nano-SiO2 Using Ultrasonic Pulse Velocity. Constr. Build. Mater. 2013, 44, 654–662. [Google Scholar] [CrossRef]
- Mashrei, M.A.; Sultan, A.A.; Mahdi, A.M. Effects of Polypropylene Fibers on Compressive and Flexural Strength of Concrete Material. Int. J. Civ. Eng. Technol. 2018, 9, 2208–2217. [Google Scholar]
Figure 1.
Materials used in preparing the composite.

Figure 2.
PSD analysis of OPC 43 and F-FA.

Figure 3.
Specimens kept for curing.
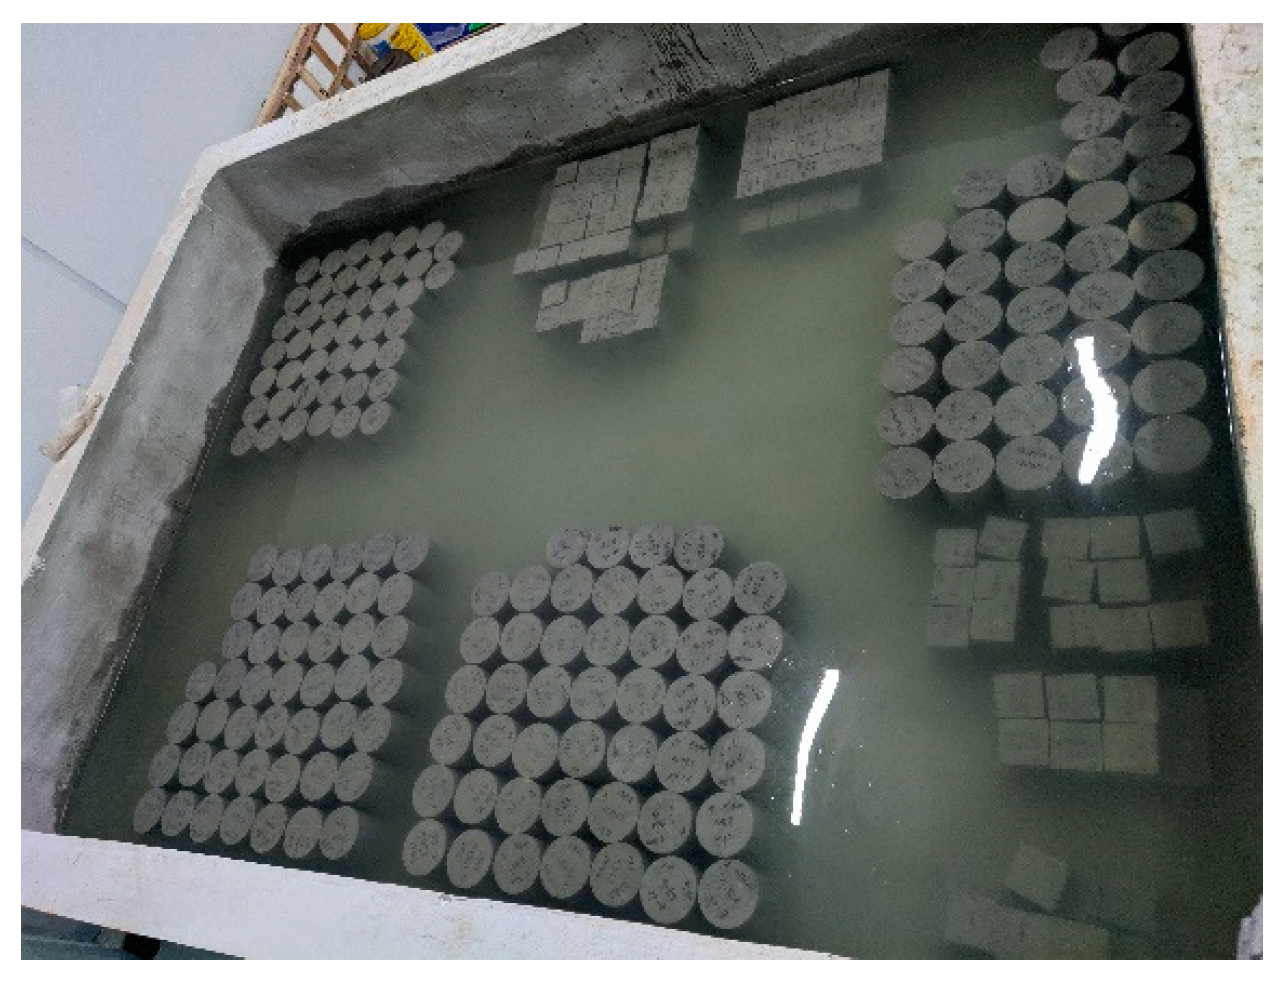
Figure 4.
The research plan adopted for the present study.
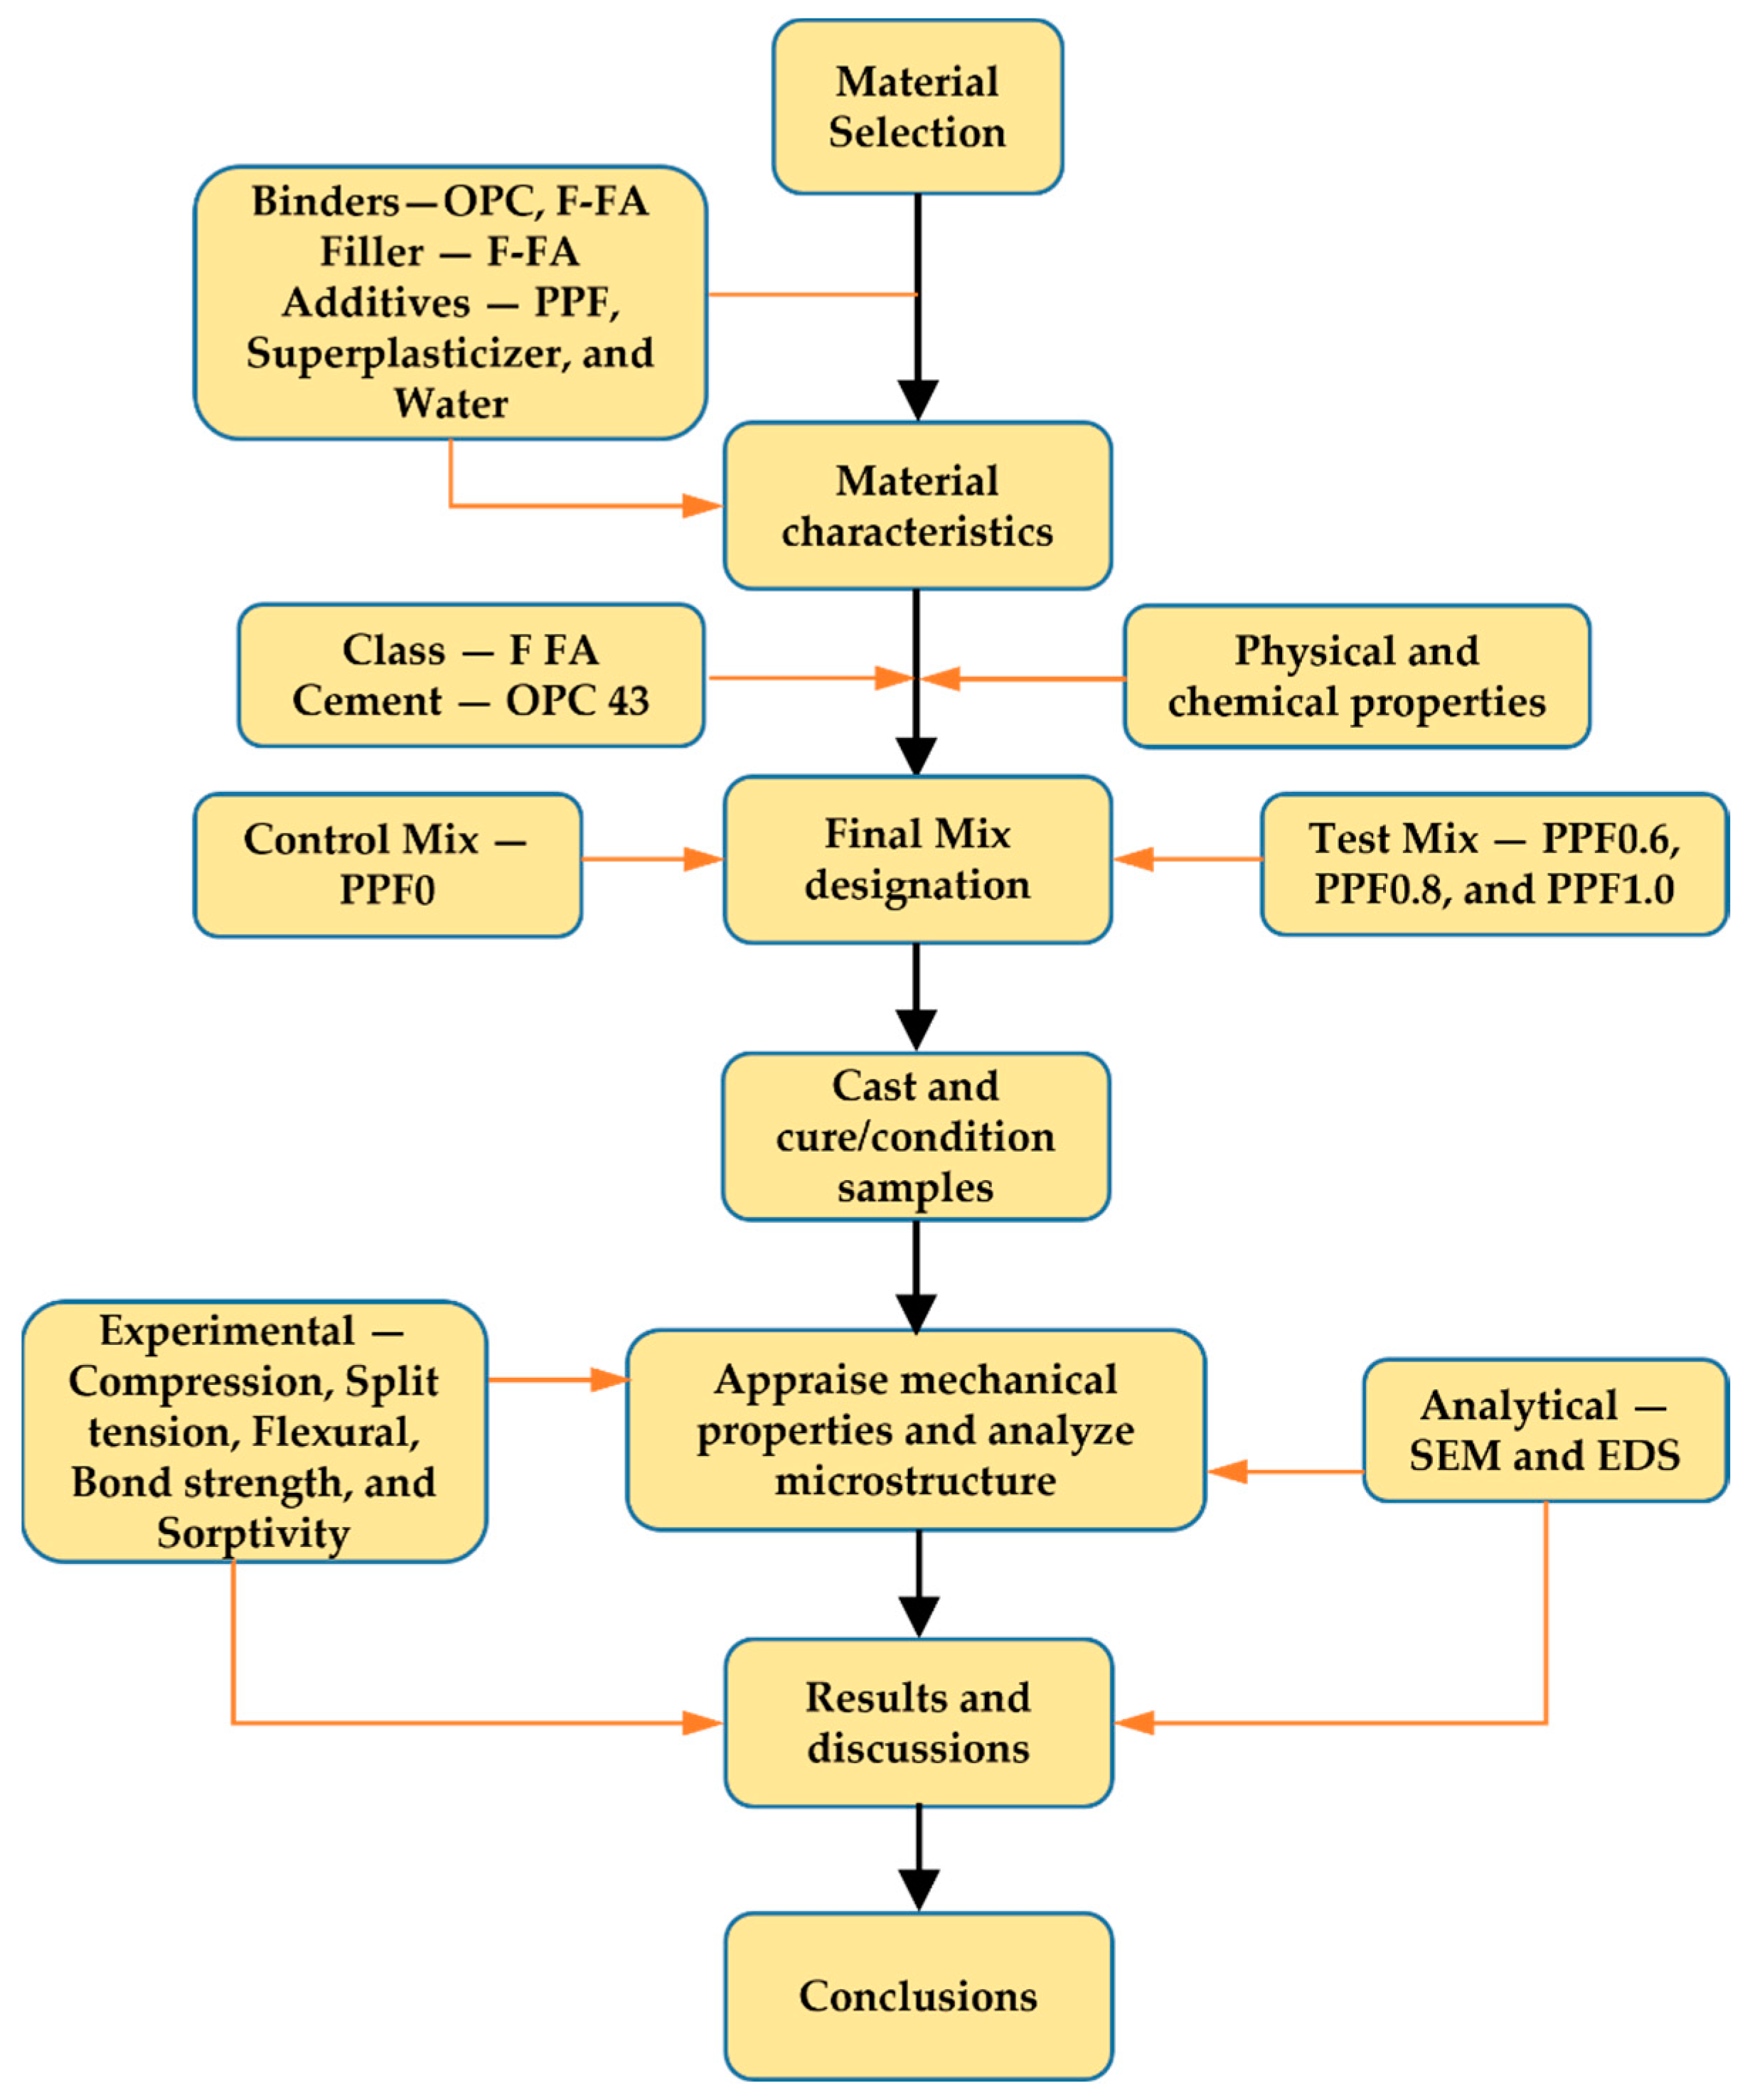
Figure 5.
Experimental setup for (a) compression test with splitting test attachment, (b) flexural test, (c) UPV test, (d) pull-out test, and (e) water sorptivity test.
Figure 5.
Experimental setup for (a) compression test with splitting test attachment, (b) flexural test, (c) UPV test, (d) pull-out test, and (e) water sorptivity test.
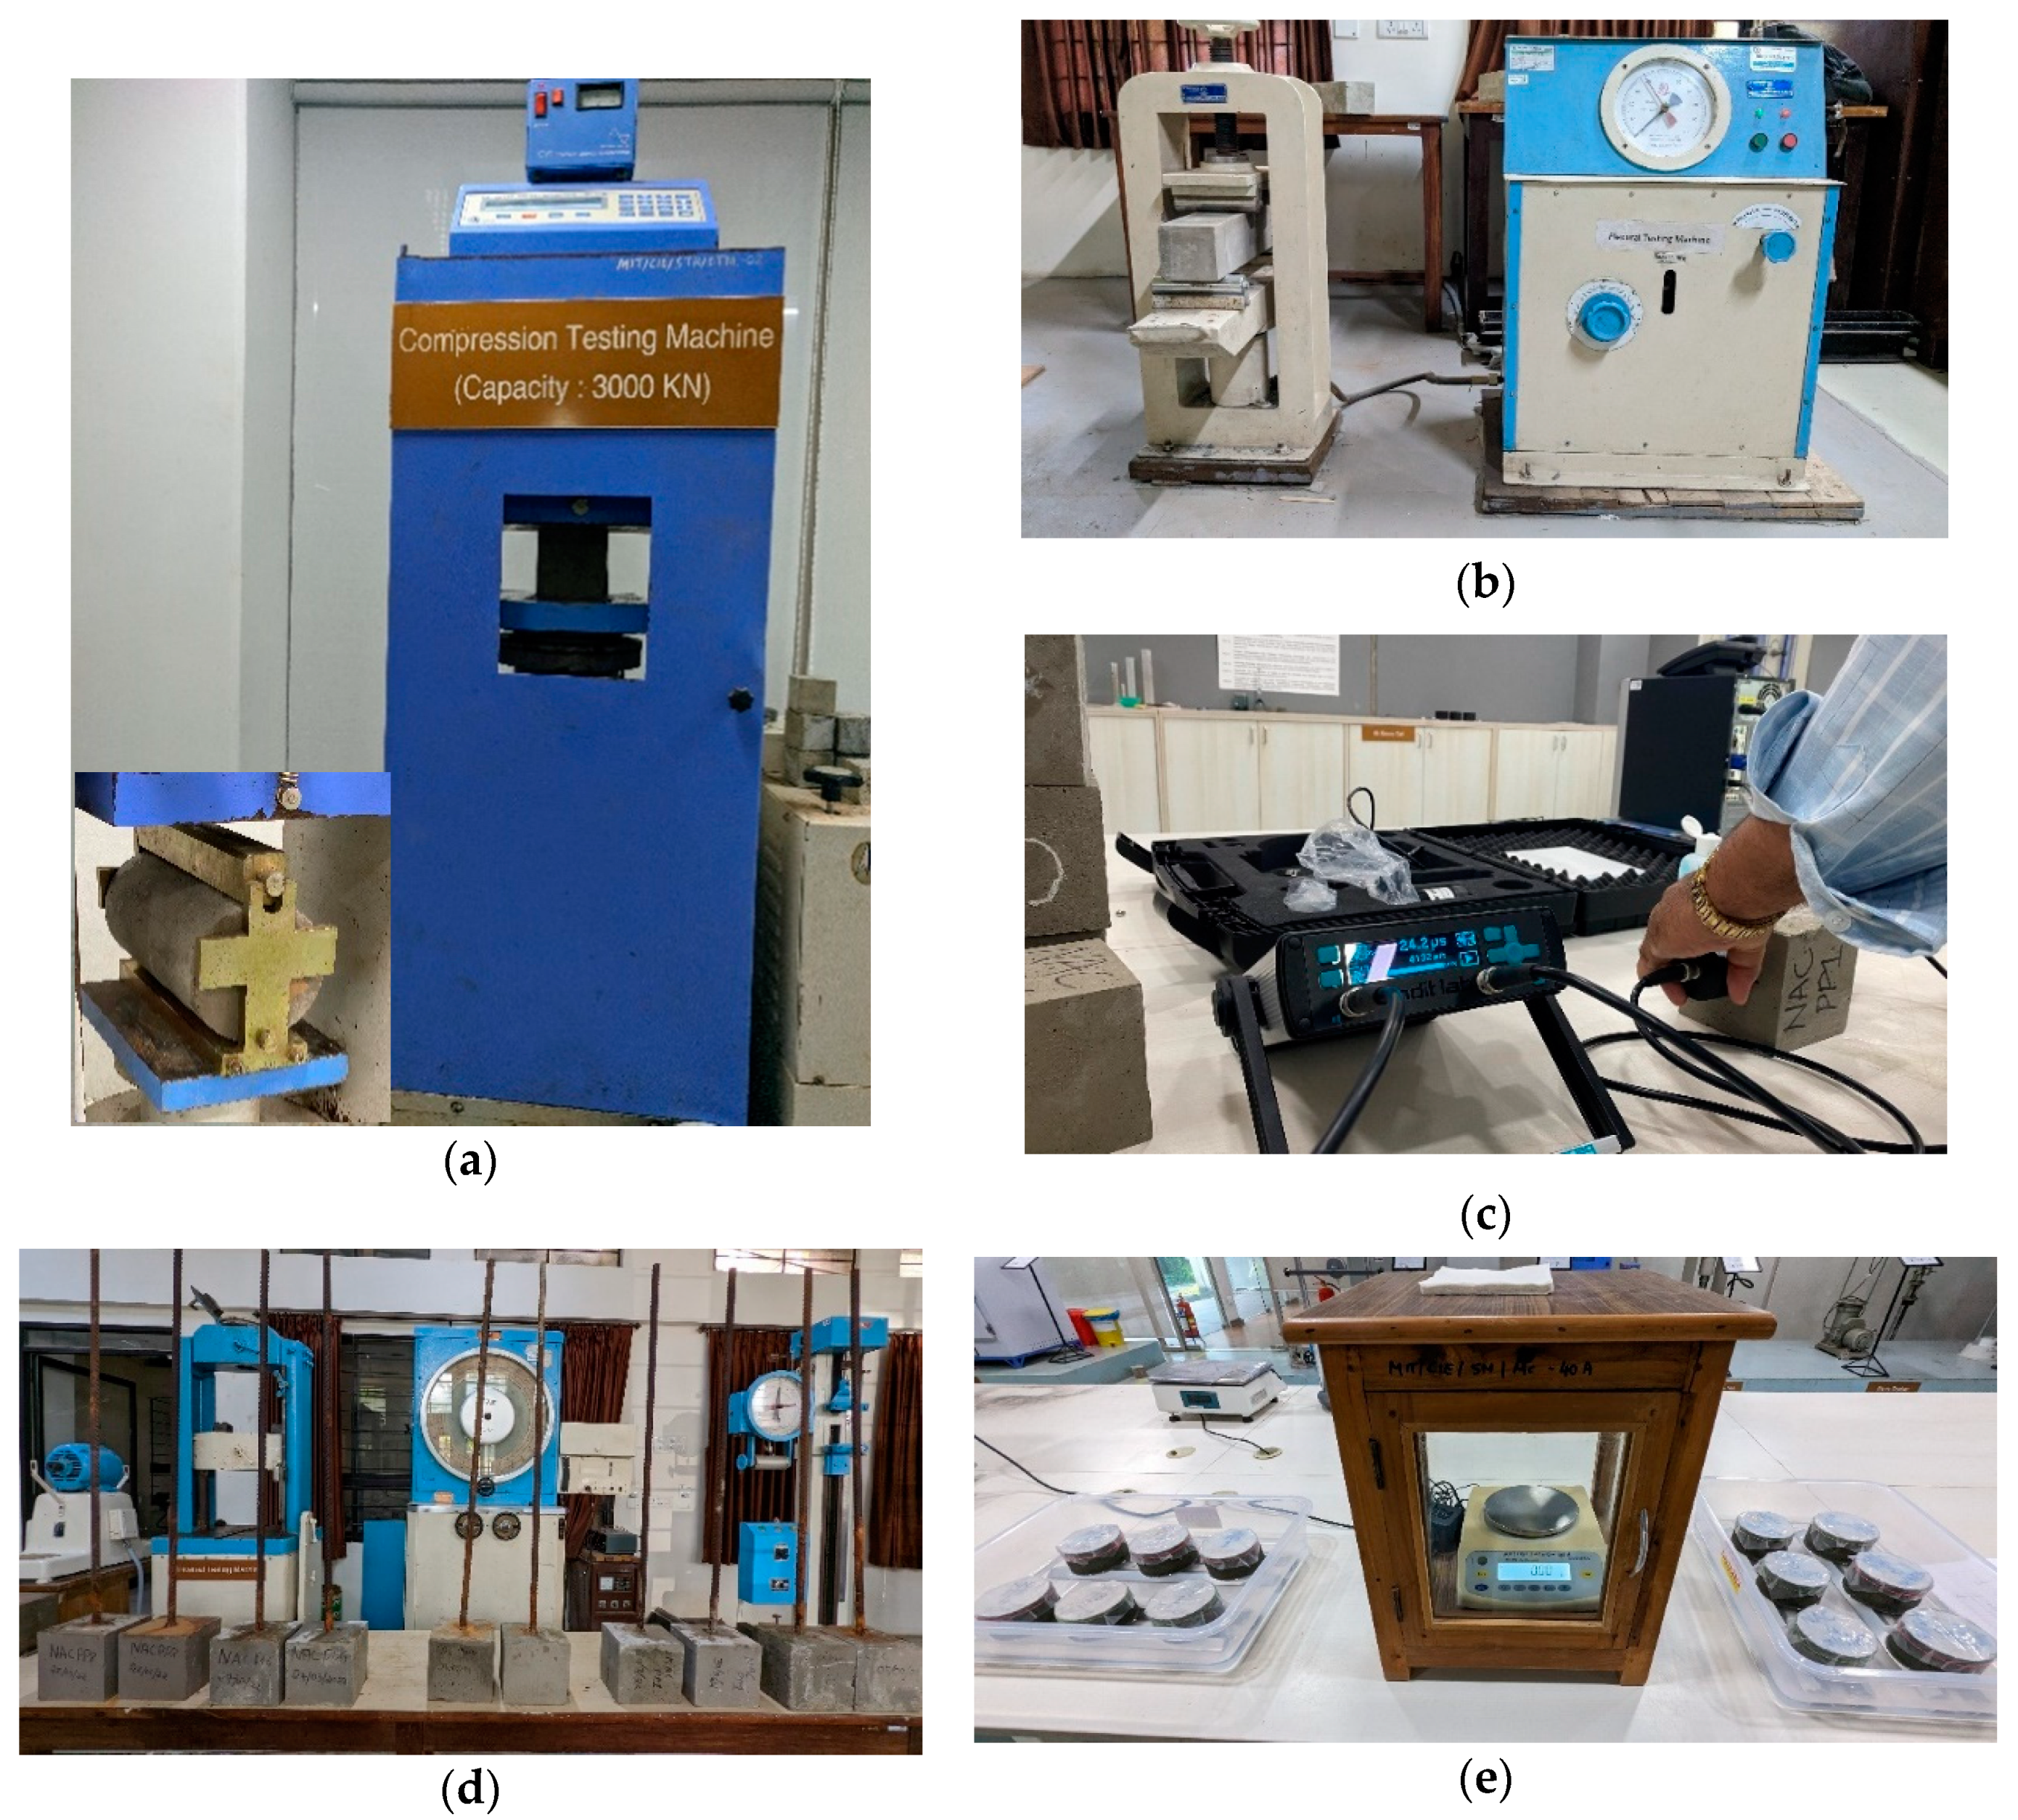
Figure 6.
Compressive strength test results for immersion curing.

Figure 7.
Compressive strength test results for moist curing.
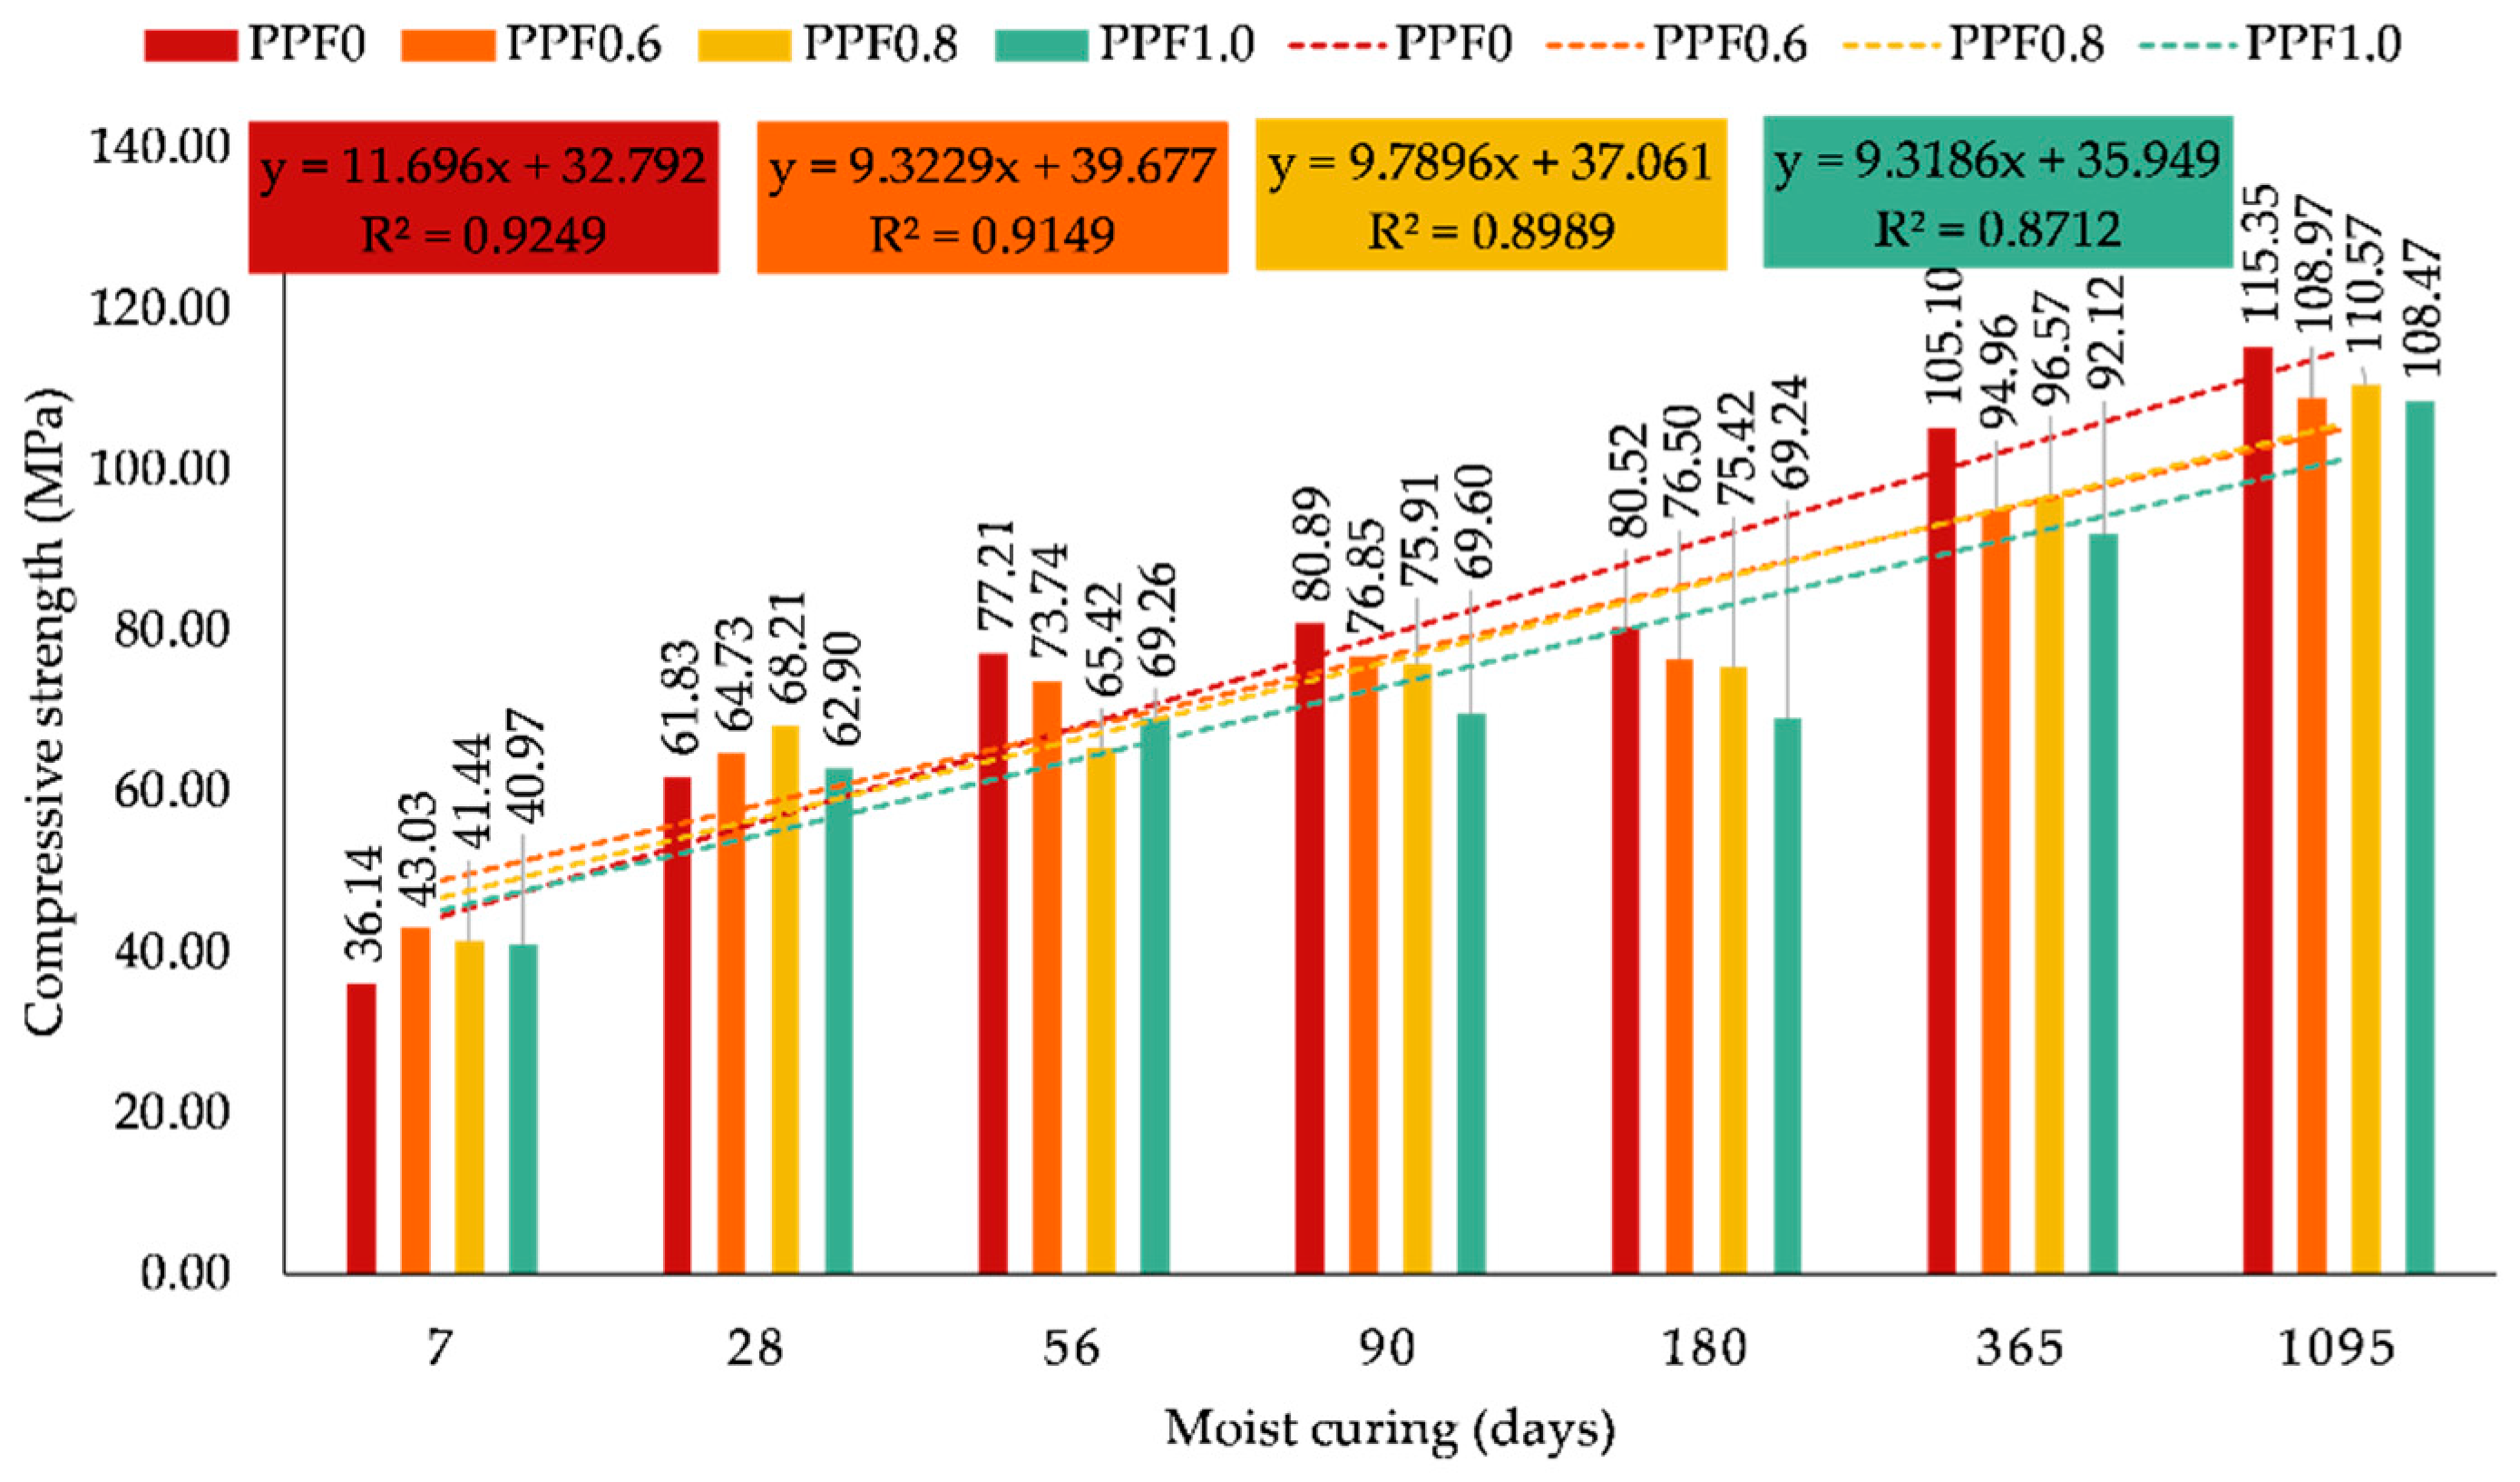
Figure 8.
(a) Post-curing weight gain (%) for all mixes, (b) UPV values for all mixes.
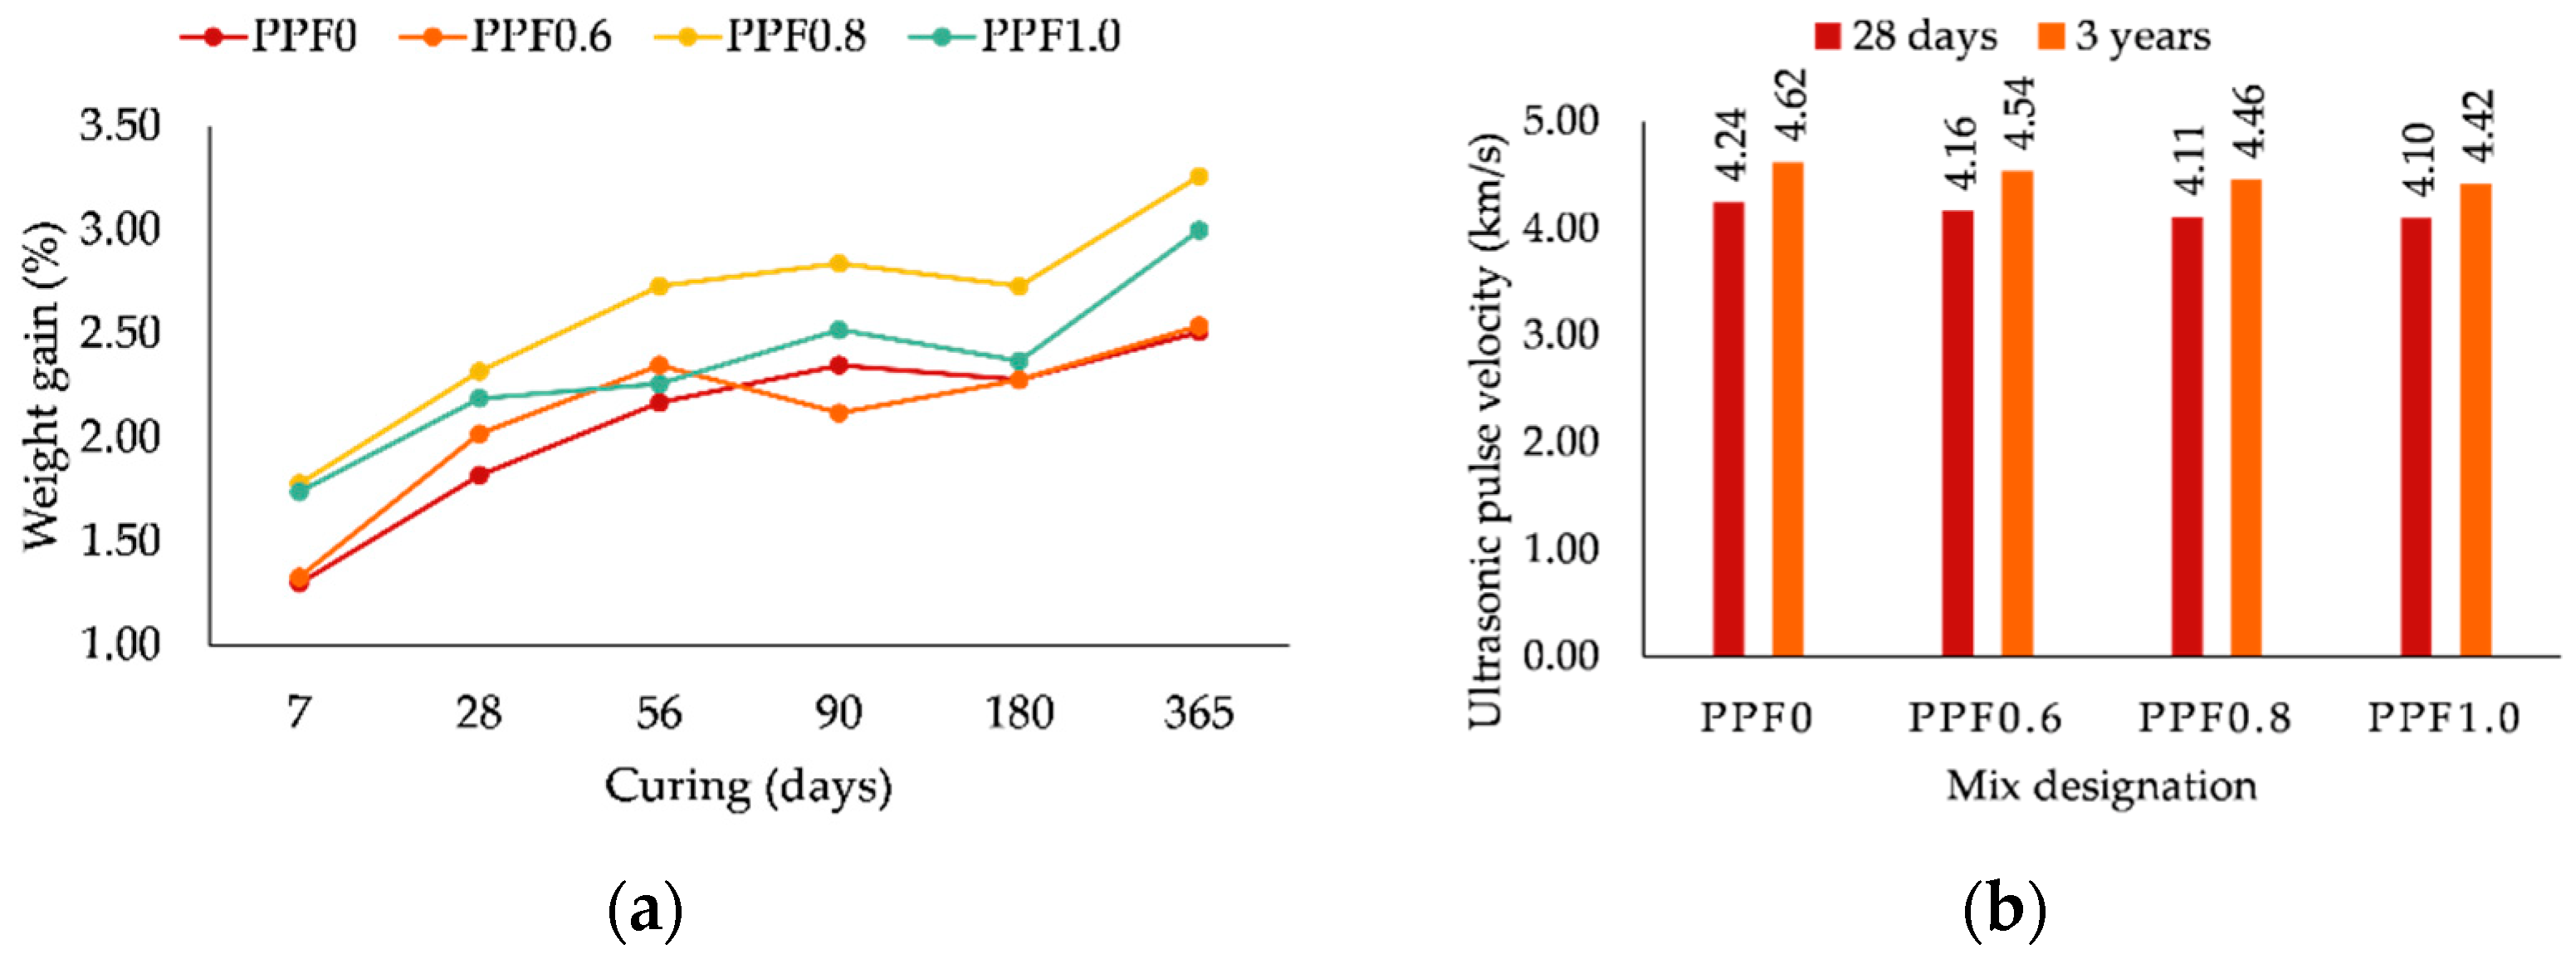
Figure 9.
Flexural strength test results for all concrete mixes.

Figure 10.
Splitting tensile strength test results for all concrete mixes.
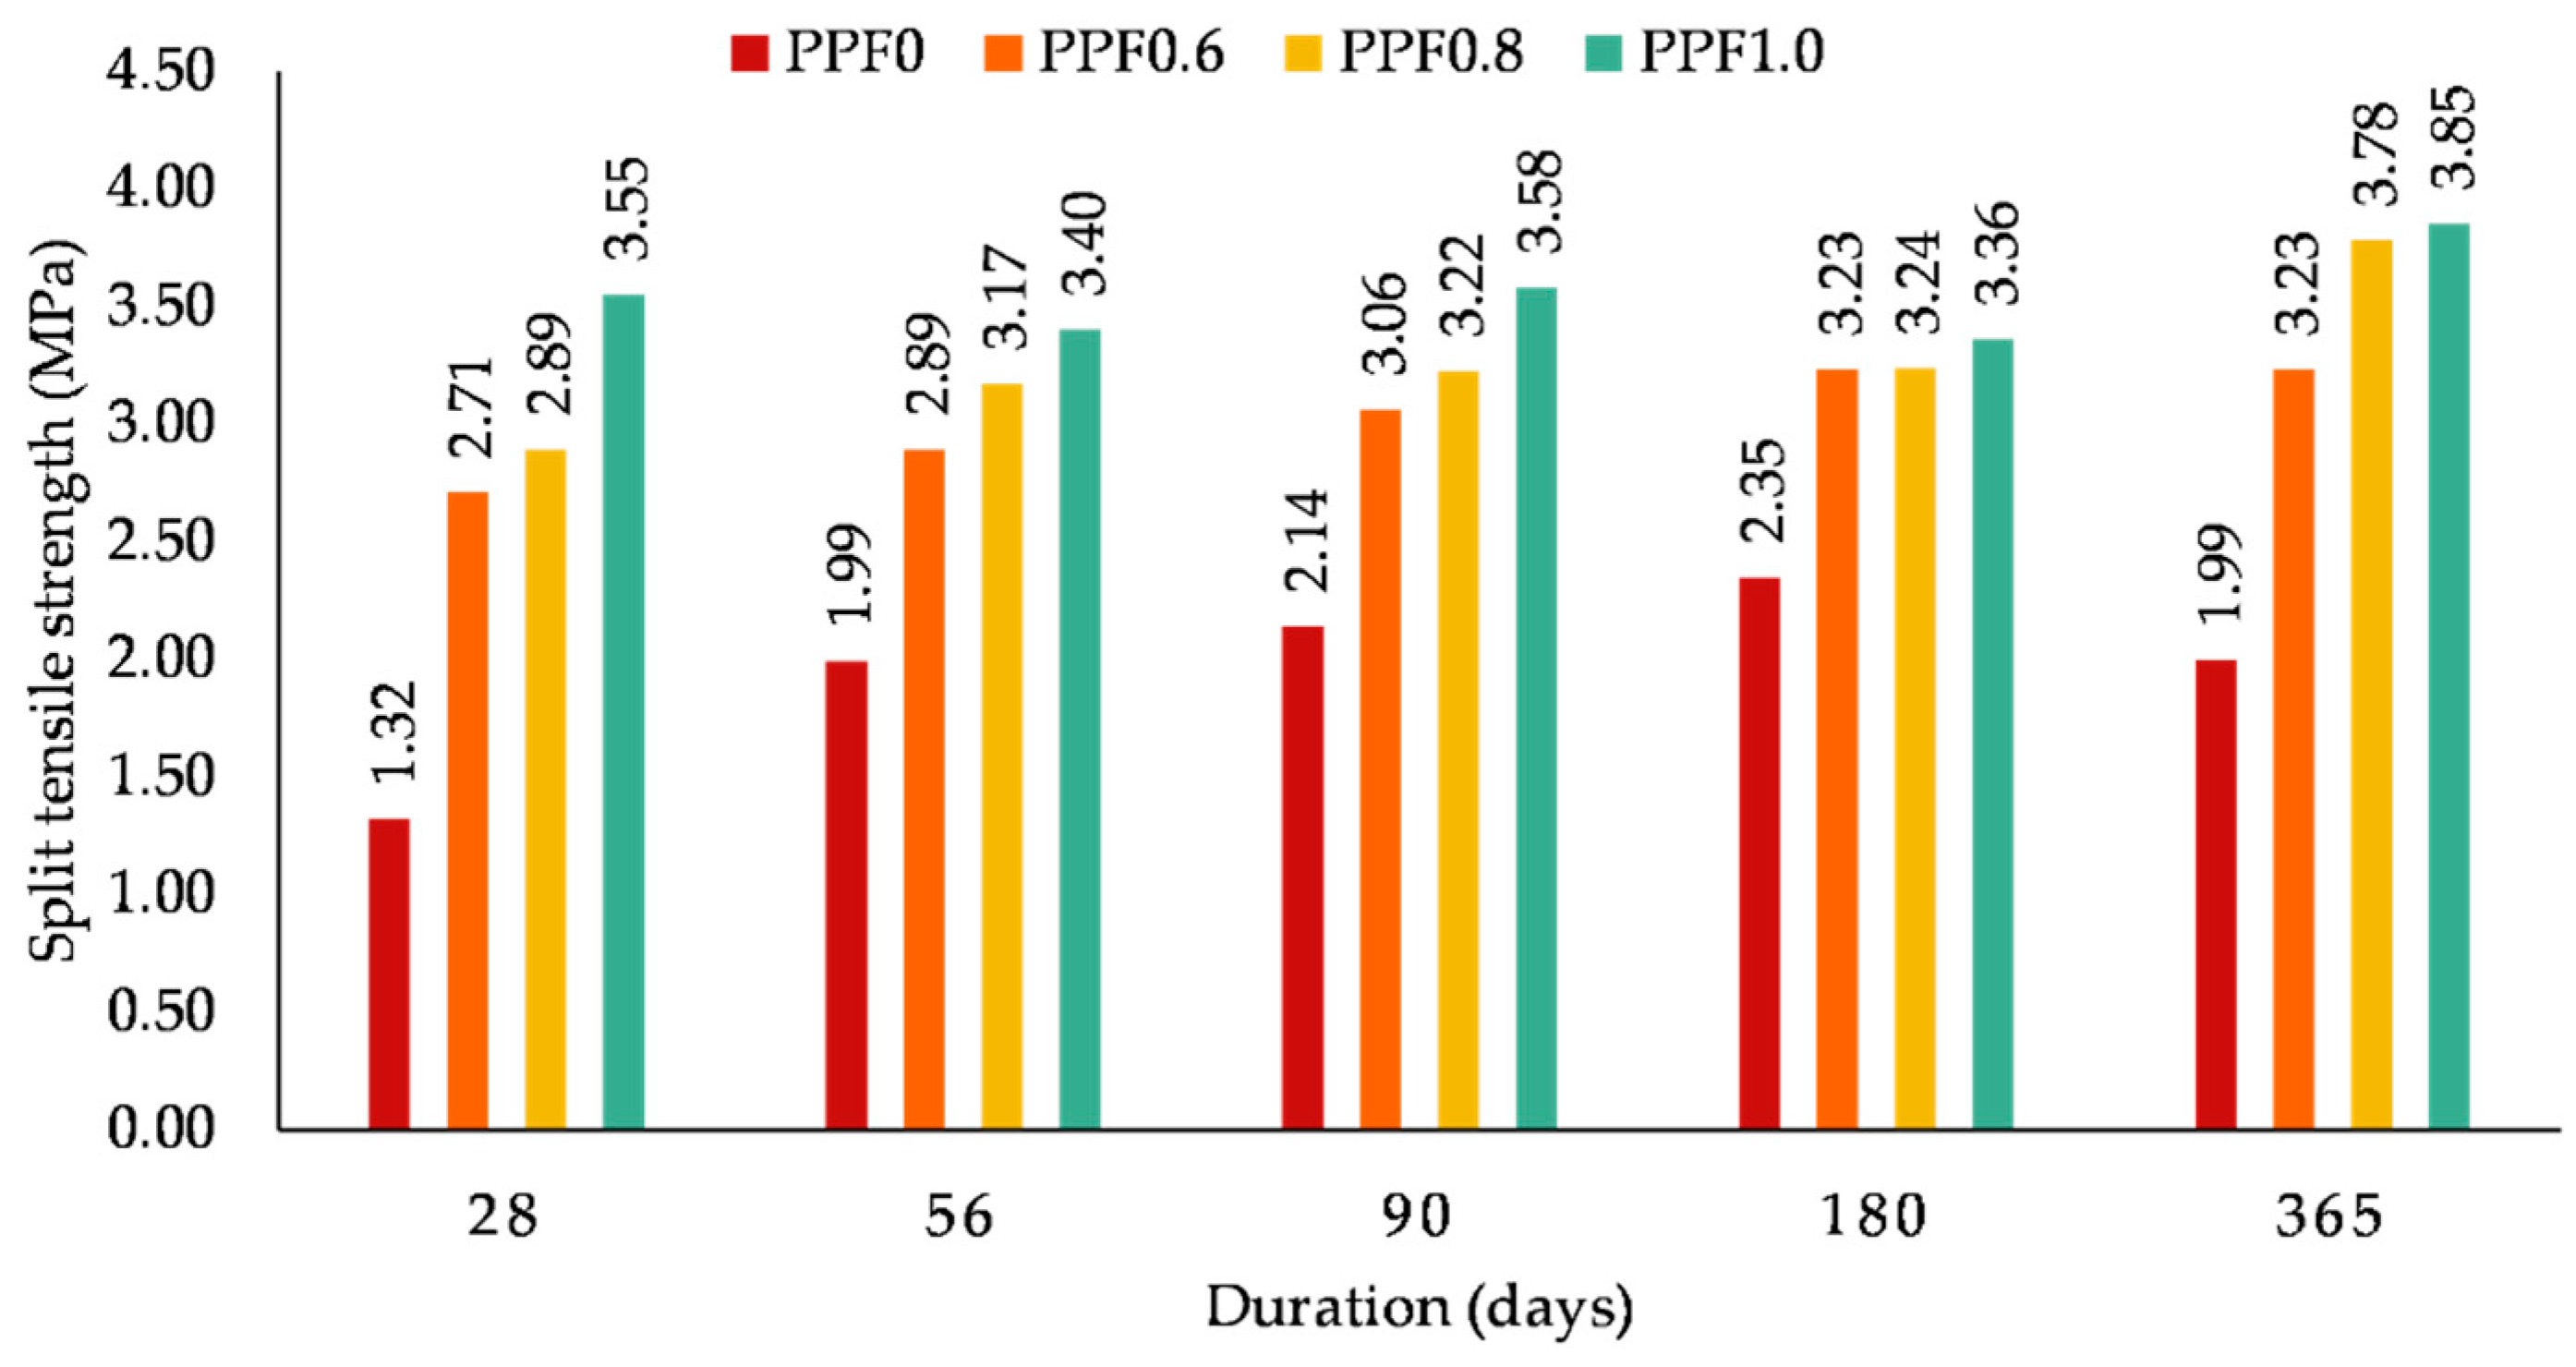
Figure 11.
Pull-out test results for all concrete mixes.
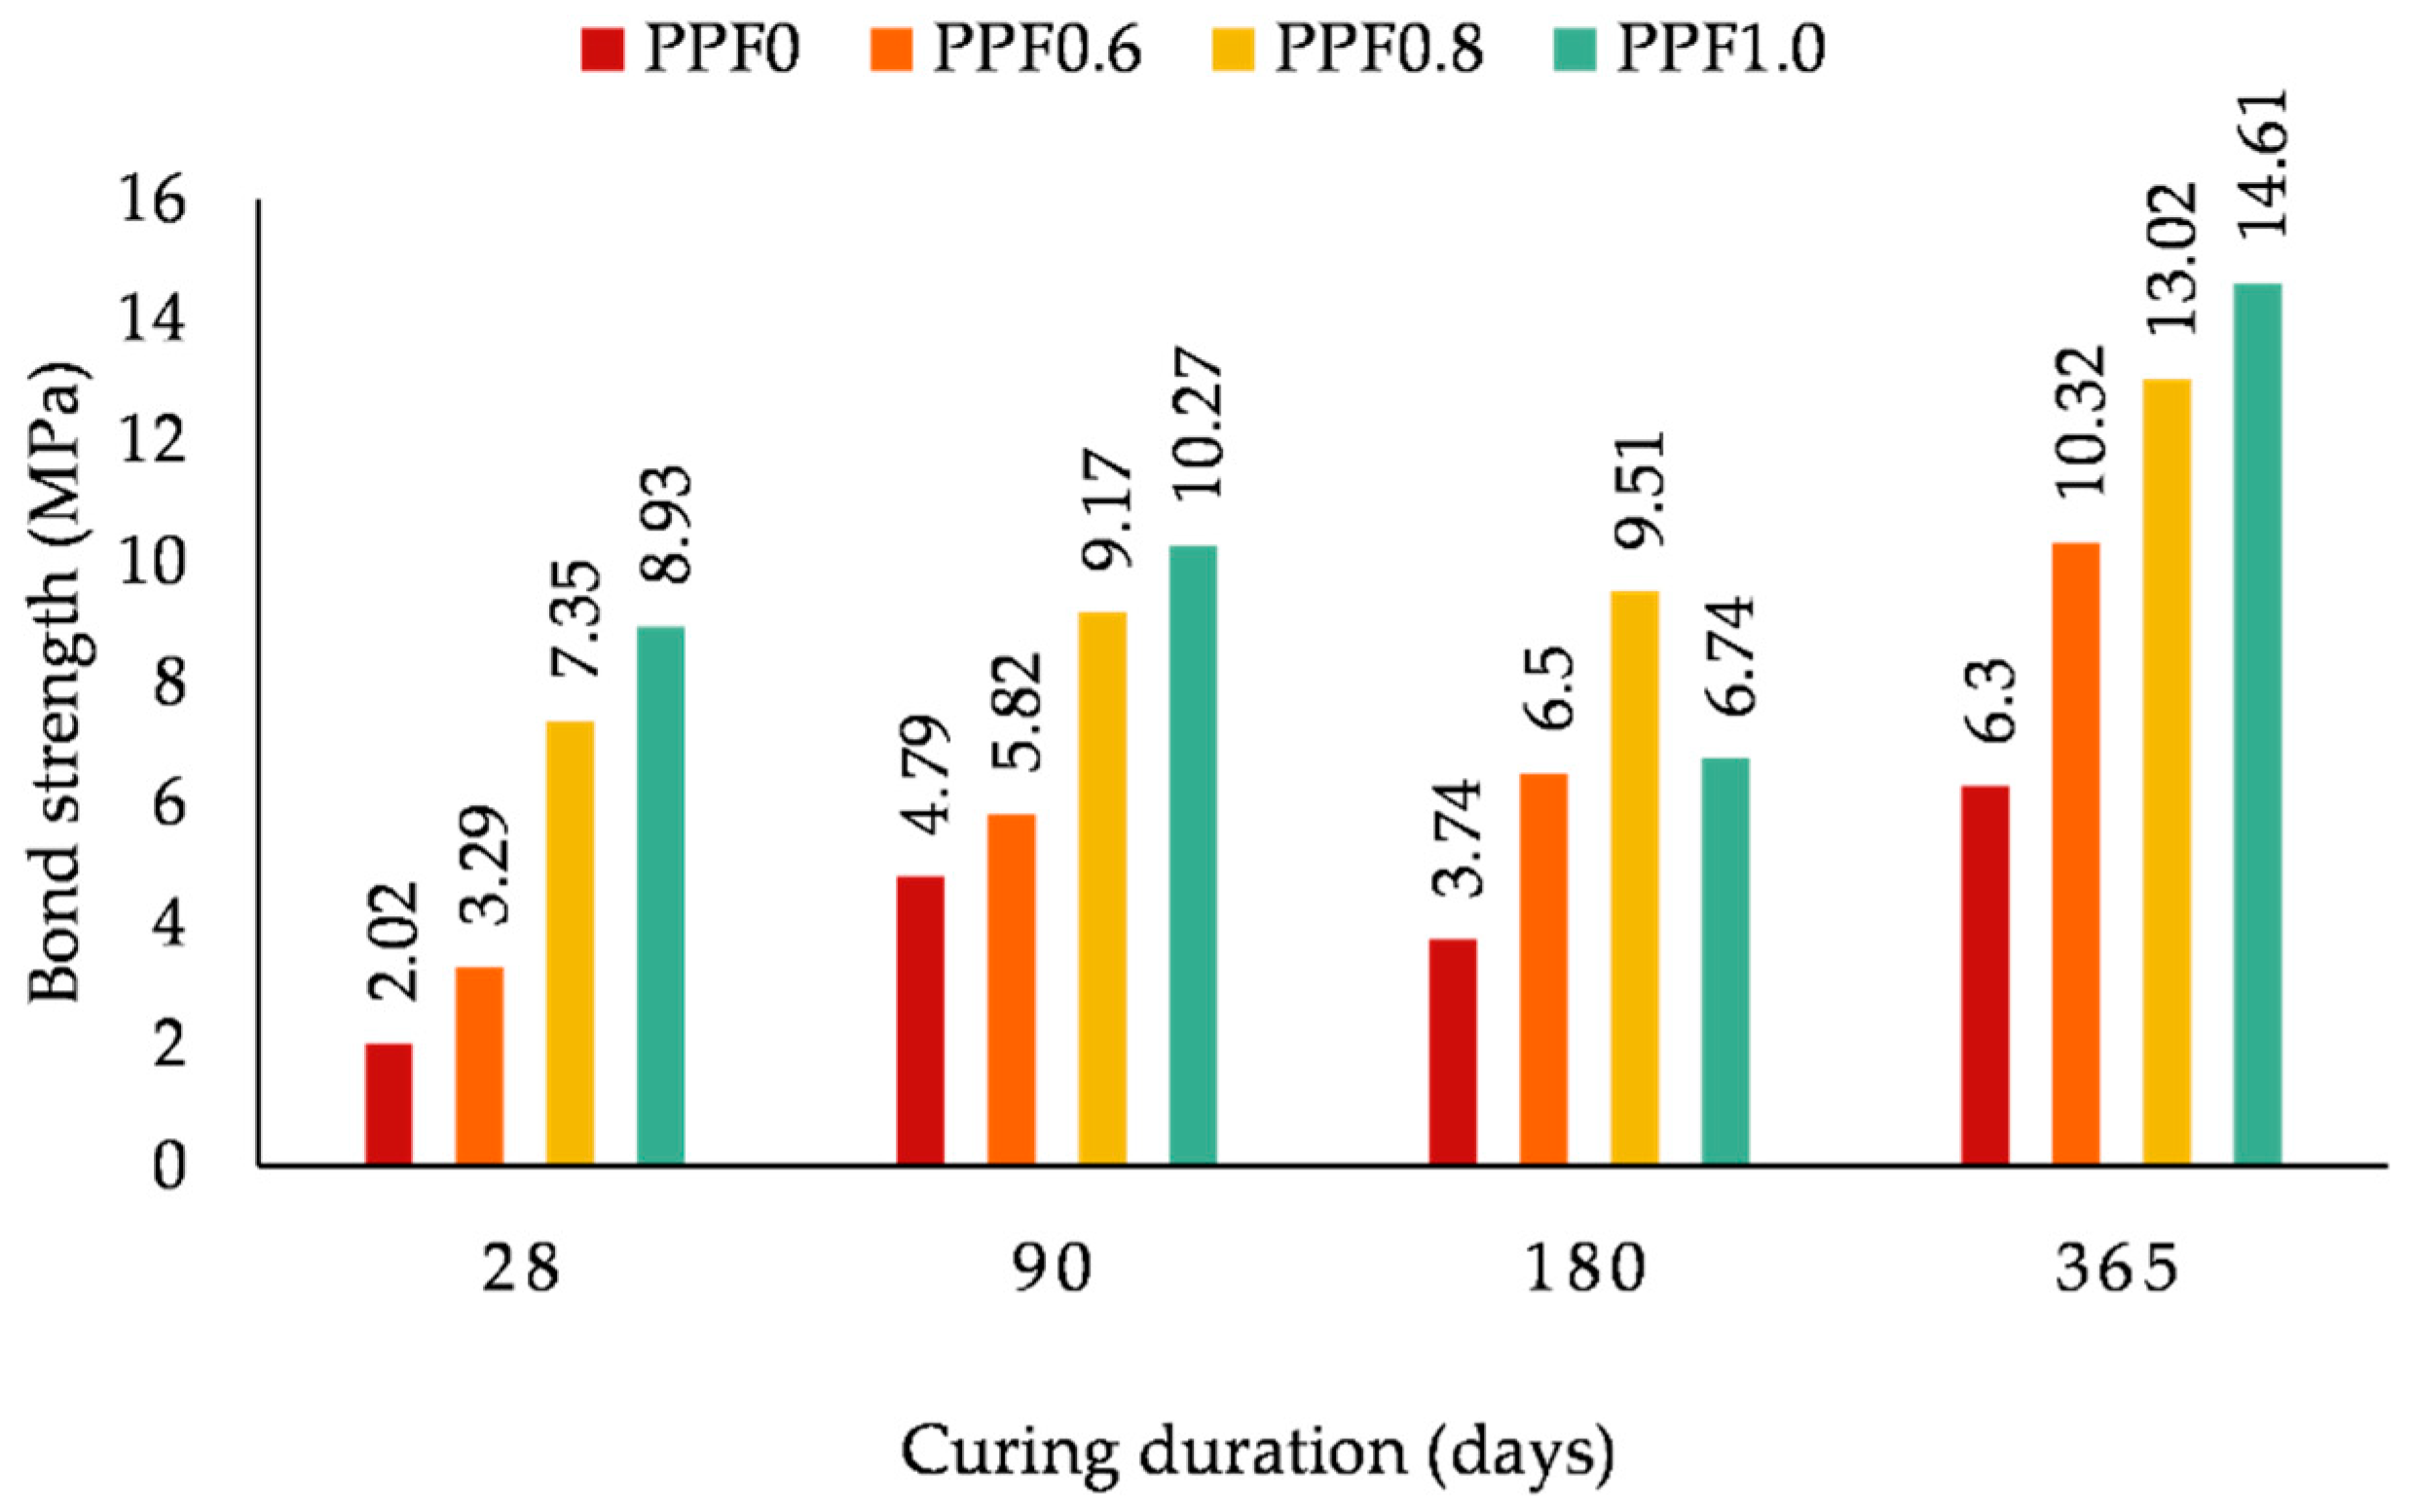
Figure 12.
The plot of absorption vs. √time.
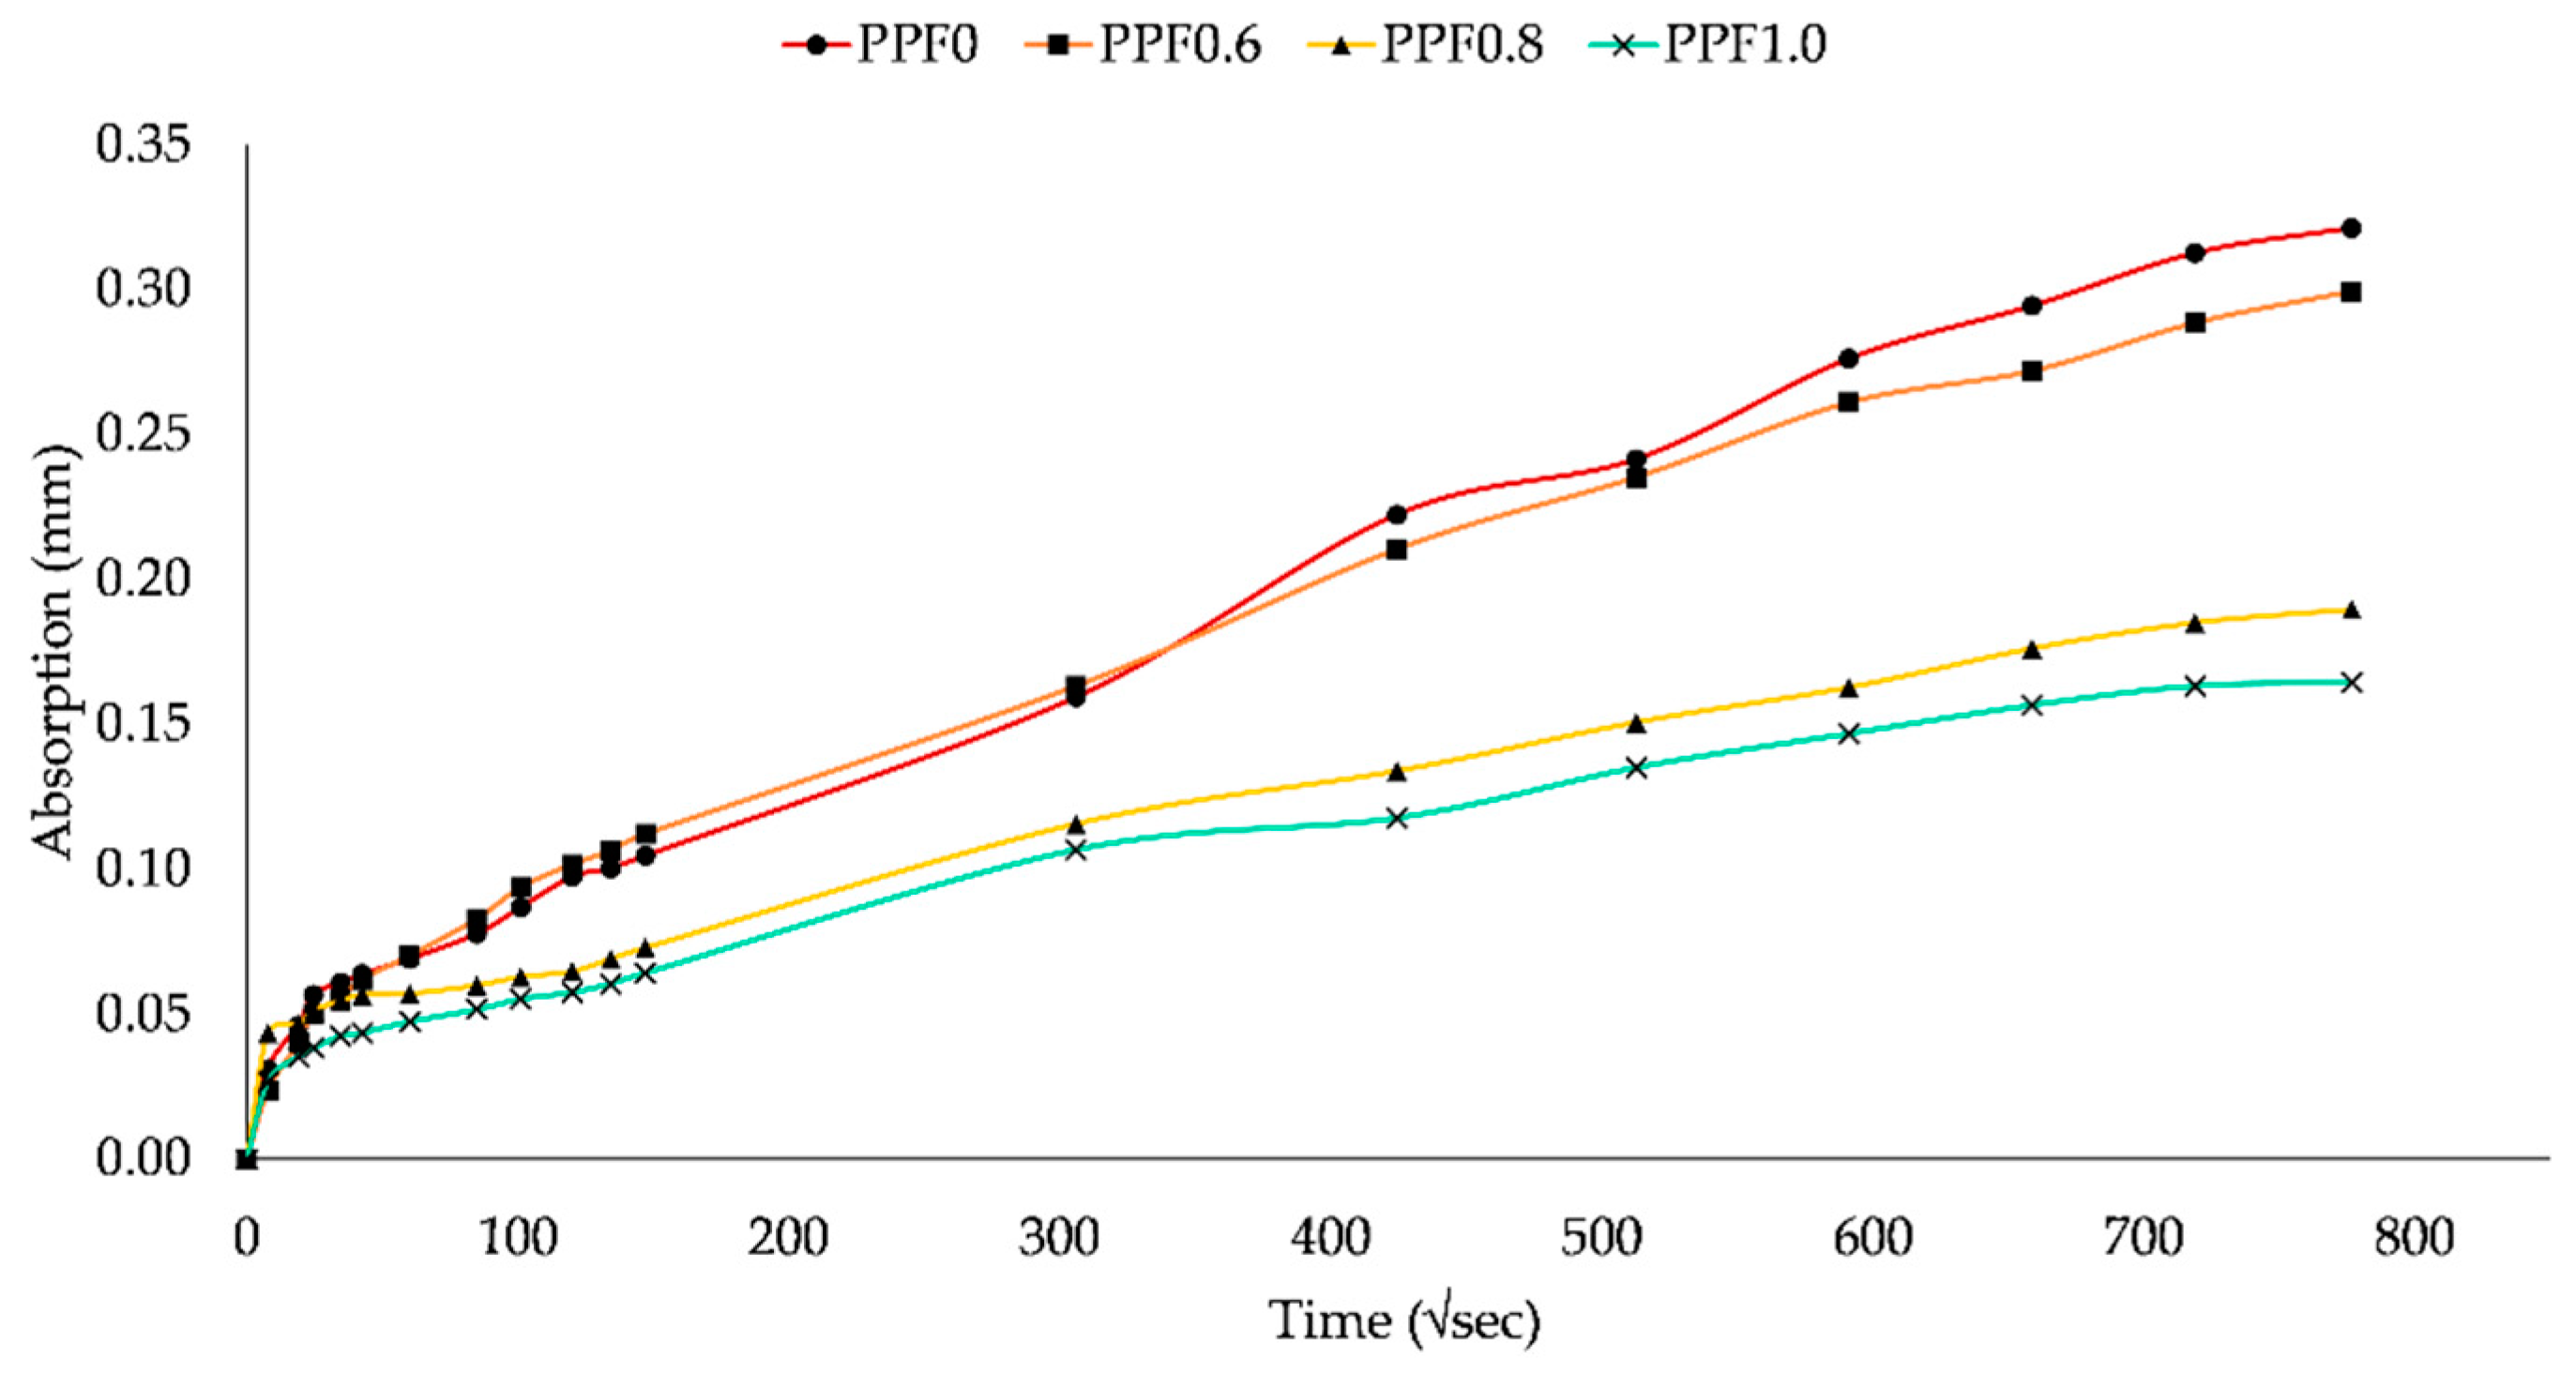
Figure 13.
Typical specimen failure due to compressive stress for (a) PPF0 and (b) all TMs.

Figure 14.
Sample pictures of specimen failure due to flexure stress for (a) control mix and (b) test mix.
Figure 14.
Sample pictures of specimen failure due to flexure stress for (a) control mix and (b) test mix.
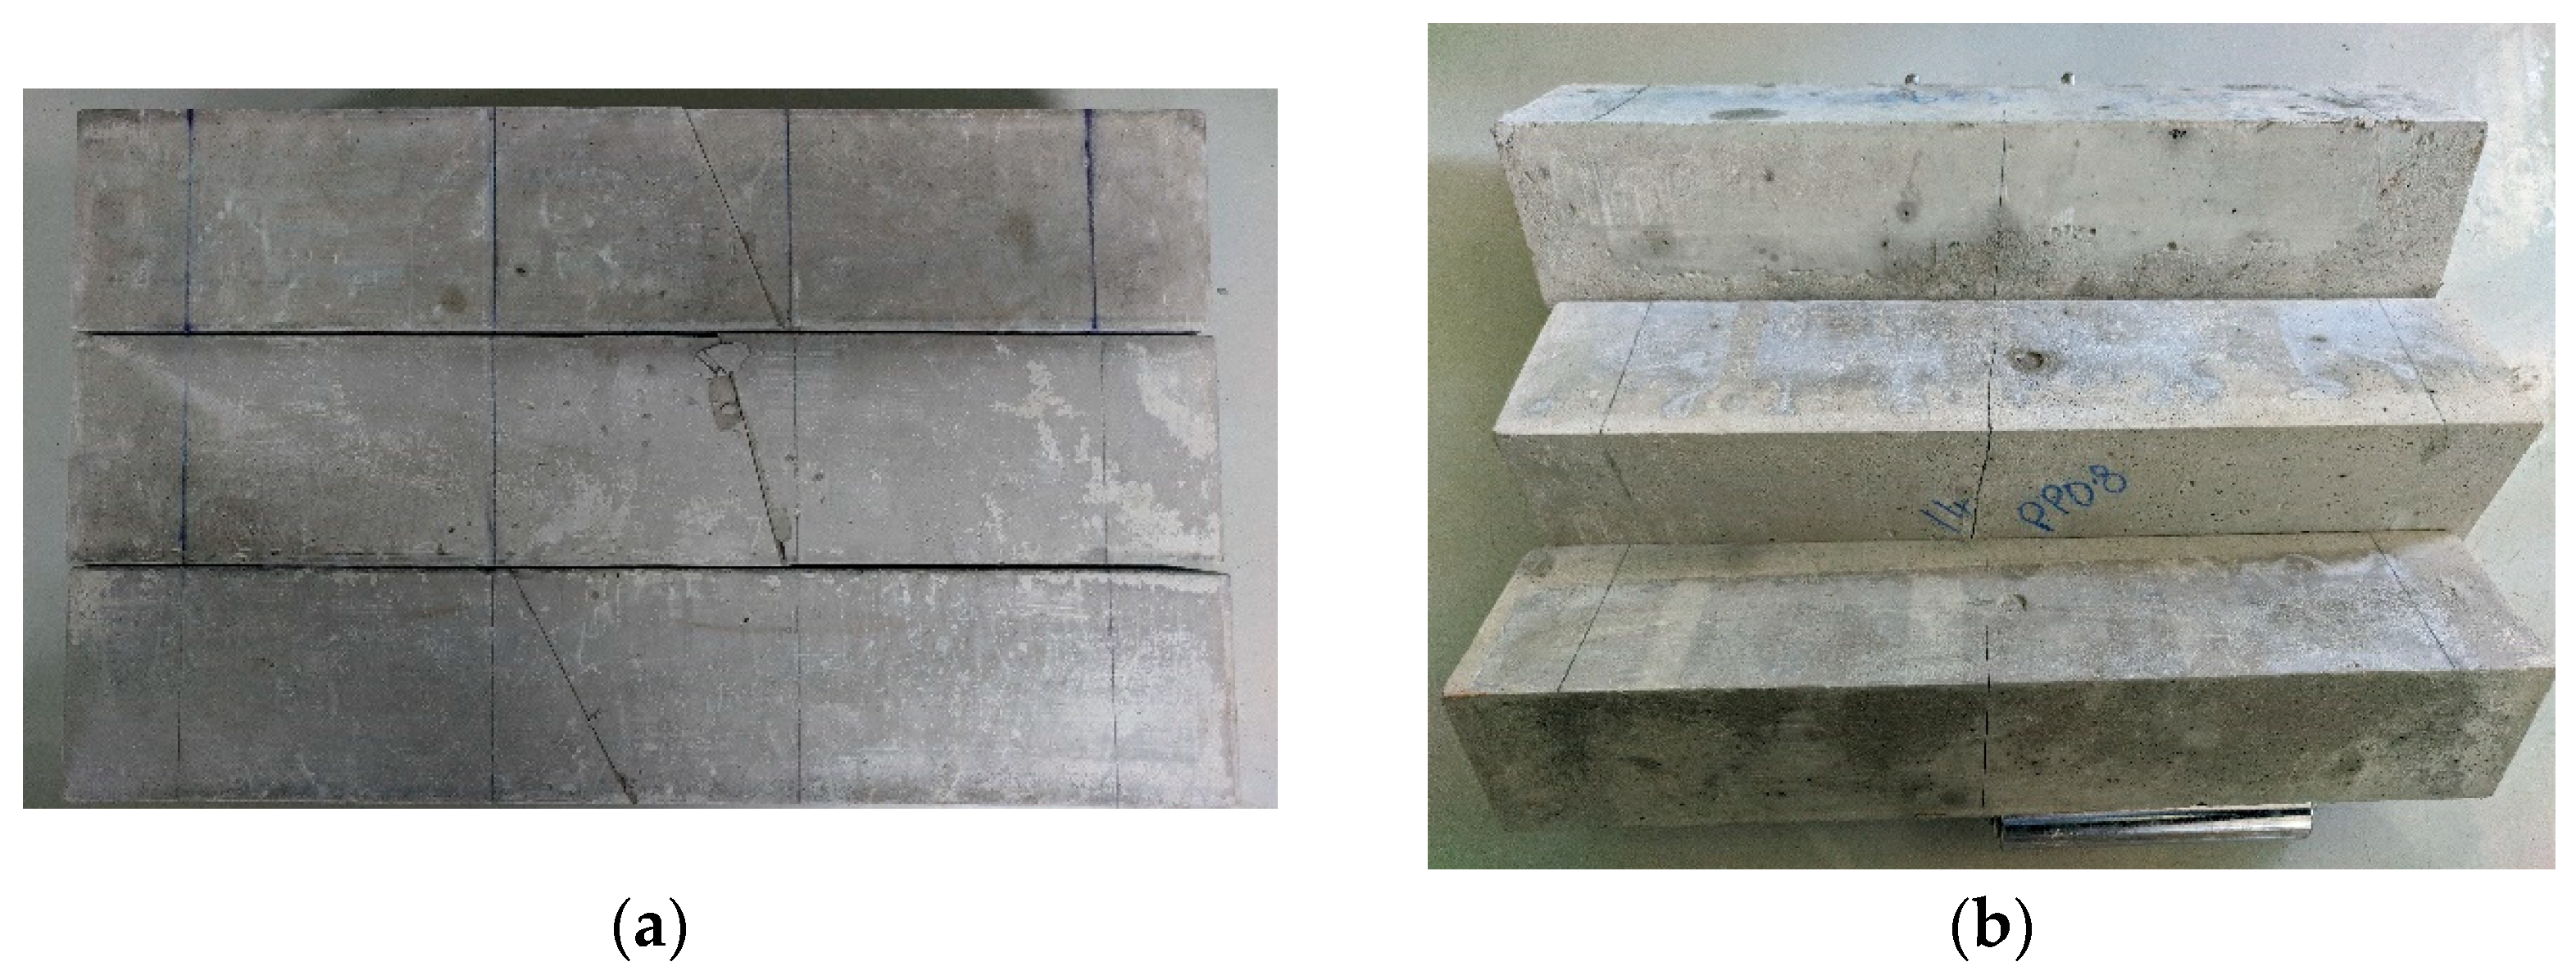
Figure 15.
Sample pictures of specimen failure due to tensile stress for (a) PPF0 and (b) all TMs.
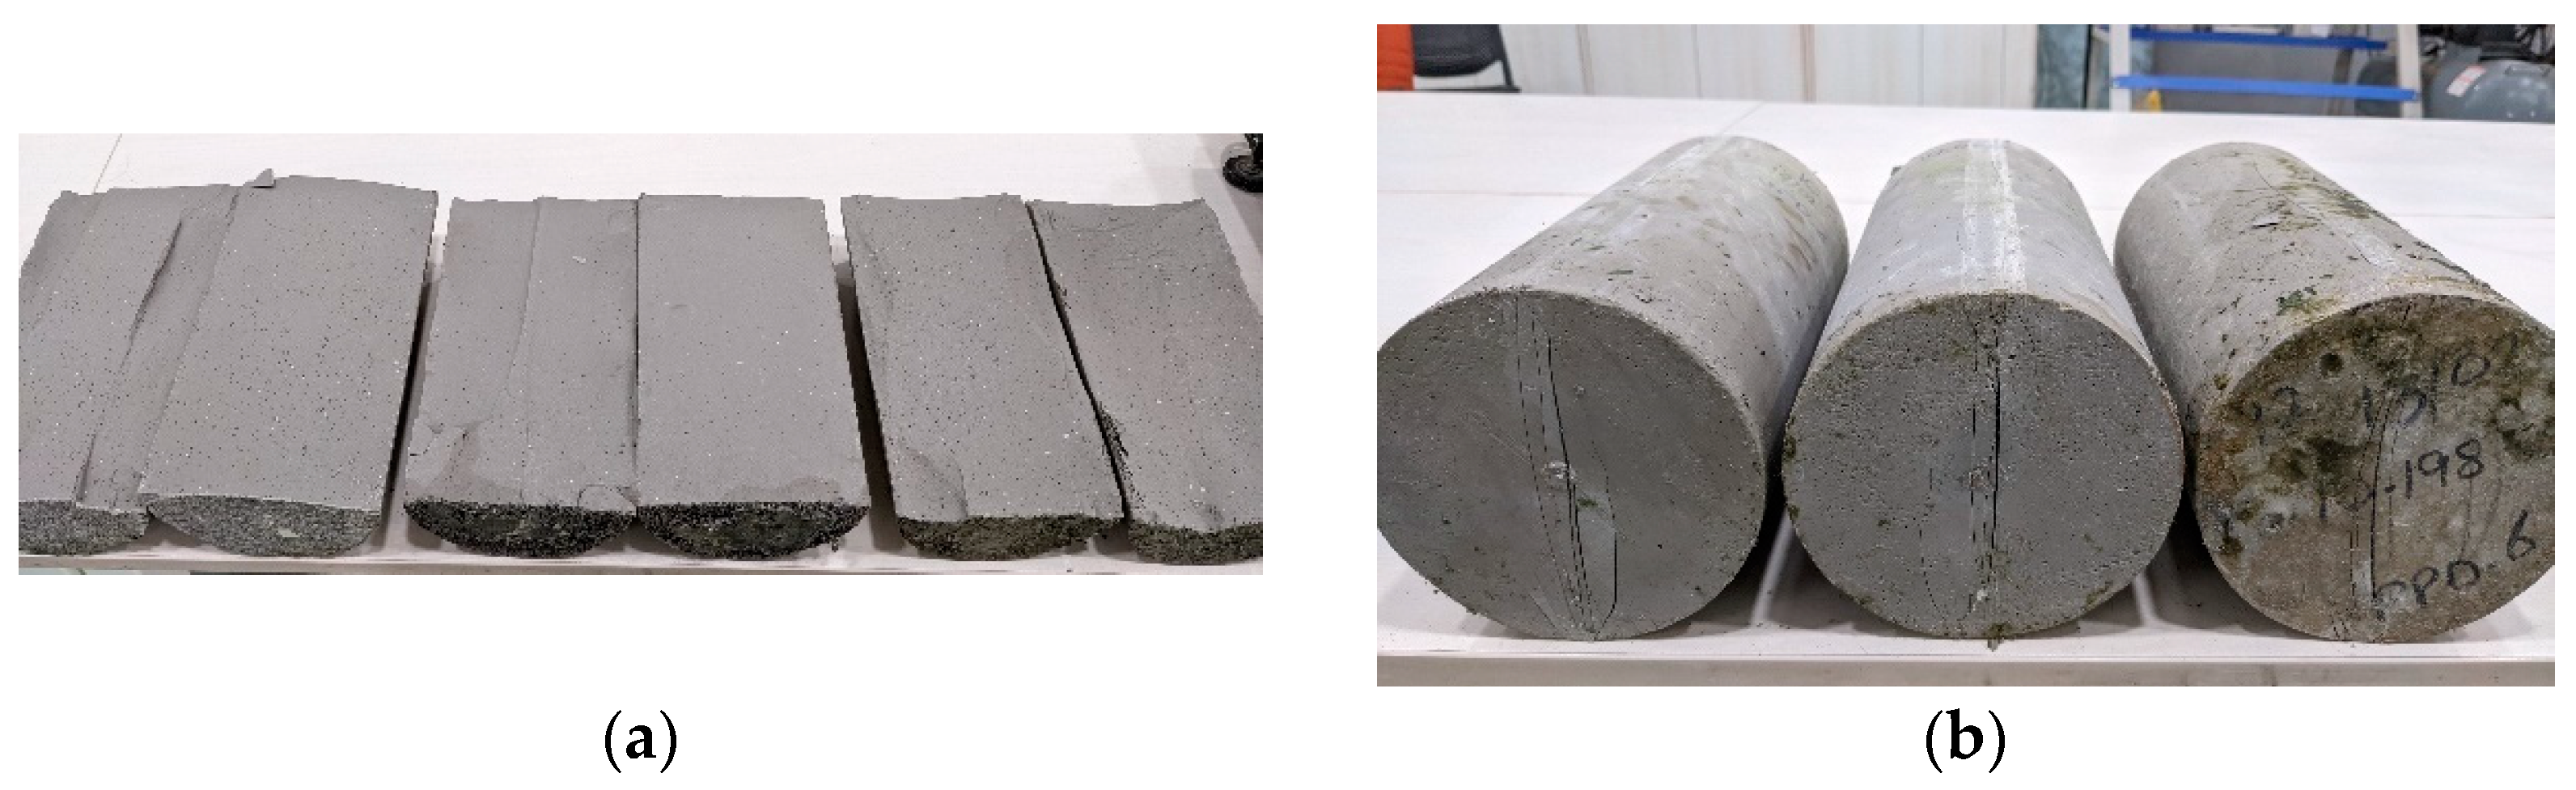
Figure 16.
Sample pictures of specimen failure due to tensile stress for (a) PPF0 and (b) PPF1.0.
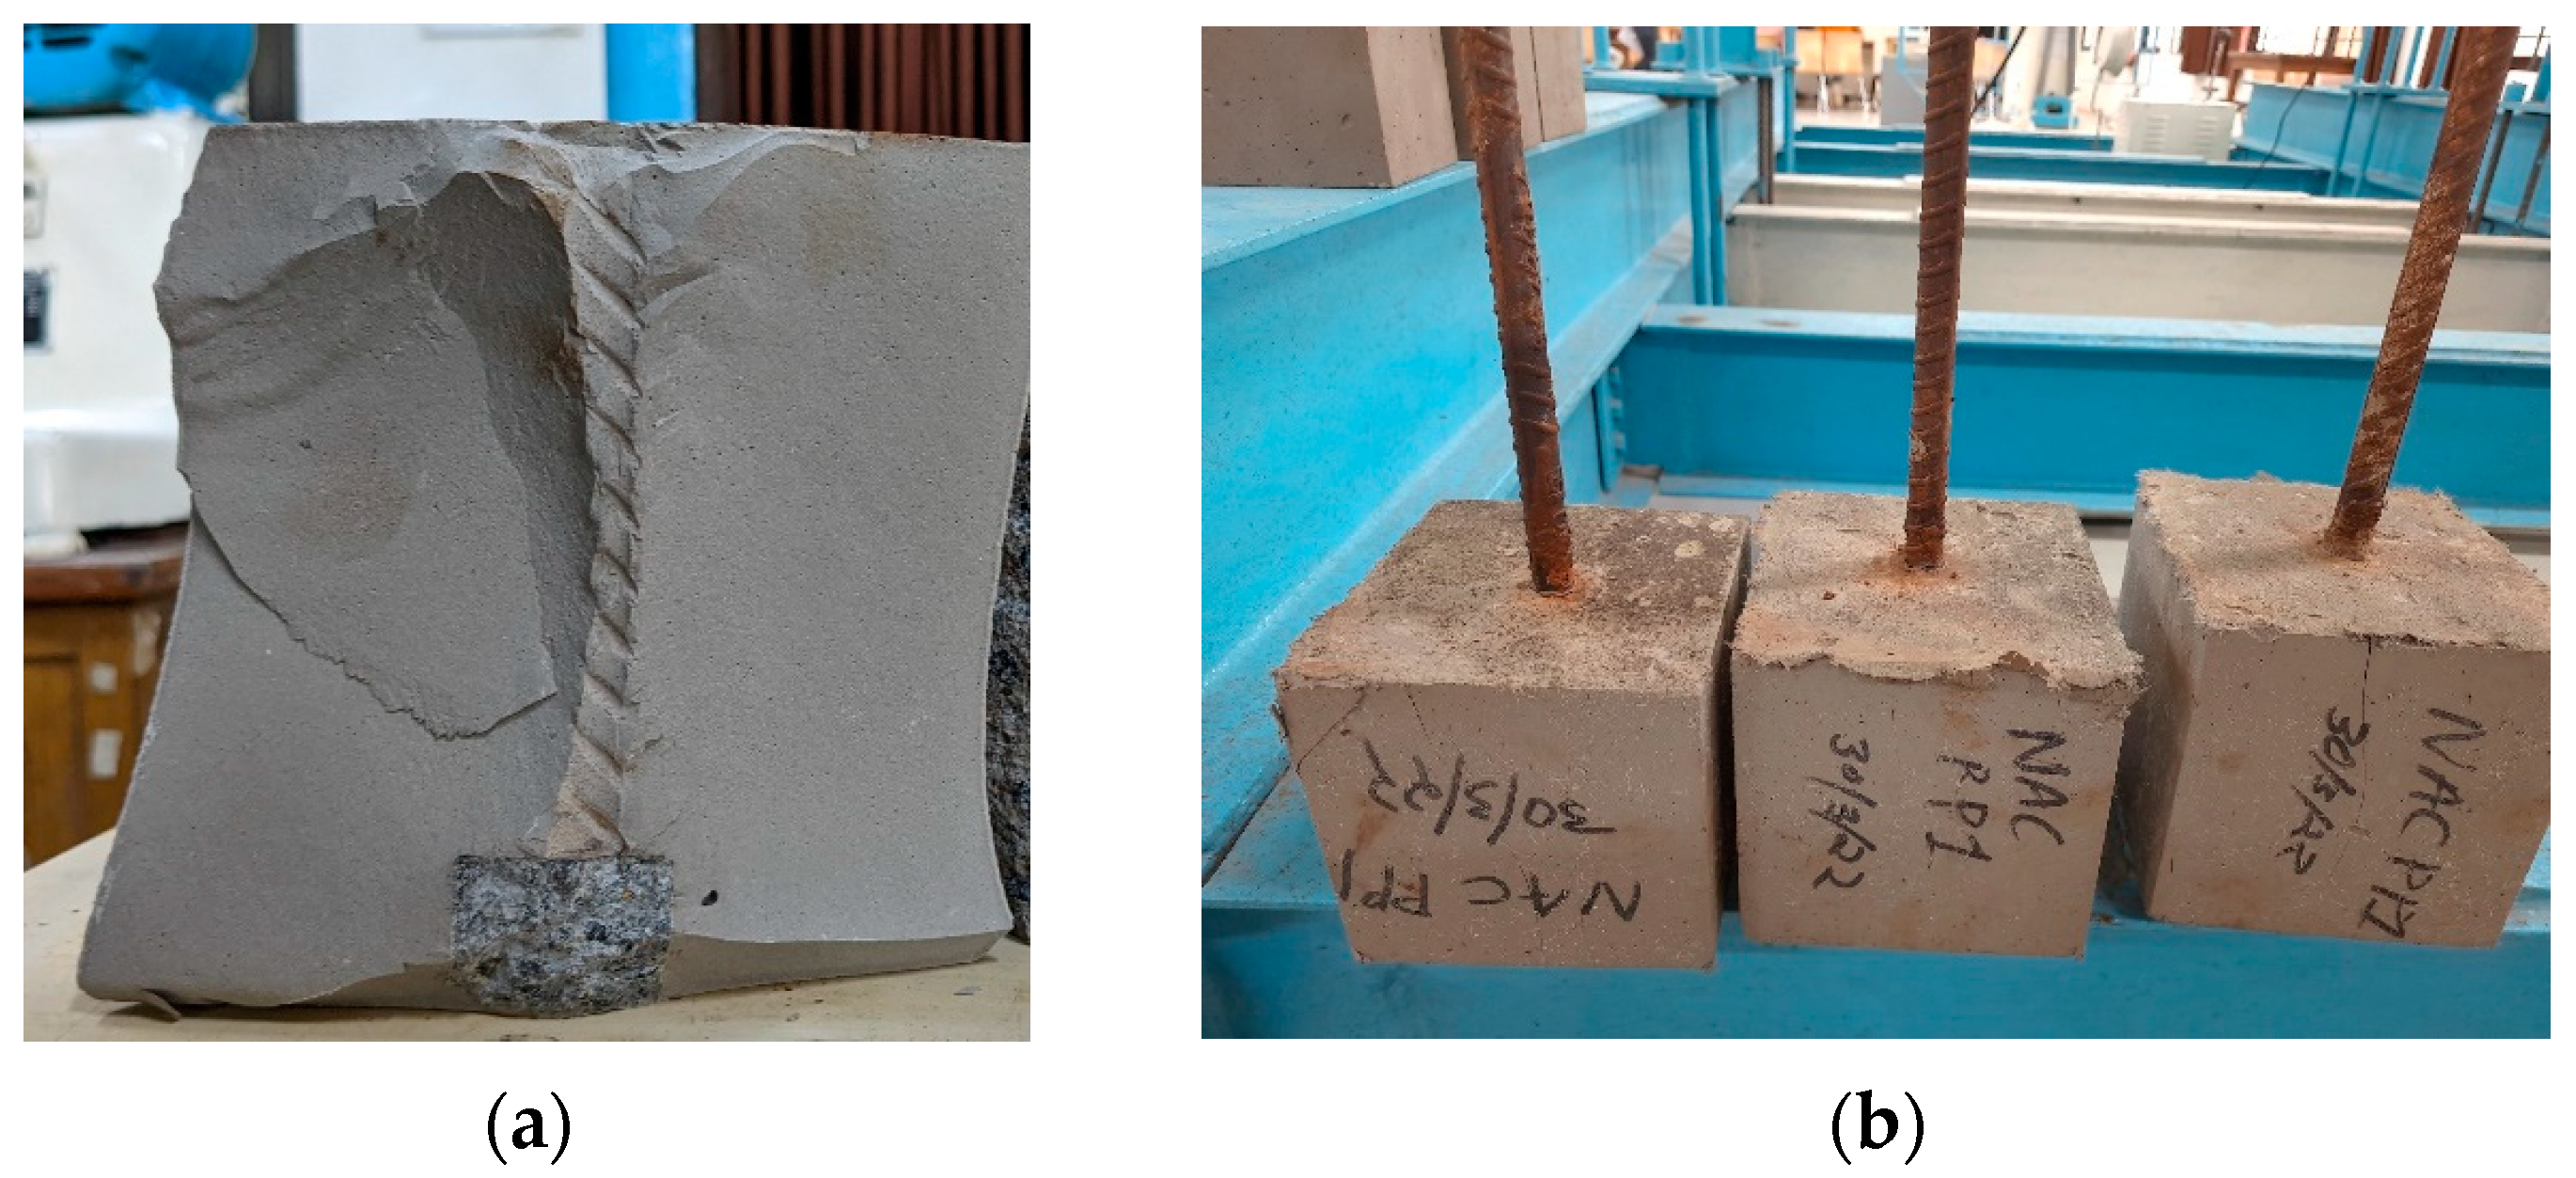
Figure 17.
SEM images of PPF0 mix at (a) 28 days, (b) 90 days, (c) one year, and (d) three years.
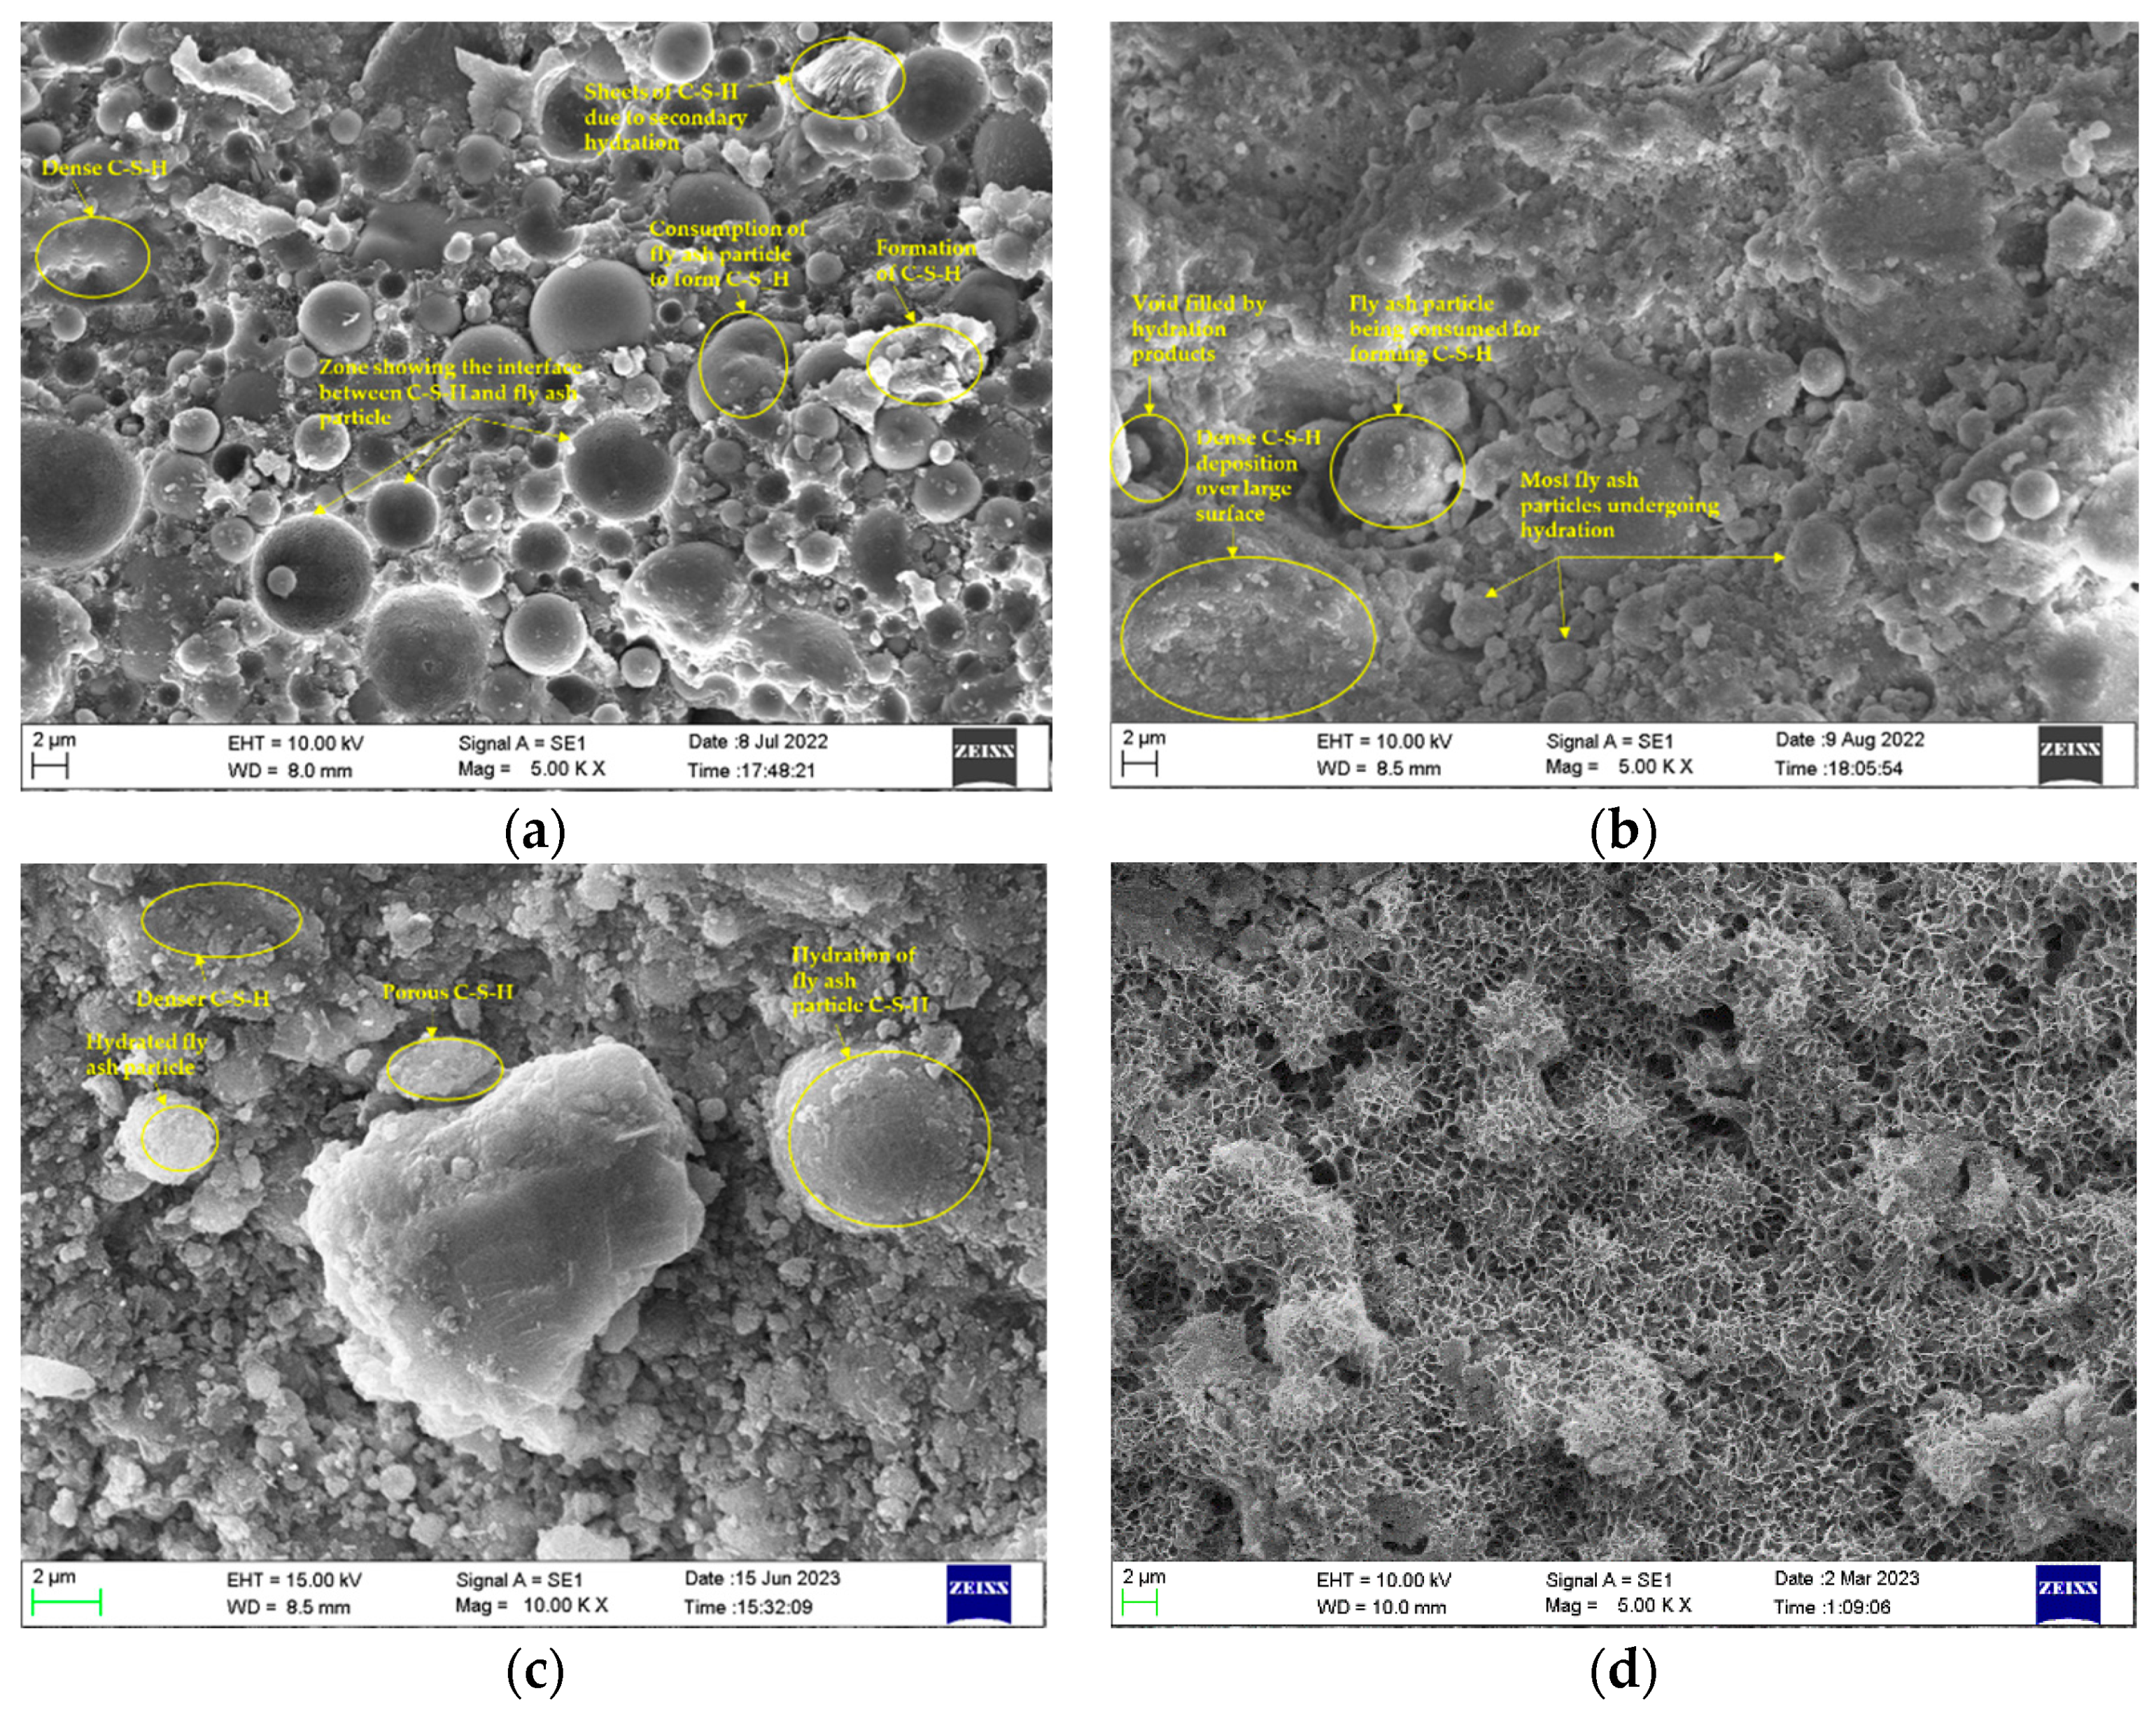
Figure 18.
EDS images of PPF0 mix at 28 days (a), 90 days (b), one year (c), and three years (d) of curing age.
Figure 18.
EDS images of PPF0 mix at 28 days (a), 90 days (b), one year (c), and three years (d) of curing age.

Table 1.
Physical characteristics of binders.
| Material | Particulars | Obtained Results | Reference Code | Acceptable Limit | Conformity |
|---|---|---|---|---|---|
| OPC 43 | Fineness dry sieve (90 µm) | 7.2% | IS 4031-1 [54] | <10% | √ |
| Normal consistency | @ 30% | IS 4031-4 [55] | - | √ | |
| Specific gravity | 3.15 | IS 4031-11 [56] | 2.9–3.15 | √ | |
| Setting time (min) | IS 4031-5 [57] | √ | |||
| Initial | 200 min | 30 min (min) | |||
| Final | 295 min | 600 min (max) | |||
| Compressive strength (MPa) | IS 4031-6 [58] | √ | |||
| 72 ± 1 h | 29.09 | 23 | |||
| 168 ± 2 h | 35.11 | 33 | |||
| 672 ± 4 h | 44.14 | 43 | |||
| F-FA | Fineness # | 12% | IS 1727-1967 [59] | 34% [60] | √ |
| Specific gravity | 2.10 | - | √ | ||
| Consistency | 31% | IS 1727-1967 [55,59] | - | √ | |
| Initial setting time Final setting time | 285 min 320 min | IS 1727-1967 [57,59] | - | √ | |
| Compressive strength (MPa) | 47.03 | IS 1727-1967 [59] | √ | ||
| Compressive strength (MPa) for 80:20 (OPC: F-FA) | 49.6 | - | √ | ||
| PAI * | 1.054 | - | √ |
* Pozzolanic activity index. # Wet sieve residue.
Table 2.
Chemical characteristics of F-FA.
| Chemical Composition | % By Mass |
|---|---|
| SiO2 | 61.18 |
| Al2O3 | 24.98 |
| Fe2O3 | 4.47 |
| CaO | 3.08 |
| MgO | 1.77 |
| K2O | 0.94 |
| SO3 | 0.31 |
| Na2O | 0.28 |
| Cl | 0.005 |
| LoA | 0.20 |
Table 3.
Mix proportions (kg/m3) for the control and test groups.
| Mix Designation | OPC | F-FA | w/b Ratio | Superplasticizer | PPF (%) |
|---|---|---|---|---|---|
| PPF0 | 325 | 1300 | 0.14–0.16 | 6.5 | 0 |
| PPF0.6 | 325 | 1300 | 0.14–0.16 | 6.5 | 0.6 |
| PPF0.8 | 325 | 1300 | 0.14–0.16 | 6.5 | 0.8 |
| PPF1.0 | 325 | 1300 | 0.14–0.16 | 6.5 | 1.0 |
Table 4.
Details of tests, standards, and the number of specimens.
| Test | IS Code | Sample Form | Size (mm) | Total No. |
|---|---|---|---|---|
| Compressive strength | IS 516: 1959 [61] | Cube | 100 × 100 × 100 | 112 |
| UPV | IS 516 (Part 5): 2018 [62] | |||
| Flexural strength | IS 516: 1959 [61] | Prism | 500 × 100 × 100 | 72 |
| Splitting tensile strength | IS 5816: 1999 [63] | Cylinder | 150 d × 300 h | 60 |
| Pull-out strength | IS: 2770 Part-1 1967 [64] | Cube | 150 × 150 × 150 | 48 |
| Sorptivity | ASTM:1585 [65] | Cylinder | 100 d × 50 h | 12 |
d—diameter, h—height of the specimen.
Table 5.
Initial and secondary absorption coefficients.
| Mix Designation | Initial Absorption Rate (×10−3 mm/√s) | Secondary Absorption Rate (×10−3 mm/√s) |
|---|---|---|
| PPF0 | 0.42 | 0.34 |
| PPF0.6 | 0.58 | 0.28 |
| PPF0.8 | 0.30 | 0.16 |
| PPF1.0 | 0.23 | 0.15 |
Table 6.
EDS analysis of PPF0 mix at various curing ages.
| Elements in Weight % | Ca | Si | Al | Ca/Si | Ca/Al | Ca/(Si + Al) | Al/Si |
|---|---|---|---|---|---|---|---|
| 28 days | 7.14 | 11.68 | 6.75 | 0.61 | 1.05 | 0.38 | 0.57 |
| 90 days | 5.60 | 12.36 | 7.91 | 0.45 | 0.70 | 0.27 | 0.63 |
| One year | 4.20 | 11.40 | 7.17 | 0.36 | 0.58 | 0.22 | 0.62 |
| Three years | 4.44 | 13.02 | 6.84 | 0.34 | 0.64 | 0.22 | 0.52 |
Disclaimer/Publisher’s Note: The statements, opinions and data contained in all publications are solely those of the individual author(s) and contributor(s) and not of MDPI and/or the editor(s). MDPI and/or the editor(s) disclaim responsibility for any injury to people or property resulting from any ideas, methods, instructions or products referred to in the content. |
© 2023 by the authors. Licensee MDPI, Basel, Switzerland. This article is an open access article distributed under the terms and conditions of the Creative Commons Attribution (CC BY) license (https://creativecommons.org/licenses/by/4.0/).
Share and Cite
MDPI and ACS Style
Kudva, L.P.; Nayak, G.; Shetty, K.K.; Sugandhini, H.K. Mechanical Properties of Fiber-Reinforced High-Volume Fly-Ash-Based Cement Composite—A Long-Term Study. Sustainability 2023, 15, 13128. https://doi.org/10.3390/su151713128
AMA Style
Kudva LP, Nayak G, Shetty KK, Sugandhini HK. Mechanical Properties of Fiber-Reinforced High-Volume Fly-Ash-Based Cement Composite—A Long-Term Study. Sustainability. 2023; 15(17):13128. https://doi.org/10.3390/su151713128
Chicago/Turabian StyleKudva, Laxman P., Gopinatha Nayak, Kiran K. Shetty, and H. K. Sugandhini. 2023. "Mechanical Properties of Fiber-Reinforced High-Volume Fly-Ash-Based Cement Composite—A Long-Term Study" Sustainability 15, no. 17: 13128. https://doi.org/10.3390/su151713128
Note that from the first issue of 2016, this journal uses article numbers instead of page numbers. See further details here.