


Study of Potential Impact of Wind Energy on Electricity Price Using Regression Techniques
 , and
, and 
Abstract
:1. Introduction
- To analyze the effect of wind energy generation on electricity prices using regression methods;
- A detailed analysis of the data to explore the relationship between the two variables;
- Use of real-time data on Austria’s electricity market;
- Implementation of multiple regression models (LR, RF, LASSO, and DT) to validate the performance;
- Hyperparameter tuning work has been performed by adjusting the values of the hyperparameters of a model in order to minimize the training error and maximize the model performance on a given dataset.
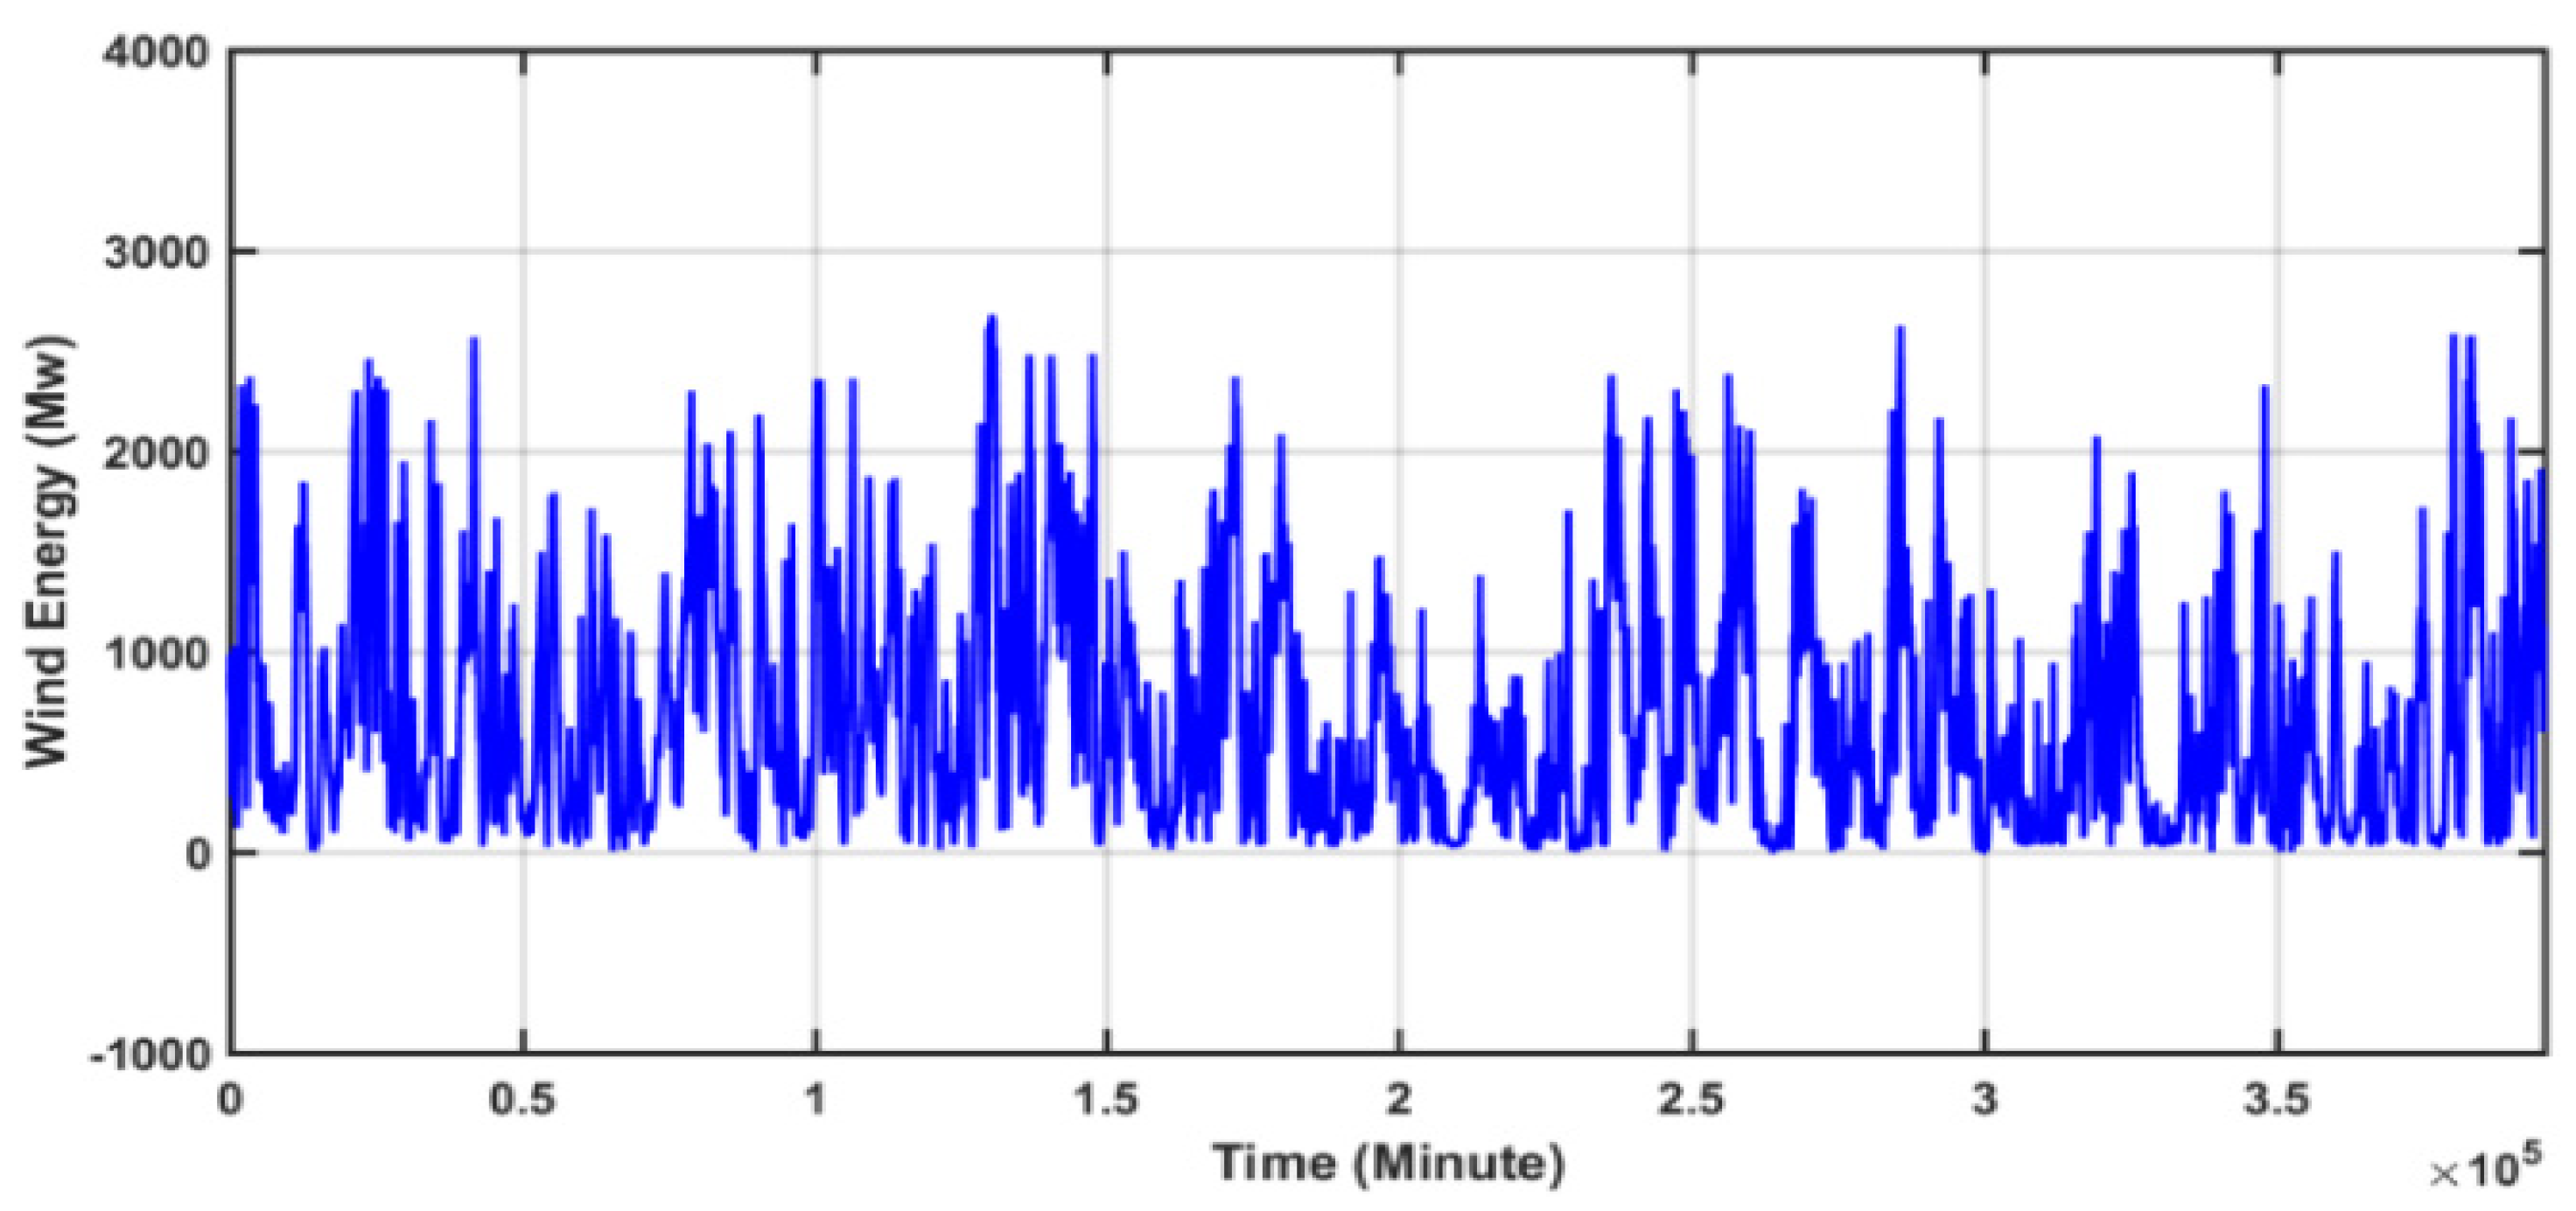
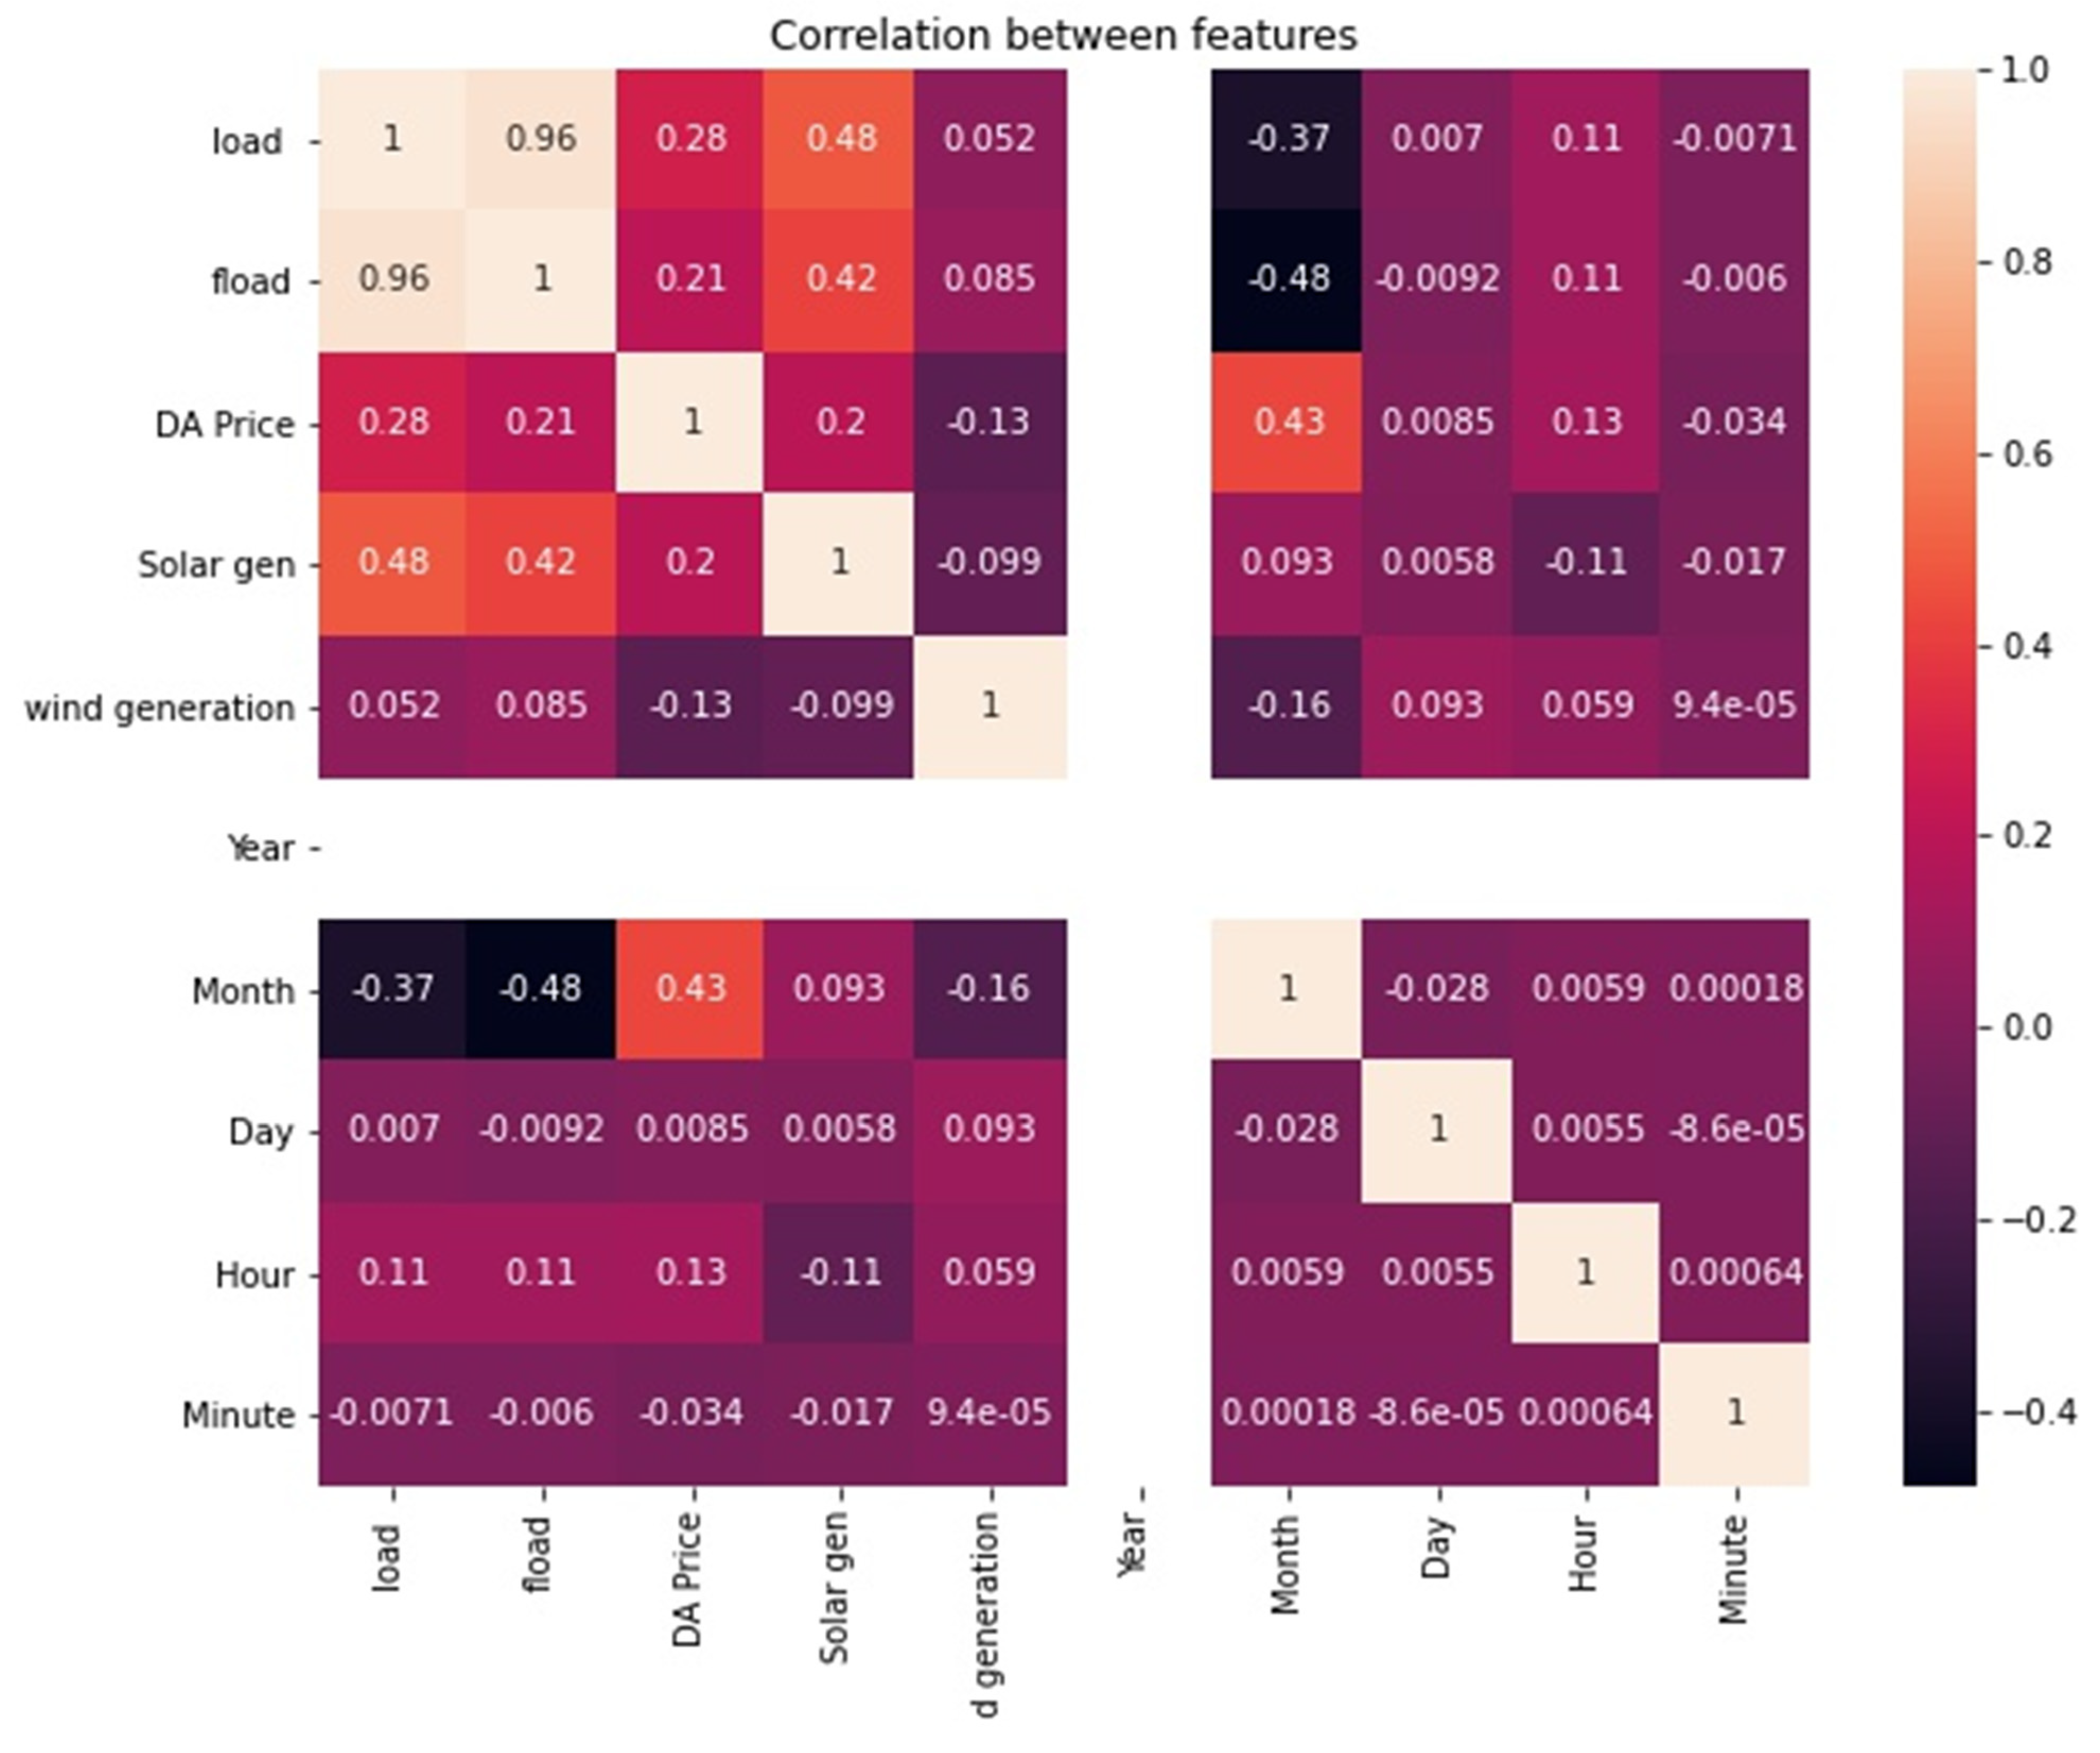
2. Data Analysis
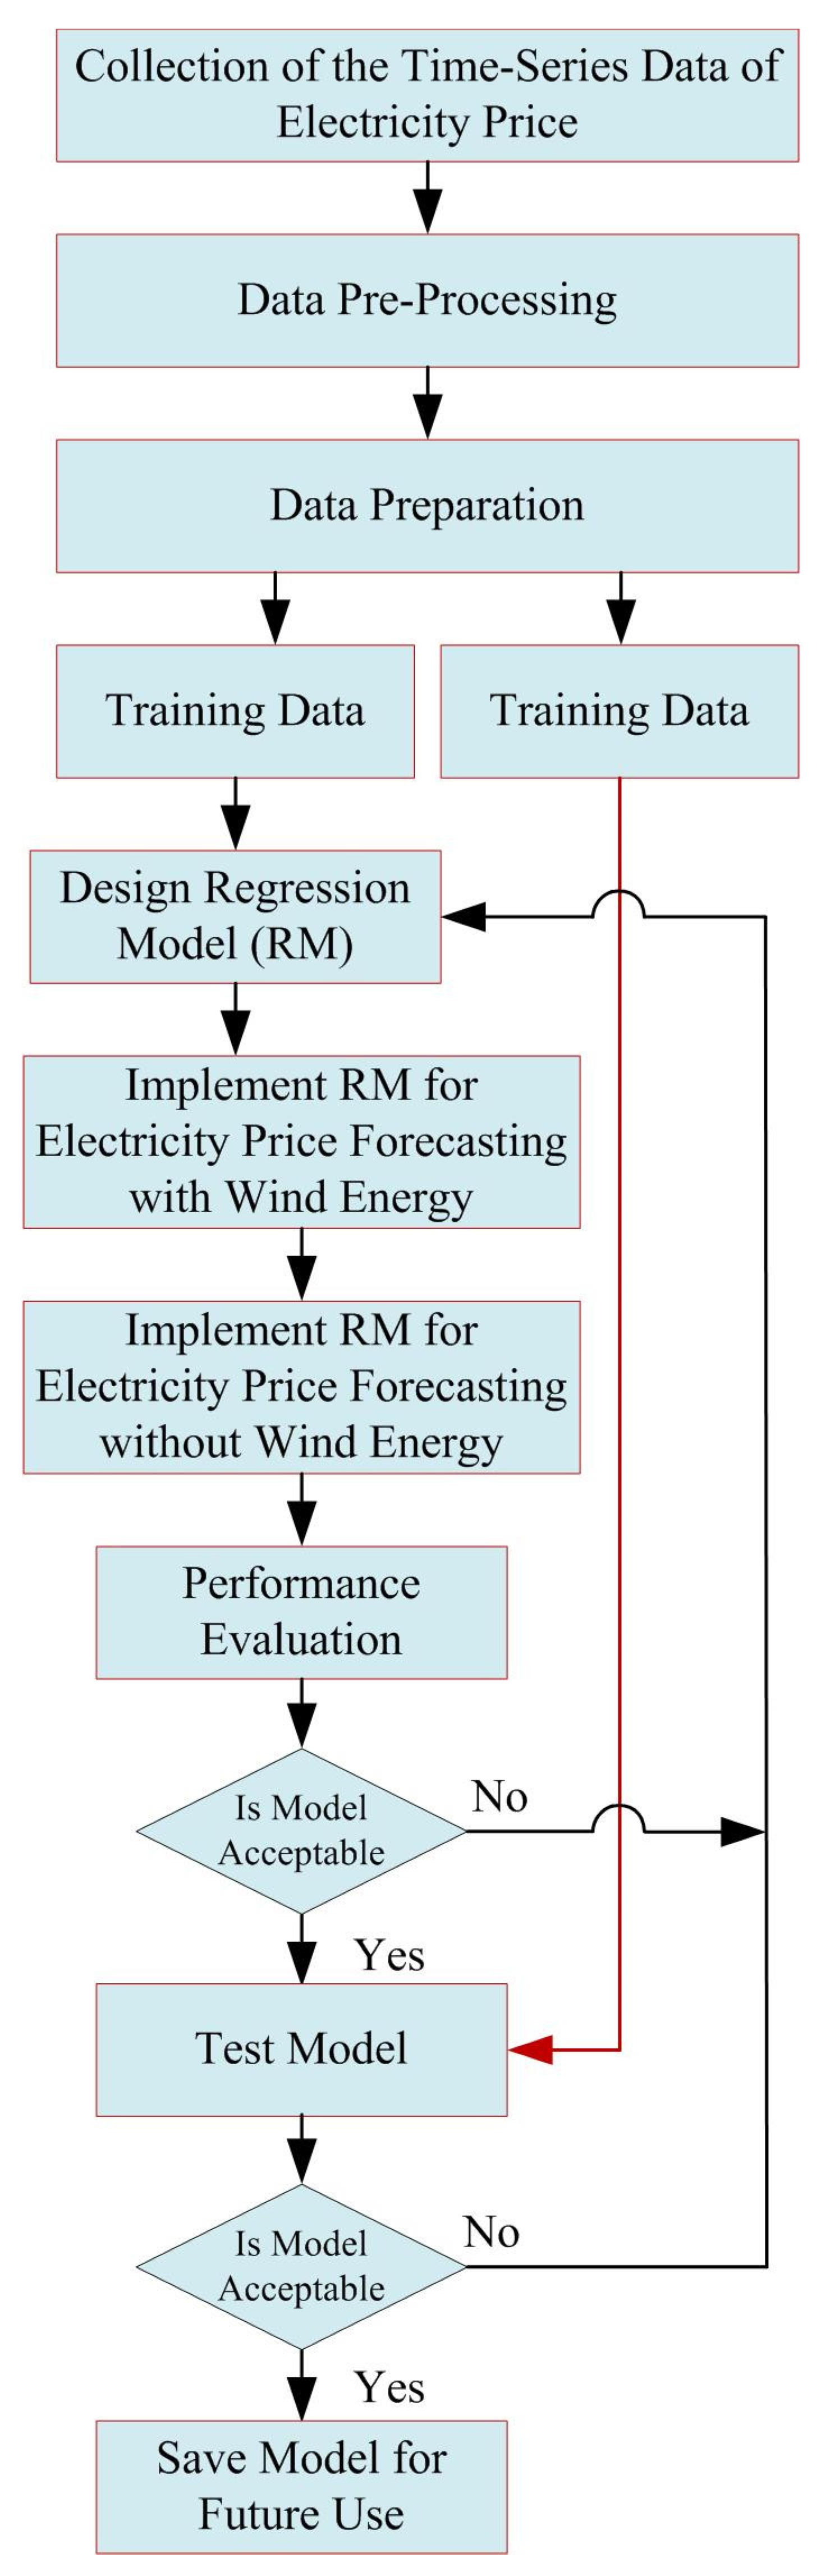
3. Methodology
3.1. Decision Tree
3.2. Random Forest
3.3. Linear Regression
3.4. LASSO
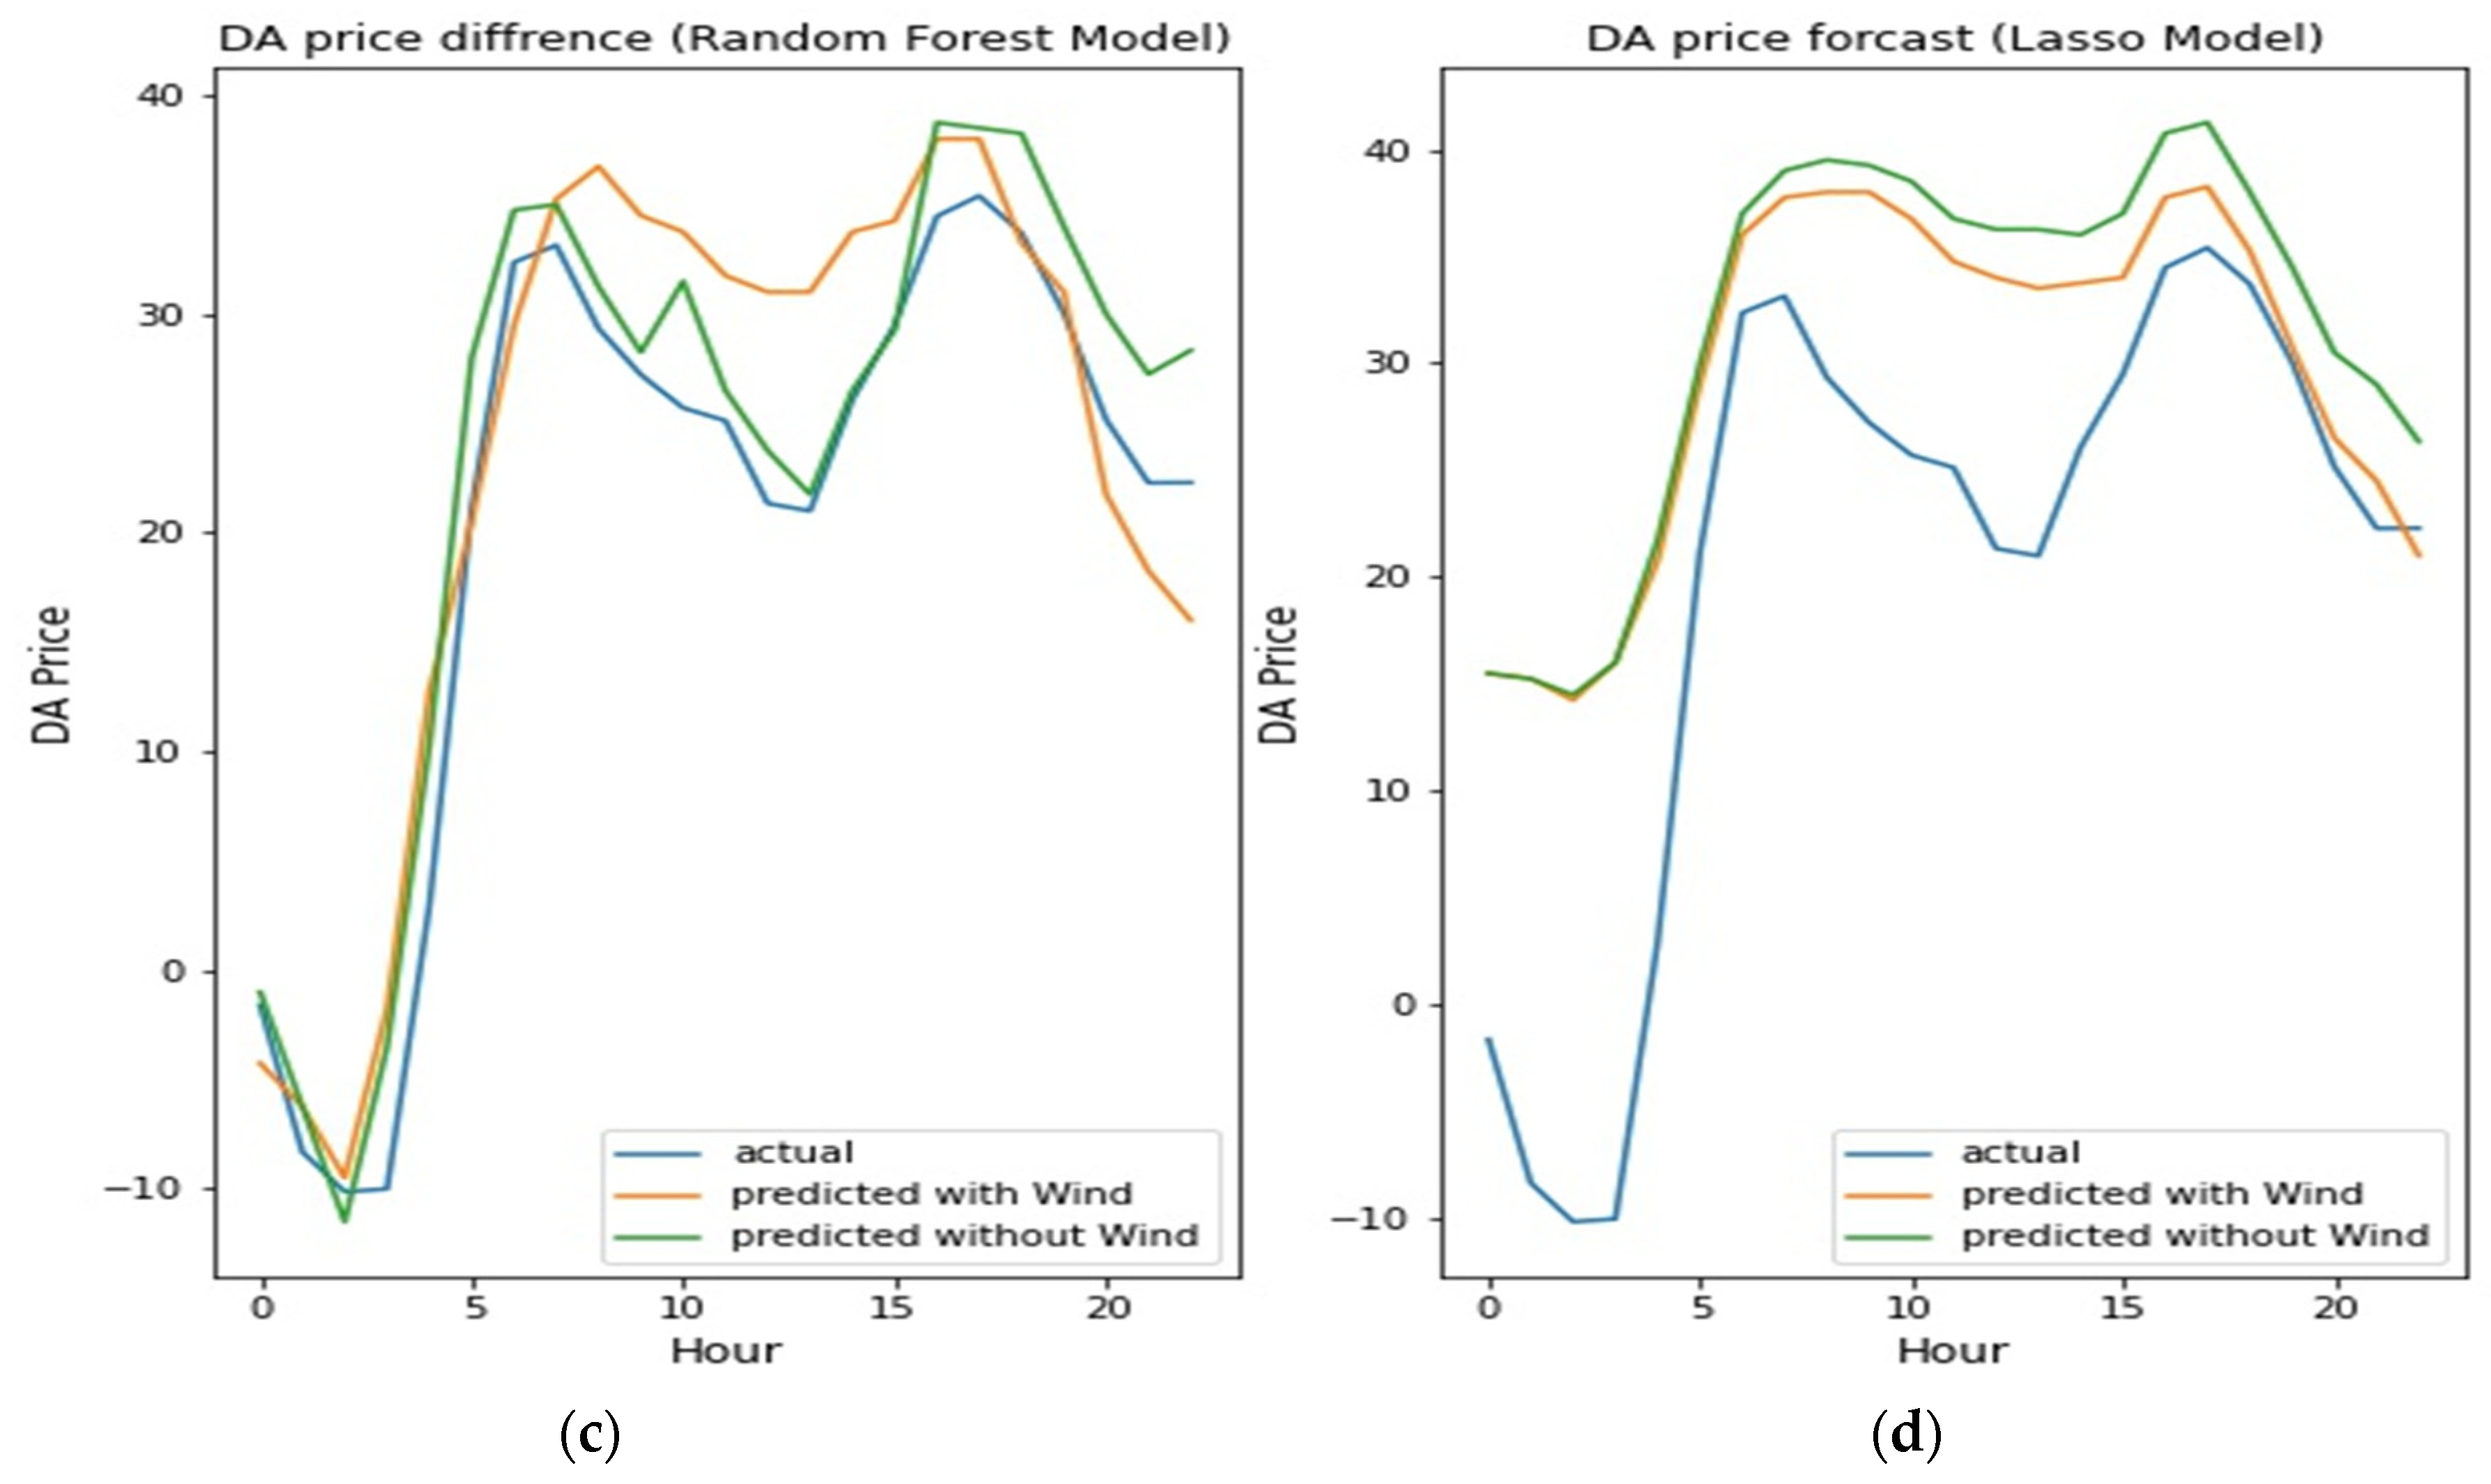
4. Results and Discussion
5. Conclusions and Future Scope
Author Contributions
Funding
Institutional Review Board Statement
Informed Consent Statement
Data Availability Statement
Acknowledgments
Conflicts of Interest
References
- Ziel, F. Modeling the impact of wind and solar power forecasting errors on intraday electricity prices. In Proceedings of the 2017 14th International Conference on the European Energy Market (EEM), Dresden, Germany, 6–9 June 2017; pp. 1–5. [Google Scholar] [CrossRef]
- International Renewable Energy Agency. Available online: https://www.irena.org/wind (accessed on 1 January 2023).
- Global wind Energy Council. Available online: https://www.worldenergy.org/ (accessed on 22 January 2023).
- Zamani-Dehkordi, P.; Rakai, L.; Zareipour, H. Estimating the Price Impact of Proposed Wind Farms in Competitive Electricity Markets. IEEE Trans. Sustain. Energy 2017, 8, 291–303. [Google Scholar] [CrossRef]
- Woo, C.; Zarnikau, J.; Kadish, J.; Horowitz, I.; Wang, J.; Olson, A. The Impact of Wind Generation on Wholesale Electricity Prices in the Hydro-Rich Pacific Northwest. IEEE Trans. Power Syst. 2013, 28, 4245–4253. [Google Scholar] [CrossRef]
- Nuño, E.; Pereira, A.J.C.; Ferreira, C.M.M. Impact of variable renewable energy in the Iberian Electricity Market. In Proceedings of the 2015 50th International Universities Power Engineering Conference (UPEC), Stoke on Trent, UK, 1–4 September 2015; pp. 1–6. [Google Scholar] [CrossRef]
- Gill, F.M. Impacts and best practices of large-scale wind power integration into electricity markets—Some Australian perspectives. In Proceedings of the 2012 IEEE Power and Energy Society General Meeting, San Diego, CA, USA, 22–26 July 2012; pp. 1–6. [Google Scholar] [CrossRef]
- Kou, L.; Li, Y.; Zhang, F.; Gong, X.; Hu, Y.; Yuan, Q.; Ke, W. Review on Monitoring, Operation and Maintenance of Smart Offshore Wind Farms. Sensors 2022, 22, 2822. [Google Scholar] [CrossRef] [PubMed]
- Carlo, B.M.-A.; Greg, B.; Bri-Mathias, H. The impact of wind power on electricity prices. Renew. Energy 2016, 94, 474–487. [Google Scholar] [CrossRef]
- Available online: https://www.wind-energy-the-facts.org/the-impact-of-wind-power-on-the-power-market-dk-case.html (accessed on 25 December 2022).
- Meneguzzo, F.; Ciriminna, R.; Pagliaro, M. The remarkable impact of renewable energy generation in Sicily onto electricity price formation in Italy. Energy Sci. Eng. 2016, 4, 194–204. [Google Scholar] [CrossRef]
- Pereira, J.P.; Rodrigues, P.M.M. The impact of wind generation on the mean and volatility of electricity prices in Portugal. In Proceedings of the 2015 12th International Conference on the European Energy Market (EEM), Lisbon, Portugal, 19–22 May 2015; pp. 1–5. [Google Scholar] [CrossRef]
- Green, R.; Vasilakos, N. Market behaviour with large amounts of intermittent generation. Energy Policy 2010, 38, 3211–3220. [Google Scholar] [CrossRef]
- Masoumzadeh, A.; Nekouei, E.; Alpcan, T. Wind Versus Storage Allocation for Price Management in Wholesale Electricity Markets. IEEE Trans. Sustain. Energy 2020, 11, 817–827. [Google Scholar] [CrossRef]
- Maciejowska, K. Assessing the impact of renewable energy sources on the electricity price level and variability—A quantile regression approach. Energy Econ. 2020, 85, 104532. [Google Scholar] [CrossRef]
- Vu, D.H.; Muttaqi, K.M.; Agalgaonkar, A.P.; Bouzerdoum, A. Short-Term Forecasting of Electricity Spot Prices Containing Random Spikes Using a Time-Varying Autoregressive Model Combined With Kernel Regression. IEEE Trans. Ind. Inform. 2019, 15, 5378–5388. [Google Scholar] [CrossRef]
- Saini, L.M.; Aggarwal, S.K.; Kumar, A. Parameter optimisation using genetic algorithm for support vector machine-based price-forecasting model in National electricity market. IET Gener. Transm. Distrib. 2010, 4, 36–49. [Google Scholar] [CrossRef]
- Acaroğlu, H.; García Márquez, F.P. Comprehensive Review on Electricity Market Price and Load Forecasting Based on Wind Energy. Energies 2021, 14, 7473. [Google Scholar] [CrossRef]
- Aineto, D.; Iranzo-Sánchez, J.; Lemus-Zúñiga, L.G.; Onaindia, E.; Urchueguía, J.F. On the Influence of Renewable Energy Sources in Electricity Price Forecasting in the Iberian Market. Energies 2019, 12, 2082. [Google Scholar] [CrossRef]
- Owolabi, O.O.; Schafer, T.L.J.; Smits, G.E.; Sengupta, S.; Ryan, S.E.; Wang, L.; Matteson, D.S.; Sherman, M.G.; Sunter, D.A. Role of Variable Renewable Energy Penetration on Electricity Price and its Volatility across Independent System Operators in the United States. Data Sci. Sci. 2023, 2, 2158145. [Google Scholar] [CrossRef]
- Kumar, N.; Tripathi, M.M. Investigation on Effect of Solar Energy Generation on Electricity Price Forecasting. J. Intell. Fuzzy Syst. 2022, 42, 1185–1197. [Google Scholar] [CrossRef]
- Oosthuizen, A.M.; Inglesi-Lotz, R.; Thopil, G.A. The relationship between renewable energy and retail electricity prices: Panel evidence from OECD countries. Energy 2022, 238 Pt B, 121790. [Google Scholar] [CrossRef]
- Meng, A.; Wang, P.; Zhai, G.; Zeng, C.; Chen, S.; Yang, X.; Yin, H. Electricity price forecasting with high penetration of renewable energy using attention-based LSTM network trained by crisscross optimization. Energy 2022, 254 Pt A, 124212. [Google Scholar] [CrossRef]
- Yang, H.; Schell, K.R. Real-time electricity price forecasting of wind farms with deep neural network transfer learning and hybrid datasets. Appl. Energy 2021, 299, 117242. [Google Scholar] [CrossRef]
- Trujillo-Baute, E.; del Río, P.; Mir-Artigues, P. Analysing the impact of renewable energy regulation on retail electricity prices. Energy Policy 2018, 114, 153–164. [Google Scholar] [CrossRef]
- Talari, S.; Shafie-khah, M.; Osório, G.J.; Wang, F.; Heidari, A.; Catalão, J.P.S. Price Forecasting of Electricity Markets in the Presence of a High Penetration of Wind Power Generators. Sustainability 2017, 9, 2065. [Google Scholar] [CrossRef]
- Ballester, C.; Furió, D. Effects of renewables on the stylized facts of electricity prices. Renew. Sustain. Energy Rev. 2015, 52, 1596–1609. [Google Scholar] [CrossRef]
- Shcherbakova, A.; Kleit, A.; Blumsack, S.; Cho, J.; Lee, W. Effect of increased wind penetration on system prices in Korea’s electricity markets. Wind Energy 2014, 17, 1469–1482. [Google Scholar] [CrossRef]
- Moreno, B.; López, A.J.; García-Álvarez, M.T. The electricity prices in the European Union. The role of renewable energies and regulatory electric market reforms. Energy 2012, 48, 307–313. [Google Scholar] [CrossRef]
- Höltinger, S.; Salak, B.; Schauppenlehner, T.; Scherhaufer, P.; Schmidt, J. Austria’s wind energy potential—A participatory modeling approach to assess socio-political and market acceptance. Energy Policy 2016, 98, 49–61. [Google Scholar] [CrossRef]
- Available online: https://data.open-power-system-data.org/time_series/2019-05-15 (accessed on 5 December 2022).
- Breiman, L. Random forests. Mach. Learn. 2001, 45, 5–32. [Google Scholar] [CrossRef]
- Yang, F. An Extended Idea about Decision Trees. In Proceedings of the 2019 International Conference on Computational Science and Computational Intelligence (CSCI), Las Vegas, NV, USA, 5–7 December 2019; pp. 349–354. [Google Scholar] [CrossRef]
- Alkawaz, A.N.; Abdellatif, A.; Kanesan, J.; Khairuddin, A.S.M.; Gheni, H.M. Day-Ahead Electricity Price Forecasting Based on Hybrid Regression Model. IEEE Access 2022, 10, 108021–108033. [Google Scholar] [CrossRef]
- Wilson, B.; Dhas, J.P.M.; Sreedharan, R.M.; Krish, R.P. Ensemble learning-based classification on local patches from magnetic resonance images to detect iron depositions in the brain. Int. J. Bio-Inspired Comput. 2021, 17, 260–266. [Google Scholar] [CrossRef]
- Panigrahi, S.S.; Mantri, J.K. A text based Decision Tree model for stock market forecasting. In Proceedings of the 2015 International Conference on Green Computing and Internet of Things (ICGCIoT), Noida, Delhi, India, 8–10 October 2015; pp. 405–411. [Google Scholar] [CrossRef]
- Yan, X.; Su, X.G. Linear Regression Analysis; World Scientific Publishing: Singapore, 2009. [Google Scholar]
- Montgomery, D.C.; Peck, E.A.; Vining, G.G. Introduction to Linear Regression Analysis, 5th ed.; John Wiley & Sons: Hoboken, NJ, USA, 2012. [Google Scholar]
- Sangani, D.; Erickson, K.; Hasan, M.A. Predicting Zillow Estimation Error Using Linear Regression and Gradient Boosting. In Proceedings of the 2017 IEEE 14th International Conference on Mobile Ad Hoc and Sensor Systems (MASS), Orlando, FL, USA, 22–25 October 2017; pp. 530–534. [Google Scholar] [CrossRef]
- Arribas-Gil; Bertin, K.; Meza, C.; Rivoirard, V. Lasso-type Estimators for Semiparametric Nonlinear Mixed-Effects Models Estimation. Stat. Comput. 2014, 24, 443–460. [Google Scholar] [CrossRef]
- Boulesteix, A.-L.; De Bin, R.; Jiang, X.; Fuchs, M. IPF-LASSO: Integrative-Penalized Regression with Penalty Factors for Prediction Based on Multi- Omics Data. Comput. Math. Methods Med. 2017, 2017, 7691937. [Google Scholar] [CrossRef]
- Fragkioudaki, A.; Marinakis, A.; Cherkaoui, R. Forecasting price spikes in European day-ahead electricity markets using decision trees. In Proceedings of the 2015 12th International Conference on the European Energy Market (EEM), Lisbon, Portugal, 19–22 May 2015; pp. 1–5. [Google Scholar] [CrossRef]


| Ref No. | Authors Name | Title of the Paper | Year | Method Used | Remark |
|---|---|---|---|---|---|
| 1 | Olukunle O. Owolabi et al. [20] | Role of Variable Renewable Energy Penetration on Electricity Price and its Volatility across Independent System Operators in the United States | 2023 | Quantile Regression techniques | Merit order effect on price and linearity effect has been considered |
| 2 | Kumar, Neeraj and Tripathi, M.M. [21] | Investigation on Effect of Solar Energy Generation on Electricity Price Forecasting | 2022 | LSTM | Effect of solar energy penetration on electricity price has been investigated |
| 3. | Anna Maria Oosthuizen, Roula Inglesi-Lotz, George Alex Thopil [22] | The relationship between renewable energy and retail electricity prices: Panel evidence from OECD countries | 2022 | Empirical results were presented (panel unit test) | Investigation of wind energy penetration on electricity price for 34 OECD countries were conducted |
| 4 | Anbo Meng et al. [23] | Electricity price forecasting with high penetration of renewable energy using attention-based LSTM network trained by crisscross optimization | 2022 | LSTM | Empirical wavelet transform and crisscross optimization is used to decompose the data features and retrain the data |
| 5. | Haolin Yang, Kristen R. Schell [24] | Real-time electricity price forecasting of wind farms with deep neural network transfer learning and hybrid datasets | 2021 | DNN | GRU transfer learning concept is used for improving the forecasting accuracy |
| 6. | Elisa Trujillo-Baute, Pablo del Río, Pere Mir-Artigues [25] | Analysing the impact of renewable energy regulation on retail electricity prices | 2018 | Statistical analysis | The impact on retail electricity prices is positive and statistically significant, although relatively small |
| 7 | Talari, S. et al. [26] | Price Forecasting of Electricity Markets in the Presence of a High Penetration of Wind Power Generators. | 2017 | Bivariate ARIMA-Wavelet and RBFN | Large scale wind generator effects on electricity price have been considered |
| 8. | Cristina Ballester, Dolores Furió [27] | Effects of renewables on the stylized facts of electricity prices | 2015 | Statistical and empirical analysis has been presented | Statistically negative relationship between wind energy share and marginal price has been derived |
| 9 | Shcherbakova, A. et al. [28] | Effect of increased wind penetration on system prices in Korea’s electricity markets | 2014 | Seasonal correlation between wind output and load | Statistical analysis on wind energy penetration on system marginal price has been performed |
| 10 | Blanca Moreno, Ana J. López, María Teresa García-Álvarez [29] | The electricity prices in the European Union. The role of renewable energies and regulatory electric market reforms | 2012 | Empirical analysis | Deployment of RES increases prices paid by consumers in a liberalized market |
| Name of Parameter | Electricity Price | Wind Power |
|---|---|---|
| No. of samples | 26,393 | 26,393 |
| Time interval in the dataset | 15 min | 15 min |
| No. of missing data | 0 | 0 |
| The mean value of the data | 41.84024 | 658.2215 |
| Root mean square deviation | 19.13648 | 583.0336 |
| Minimum | −149.99 | 0 |
| Maximum | 977 | 2678 |
| Dissymmetry | 4.115555 | 1.052050 |
| Kurtosis | 225.2525 | 0.389035 |
| The Objective of the Learning Task | Regression Model |
|---|---|
| Tuning linear model | Regression tree |
| No. of tree | 100 |
| Maximum depth of tree | 6 |
| Minimum sample at leaf node | 4 |
| Parameter tuning | Grid search with 5-Fold CV |
| The Objective of the Learning Task | Regression Model |
|---|---|
| Tuning linear model | Random forest regression |
| Maximum depth of tree | 10 |
| Minimum sample at leaf node | 8 |
| Parameter tuning | Grid search with 5-Fold CV |
| The Objective of the Learning Task | Regression Model |
|---|---|
| Tuning linear model | Linear Regression |
| Fit_intercept | true |
| Copy_X | true |
| normalize | false |
| Objective for Learning Task | LASSO L1 Regularizer for the Linear Model |
|---|---|
| Tuning linear model | Lasso Regression |
| Fit_intercept | True |
| Copy_X | True |
| Alpha regularization parameter | 1 |
| Normalize | True |
| Forecasting Matrices | Proposed Models | |||
|---|---|---|---|---|
| DT | RF | LASSO | LR | |
| MAE without considering Wind | 2.08 | 4.81 | 8.89 | 10.82 |
| MAE considering wind | 2.20 | 3.50 | 10.82 | 12.01 |
| RMSE without considering wind | 6.19 | 5.76 | 15.51 | 15.69 |
| RMSE considering wind | 2.08 | 4.06 | 14.62 | 14.93 |
| MAPE without considering wind | 6.01 | 12.01 | 23.10 | 25.30 |
| MAPE considering wind | 5.80 | 10.91 | 22.20 | 24.50 |
Disclaimer/Publisher’s Note: The statements, opinions and data contained in all publications are solely those of the individual author(s) and contributor(s) and not of MDPI and/or the editor(s). MDPI and/or the editor(s) disclaim responsibility for any injury to people or property resulting from any ideas, methods, instructions or products referred to in the content. |
© 2023 by the authors. Licensee MDPI, Basel, Switzerland. This article is an open access article distributed under the terms and conditions of the Creative Commons Attribution (CC BY) license (https://creativecommons.org/licenses/by/4.0/).
Share and Cite
Kumar, N.; Tripathi, M.M.; Gupta, S.; Alotaibi, M.A.; Malik, H.; Afthanorhan, A. Study of Potential Impact of Wind Energy on Electricity Price Using Regression Techniques. Sustainability 2023, 15, 14448. https://doi.org/10.3390/su151914448
Kumar N, Tripathi MM, Gupta S, Alotaibi MA, Malik H, Afthanorhan A. Study of Potential Impact of Wind Energy on Electricity Price Using Regression Techniques. Sustainability. 2023; 15(19):14448. https://doi.org/10.3390/su151914448
Chicago/Turabian StyleKumar, Neeraj, Madan Mohan Tripathi, Saket Gupta, Majed A. Alotaibi, Hasmat Malik, and Asyraf Afthanorhan. 2023. "Study of Potential Impact of Wind Energy on Electricity Price Using Regression Techniques" Sustainability 15, no. 19: 14448. https://doi.org/10.3390/su151914448