Article

Drought Assessment in Greece Using SPI and ERA5 Climate Reanalysis Data

1
Centre for the Assessment of Natural Hazards and Proactive Planning & Laboratory of Reclamation Works and Water Resources Management, School of Rural, Surveying and Geoinformatics Engineering, National Technical University of Athens, 9 Heroon Polytechniou St., Zographou, 15780 Athens, Greece
2
Hellenic National Meteorological Service, 14 El. Venizelou St. Helliniko, 16777 Athens, Greece
*
Author to whom correspondence should be addressed.
Sustainability 2023, 15(22), 15999; https://doi.org/10.3390/su152215999
Submission received: 9 October 2023 / Revised: 1 November 2023 / Accepted: 14 November 2023 / Published: 16 November 2023
(This article belongs to the Section Sustainable Water Management)

Abstract

:
The present work aims to assess the spatial variability and the trends of the annual rainfall and meteorological drought in the entire territory of Greece utilising the ERA5 reanalysis precipitation dataset of the European Centre for Medium-Range Weather Forecasts (ECMWF), which spans from January 1940 to December 2022 (an 83-year period). Drought assessment took place based on the Standardized Precipitation Index (SPI) for timescales ranging from 1 month to 12 months. Evaluation was carried out by calculating SPI using observed rainfall data from five meteorological stations. The annual rainfall and drought severity trends for timescales of 1 (SPI-1), 3 (SPI-3), 6 (SPI-6) and 12 (SPI-12) months were analysed using the Theil–Sen slope method and the Mann–Kendall trend test. The results indicate significant, both increasing and decreasing, annual precipitation trends at the 95% significance level for the Aegean Islands, western Crete and western mainland of Greece. The results also indicate significant drought trends for SPI-12 for the Aegean Islands and western Peloponnese. Trend analysis for SPI-1, SPI-3 and SPI-6 indicate a mixture of non-significantly increasing wetting trends and increasing drought trends at the national scale. In conclusion, the ERA5 dataset seems to be a valuable tool for drought monitoring at the spatial scale.

1. Introduction

Climate change is foreseen to increase the risk of natural hazards and extreme events (floods, droughts, etc.), thus posing an additional risk for the economy, health and life [1]. Several researchers have assessed the impacts of climate change on different regions around the globe [2,3,4,5,6,7,8,9,10,11,12,13,14,15,16,17]. In addition, various studies have assessed rainfall trends for different regions around the world (e.g., [18,19,20,21,22,23,24,25,26,27,28,29,30,31]).
Drought is among the most common and disastrous natural hazards, having direct and/or indirect economic, social and environmental impacts. Moreover, it is highly related to the United Nations Sustainable Development Goals, especially SDGs 1, 2, 6, 10, 13 and 15. In addition, climate change may have adverse impacts on the hydrological cycle, resulting in more frequent weather extremes (floods and droughts). According to Tabari and Willems [1], “Sustainable development would reduce population exposure to drought by 70% compared to fossil-fueled development. Furthermore, it halves the number of countries facing a fivefold increase in drought risk”. As a result, understanding droughts and the mitigation of adverse impacts of drought phenomena, as well as sustainable drought proactive planning [32], constitute important aspect of sustainable development in the new era. To this end, drought monitoring using reanalysis data at the regional scale can be a valuable tool in the new era.
Researchers have claimed that both drought hazards and risks will intensify as a result of the projected climate change (e.g., [33,34]). However, drought quantification constitutes a rather difficult task as it is based on various meteorological variables (e.g., precipitation and temperature; [35,36,37]). To assess drought, these meteorological variables are used as an input to estimate drought indices, which constitute “numerical representations of drought severity” [38].
In recent years, various researchers have applied well-established and newly developed drought indices for assessing meteorological, hydrological and agricultural drought in different areas around the globe (e.g., [39,40,41,42,43,44,45,46,47,48,49,50,51,52,53,54,55,56,57,58,59,60,61,62,63,64,65,66,67]). Depending on the purpose of the drought analysis, different drought indices can be selected to assess and characterise drought with adequate accuracy (e.g., [39,45]). Complex and data-demanding indices may be suitable for specialised tasks, for instance, the recently proposed Modified Palmer Drought Severity Index (MPDSI) for monitoring agricultural drought by Yu et al. [39] and the integrated remote sensing drought monitoring indices proposed by Zhang et al. [45]. Both indices have been extensively tested across China. However, simple indices can provide sufficiently accurate and comprehensible results for a wide range of drought analyses (e.g., [68,69,70]).
The Standardized Precipitation Index (SPI) is a typical example of a simple drought index, since it only requires precipitation data for its application. SPI has been used in a wide variety of drought studies for analysing all the aforementioned types of drought. Another popular and well-tested index is the RDI [71,72], which, in addition to precipitation, requires evapotranspiration data, so it is more advanced.
According to the World Meteorological Organization [73], drought assessment should take place based on a complete timeseries comprising at least 30 years of monthly data, with the optimum being 50 to 60 years of monthly data. In recent years, due to the lack of continuous, long-term, adequate spatial coverage and reliable meteorological measurements, a growing number of studies have used satellite and/or reanalysis datasets for ungauged and/or purely gauged regions (e.g., [74,75,76,77]). For instance, Vangelis et al. [77] used the CMORPH rainfall reanalysis dataset of the National Oceanic and Atmospheric Administration for assessing the relationship of flood discharge probabilities with extreme rainfall probabilities. Varlas et al. [74] employed the ERA5 monthly precipitation dataset for a 71-year period (1950 to 2020) to conduct a trend analysis of annual precipitation over Greece. The most widely used reanalysis datasets are CMORPH, ERA-Interim, ERA5, NCEP CFSR, JRA55 and MERRA-2 [75,78].
Several researchers around the world have utilised the ERA5 reanalysis dataset for drought assessment and monitoring and for the development of global monitoring systems (e.g., [35,75,79,80,81]). For instance, Zhang et al. [81] used the ERA5 dataset for the estimation of the Soil Water Deficit Index (SWDI) in four provinces of China. Lee et al. [79] assessed meteorological drought for the Korean Peninsula using seven drought indices that consider only precipitation. They also used observational data to verify the accuracy of drought detection, concluding that the SPI and Rainfall Anomaly Index (RAI) constitute the most accurate drought indices for the study area. Torres-Vázquez et al. [80] reported a good agreement between the ERA5 reanalysis dataset and the observed data reported by the Spanish Meteorological Agency. They also employed the ERA5 dataset for seasonal drought prediction in Spain. Vicente Serrano et al. [35] utilised the ERA5 reanalysis dataset for the development of a global monitoring system of drought. The developed monitoring system was based on the Standardized Precipitation Evapotranspiration Index (SPEI). Finally, Tladi et al. [75] assessed two reanalysis products, namely the rainfall data of the National Centers for Environmental Prediction–Climate Forecast System Reanalysis (NCEP-CFSR) and the ERA5 dataset for a basin in South Africa in terms of meteorological drought monitoring, concluding that the ERA5 dataset outperformed NCEP-CFSR for the study area.
The goal of the present work is threefold: (i) to assess precipitation over Greece based on monthly ERA5 reanalysis data for an 83-year period (January 1940 to December 2022) and identify annual trends; (ii) to assess meteorological drought over Greece calculated based on SPI using the ERA5 reanalysis dataset, identifying drought trends in different timescales; and (iii) to evaluate the suitability of the ERA5 reanalysis dataset for drought characterisation. Evaluation took place using observed rainfall data from five meteorological stations. Trend analysis for precipitation and SPI was performed based on the widely used Mann–Kendall trend test and Sen’s slope method using a MATLAB code developed in-house. The manuscript has the following structure: Section 2 describes the methodological framework and the data used; Section 3 and Section 4 present and discuss the results of our analysis, respectively; and Section 5 follows with a summary and concluding remarks.

2. Materials and Methods

The framework of the study is presented in the workflow of Figure 1 and comprises the following parts: (i) monthly precipitation data acquisition for Greece from ERA5 reanalysis precipitation data, (ii) calculation of the SPI meteorological drought index for Greece based on the monthly precipitation data, (iii) analysis of trends of both precipitation and drought and (iv) evaluation of the ERA5 dataset. All computations were undertaken in the MATLAB computing environment using the Climate Data Toolbox (CDT; [82]) and in-house developed MATLAB codes (e.g., [83]).

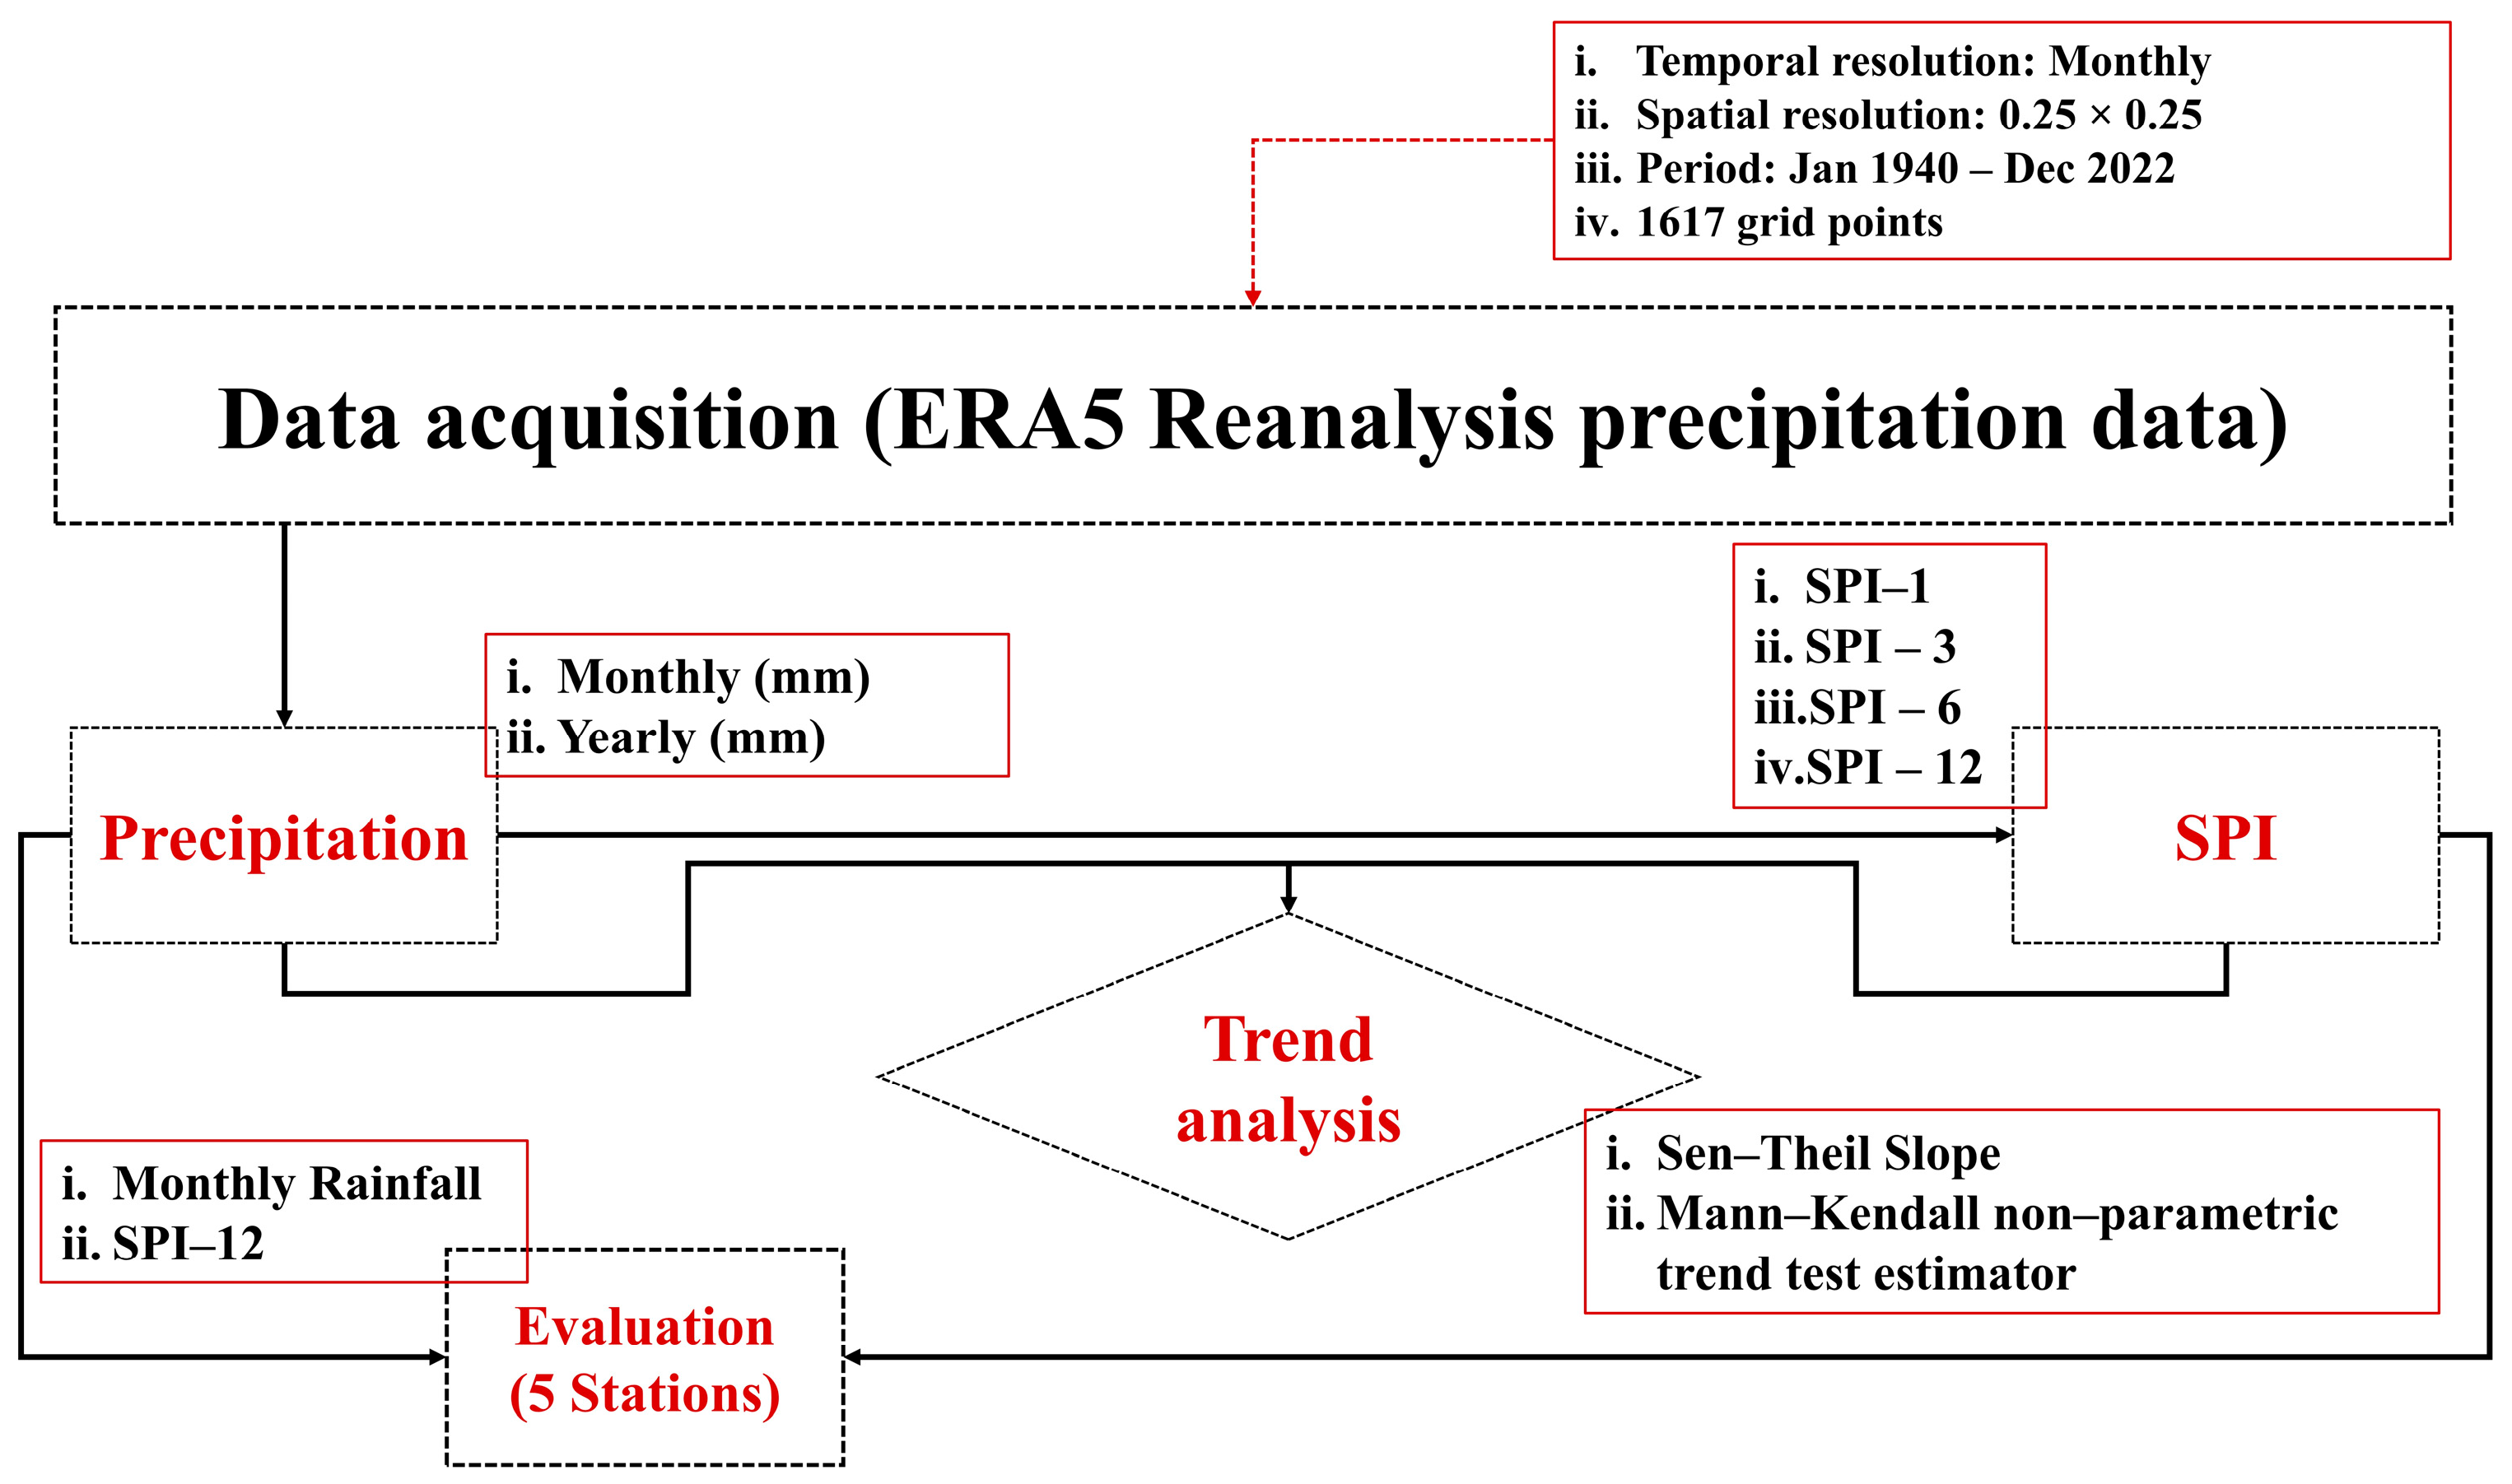
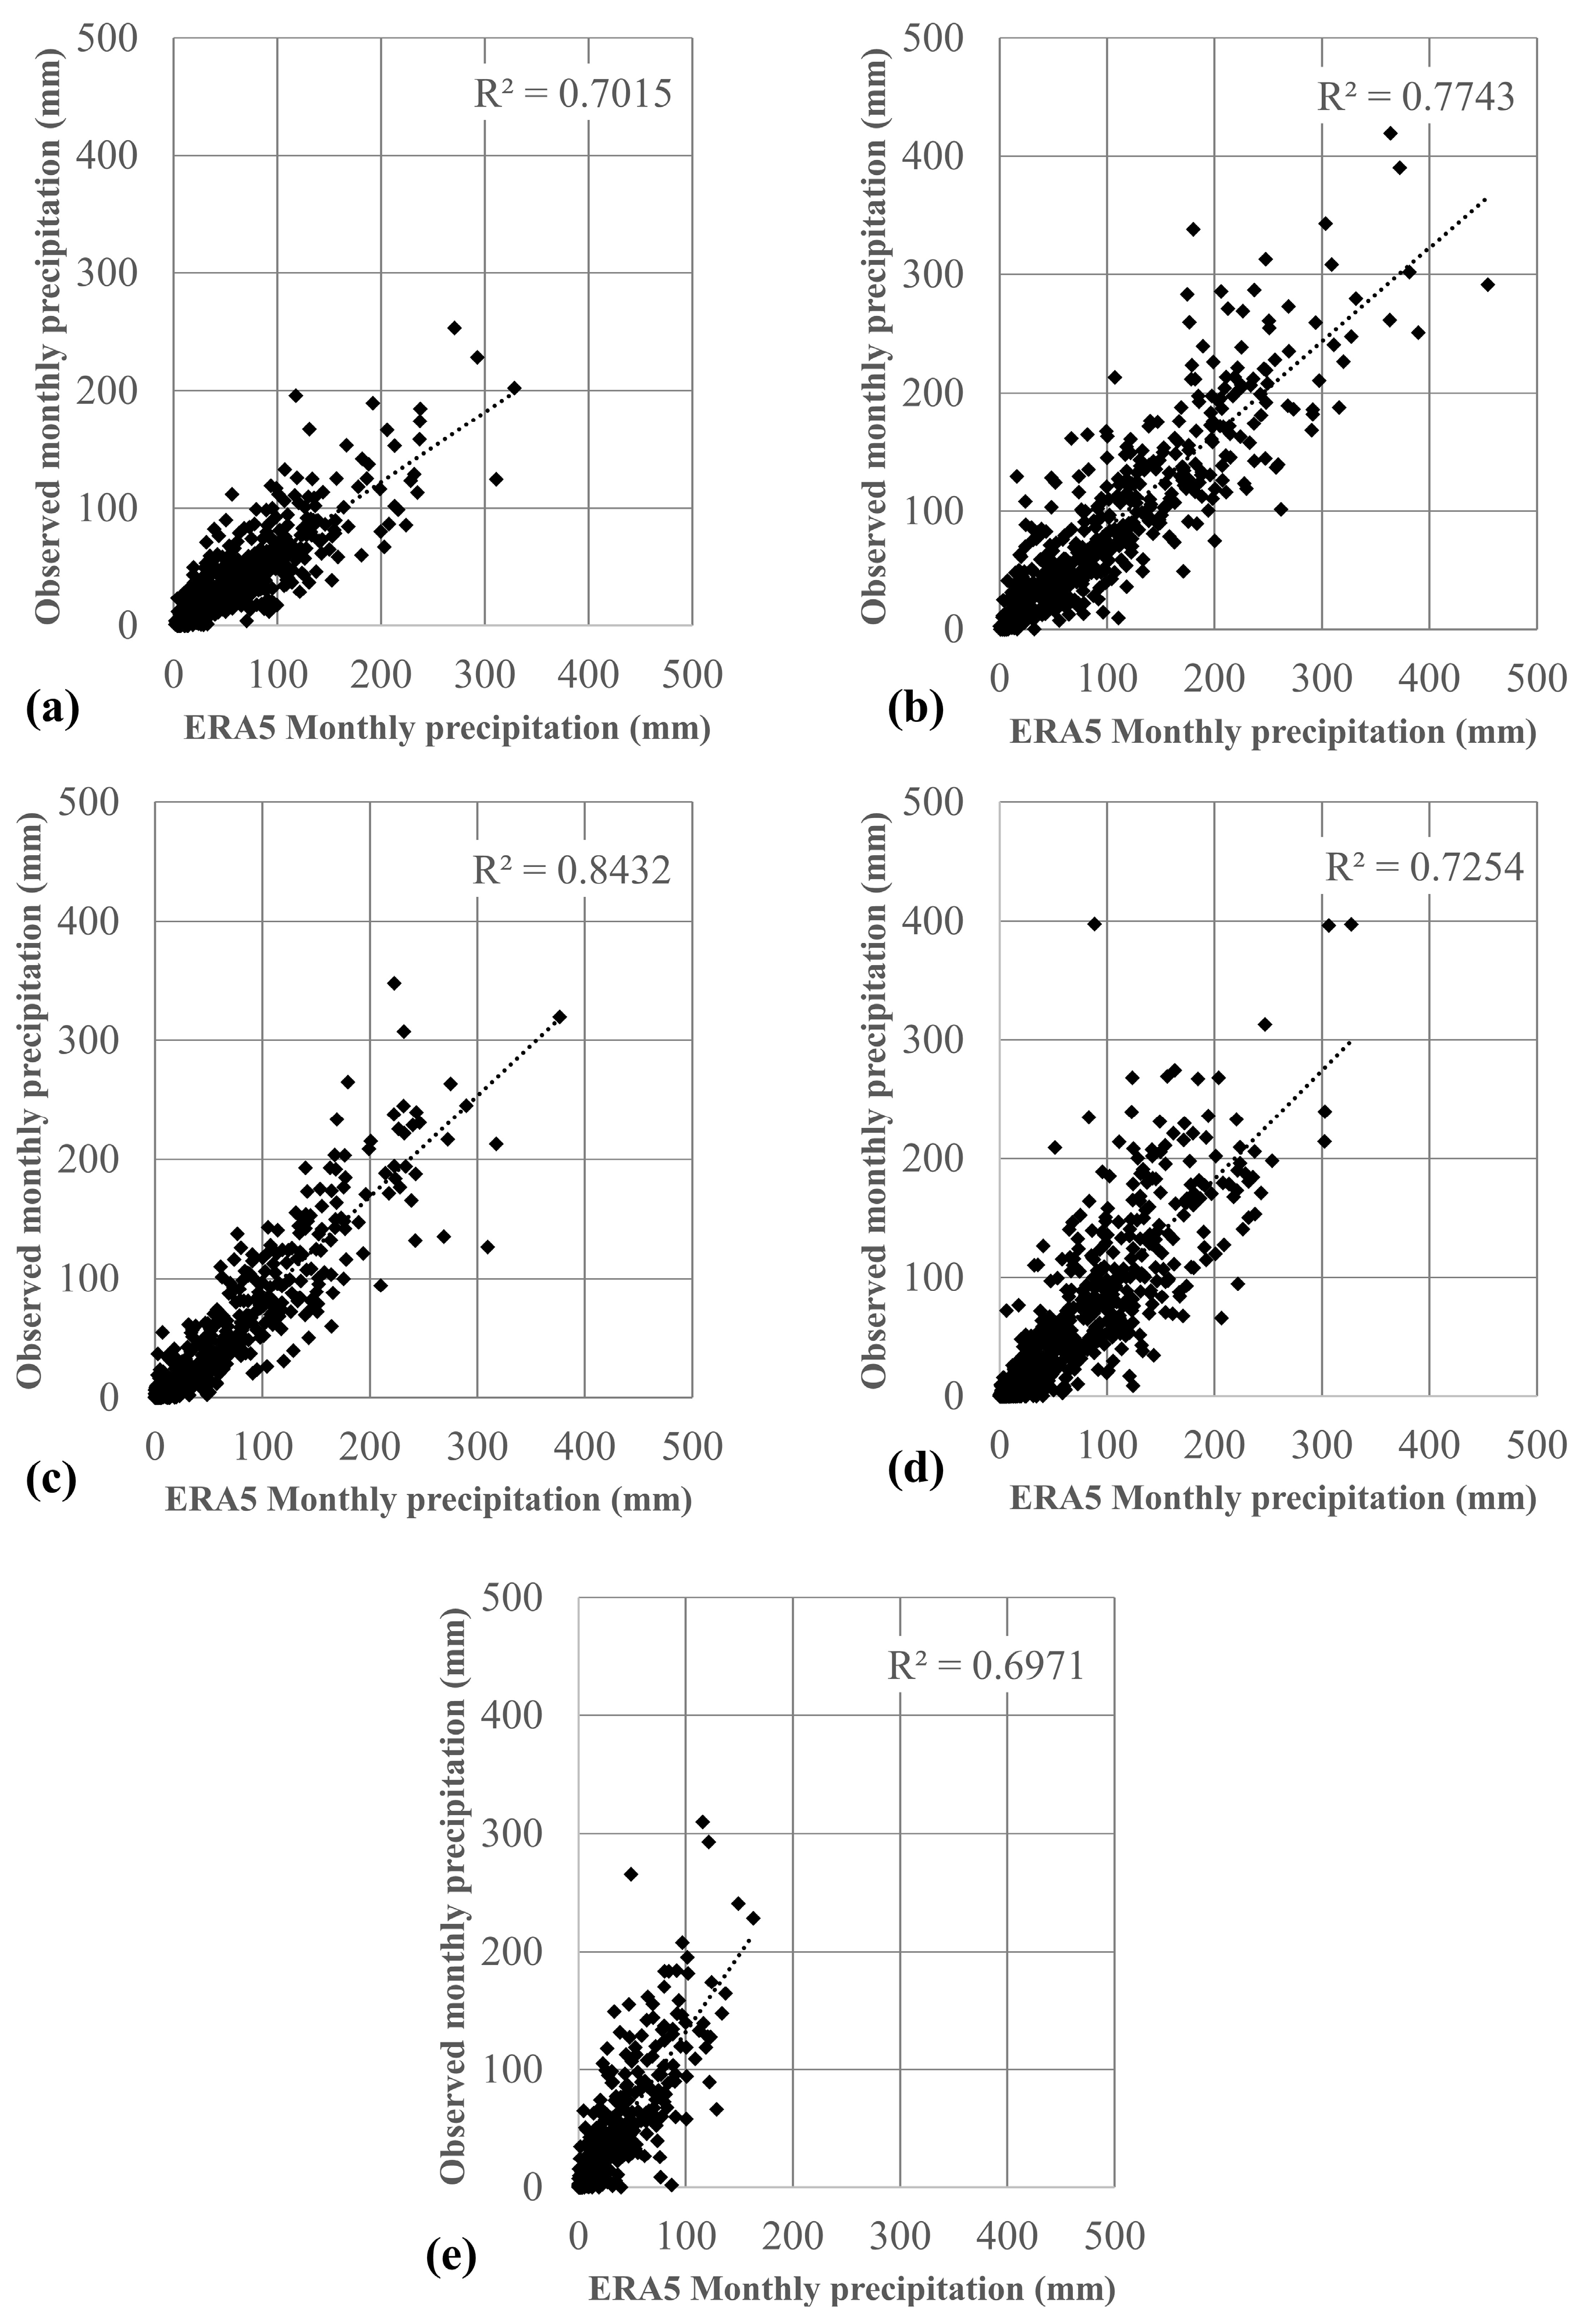
2.1. Climate Data and Study Area

To assess meteorological drought, we used historical reanalysis monthly precipitation data obtained from the ERA5 reanalysis dataset [84]. The analysis took place at the national level, and more specifically, the domain under study was the entirety of Greece; thus, monthly ERA5 precipitation data of the European Centre for Medium-Range Weather Forecasts (ECMWF) were acquired for a region between 18.00 W–30.00 E and 34.00 N–42.00 N with a spatial resolution of 0.25° × 0.25°. ERA5 monthly precipitation data were downloaded (https://cds.climate.copernicus.eu, accessed on 4 June 2023) for each month for all 1617 grid points used over the 83-year period spanning from January 1940 to December 2022. Monthly precipitation values were then used to calculate the total annual precipitation (i.e., sum of monthly values) and conduct trend analyses. Monthly precipitation values for each grid point of the domain under study were also employed to calculate the SPI for 1-, 3-, 6- and 12-month timescales and for drought trend analysis using SPI.

2.2. The SPI Drought Index

The SPI is a well-established drought index that has been used in numerous studies around the world over the last three decades. The index is usually preferred due to its simple, customisable and solid structure; low data requirements; worldwide use and recognition; and comprehensible outcomes with universal interpretation.
The index was introduced by McKee et al. [85] based on a standardisation approach fitting the precipitation timeseries accumulated for specific intervals of time (timescales) to a proper statistical distribution (typically gamma) and further transformed into standard normal distribution.
The probability density function (p.d.f.) for the gamma distribution is:
g x = 1 β α   Γ ( α ) x α 1   e x / β
where α is a shape parameter (α > 0); β is a scale parameter (β > 0); x is the precipitation value (x > 0); and Γ(α) is the gamma function, expressed as 0 y α 1 e y d y .
According to Thom [86], the α and β parameters are assessed as follows:
α = 1 + 1 + 4 A 3 4 A       ,       β = x ¯ α
where A = ln x ¯ l n ( x ) n and n is the number of observations in the timeseries.
A precipitation event has a cumulative probability G(x) given by:
G x = 0 x g x d x = 0 x x α 1   e x / β d x β α   Γ ( α )
By letting t = x/β, Equation (3) becomes the incomplete gamma function:
G x = 0 x t α 1   e t d t Γ ( α )
Since the gamma distribution is not defined for x = 0, the cumulative probability of zero precipitation (q) is taken into account separately; the final cumulative probability is then calculated using the following formula [87]:
H x = q + 1 q G ( x )
For assessing SPI, the approximation proposed by Abramowitz and Stegun [88] can be used to transform the cumulative probability distribution of Equation (5) into standard normal distribution:
S P I = t c 0 + c 1 t + c 2 t 2 1 + d 1 t + d 2 t 2 + d 3 t 3 ,       0 < H ( x ) 0.5
where t = l n 1 / H ( x ) 2 .
S P I = t c 0 + c 1 t + c 2 t 2 1 + d 1 t + d 2 t 2 + d 3 t 3   ,       0.5 < H ( x ) 1.0
where t = l n 1 / [ 1 H x 2 ] and the values of the various constants are c0 = 2.515517, c1 = 0.802853, c2 = 0.010328, d1 = 1.43278, d2 = 0.189269 and d3 = 0.001308.
The intensity of drought events based on SPI can be classified according to the value of SPI. The most typical classification is presented in Table 1.
The proper selection of timescales, depending on the aim of the study, is critical for getting meaningful and adequately interpretable outcomes. Several factors, including the system under study, the climatic characteristics of the area, data availability and others, should be considered to select the appropriate timescale for drought analysis [70]. Indicatively, for SPI and similar multi-scalar drought indices, the 1-month timescale may represent the monthly percentage of monthly precipitation, the 3-month and 6-month timescales are suitable for agricultural drought identification and the 12-month timescale can represent drought impacts on various systems within the entire hydrological year (WMO [73]). Although timescales greater than 12 months can also be used, these require careful analysis to avoid misinterpretations [73]; therefore, these were not included in the present study. The SPI values for the selected timescales are usually plotted on drought maps to assess the areal extent of drought [89].

2.3. Trend Analysis

The Theil–Sen slope (Sen’s slope) estimator and the non-parametric Mann–Kendall statistical test [90,91,92,93] are widely used for testing and quantifying trends in hydrometeorological timeseries (e.g., [94]). Based on the Mann–Kendall non-parametric statistical test, the null hypothesis (H0) assumes that the data (x1, …, xn) denote a sample of n independent and randomly ordered variables. The null hypothesis implies that there is no trend against the alternative of the trend. The Theil–Sen calculator (Sen’s slope; [90,91]) constitutes a widely used approach for linear regression [61]. Based on this method, the median slope is calculated among all pairs of two-dimensional sample points (i = 1, …, N). The statistic S of the Mann–Kendall test can be calculated as follows [92,93]:
S = i = 1 n 1 j = i + 1 n sgn ( x j x i )
where n is the number of data points, xi and xj are the data values in the time series i and j for every j > i, and sgn(xjxi) is the sign function computed as:
sgn ( x j x i ) = { + 1 ,         i f     x j x i > 0 0 ,           i f     x j x i = 0 1 ,     i f     x j x i < 0
Variance (Var(s)), standard deviation (sd) and the ZS (standard normal test variable) are computed as follows:
V a r ( S ) = n ( n 1 ) ( 2 n + 5 ) i = 1 k t g i ( t g i 1 ) ( 2 t g i + 5 ) 18
s d = V a r ( S )
Z S = { S 1 s d ,         if     S > 0 0 ,                   if     S = 0 S + 1 s d ,         if     S < 0
where n is the number of data points, k is the number of tied groups and tgi is the number of ties of extent i. Negative values of ZS indicate a decreasing trend, while positive values of ZS indicate an upward trend. The trend is examined based on a predefined significance level p (e.g., 1%). In case ZS is greater than Z1−p/2, where Z1−p/2 can be obtained from the standard normal distribution table, then it can be concluded that the null hypothesis can be rejected and there is a significant trend in the data examined.
Sens’s slope can be calculated as:
S = median ( X j X i j i )
where Xj and Xi are the data values at times j and i (j > i), respectively.

3. Results

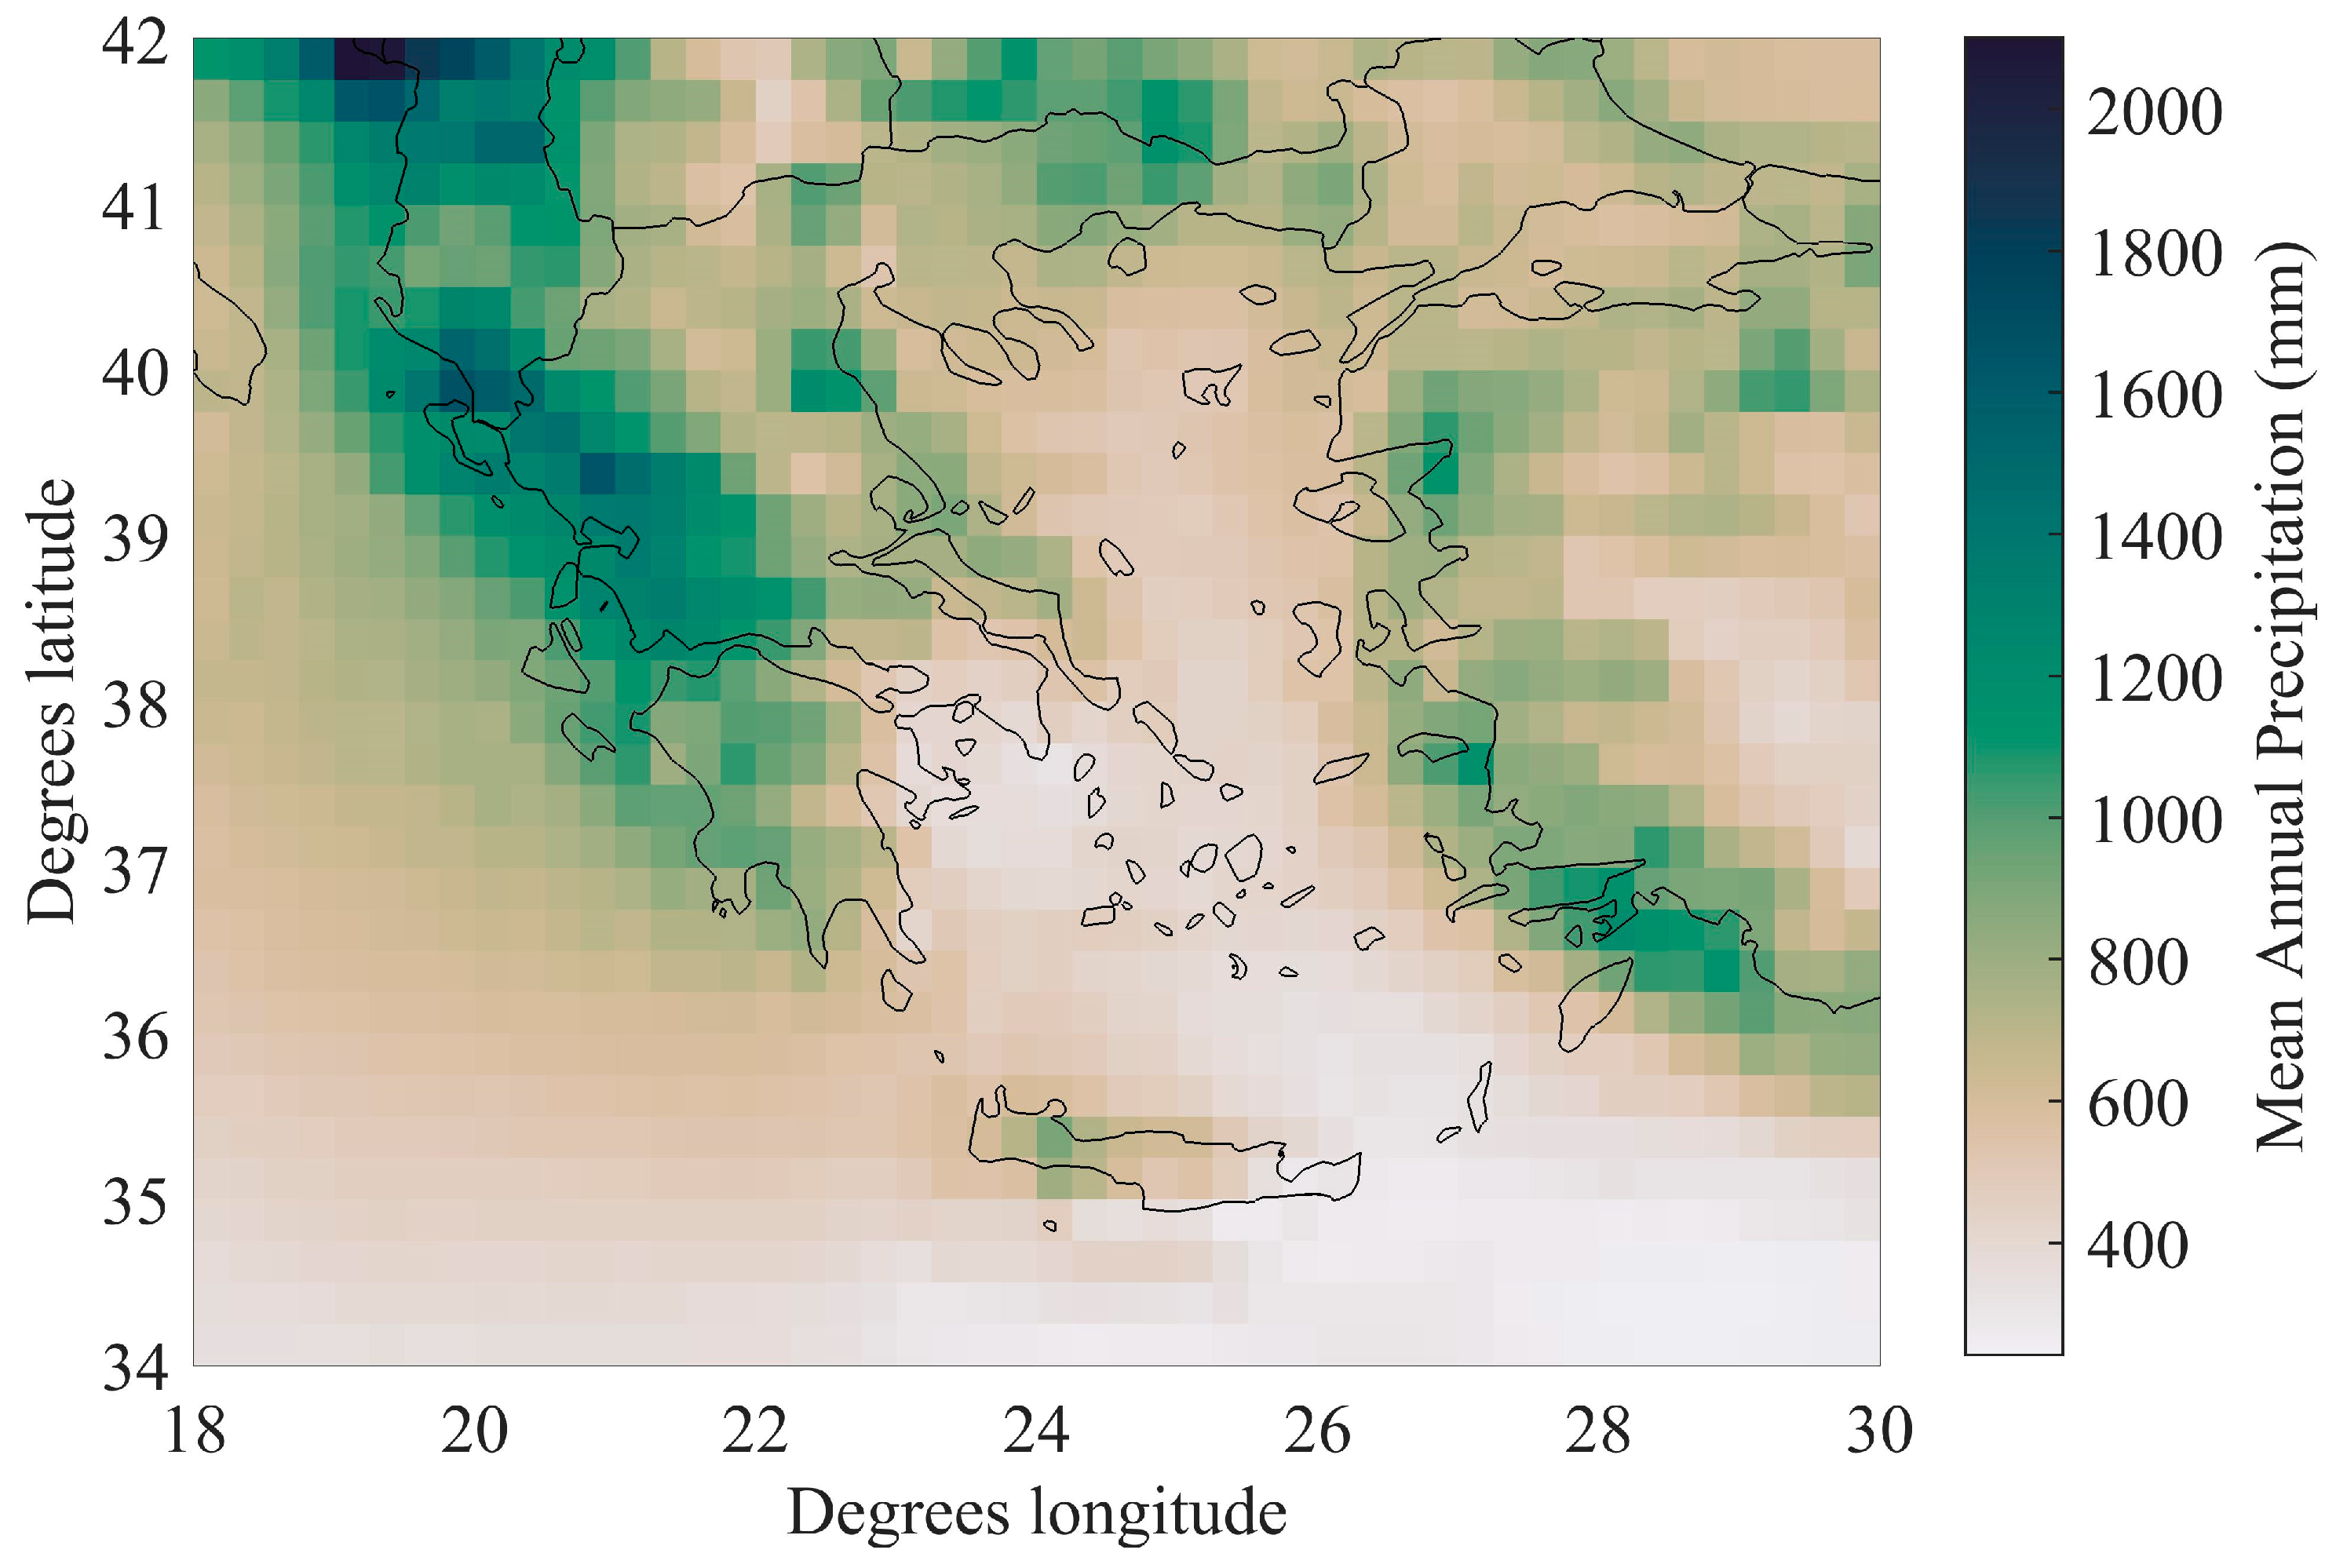
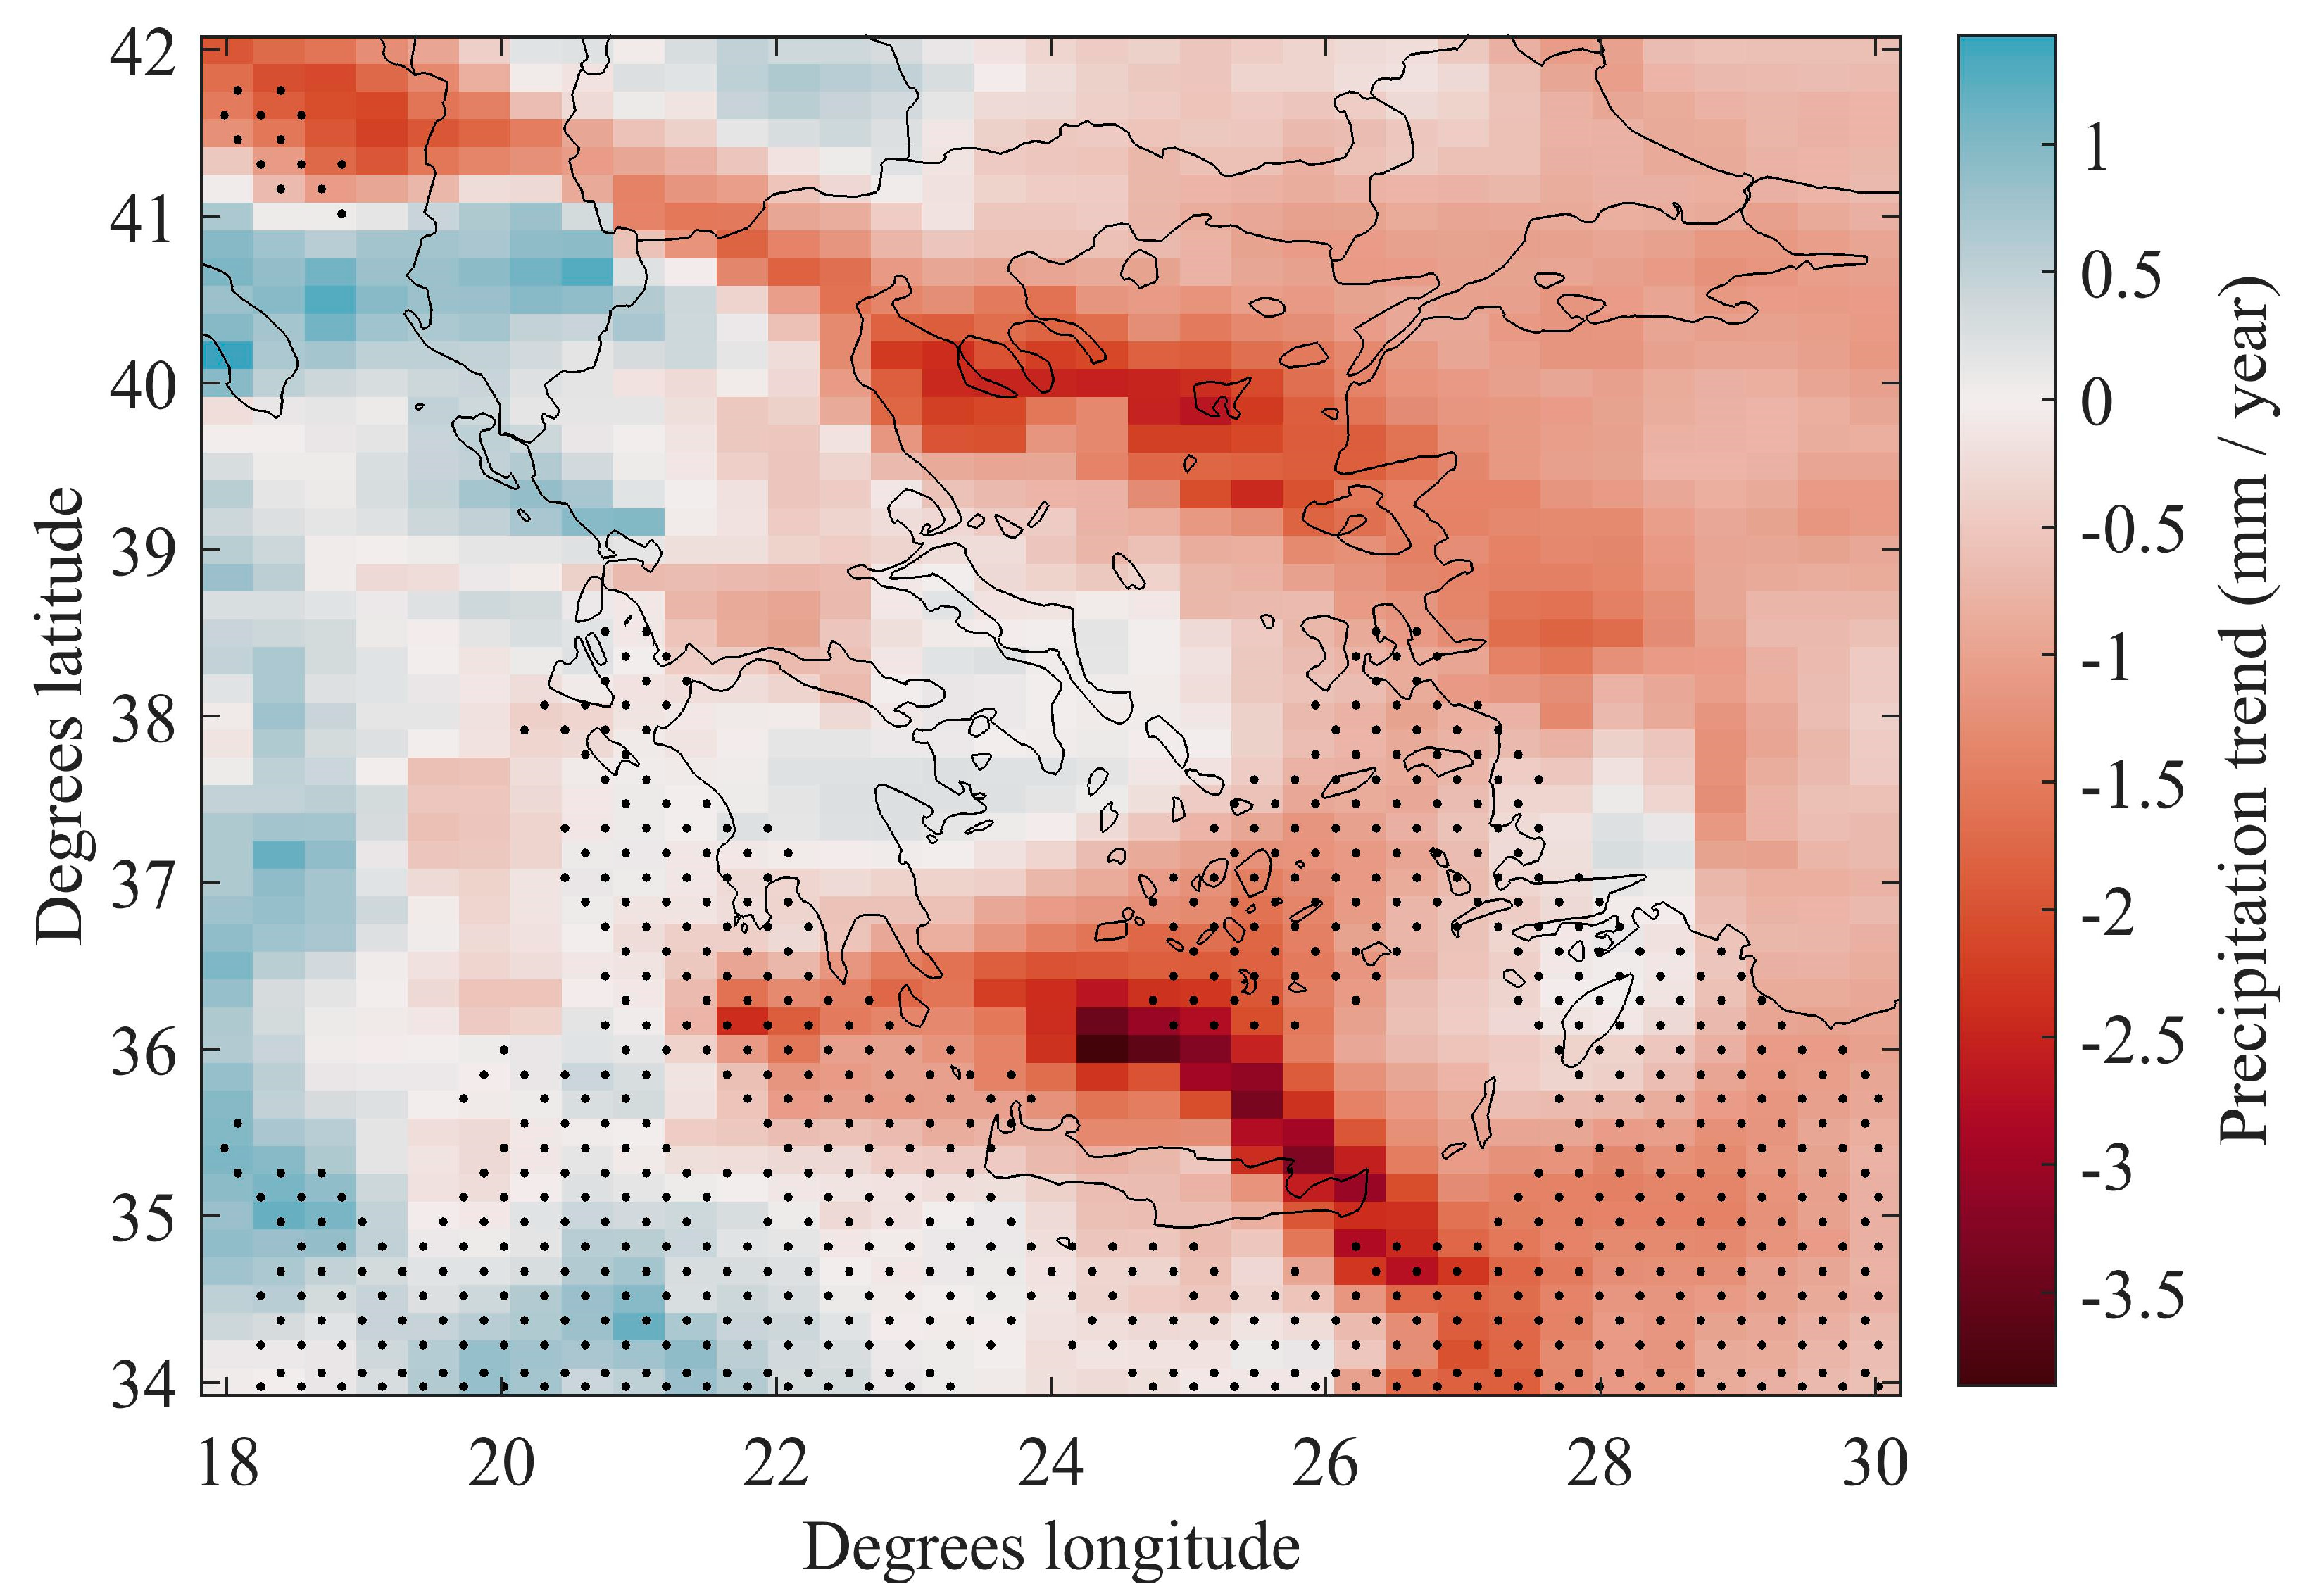
3.1. Precipitation and Precipitation Trend Analysis

The spatial distribution of mean annual precipitation for the period of 1940–2022 in Greece is presented in Figure 2. It can be observed that the highest precipitation values are depicted in western Greece (e.g., Epirus, western Peloponnese and Ionian Islands), ranging from 1000 to 1400 mm (Figure 2). The lowest values of precipitation range from 300 to 600 mm (Figure 2) and are depicted in eastern Greece (e.g., Athens, eastern Crete, Peloponnese and the Aegean Sea). The results are in accordance with the results presented by other researchers (e.g., [74]). It is seen that a special hydrological regime prevails in Greece; the western part of the country receives the majority of the precipitation (1200–1400 mm/year; Figure 2), while in the eastern part of the country, along with the Aegean Islands and eastern Crete, the precipitation is almost three times lower (400–700 mm/year; Figure 2).
Figure 3 presents the results of the trend analysis for annual precipitation based on the linear trend analysis (Theil–Sen slope) and the Mann–Kendall significance trend test. Black dots on the map indicate a statistically significant trend estimated using the Mann–Kendall trend test at the 95% significance level. Although a declining trend in precipitation for the greater part of Greece can be observed, a statistically significant trend can be observed in the Aegean Sea, western Crete and western Greece (as indicated by the black dots in Figure 3). On the other hand, it must be noted that in northwestern Greece, the Attica region, Euboea Island and northeastern Peloponnese, non-significant increasing trends can be observed.

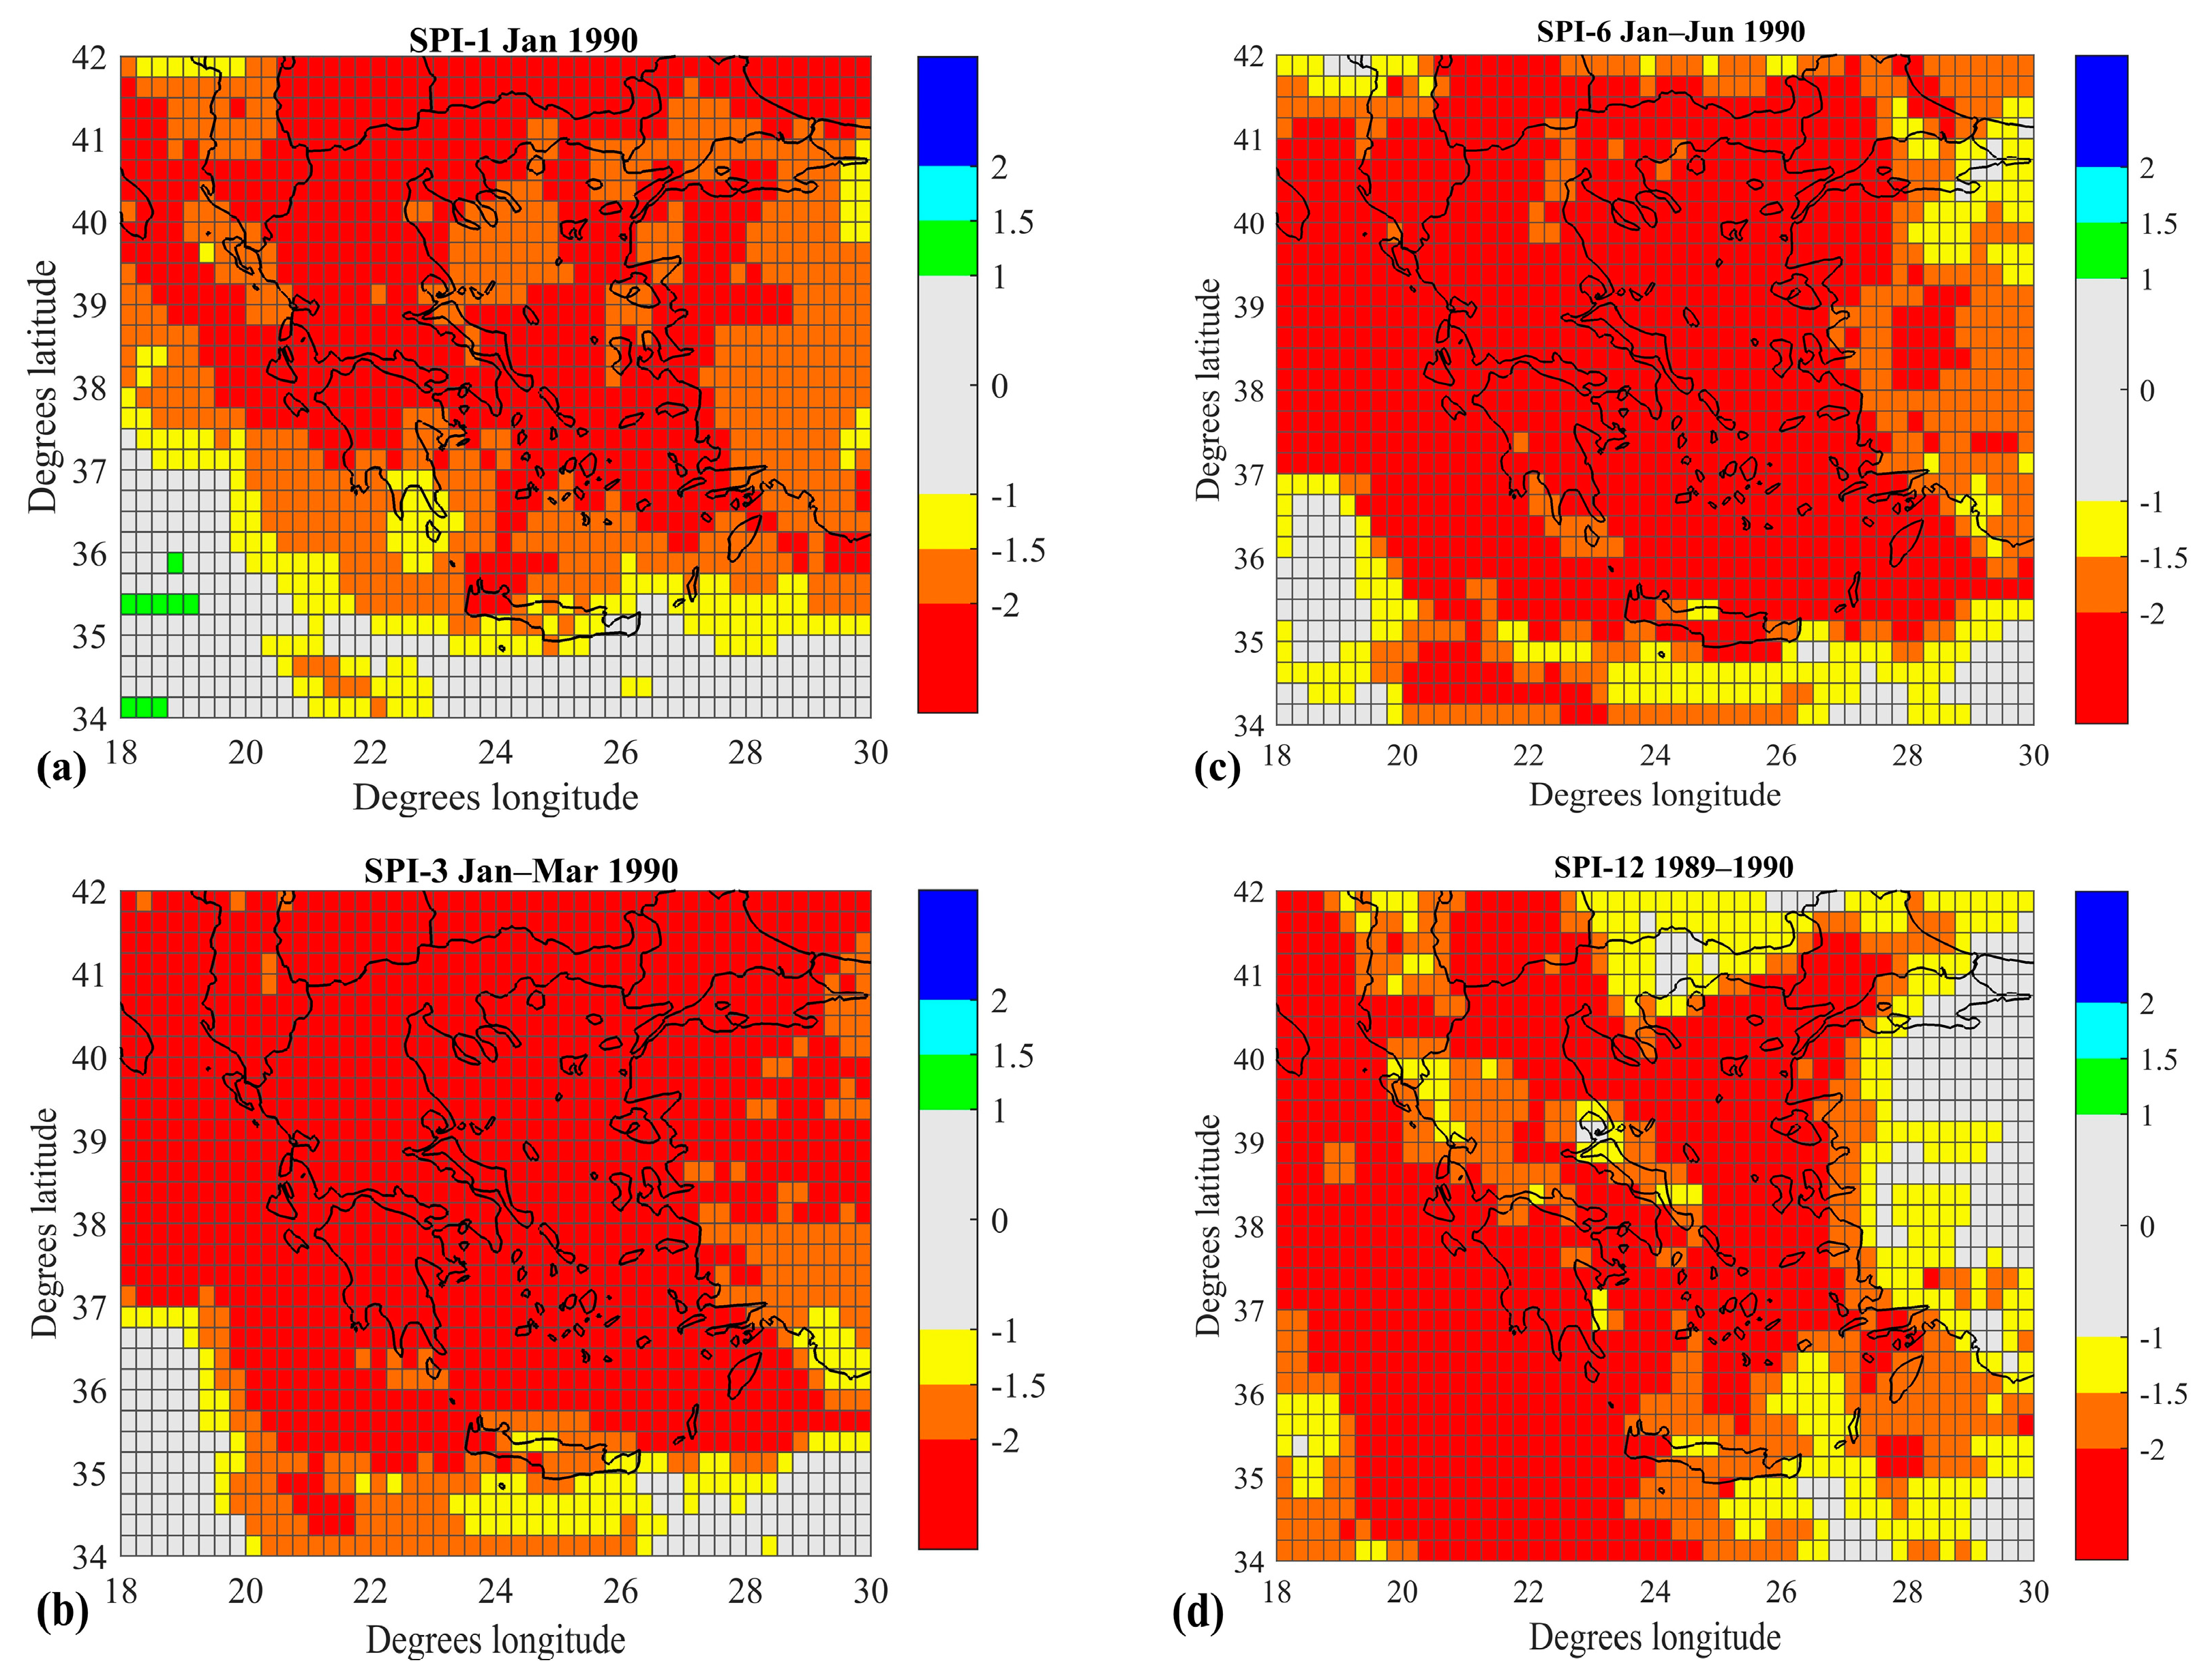
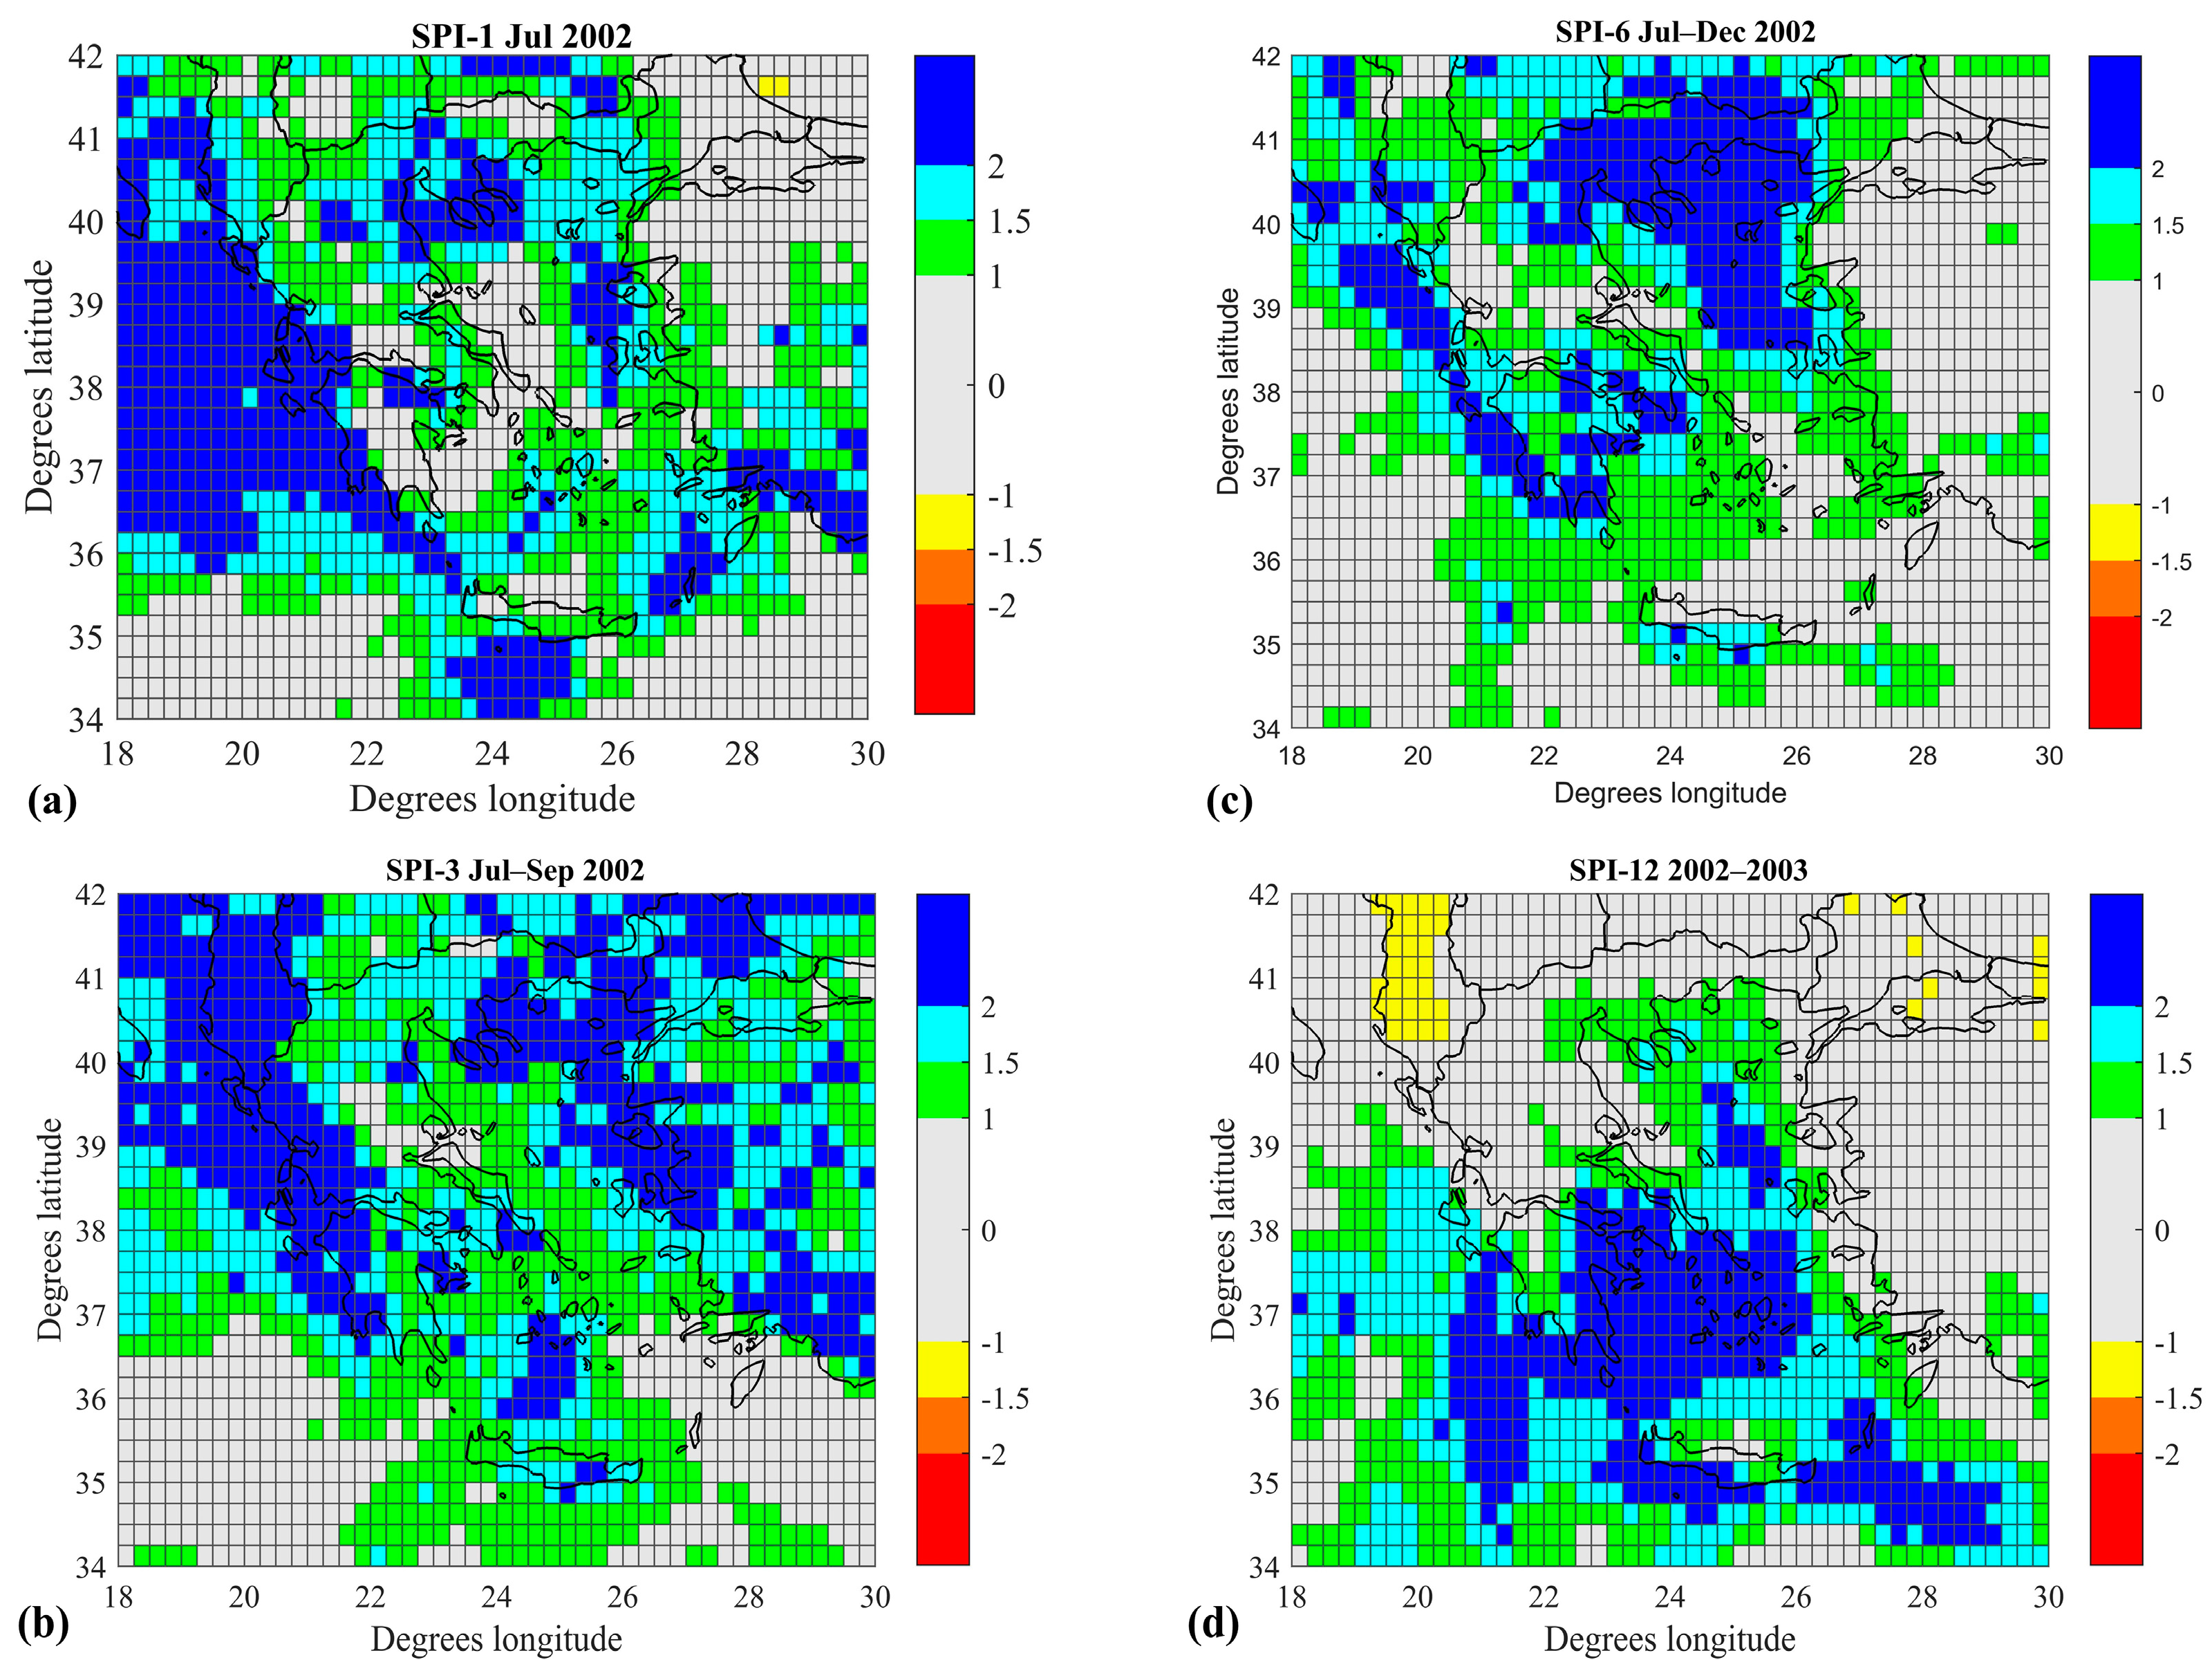
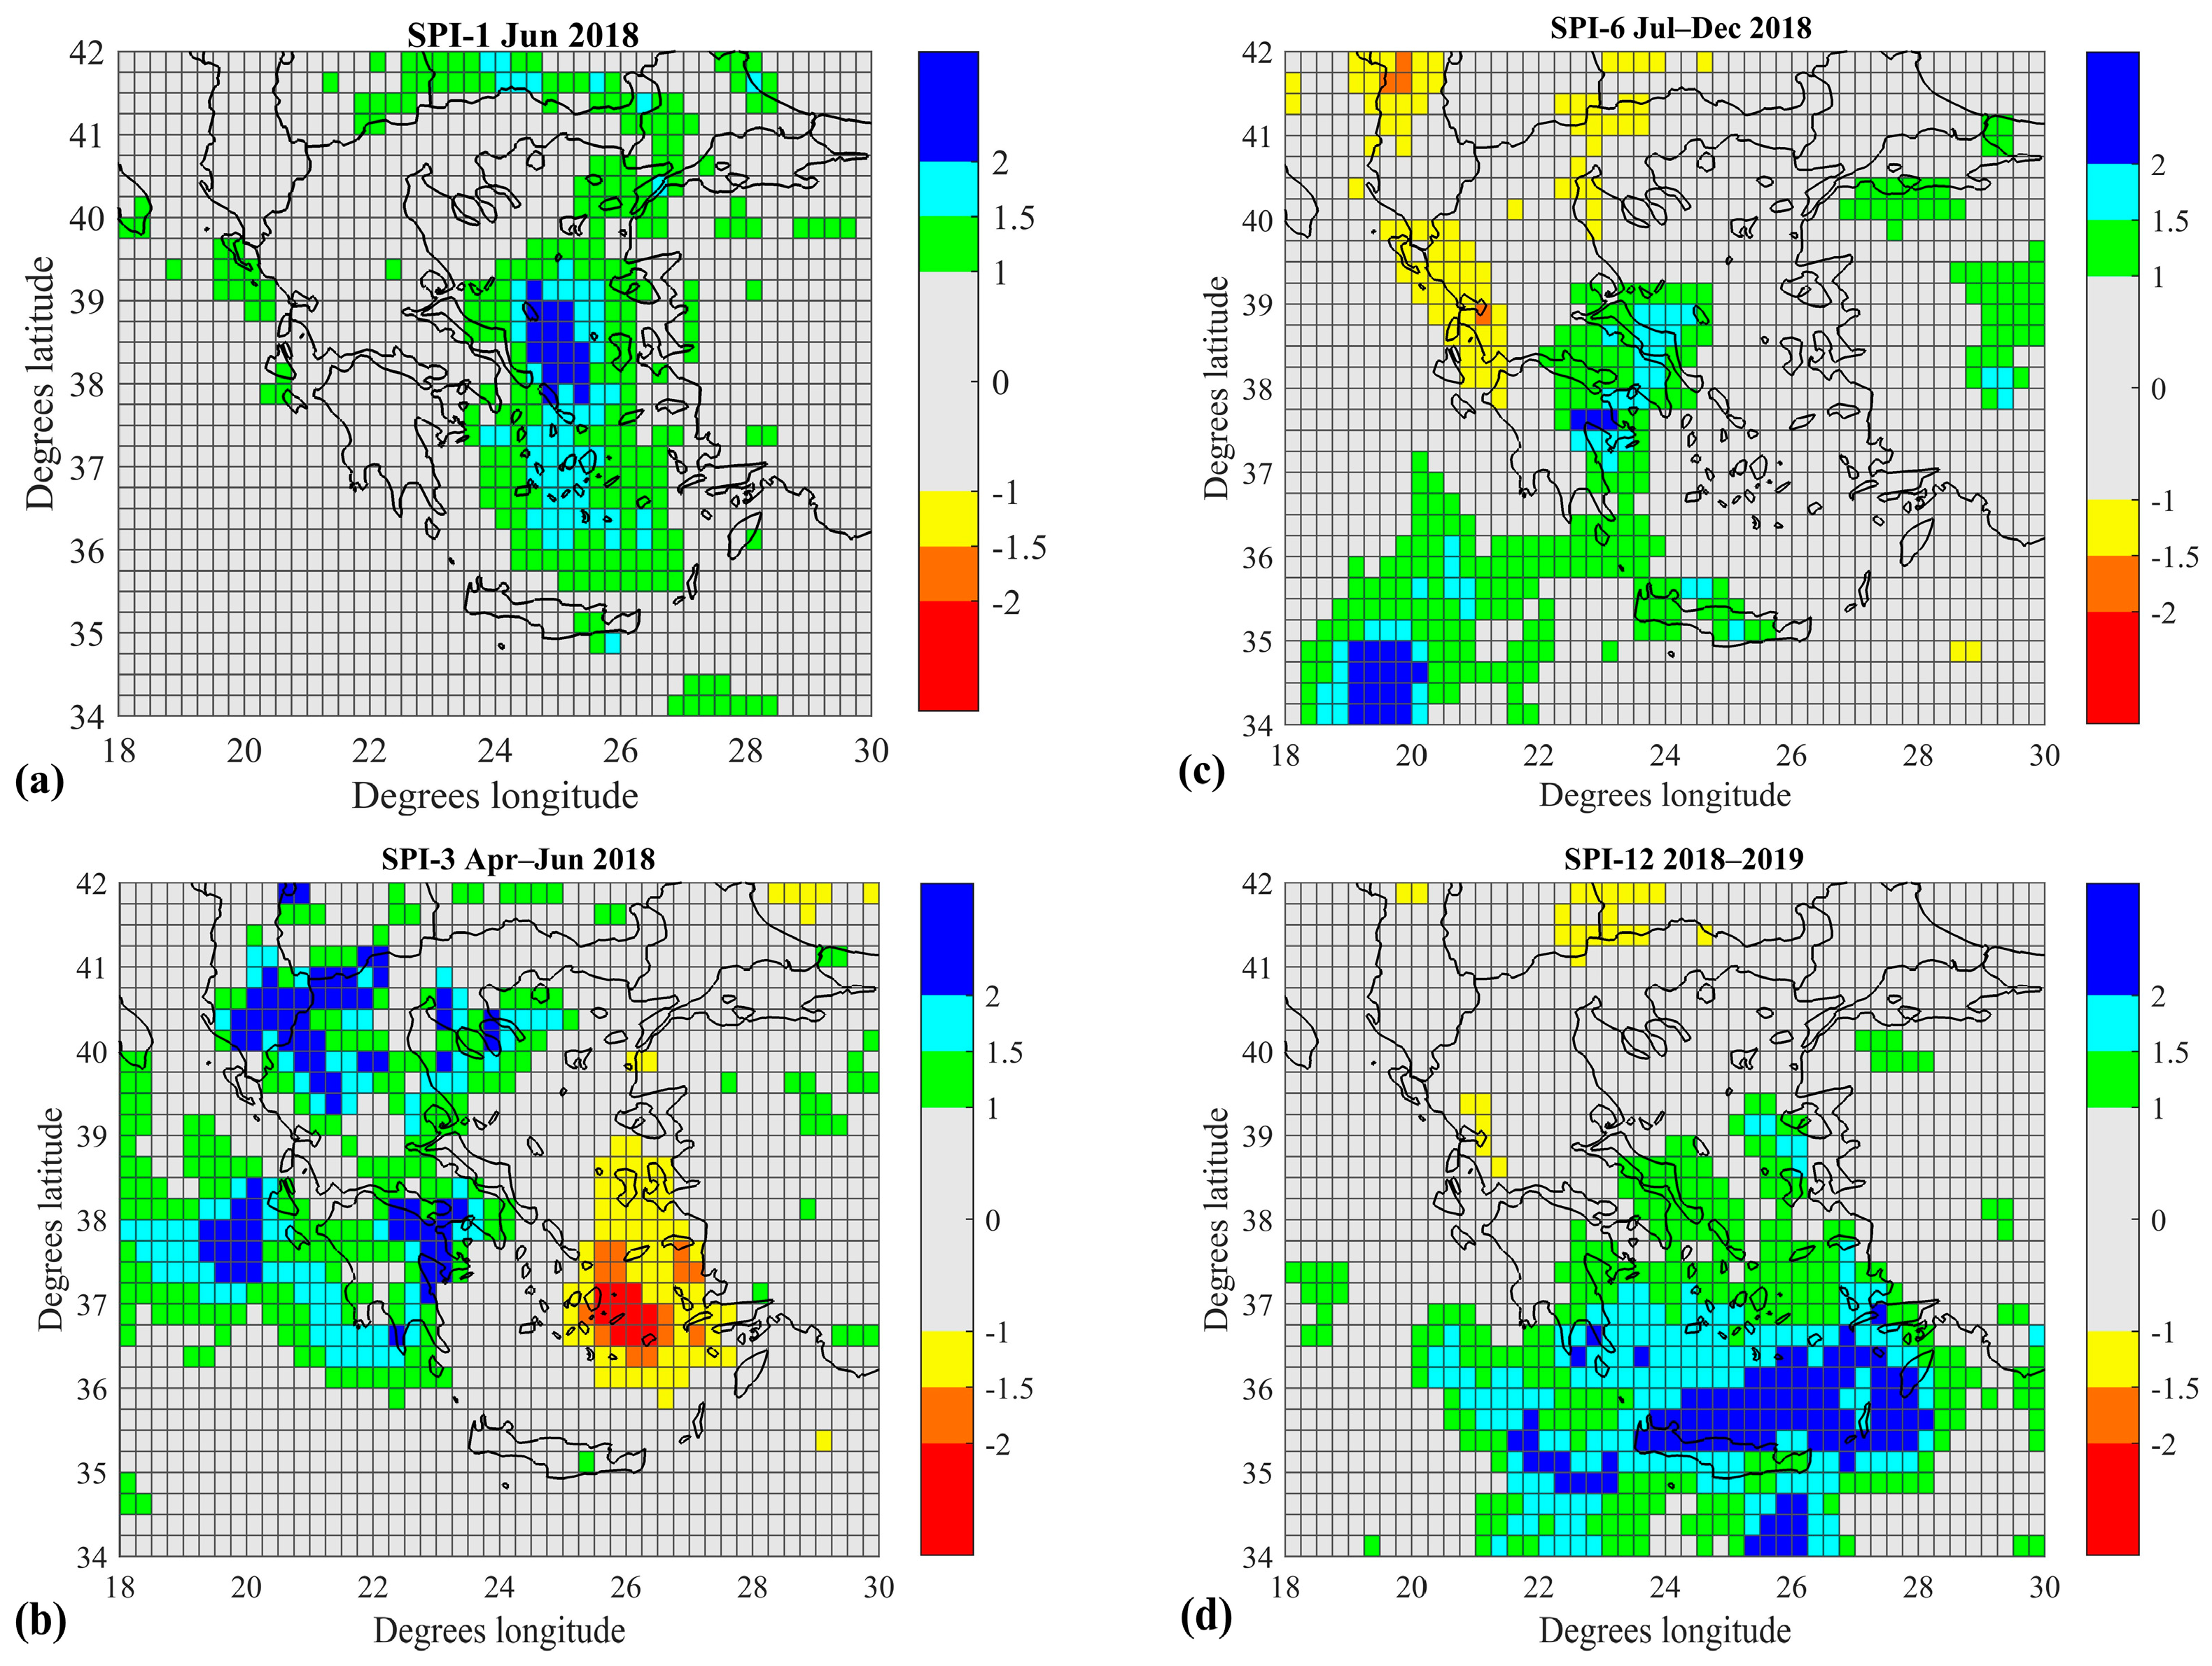
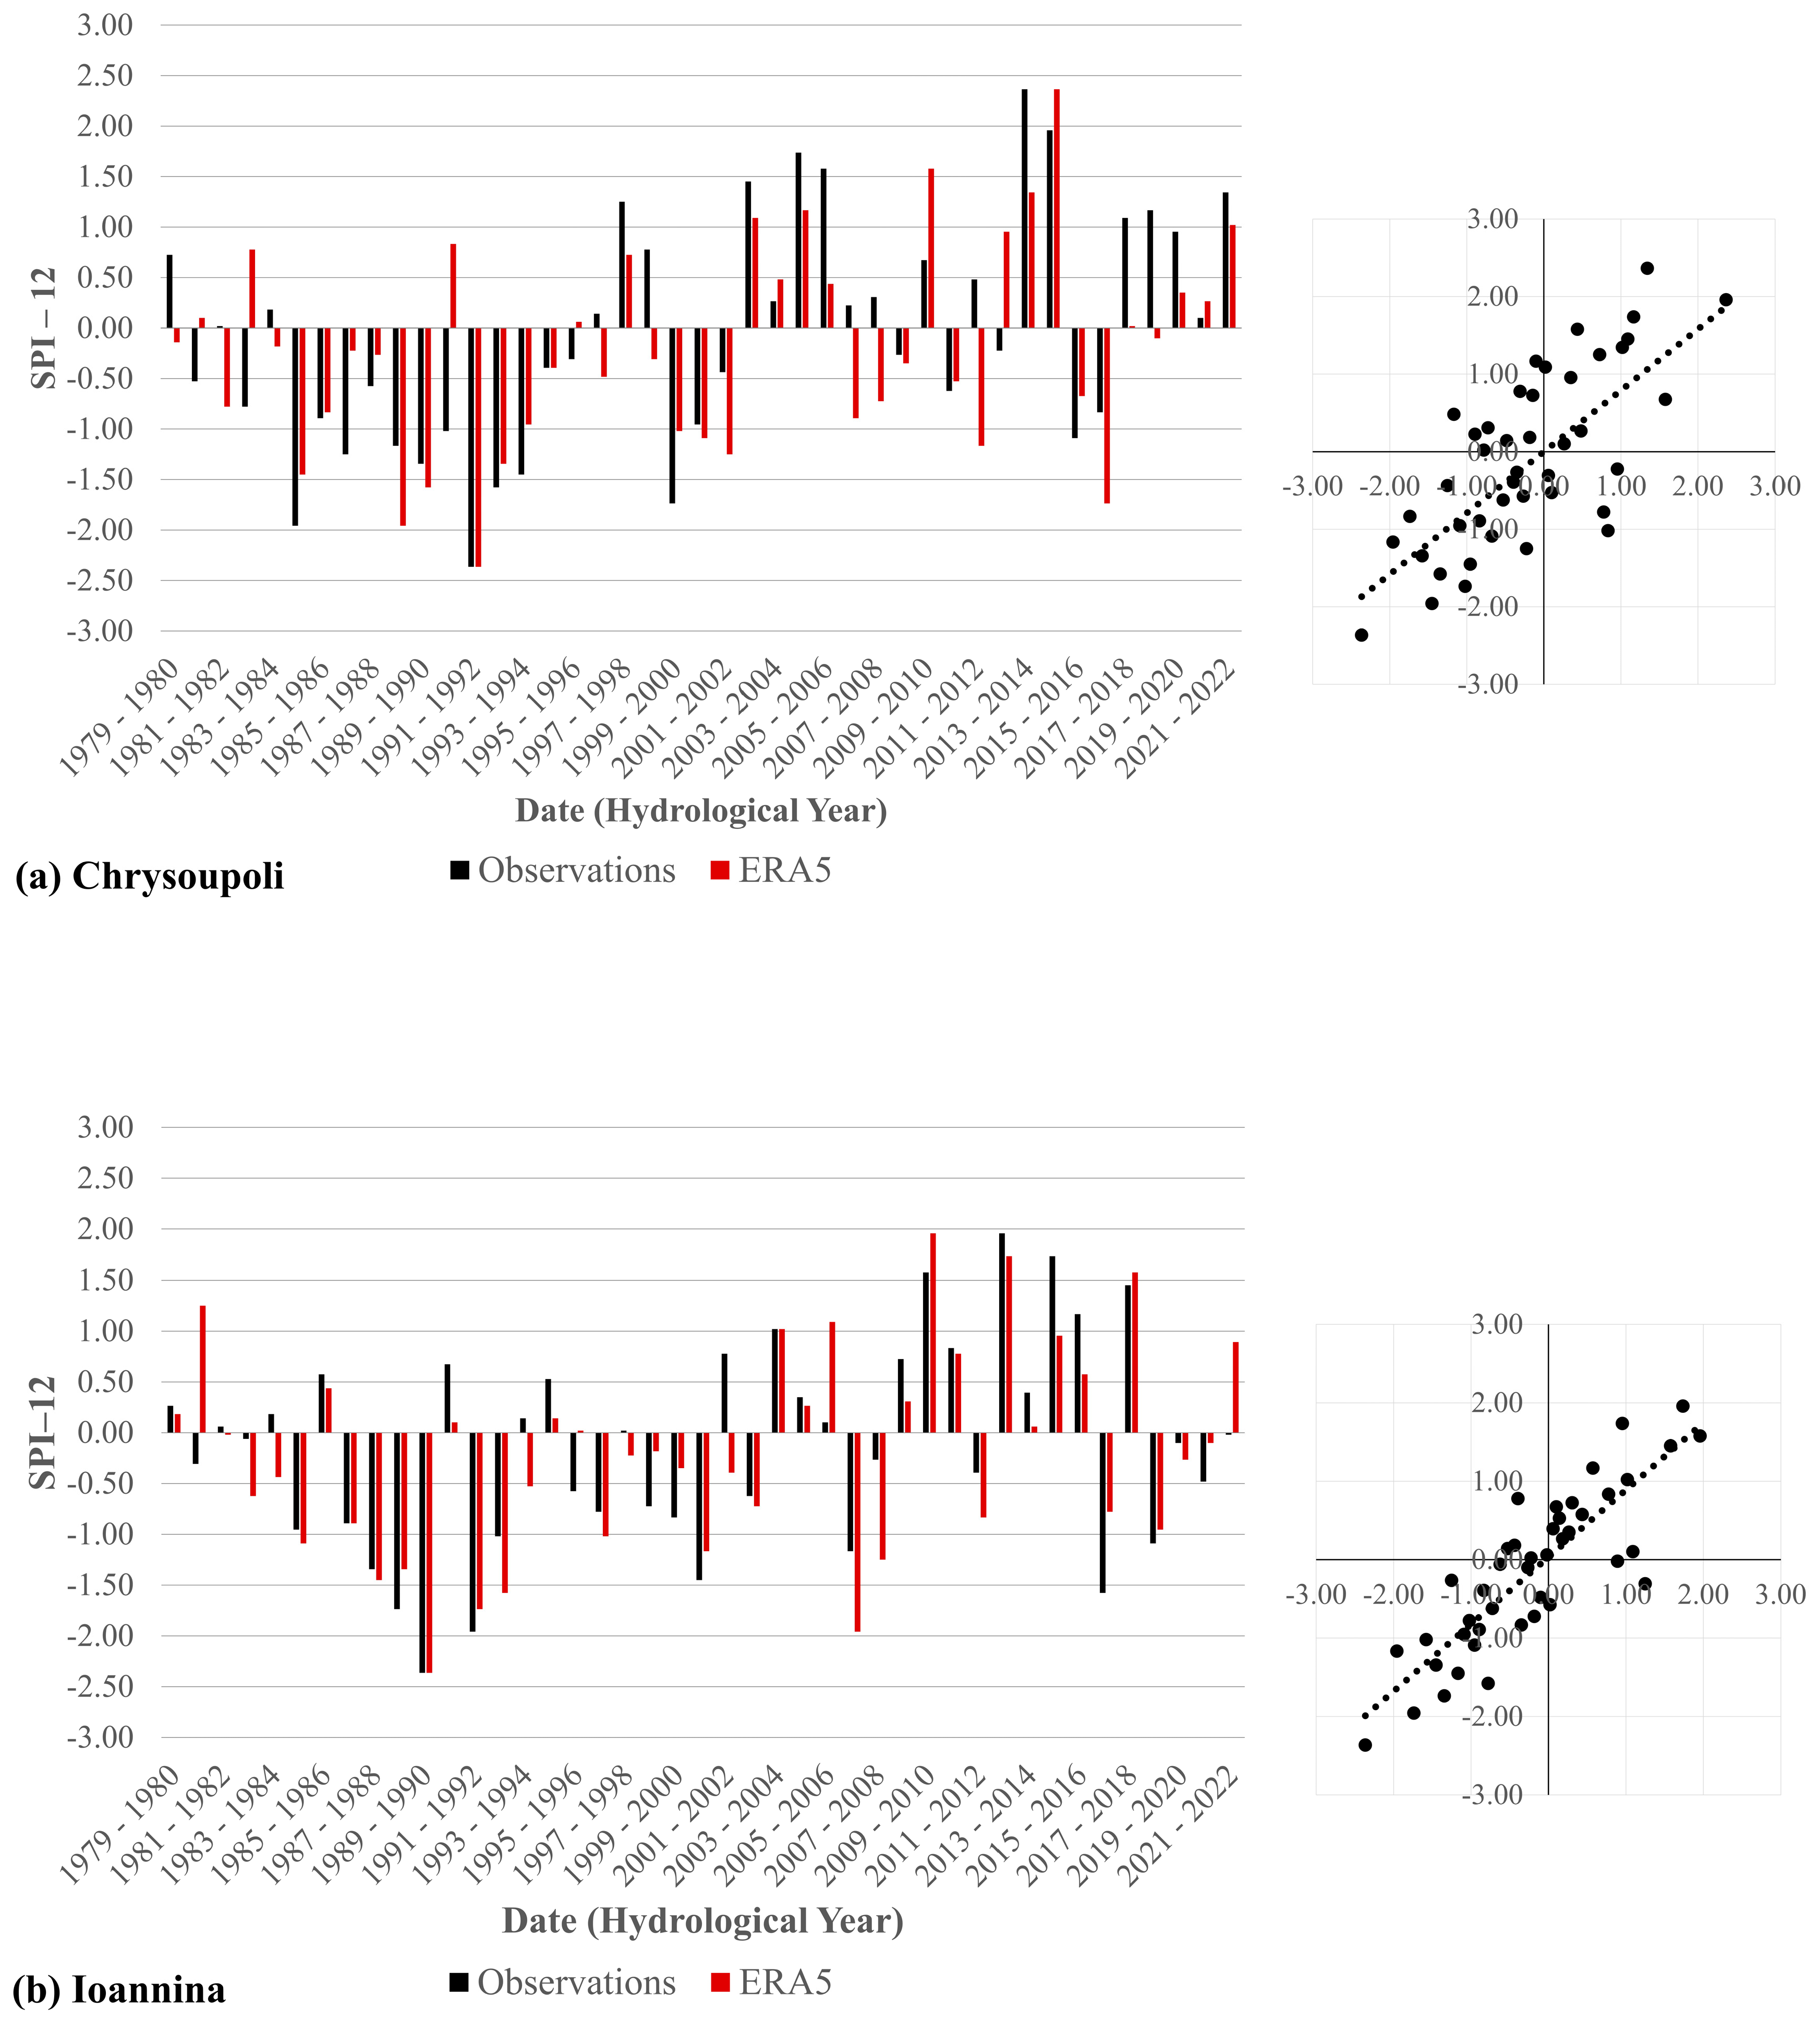
3.2. SPI and Drought Trend Analysis

The SPI for different timescales (1 month, 3 months, 6 months and 12 months) was estimated for the entire study region. Indicatively, Figure 4, Figure 5 and Figure 6 present the results for a period of low precipitation (Figure 4), a wet period (Figure 5) and a near-normal period (Figure 6).
Figure 4 presents the SPI results for 1-month (SPI-1 January 1990; Figure 4a), 3-month (SPI-3 January to March 1990; Figure 4b), 6-month (SPI-6 January to June 1990; Figure 4c) and 12-month (SPI-12 October 1989 to September 1990; Figure 4d) reference periods. It can be observed that during the specified hydrological year, the country experienced a meteorological drought of significant magnitude and areal extent, as indicated by the negative SPI values which fall under the severe or extreme drought categories (Table 1) for the selected reference periods and for almost the entire country.
Figure 4. SPI for Greece for a dry hydrological year (1989–1990).
Sustainability 15 15999 g004
Figure 5 presents indicative SPI results for 1-month (SPI-1 July 2002; Figure 5a), 3-month (SPI-3 July to September 2002; Figure 5b), 6-month (SPI-6 July to December 2002; Figure 5c) and 12-month (SPI-12 October 2002 to September 2003; Figure 5d) reference periods.
Figure 5. SPI for Greece for a wet hydrological year (2002–2003).
Sustainability 15 15999 g005
Figure 6 presents the indicative SPI results for 1-month (SPI-1 June 2018; Figure 6a), 3-month (SPI-3 April to June 2018; Figure 6b), 6-month (SPI-6 July to December 2018; Figure 6c) and 12-month (SPI-12 October 2018 to September 2019; Figure 6d) reference periods.
Figure 6. SPI for a hydrological year under near-normal conditions (2018–2019).
Sustainability 15 15999 g006
Finally, Figure 7 presents the spatial distribution of drought severity trends for the different timescales of SPI for the entire study region. Trend analysis was performed using the Theil–Sen slope estimator and the Mann–Kendall trend test. According to the results, the trend for SPI-3 October–December (Figure 7a), SPI-3 April–June (Figure 7b), SPI-6 July–December (Figure 7c) and SPI-12 October–December (Figure 7d) was not significant at the 95% confidence level in most parts of the study area. A statistically significant drought trend appears in the major agricultural area of Thessaly in the first trimester of the hydrological year (October–December), while a wetting, though non-significant, trend appears in most parts of the country in the spring period (April–June). According to the 6-month (Jul–Dec) SPI, a significant drought trend appears in the Cyclades region and a wetting trend is present in western parts of the country. The results of SPI-12 reveal a mixture of both an increasing wetting trend (western Greece, western and northern Crete and Peloponnese) and an increasing drought trend (Aegean Islands, eastern Crete and northern Greece). A significant trend at the 95% confidence level is exhibited in the Aegean Islands and western Peloponnese.

4. Discussion

The suitability of the ERA5 reanalysis dataset for characterising drought using the SPI index was qualitatively evaluated based on studies and reports from the literature regarding the historical conditions and drought events in the study area. In addition, the ERA5 reanalysis dataset was also quantitatively evaluated using observed rainfall from five meteorological stations in Greece.
A well-reported drought event that affected Greece was the multiyear drought during the period of 1989 to 1993. The specific drought event caused significant losses in agricultural production and major water scarcity issues, jeopardising the security of the water supply even in the capital of the country (Athens Metropolitan Area; [95]). The characteristics of drought magnitude, duration and areal extent of this event have been reported in several studies (e.g., [95,96,97,98]). The outcomes of the present study based on the ERA5 dataset are in line with these studies, indicating the accuracy and suitability of the approach for depicting this severe drought event.
Apart from this specific event, the outcomes of this study agree with the results presented in other drought studies in Greece, covering the entire study area or specific regions of the country, regarding the evolution of the magnitude and spatial distribution of the phenomenon. Indicatively, similar results have been reported in studies for several regions in Greece (e.g., [97,99,100]). Furthermore, similar outcomes have been reported by Caloiero et al. [101] regarding drought trends in the entire study area.
Quantitative evaluation of the ERA5 dataset in terms of drought characterisation was performed using observed precipitation data from five indicative meteorological stations located in north, west, east and south Greece [102]. The 12-month time scale was used for this comparison to take into account the conditions of the entire hydrological year. Details on the stations used are presented in Table 2. The closest ERA5 grid cell to each station was selected using the nearest neighbor approach. Evaluation of the ERA5 reanalysis dataset in terms of drought characterisation was accomplished using the following six metrics: (i) the Pearson correlation coefficient (r), (ii) Nash–Sutcliffe efficiency (NSE), (iii) the Root Mean Square Error (RMSE), (iv) R-squared (R2), (v) the Index of agreement (d) and (vi) the Mean absolute error (MAE). Finally, it must be noted that the ERA5 precipitation reanalysis dataset was also compared with monthly values of observed precipitation for the aforementioned stations. Comparison took place only in terms of R-squared, as the ERA5 precipitation dataset, at different spatiotemporal scales, has already been extensively assessed by various researchers (e.g., [103,104,105]). The ERA5 reanalysis dataset was selected and preferred over other reanalysis datasets as it has been evaluated and its capability in simulating monthly rainfall in the Extratropics has been corroborated [105].
Figure 8 presents the comparison of the observed monthly precipitation with the ERA5 monthly reanalysis precipitation for the period of 1979–1980 and 2021–2022 for the five stations, namely Chrysoupoli (Figure 8a), Ioannina (Figure 8b), Mytilini (Figure 8c), Souda (Figure 8d) and Sitia (Figure 8e). A relatively good agreement for monthly precipitation for the five stations can be observed, with the R-squared ranging from 0.69 to 0.84. It should be acknowledged that the evaluation of the ERA5 gridded dataset against point observations (i.e., stations) may lead to representativeness errors [106]. However, it must be noted that a dense network of stations for upscaling precipitation data at the grid cell size is not available in our study area; therefore, upscaling to the model grid could not take place.
Table 3 and Figure 9 present the performance of the ERA5 reanalysis dataset in terms of drought severity. The Pearson correlation coefficient (r) ranges of 0.62 to 0.85 indicate a moderate to strong correlation between the observed and the modelled annual drought (SPI-12) based on the station assessed. The other metrics, NSE, RMSE, R2, d and MAE, range from 0.22 to 0.69, 0.55 to 0.91, 0.38 to 0.70, 0.79 to 0.92 and 0.43 to 0.75, respectively. Overall, the data present variations in the assessment metrics across different regions of Greece. Figure 9 presents the comparison of SPI-12 calculated based on observed data and ERA5 reanalysis data for the periods of 1979–1980 and 2021–2022 for Chrysoupoli (Figure 9a), Ioannina (Figure 9b), Mytilini (Figure 9c), Souda (Figure 9d) and Sitia (Figure 9e).
As can be seen, the results are comparable in terms of drought characterisation between the two datasets. For instance, the extreme drought that affected Greece during the hydrological year of 1989–1990 (e.g., [95,98]) is well represented by the ERA5 reanalysis dataset. In general, the results suggest that the specific reanalysis dataset is able to detect drought events at the annual scale; thus, it can be used for drought characterisation across the Greek territory.

5. Conclusions

Spatial variability and annual rainfall and drought trends in Greece were analysed using rainfall from a reanalysis dataset spanning from 1940 to 2022 (83 years). Specifically, we utilised the ERA5 precipitation data of the European Centre for Medium-Range Weather Forecasts (ECMWF). Drought was analysed by means of the Standardized Precipitation Index (SPI) for different timescales (i.e., 1 month, 3 months, 6 months and 12 months). Trend analysis was carried out utilising the Theil–Sen slope estimator and Mann–Kendall trend test at the 95% significance level. The results revealed non-significant declining trends in annual precipitation at the national scale, but significant trends were evidenced for the Aegean Islands, western Crete and western Greece. Regarding drought analysis, the results are in line with those of previous drought studies in specific parts of the country, which used non-remote sensed precipitation data and applied different drought assessment methods. This reveals that the ERA5 dataset can reproduce past drought events and can be a valuable tool for drought identification. Furthermore, trend analysis for drought revealed non-significant drought severity trends for timescales of 1-, 3- and 6-month reference periods. On the other hand, significant drought severity trends for the 12-month timescale were detected for the Aegean Islands and western Peloponnese. Overall, it can be concluded that the ERA5 dataset can be a useful tool for drought identification and monitoring at the national scale and can be possibly incorporated into and used for the development of a drought forecasting and early warning system.

Author Contributions

Conceptualisation, I.M.K., H.V., D.T. and V.A.T.; methodology, I.M.K., H.V., D.T., A.M., I.N., G.T. and V.A.T.; software, I.M.K.; validation, H.V. and D.T.; formal analysis, I.M.K., H.V., D.T., I.N., G.T. and V.A.T.; investigation, I.M.K., H.V., D.T., I.N., G.T. and V.A.T.; resources, I.M.K., H.V., D.T., I.N., G.T. and V.A.T.; data curation, I.M.K. and A.M.; writing—original draft preparation, I.M.K., H.V. and D.T.; writing—review and editing, A.M., I.N., G.T. and V.A.T.; visualisation, I.M.K., H.V. and D.T.; supervision, I.N., G.T. and V.A.T. All authors have read and agreed to the published version of the manuscript.

Funding

This research received no external funding.

Institutional Review Board Statement

Not applicable.

Informed Consent Statement

Not applicable.

Data Availability Statement

The precipitation dataset presented in this study is openly available at the data server of the European Centre for Medium-Range Weather Forecasts (ECMWF) at https://cds.climate.copernicus.eu (accessed on 4 June 2023), reference number [42].

Acknowledgments

The authors would like to thank all the anonymous reviewers whose comments have greatly improved this manuscript.

Conflicts of Interest

The authors declare no conflict of interest.

References

  1. Tabari, H.; Willems, P. Sustainable development substantially reduces the risk of future drought impacts. Commun. Earth Environ. 2023, 4, 180. [Google Scholar] [CrossRef]
  2. Alehu, B.A.; Bitana, S.G. Assessment of Climate Change Impact on Water Balance of Lake Hawassa Catchment. Environ. Process. 2023, 10, 14. [Google Scholar] [CrossRef]
  3. Bayazit, M. Nonstationarity of Hydrological Records and Recent Trends in Trend Analysis: A State-of-the-art Review. Environ. Process. 2015, 2, 527–542. [Google Scholar] [CrossRef]
  4. Bhatt, D.; Sonkar, G.; Mall, R.K. Impact of Climate Variability on the Rice Yield in Uttar Pradesh: An Agro-Climatic Zone Based Study. Environ. Process. 2019, 6, 135–153. [Google Scholar] [CrossRef]
  5. Wang, D.; Hejazi, M.; Cai, X.; Valocchi, A.J. Climate change impact on meteorological, agricultural, and hydrological drought in central Illinois. Water Resour. Res. 2011, 47, 23–34. [Google Scholar] [CrossRef]
  6. Zou, L.; Xia, J.; She, D. Analysis of Impacts of Climate Change and Human Activities on Hydrological Drought: A Case Study in the Wei River Basin, China. Water Resour. Manag. 2018, 32, 1421–1438. [Google Scholar] [CrossRef]
  7. Colombani, N.; Dinelli, E.; Mastrocicco, M. Trend of Heavy Metal Release According to Forecasted Climate Change in the Po Delta. Environ. Process. 2016, 3, 553–567. [Google Scholar] [CrossRef]
  8. Amraoui, N.; Sbai, M.A.; Stollsteiner, P. Assessment of climate change impacts on water resources in the Somme River basin (France). Water Resour. Manag. 2019, 33, 2073–2092. [Google Scholar] [CrossRef]
  9. Arnell, N.W.; Gosling, S.N. The impacts of climate change on river flood risk at the global scale. Clim. Change 2016, 134, 387–401. [Google Scholar] [CrossRef]
  10. Dahal, V.; Shakya, N.M.; Bhattarai, R. Estimating the Impact of Climate Change on Water Availability in Bagmati Basin, Nepal. Environ. Process. 2016, 3, 1–17. [Google Scholar] [CrossRef]
  11. Golian, S.; Murphy, C. Evaluation of Sub-Selection Methods for Assessing Climate Change Impacts on Low-Flow and Hydrological Drought Conditions. Water Resour. Manag. 2021, 35, 113–133. [Google Scholar] [CrossRef]
  12. Zubaidi, S.L.; Ortega-Martorell, S.; Kot, P.; Alkhaddar, R.M.; Abdellatif, M.; Gharghan, S.K.; Ahmed, M.S.; Hashim, K. A method for predicting long-term municipal water demands under climate change. Water Resour. Manag. 2020, 34, 1265–1279. [Google Scholar] [CrossRef]
  13. Dubey, S.K.; Sharma, D. Spatio-Temporal Trends and Projections of Climate Indices in the Banas River Basin, India. Environ. Process. 2018, 5, 743–768. [Google Scholar] [CrossRef]
  14. Kamali, S.; Asghari, K. The Effect of Meteorological and Hydrological Drought on Groundwater Storage Under Climate Change Scenarios. Water Resour. Manag. 2023, 37, 2925–2943. [Google Scholar] [CrossRef]
  15. Padhiary, J.; Patra, K.C.; Dash, S.S. A Novel Approach to Identify the Characteristics of Drought under Future Climate Change Scenario. Water Resour. Manag. 2022, 36, 5163–5189. [Google Scholar] [CrossRef]
  16. Mengistu, D.; Bewket, W.; Dosio, A.; Panitz, H.J. Climate change impacts on water resources in the upper blue nile (Abay) river basin, Ethiopia. J. Hydrol. 2021, 592, 125614. [Google Scholar] [CrossRef]
  17. Guerriero, V.; Scorzini, A.R.; Di Lena, B.; Iulianella, S.; Di Bacco, M.; Tallini, M. Impact of Climate Change on Crop Yields: Insights from the Abruzzo Region, Central Italy. Sustainability 2023, 15, 14235. [Google Scholar] [CrossRef]
  18. Caloiero, T.; Veltri, S.; Caloiero, P.; Frustaci, F. Drought Analysis in Europe and in the Mediterranean Basin Using the Standardized Precipitation Index. Water 2018, 10, 1043. [Google Scholar] [CrossRef]
  19. Sun, J.; Bi, S.; Bashir, B.; Ge, Z.; Wu, K.; Alsalman, A.; Ayugi, B.O.; Alsafadi, K. Historical Trends and Characteristics of Meteorological Drought Based on Standardized Precipitation Index and Standardized Precipitation Evapotranspiration Index over the Past 70 Years in China (1951–2020). Sustainability 2023, 15, 10875. [Google Scholar] [CrossRef]
  20. Yilmaz, A.G.; Perera, B.J.C. Spatiotemporal Trend Analysis of Extreme Rainfall Events in Victoria, Australia. Water Resour. Manag. 2015, 29, 4465–4480. [Google Scholar] [CrossRef]
  21. Chandrakar, A.; Khare, D.; Krishan, R. Assessment of Spatial and Temporal Trends of Long Term Precipitation over Kharun Watershed, Chhattisgarh, India. Environ. Process. 2017, 4, 959–974. [Google Scholar] [CrossRef]
  22. Chen, J.; Zhang, B.; Zhou, J.; Guo, F. Temporal and Spatial Changes of Drought Characteristics in Temperate Steppes in China from 1960 to 2020. Sustainability 2023, 15, 12909. [Google Scholar] [CrossRef]
  23. Darko, S.; Adjei, K.A.; Gyamfi, C.; Odai, S.N.; Osei-Wusuansa, H. Evaluation of RFE Satellite Precipitation and its Use in Streamflow Simulation in Poorly Gauged Basins. Environ. Process. 2021, 8, 691–712. [Google Scholar] [CrossRef]
  24. Muse, N.M.; Tayfur, G.; Safari, M.J.S. Meteorological Drought Assessment and Trend Analysis in Puntland Region of Somalia. Sustainability 2023, 15, 10652. [Google Scholar] [CrossRef]
  25. Dau, Q.V.; Kuntiyawichai, K.; Adeloye, A.J. Future Changes in Water Availability Due to Climate Change Projections for Huong Basin, Vietnam. Environ. Process. 2021, 8, 77–98. [Google Scholar] [CrossRef]
  26. Ashraf, M.S.; Shahid, M.; Waseem, M.; Azam, M.; Rahman, K.U. Assessment of Variability in Hydrological Droughts Using the Improved Innovative Trend Analysis Method. Sustainability 2023, 15, 9065. [Google Scholar] [CrossRef]
  27. Echeta, O.C.; Adjei, K.A.; Andam-Akorful, S.A.; Gyamfi, C.; Darko, D.; Odai, S.N.; Kwarteng, E.V.S. Performance Evaluation of Near-Real-Time Satellite Rainfall Estimates over Three Distinct Climatic Zones in Tropical West-Africa. Environ. Process. 2022, 9, 59. [Google Scholar] [CrossRef]
  28. Abbas, S.A.; Xuan, Y.; Song, X. Quantile Regression Based Methods for Investigating Rainfall Trends Associated with Flooding and Drought Conditions. Water Resour. Manag. 2019, 33, 4249–4264. [Google Scholar] [CrossRef]
  29. Summers, J.K.; Lamper, A.; McMillion, C.; Harwell, L.C. Observed Changes in the Frequency, Intensity, and Spatial Patterns of Nine Natural Hazards in the United States from 2000 to 2019. Sustainability 2022, 14, 4158. [Google Scholar] [CrossRef] [PubMed]
  30. Rocha, J.; Carvalho-Santos, C.; Diogo, P.; Beça, P.; Keizer, J.J.; Nunes, J.P. Impacts of climate change on reservoir water availability, quality and irrigation needs in a water scarce Mediterranean region (southern Portugal). Sci. Total Environ. 2020, 736, 139477. [Google Scholar] [CrossRef]
  31. Abdelmalek, M.B.; Nouiri, I. Study of trends and mapping of drought events in Tunisia and their impacts on agricultural production. Sci. Total Environ. 2020, 734, 139311. [Google Scholar] [CrossRef]
  32. FAO. Proactive Approaches to Drought Preparedness—Where Are We Now and Where Do We Go from Here? FAO: Rome, Italy, 2019. [Google Scholar]
  33. Cheng, L.; Hoerling, M.; Aghakouchak, A.; Livneh, B.; Quan, X.W.; Eischeid, J. How has human-induced climate change affected California drought risk? J. Clim. 2016, 29, 111–120. [Google Scholar] [CrossRef]
  34. Oroud, I.M. Global Warming and its Implications on Meteorological and Hydrological Drought in the Southeastern Mediterranean. Environ. Process. 2018, 5, 329–348. [Google Scholar] [CrossRef]
  35. Vicente-Serrano, S.M.; Domínguez-Castro, F.; Reig, F.; Tomas-Burguera, M.; Peña-Angulo, D.; Latorre, B.; Beguería, S.; Rabanaque, I.; Noguera, I.; Lorenzo-Lacruz, J.; et al. A global drought monitoring system and dataset based on ERA5 reanalysis: A focus on crop-growing regions. Geosci. Data J. 2022, 10, 505–518. [Google Scholar] [CrossRef]
  36. Tarawneh, Z.; Hyari, K.; Katkhuda, H. Evaluating the Characteristics of Multiyear Extreme Droughts in Semi-Arid Regions. Environ. Process. 2017, 4, 683–696. [Google Scholar] [CrossRef]
  37. Tigkas, D.; Tsakiris, G. Early Estimation of Drought Impacts on Rainfed Wheat Yield in Mediterranean Climate. Environ. Process. 2015, 2, 97–114. [Google Scholar] [CrossRef]
  38. Svoboda, M.; Fuchs, B.A. Handbook of Drought Indicators and Indices; Integrated Drought Management Programme (IDMP), Integrated Drought Management Tools and Guidelines Series 2; World Meteorological Organization (WMO) and Global Water Partnership (GWP): Geneva, Switzerland, 2016. [Google Scholar]
  39. Yu, H.; Zhang, Q.; Xu, C.Y.; Du, J.; Sun, P.; Hu, P. Modified palmer drought severity index: Model improvement and application. Environ. Int. 2019, 130, 104951. [Google Scholar] [CrossRef]
  40. Zarei, A.R. Evaluation of Drought Condition in Arid and Semi- Arid Regions, Using RDI Index. Water Resour. Manag. 2018, 32, 1689–1711. [Google Scholar] [CrossRef]
  41. Surendran, U.; Anagha, B.; Raja, P.; Kumar, V.; Rajan, K.; Jayakumar, M. Analysis of Drought from Humid, Semi-Arid and Arid Regions of India Using DrinC Model with Different Drought Indices. Water Resour. Manag. 2019, 33, 1521–1540. [Google Scholar] [CrossRef]
  42. Khanmohammadi, N.; Rezaie, H.; Montaseri, M.; Behmanesh, J. The Effect of Temperature Adjustment on Reference Evapotranspiration and Reconnaissance Drought Index (RDI) in Iran. Water Resour. Manag. 2017, 31, 5001–5017. [Google Scholar] [CrossRef]
  43. Merabti, A.; Martins, D.S.; Meddi, M.; Pereira, L.S. Spatial and Time Variability of Drought Based on SPI and RDI with Various Time Scales. Water Resour. Manag. 2018, 32, 1087–1100. [Google Scholar] [CrossRef]
  44. Nemati, A.; Najafabadi, S.H.G.; Joodaki, G.; Nadoushani, S.S.M. Spatiotemporal Drought Characterization Using Gravity Recovery and Climate Experiment (GRACE) in the Central Plateau Catchment of Iran. Environ. Process. 2020, 7, 135–157. [Google Scholar] [CrossRef]
  45. Zhang, Q.; Shi, R.; Xu, C.Y.; Sun, P.; Yu, H.; Zhao, J. Multisource data-based integrated drought monitoring index: Model development and application. J. Hydrol. 2022, 615, 128644. [Google Scholar] [CrossRef]
  46. Ullah, H.; Akbar, M. Drought Risk Analysis for Water Assessment at Gauged and Ungauged Sites in the Low Rainfall Regions of Pakistan. Environ. Process. 2021, 8, 139–162. [Google Scholar] [CrossRef]
  47. Lin, Y.C.; Kuo, E.D.; Chi, W.J. Analysis of Meteorological Drought Resilience and Risk Assessment of Groundwater Using Signal Analysis Method. Water Resour. Manag. 2021, 35, 179–197. [Google Scholar] [CrossRef]
  48. Ploszai, R.; Mine, M.R.M.; Detzel, D.H.M. An Analysis of Non-stationary Drought Conditions in Parana State Based on Climate Change Scenarios. Water Resour. Manag. 2022, 36, 3401–3415. [Google Scholar] [CrossRef]
  49. Khalili, D.; Farnoud, T.; Jamshidi, H.; Kamgar-Haghighi, A.A.; Zand-Parsa, S. Comparability Analyses of the SPI and RDI Meteorological Drought Indices in Different Climatic Zones. Water Resour. Manag. 2011, 25, 1737–1757. [Google Scholar] [CrossRef]
  50. Zarei, A.R.; Shabani, A.; Mahmoudi, M.R. Susceptibility Assessment of Winter Wheat, Barley and Rapeseed to Drought Using Generalized Estimating Equations and Cross-Correlation Function. Environ. Process. 2021, 8, 163–197. [Google Scholar] [CrossRef]
  51. Guo, H.; Bao, A.; Liu, T.; Ndayisaba, F.; He, D.; Kurban, A.; De Maeyer, P. Meteorological Drought Analysis in the Lower Mekong Basin Using Satellite-Based Long-Term CHIRPS Product. Sustainability 2017, 9, 901. [Google Scholar] [CrossRef]
  52. Shiru, M.S.; Shahid, S.; Alias, N.; Chung, E.-S. Trend Analysis of Droughts during Crop Growing Seasons of Nigeria. Sustainability 2018, 10, 871. [Google Scholar] [CrossRef]
  53. Chen, T.; Xia, G.; Liu, T.; Chen, W.; Chi, D. Assessment of Drought Impact on Main Cereal Crops Using a Standardized Precipitation Evapotranspiration Index in Liaoning Province, China. Sustainability 2016, 8, 1069. [Google Scholar] [CrossRef]
  54. Chattopadhyay, S.; Edwards, D.R.; Yu, Y.; Hamidisepehr, A. An Assessment of Climate Change Impacts on Future Water Availability and Droughts in the Kentucky River Basin. Environ. Process. 2017, 4, 477–507. [Google Scholar] [CrossRef]
  55. Gul, E.; Staiou, E.; Safari, M.J.S.; Vaheddoost, B. Enhancing Meteorological Drought Modeling Accuracy Using Hybrid Boost Regression Models: A Case Study from the Aegean Region, Türkiye. Sustainability 2023, 15, 11568. [Google Scholar] [CrossRef]
  56. Haied, N.; Foufou, A.; Khadri, S.; Boussaid, A.; Azlaoui, M.; Bougherira, N. Spatial and Temporal Assessment of Drought Hazard, Vulnerability and Risk in Three Different Climatic Zones in Algeria Using Two Commonly Used Meteorological Indices. Sustainability 2023, 15, 7803. [Google Scholar] [CrossRef]
  57. Isia, I.; Hadibarata, T.; Jusoh, M.N.H.; Bhattacharjya, R.K.; Shahedan, N.F.; Bouaissi, A.; Fitriyani, N.L.; Syafrudin, M. Drought Analysis Based on Standardized Precipitation Evapotranspiration Index and Standardized Precipitation Index in Sarawak, Malaysia. Sustainability 2023, 15, 734. [Google Scholar] [CrossRef]
  58. Sirisena, J.; Augustijn, D.; Nazeer, A.; Bamunawala, J. Use of Remote-Sensing-Based Global Products for Agricultural Drought Assessment in the Narmada Basin, India. Sustainability 2022, 14, 13050. [Google Scholar] [CrossRef]
  59. Moazzam, M.F.U.; Rahman, G.; Munawar, S.; Farid, N.; Lee, B.G. Spatiotemporal Rainfall Variability and Drought Assessment during Past Five Decades in South Korea Using SPI and SPEI. Atmosphere 2022, 13, 292. [Google Scholar] [CrossRef]
  60. Achite, M.; Krakauer, N.Y.; Wałęga, A.; Caloiero, T. Spatial and Temporal Analysis of Dry and Wet Spells in the Wadi Cheliff Basin, Algeria. Atmosphere 2021, 12, 798. [Google Scholar] [CrossRef]
  61. Latifoğlu, L.; Özger, M. A Novel Approach for High-Performance Estimation of SPI Data in Drought Prediction. Sustainability 2023, 15, 14046. [Google Scholar] [CrossRef]
  62. An, S.; Park, G.; Jung, H.; Jang, D. Assessment of Future Drought Index Using SSP Scenario in Republic of Korea. Sustainability 2022, 14, 4252. [Google Scholar] [CrossRef]
  63. Zare, M.; Azam, S.; Sauchyn, D.; Basu, S. Assessment of Meteorological and Agricultural Drought Indices under Climate Change Scenarios in the South Saskatchewan River Basin, Canada. Sustainability 2023, 15, 5907. [Google Scholar] [CrossRef]
  64. Abushandi, E.; Al Ajmi, M. Assessment of Hydrological Extremes for Arid Catchments: A Case Study in Wadi Al Jizzi, North-West Oman. Sustainability 2022, 14, 14028. [Google Scholar] [CrossRef]
  65. Palazzolo, N.; Peres, D.J.; Bonaccorso, B.; Cancelliere, A. A Probabilistic Analysis of Drought Areal Extent Using SPEI-Based Severity-Area-Frequency Curves and Reanalysis Data. Water 2023, 15, 3141. [Google Scholar] [CrossRef]
  66. Vasiliades, L.; Loukas, A.; Liberis, N. A water balance derived drought index for Pinios River Basin, Greece. Water Resour. Manag. 2011, 25, 1087–1101. [Google Scholar] [CrossRef]
  67. Merabti, A.; Darouich, H.; Paredes, P.; Meddi, M.; Pereira, L.S. Assessing Spatial Variability and Trends of Droughts in Eastern Algeria Using SPI, RDI, PDSI, and MedPDSI—A Novel Drought Index Using the FAO56 Evapotranspiration Method. Water 2023, 15, 626. [Google Scholar] [CrossRef]
  68. Tsakiris, G.; Vangelis, H. Towards a drought watch system based on spatial SPI. Water Resour. Manag. 2004, 18, 1–12. [Google Scholar] [CrossRef]
  69. David, V.; Davidová, T. Relating hydrological and meteorological drought indices in order to identify causes of low flows in the catchment of Blanice river. Environ. Process. 2017, 4, 149–161. [Google Scholar] [CrossRef]
  70. Tigkas, D.; Vangelis, H.; Tsakiris, G. Drought characterisation based on an agriculture-oriented standardised precipitation index. Theor. Appl. Climatol. 2019, 135, 1435–1447. [Google Scholar] [CrossRef]
  71. Tsakiris, G.; Vangelis, H. Establishing a drought index incorporating evapotranspiration. Eur. Water 2005, 9, 3–11. [Google Scholar]
  72. Tsakiris, G.; Pangalou, D.; Vangelis, H. Regional drought assessment based on the Reconnaissance Drought Index (RDI). Water Resour. Manag. 2007, 21, 821–833. [Google Scholar] [CrossRef]
  73. Svoboda, M.; Hayes, M.; Wood, D. Standardized Precipitation Index User Guide; (WMO-No. 1090); World Meteorological Organization: Geneva, Switzerland, 2012. [Google Scholar]
  74. Varlas, G.; Stefanidis, K.; Papaioannou, G.; Panagopoulos, Y.; Pytharoulis, I.; Katsafados, P.; Papadopoulos, A.; Dimitriou, E. Unravelling Precipitation Trends in Greece since 1950s Using ERA5 Climate Reanalysis Data. Climate 2022, 10, 12. [Google Scholar] [CrossRef]
  75. Tladi, T.M.; Ndambuki, J.M.; Salim, R.W. Meteorological drought monitoring in the Upper Olifants sub-basin, South Africa. Phys. Chem. Earth 2022, 128, 103273. [Google Scholar] [CrossRef]
  76. Tzanis, C.G.; Koutsogiannis, I.; Philippopoulos, K.; Deligiorgi, D. Recent climate trends over Greece. Atmos. Res. 2019, 230, 104623. [Google Scholar] [CrossRef]
  77. Vangelis, H.; Zotou, I.; Kourtis, I.M.; Bellos, V.; Tsihrintzis, V.A. Relationship of Rainfall and Flood Return Periods through Hydrologic and Hydraulic Modeling. Water 2022, 14, 3618. [Google Scholar] [CrossRef]
  78. Tarek, M.; Brissette, F.P.; Arsenault, R. Large-scale analysis of global gridded precipitation and temperature datasets for climate change impact studies. J. Hydrometeorol. 2020, 21, 2623–2640. [Google Scholar] [CrossRef]
  79. Lee, S.; Lee, S.J.; Jang, K.; Chun, J.H. Drought monitoring based on vegetation type and reanalysis data in Korea. Atmosphere 2021, 12, 170. [Google Scholar] [CrossRef]
  80. Torres-Vázquez, M.Á.; Halifa-Marín, A.; Montávez, J.P.; Turco, M. High resolution monitoring and probabilistic prediction of meteorological drought in a Mediterranean environment. Weather Clim. Extrem. 2023, 40, 100558. [Google Scholar] [CrossRef]
  81. Zhang, R.; Li, L.; Zhang, Y.; Huang, F.; Li, J.; Liu, W.; Mao, T.; Xiong, Z.; Shangguan, W. Assessment of agricultural drought using soil water deficit index based on ERA5-land soil moisture data in four southern provinces of China. Agriculture 2021, 11, 411. [Google Scholar] [CrossRef]
  82. Greene, C.A.; Thirumalai, K.; Kearney, K.A.; Delgado, J.M.; Schwanghart, W.; Wolfenbarger, N.S.; Thyng, K.M.; Gwyther, D.E.; Gardner, A.S.; Blankenship, D.D. The Climate Data Toolbox for MATLAB. Geochem. Geophys. Geosyst. 2019, 20, 3774–3781. [Google Scholar] [CrossRef]
  83. Kourtis, I.M.; Nalbantis, I.; Tsakiris, G.; Psiloglou, B.; Tsihrintzis, V.A. Updating IDF Curves Under Climate Change: Impact on Rainfall-Induced Runoff in Urban Basins. Water Resour. Manag. 2022, 37, 2403–2428. [Google Scholar] [CrossRef]
  84. Hersbach, H.; Bell, B.; Berrisford, P.; Biavati, G.; Horányi, A.; Muñoz Sabater, J.; Nicolas, J.; Peubey, C.; Radu, R.; Rozum, I.; et al. ERA5 monthly averaged data on single levels from 1940 to present. Copernic. Clim. Change Serv. (C3S) Clim. Data Store (CDS) 2023, 10, 252–266. [Google Scholar]
  85. McKee, T.B.; Doeskin, N.J.; Kleist, J. The relationship of drought frequency and duration to time scales. In Proceedings of the 8th Conference on Applied Climatology, Anaheim, CA, USA, 17–23 January 1993; American Meteorological Society: Boston, MA, USA, 1993; pp. 179–184. [Google Scholar]
  86. Thom, H.C.S. A note on the gamma distribution. Mon. Weather. Rev. 1958, 86, 117–122. [Google Scholar] [CrossRef]
  87. Edwards, D.C.; McKee, T.B. Characteristics of 20th Century Drought in the United States at Multiple Time Scales; Climatology Report No. 97-2; Colorado State University: Fort Collins, CO, USA, 1997. [Google Scholar]
  88. Abramovitz, M.; Stegun, I. Handbook of Mathematical Functions; National Bureau of Standards, Applied Mathematics Serie; U.S. Government Printing Office: Washington, DC, USA, 1965; Volume 55.
  89. Zarch, M.A.A.; Sivakumar, B.; Sharma, A. Droughts in a warming climate: A global assessment of Standardized precipitation index (SPI) and Reconnaissance drought index (RDI). J. Hydrol. 2015, 526, 183–195. [Google Scholar] [CrossRef]
  90. Sen, P.K. Estimates of the regression coefficient based on Kendall’s tau. J. Am. Stat. Assoc. 1968, 63, 1379–1389. [Google Scholar] [CrossRef]
  91. Theil, H.A. Rank-Invariant Method of Linear and Polynomial Regression Analysis. In Henri Theil’s Contributions to Economics and Econometrics: Econometric Theory and Methodology; Springer: Amsterdam, The Netherlands, 1992; Volume 23, pp. 345–381. [Google Scholar]
  92. Mann, H.B. Nonparametric Tests Against Trend. Econometrica 1945, 13, 245–259. [Google Scholar] [CrossRef]
  93. Kendall, M. Rank Correlation Methods; Griffin: London, UK, 1975; 202p. [Google Scholar]
  94. Shukor, M.S.A.; Yusop, Z.; Yusof, F.; Sa’adi, Z.; Alias, N.E. Detecting Rainfall Trend and Development of Future Intensity Duration Frequency (IDF) Curve for the State of Kelantan. Water Resour. Manag. 2020, 34, 3165–3182. [Google Scholar] [CrossRef]
  95. Nalbantis, I. Evaluation of a Hydrological Drought Index. Eur. Water 2008, 23, 67–77. [Google Scholar]
  96. Loukas, A.; Vasiliades, L. Probabilistic analysis of drought spatiotemporal characteristics in Thessaly region, Greece. Nat. Hazards Earth Syst. Sci. 2004, 4, 719–731. [Google Scholar] [CrossRef]
  97. Tigkas, D. Drought Characterisation and Monitoring in Regions of Greece. Eur. Water 2008, 23, 29–39. [Google Scholar]
  98. Kostopoulou, E.; Giannakopoulos, C.; Krapsiti, D.; Karali, A. Temporal and spatial trends of the standardized precipitation index (SPI) in Greece using observations and output from regional climate models. In Perspectives on Atmospheric Sciences; Springer International Publishing: New York, NY, USA, 2017; pp. 475–481. [Google Scholar]
  99. Vasiliades, L.; Loukas, A. Hydrological response to meteorological drought using the Palmer drought indices in Thessaly, Greece. Desalination 2009, 237, 3–21. [Google Scholar] [CrossRef]
  100. Proutsos, N.D.; Tigkas, D.; Tsevreni, I.; Tsevreni, M. Drought assessment in Nestos river basin (N. Greece) for the period 1955–2018. In Proceedings of the 10th International Conference on Information and Communication Technologies in Agriculture, Food and Environment, HAICTA, Athens, Greece, 22–25 September 2022. [Google Scholar]
  101. Caloiero, T.; Coscarelli, R.; Ferrari, E.; Sirangelo, B. Temporal Analysis of Rainfall Categories in Southern Italy (Calabria Region). Environ. Process. 2017, 4 (Suppl. S1), 113–124. [Google Scholar] [CrossRef]
  102. Argiriou, A.A.; Li, Z.; Armaos, V.; Mamara, A.; Shi, Y.L.; Yan, Z.W. Homogenised monthly and daily temperature and precipitation time series in China and Greece since 1960. Adv. Atmos. Sci. 2023, 40, 1326–1336. [Google Scholar] [CrossRef]
  103. Beck, H.E.; Pan, M.; Roy, T.; Weedon, G.P.; Pappenberger, F.; Van Dijk, A.I.; Huffman, G.J.; Adler, R.F.; Wood, E.F. Daily evaluation of 26 precipitation datasets using Stage-IV gauge-radar data for the CONUS. Hydrol. Earth Syst. Sci. 2019, 23, 207–224. [Google Scholar] [CrossRef]
  104. Jiang, Q.; Li, W.; Fan, Z.; He, X.; Sun, W.; Chen, S.; Wen, J.; Gao, J.; Wang, J. Evaluation of the ERA5 reanalysis precipitation dataset over Chinese Mainland. J. Hydrol. 2021, 595, 125660. [Google Scholar] [CrossRef]
  105. Lavers, D.A.; Simmons, A.; Vamborg, F.; Rodwell, M.J. An evaluation of ERA5 precipitation for climate monitoring. Q. J. R. Meteorol. Soc. 2022, 148, 3152–3165. [Google Scholar] [CrossRef]
  106. Haiden, T.; Dahoui, M.; Ingleby, B.; de Rosnay, P.; Prates, C.; Kuscu, E.; Hewson, T.; Isaksen, L.; Richardson, D.; Zuo, H.; et al. Use of In Situ Surface Observations at ECMWF; Technical Memorandum No. 834; European Centre for Medium Range Weather Forecasts: Reading, UK, 2018. [Google Scholar] [CrossRef]
Figure 1. Workflow of the study methodology.
Sustainability 15 15999 g001
Figure 2. Mean annual precipitation for the period of 1940–2022.
Sustainability 15 15999 g002
Figure 3. Trend of annual precipitation for the period of 1940–2022. Black dots indicate statistically significant trends at the 95% significance level.
Sustainability 15 15999 g003
Figure 7. SPI trend analysis for (a) SPI-3 October–December, (b) SPI-3 April–June, (c) SPI-6 July–December and (d) SPI-12 October–December. Black dots indicate statistically significant trends at the 95% significance level.
Sustainability 15 15999 g007
Figure 8. Comparison of observed and ERA5 monthly rainfall for the periods of 1979–1980 and 2021–2022 for (a) Chrysoupoli, (b) Ioannina, (c) Mytilini, (d) Souda and (e) Sitia.
Sustainability 15 15999 g008
Figure 9. Comparison of SPI-12 calculated based on observed data and ERA5 reanalysis data for the periods of 1979–1980 and 2021–2022 for (a) Chrysoupoli, (b) Ioannina, (c) Mytilini, (d) Souda, and (e) Sitia.
Sustainability 15 15999 g009aSustainability 15 15999 g009b
Table 1. Classification of drought intensity based on SPI values.
SPI ValueCategory
≥2.00Extremely wet
1.50 to 1.99Severely wet
1.00 to 1.49Moderately wet
0 to 0.99Near normal (mildly wet)
0 to −0.99Near normal (mild drought)
−1.00 to −1.49Moderate drought
−1.50 to −1.99Severe drought
≤−2Extreme drought
Table 2. Stations used for evaluation of the ERA5 dataset.
a/aStationLongitudeLatitudeElevation
1Chrysoupoli24.623240.91834.2
2Ioannina20.819339.6949474.7
3Mytilini26.603839.05414.2
4Souda24.145435.5288147.6
5Sitia26.102935.2156113.6
Table 3. SPI-12 metrics calculated based on observed data and ERA5 reanalysis dataset for the periods of 1979–1980 and 2021–2022 for the five stations.
a/aStationrNSERMSER2dMAE
1Chrysoupoli0.730.490.810.530.850.66
2Ioannina0.850.690.550.730.920.43
3Mytilini0.780.610.820.610.880.45
4Souda0.660.280.830.440.810.66
5Sitia0.620.220.910.380.790.75
Disclaimer/Publisher’s Note: The statements, opinions and data contained in all publications are solely those of the individual author(s) and contributor(s) and not of MDPI and/or the editor(s). MDPI and/or the editor(s) disclaim responsibility for any injury to people or property resulting from any ideas, methods, instructions or products referred to in the content.

