
Resilience-Driven Optimal Sizing of Energy Storage Systems in Remote Microgrids
by
 , , ,
, , ,
Irina Picioroaga
*,
Madalina Luca
,
Andrei Tudose
,
Dorian Sidea
,
Mircea Eremia
and
Constantin Bulac
Department of Electrical Power Systems, National University of Science and Technology “Politehnica” of Bucharest, 060042 Bucharest, Romania
*
Author to whom correspondence should be addressed.
Sustainability 2023, 15(22), 16002; https://doi.org/10.3390/su152216002
Submission received: 7 September 2023
/
Revised: 10 November 2023
/
Accepted: 14 November 2023
/
Published: 16 November 2023
(This article belongs to the Special Issue Sustainable Power System Optimization: Operation, Distribution and Application)
Abstract
:As climate changes intensify the frequency of severe outages, the resilience of electricity supply systems becomes a major concern. In order to simultaneously combat the climate problems and ensure electricity supply in isolated areas, renewable energy sources (RES) have been widely implemented in recent years. However, without the use of energy storage, they show low reliability due to their intermittent output. Therefore, this article proposes a methodology to achieve the optimal sizing of an energy storage system (ESS) to ensure predefined periods of safe operation for an ensemble consisting of multiple loads, renewable energy sources and controllable generators, located in a remote microgrid. In this regard, a mixed integer linear programming (MILP) model has been proposed to reduce the outages impact of critical loads by calculating the optimal ESS capacity and defining the proper resources management within the off-grid microgrid, while ensuring a cost-effective operation of its components.
1. Introduction
Most developed countries worldwide are becoming seriously concerned about global warming and its devastating effects, the depletion of fossil fuels, and the degradation of the environment in general. Certainly, the efficient use of energy and the reduction of greenhouse gas emissions are becoming extremely important objectives for the near future [1]. In this context, the development and use of renewable energy sources (RES) have experienced rapid growth in recent years, in the medium- and long-term spectrum as well [2]. Therefore, it is currently estimated that most energy systems will soon be based on the rational use of conventional resources and on a greater use of renewable energy sources [3,4].
On the other hand, there are still numerous remote areas that face the so-called energy poverty, defined by the lack of access to reliable electricity service [5]. In most cases, the supply of areas isolated from the main grid is achieved with difficulty through the traditional power lines. Whether it is the high cost related to the construction of new lines, or the characteristics of the land that do not allow their construction, it is necessary to implement new solutions to ensure the electricity supply. In these circumstances, distributed energy sources and the integration of storage systems can play an important role in overcoming this problem [6]. Microgrids (MG) have been implemented worldwide with the main purpose of mitigating the negative impact on the environment, by facilitating the integration of distributed renewable energy generation [7,8]. MGs can supply remote areas as well, but they are constrained by the inclusion of a key component, namely the energy storage solutions [9].
Extreme events concern high-impact and low-probability incidents, such as hurricanes, earthquakes, and even human attacks, which lead to extensive power outages [10]. In February 2021, severe winter storms across the state of Texas led to blackouts experienced by up to 10 million citizens, some for more than 72 h [11], while the recent power outage that occurred in Pakistan in January 2023 has once again brought to attention the vulnerability of power grids to modern threats, namely cyberattacks [12]. To reduce damage, resilience enhancement has become the main driver in power systems development. Given the vast disruptions following the extreme events, resilience strategies must focus on restoring high rates of critical loads such as medical units, transportation, and telecommunications [13]. Various resilience-driven planning approaches have been proposed in recent research, with microgrids and energy storage systems representing the most promising solutions due to their unique functions [14,15]. Intrinsically, microgrids have two main operating modes: on-grid and off-grid. As studies targeting the grid-connected MGs mainly concentrate on the benefits brought to the main grid in terms of losses and operating costs reduction [16,17,18], off-grid mode became the focal point for resilience enhancement strategies. However, as the main energy sources within microgrids, RESs raise new challenges in terms of MG operation considering their intermittent nature and unpredictable behavior. Due to these drawbacks of solar and wind energy in particular, the deployment of additional flexible energy sources (such as diesel generators and microturbines) is required to overcome the RES uncertainties and enhance the operational stability [19,20,21]. Fast-responding generators serve as a practical solution to unpredicted generation deficit and mitigate the risk of supply interruption caused by solar and wind production variability. On the other hand, the time-shifting properties of energy storage systems make them indispensable in order to deal with power demand uncertainties. Energy storage systems provide various improvements in power system operation, including frequency and voltage regulation, power stability and quality, increased reliability, contingency service, etc. A bi-level MILP-based energy management system is proposed in [22] for grid-connected battery energy storage systems (BESS), where the first level schedules the BESS participation in an ancillary service market and the second level optimally distributes the power set-points previously computed among the single batteries that make up the BESS. In [23], a hierarchical energy management strategy is proposed to properly coordinate multiple small-scaled battery energy storage systems to regulate power systems frequency, while a two-stage optimization approach based on a Neural Network Optimization Algorithm is proposed in [24] for voltage regulation in low-voltage distribution networks embedded with high residential rooftop PV systems. Nevertheless, to properly serve their functionality, energy storage devices require sizing and allocation according to the system’s interest needs and objectives. In ref. [25], two meta-heuristic algorithms, namely genetic algorithms (GA) and particle swarm optimization (PSO), are used for optimally siting and sizing of BESS in distribution networks in order to mitigate the effects of RES fluctuations on energy supply reliability and quality. Meta-heuristics are explored as well in [26], where the BESS sizing problem is solved based on a bi-level hybrid PSO-quadratic programming algorithm, which considers the cooperative operations of controllable components in a microgrid. In terms of resilience-related goals, authors of [27] investigate design aspects in low-voltage grids focusing on various BESS capacities and voltage level control with active power regulation in energy communities, while [13] proposes a centralized shared energy storage capacity optimization model that aims to minimize the operational costs in resilience microgrids using a two-layered approach. Similar methodologies are presented in [28,29], where the first stage focuses on the optimal sizing of ESS, while the second stage analyzes the ESS efficiency in ensuring high resilience in terms of load supply by optimal scheduling under abnormal operation circumstances. Previous studies focused on the normal operating conditions of the microgrid to determine the size of the storage system, following the ESS efficiency evaluation in maintaining the power supply during emergency conditions at a later stage. Under these circumstances, the ESS sizing is mainly influenced by the initial design conditions, which may affect its supply capacity during fault scenarios. On these grounds, we propose a robust algorithm that simultaneously considers both the optimal sizing and operation of an energy storage system in a remote microgrid aiming to reach a predefined level of resilience. The goal is to mitigate for pre-established periods (in terms of safe operation days) the impact of prolonged outages on critical loads after the occurrence of an extreme event, combined with a cost-effective allocation of MG resources during the disruption. The main contributions of this research are summarized as follows:
- A novel formulation for the resilience-driven ESS sizing problem that provides the optimal capacity of energy storage devices to ensure the critical loads survivability for predefined time intervals. Simultaneously, the proposed algorithm optimizes the other MG resources scheduling in order to achieve an economically efficient operation.
- Validation of the proposed methodology effectiveness by conducting multiple simulations implying high and low values for the MG load and generation availability. To verify the advantages of using the proposed algorithm to enhance the MG resilience, the load restoration rates are investigated for both with and without ESS cases.
- Evaluation of the ESS impact on the MG resilience improvement by defining two new indices, precisely the restoration index and the resilience index.
The remainder of this paper is organized as follows: Section 2 includes the optimization problem formulation for the resilience-oriented ESS sizing method and the resilience indices definition, Section 3 introduces the analyzed case studies, and Section 4 contains the simulations and the results discussions. Finally, Section 5 concludes the paper.
2. Problem Formulation
In this study, the resilience enhancement for a remote microgrid is achieved by ensuring the reliable power supply for the critical loads. The resilience-driven ESS sizing problem is solved using a mixed integer linear programming (MILP) approach. In this regard, the optimal sizing of the energy storage system is identified by minimizing the total operation cost of a remote microgrid, while properly managing the local resources to provide the critical loads supply during the entire outage period. It should be mentioned that along with the energy storage system and three types of loads () with three different levels of criticality, the microgrid will include photovoltaics and a wind turbine as main energy sources, as well as a microturbine (MT) and a diesel generator to mitigate the RES generation uncertainties.
2.1. Objective Function
To ensure the resilience of the microgrid for a specified period of N days, the overall operation costs are considered as the ESS sizing criterion. In this regard, the objective function of the model defined in (1) comprises the operation costs of the controllable generators (consisting of the microturbine and the diesel generator) denoted by CCG [30], the annual cost of energy storage capacity investment defined by CESS [31], the MG equipment maintenance cost CO&M, the emissions costs for the MT and diesel Cemissions [28], and the load shedding penalties Cshedding [32].
In (2), the controllable generators’ (CG) operational costs during time frame t are computed based on the diesel power output Pdiesel, fixed coefficients related to the diesel generator operation cost α2, α1, and α0, and the microturbine power production PMT and its exploitation costs defined by coefficients β1 and β0. The ESS costs for the analysis duration are computed by dividing the annual investment to the number of days within a year of operation (Nyr = 365 days) and multiplying by the number of operating days, N. In (3), PESS and EESS represent the power and energy capacity that resulted following the optimization calculation, and represent unit power and energy capacity cost coefficients, r is the discount rate, and L is the ESS lifespan in years. Based on the obtained power capacity, the operation and maintenance costs, and the installation costs are considered based on and coefficients. The maintenance costs for the diesel generation, microturbine, wind turbine, and photovoltaics are calculated in (4) for each time frame t using the cost coefficients , , , and . Here, PPV and PWT are solar and wind generation during time frame t. The pollutants’ emissions costs are computed for the two types of conventional generators in (5) based on the price coefficient ψ and emission factor µ. In order to prioritize sensitive users, a shedding cost will be assigned to each load i in (6), while Psh,i defines the shedding power applied to each load i.
2.2. Constraints
The power balance of the microgrid during each time frame t is denoted by (7), while (8), (9), and (10) represent the load shedding and RES curtailment limits.
Here, PLi represents the demand of each of the three types of loads i considered in this study, while and define the ESS charging and discharging power during time interval t. The PV and WT production after curtailment measures must not exceed the maximum generation forecasting, and .
To establish the optimal operation scheduling for the microgrid, the physical constraints of the generators ( and ) must be considered. Equations (11) and (12) define the output limits of the CG units, while (13)–(16) indicate their ramp up and down capability boundaries, based on their capabilities and [33].
The discharging and charging powers are constrained based on the ESS boundaries, as shown in (17) and (18). Here, and , , and , respectively, represent the minimum and maximum limits for the charging and discharging powers. The binary variable λESS is introduced to avoid the simultaneous charging and discharging of the system, where 1 will define the discharging mode while 0 will model the charging or standby mode. The energy storage system dynamics (state of charge—SOC) are modeled through a linear model as shown in (19), where and represent the charging/discharging efficiency of the ESS. Further, Equation (20) restricts the maximum allowable SOC of the ESS. In this paper, the time period length ∆t is of 1 h.
Several studies have proposed detailed modeling of the ESS state of health degradation [35,36]. However, the presented approaches imply non-linear models defined by numerous variables, which in terms of optimal planning problems lead to unacceptable computational effort and local optima risks [37]. Therefore, this study focuses on a more suitable method that considers the cycle-life degradation characteristics of energy storage systems in terms of corresponding maximum allowable cycles and the depth of discharge at which it will be operated during the project lifetime.
Each ESS technology presents a limited lifespan given by an estimated number of charging cycles. There are multiple factors that affect the ESS performance and state of health, including temperature, moisture, and deep discharging [38]. To make sure the ESS achieves the considered L lifespan, a series of measures are applied in the ESS operation. Along with constraint (21), which eliminates the risk of deep discharging by limiting the depth of discharge (DOD), Equations (22) and (23) are introduced to prevent the energy storage system from being charged and discharged frequently. In this regard, a limited number of allowable charging/discharging cycles is established as ΩESS. To quantify the operation mode changes, the binary variable ωESS will be 1 when λESS shifts its value during two consecutive time intervals, according to (22). Otherwise, ωESS will be 0 due to the minimization nature of the problem. Finally, Equation (24) defines the state of charge at the beginning of the analysis based on a predefined coefficient, ξESS.
2.3. Resilience Indices
As the main goal of this study is to evaluate the resilient performance of the microgrid against extreme phenomena, two resilience indices have been defined to quantify the effectiveness of the ESS sizing and operation planning.
Firstly, the restoration index, defined by (25), is calculated as the ratio of the total supplied (restored) load to the total demand.
The resilience index, defined by (26), is calculated similarly to the restoration index, the difference involving the integration of the restored load importance into the equation by considering the shedding cost. Thus, in unfavorable cases where load shedding maneuvers are mandatory, this index monitors the extent to which the priority of the restored load has been taken into account.
For both indices, the values vary between 0 and 1, where 0 describes worst case scenarios (no supply is provided) and 1 represents the best scenario when all loads are fully supplied.
The CPLEX (IBM ILOG CPLEX Optimization Studio V12.6.3) optimizer integrated in the MATLAB R2022a environment has been used in this paper to solve the optimization model.
3. Case Study
Figure 1 shows the schematic of the test microgrid configuration considered for this study. As previously reported in Section 2, the system is composed of three types of loads, renewable energy sources (one photovoltaic installation and one wind turbine), two controllable generators, and an energy storage system. It must be mentioned that controllable generators refer to dispatchable diesel and microturbine generation units able to modify their production according to the microgrid control center request. The consumption within the microgrid is categorized into three different classes based on the supply reliability requirements. Thus, Load 1 refers to critical consumers who require a high availability of electricity supply; therefore, they will be prioritized in case of emergency. Load 2 refers to preferential consumers, who accept short-term outages, and Load 3 consists of standard (non-critical) consumers, who accept the available reliability level provided by the MG operation conditions. The microgrid is connected to the main power system through the point of common coupling (PCC). However, the remote location of the microgrid—outside the expandable areas of the power network—makes the only line connection to the main grid prone to failures that cause supply interruptions, lasting from a few hours up to several days. During this analysis, prolonged disruptions are considered to occur on the MG’s main grid connection, leaving the microgrid in stand-alone operation mode. Under these circumstances, the energy storage system becomes essential in maintaining the balance between generation and demand. For the proper islanded operation, proper control strategies are required. The MG-associated resources are coordinated by means of local controllers (LC) according to the microgrid central controller (MGCC) commands in order to achieve the power balance within the islanded microgrid. For the integration in the alternating current microgrid of the ESS, PV, and WT, DC/AC converters are used to insure the interface.
According to authors’ previous work, the uncertainties of energy production and demand represent risk factors in the proper operation of microgrids. As presented in [39], solar production variations can fluctuate by up to 0.186 p.u. during generation peak and by 0.405 p.u. for wind generation, respectively. In order to overcome these inaccuracies in RES generation forecasting, alternative sources (diesel generators and microturbines) were integrated as backup resources in the microgrid to satisfy the power deficit. The characteristics of the diesel generator, namely the costs of generation and maintenance, maximum generation capacity, and ramp up/down capabilities, are shown in Table 1. Likewise, the microturbine specifications are provided in Table 2. To reduce the MG’s environmental impact, greenhouse gas emissions costs are considered as well, which corresponds to the current trends regarding the intrusion of a carbon tax in many jurisdictions [40,41]. Therefore, Table 3 provides the pollutant components and emission factors used in this paper.
The parameters of the energy storage system are represented in Table 4 and Table 5 and include the maximum rated power, charging/discharging efficiency, minimum and maximum state of charge, investment and maintenance costs, and maximum number of charging/discharging cycles per day. The depth of the discharge (DOD) is considered 0.8 [42], while the initial SOC at the beginning of the outage (ξESS) is considered 0.4, based on authors’ previous work, for the improved operation performance of the microgrid [43]. The technology considered for the energy storage system is lithium-ion batteries.
Furthermore, the load curtailment costs implemented for the three types of loads are centralized in Table 6.
4. Results and Discussion
To evaluate the model performance, multiple scenarios are analyzed. Firstly, Case a focuses on microgrid operation without the energy storage system. Therefore, the generation units (diesel generator, photovoltaics, micro- and wind turbine) must be optimally scheduled in order to supply the load demand. Case b implies the integration of an optimal-sized ESS in the microgrid, based on the proposed algorithm. To compute the ESS capacity and MG resilience enhancement, three off-grid operation periods are considered: 1 day (Scenario 1), 3 days (Scenario 2), and 7 days (Scenario 3), respectively.
4.1. Scenario 1
The first case study focuses on a 24 h analysis for the post-fault operation of the microgrid. The load demand profiles and the forecasted PV and WT maximum generation are shown in Figure 2. Load 1, representing the most critical users in this study, features a quasi-constant consumption during the day, while Loads 2 and 3 present demand peaks during daytime and low consumption during nighttime. On the other hand, the PV generation reaches its peak between 11:00 and 14:00, while consistent wind production is considered for the entire day.
By running the proposed algorithm, the optimal sizing of the ESS needed to ensure maximized load supply for the specified time interval of 1 day resulted to be 601.79 kW rated power. It must be mentioned that for the ESS sizing, a 4:1 ratio of rated energy to rated power was considered. The optimal scheduling of the ESS operation can be observed in Figure 3. It can be observed that charging occurs mostly due to the photovoltaics’ excess generation, while discharge hours are scheduled during the morning (5.00–9.00) and evening peaks (19.00–24.00). However, to be able to cover the morning peak, additional charging takes place during the first hours of the day. To validate the algorithm’s efficiency in terms of optimal resource planning, the scenarios with and without an energy storage system are further compared in Figure 4, where positive values depict the generation and negative values represent the power consumption within the MG.
The comparison of the two scenarios reflects a series of problems encountered in the microgrid that are solved in the latter case. First of all, the high production from renewable energy sources that exceeds the total power demand in several time intervals requires for Case a the implementation of curtailment actions between 11.00 and 17.00 to ensure the generation-consumption balance within the microgrid. Also, the high demand during the morning (05.00–09.00) makes it necessary to start the diesel unit to provide the users’ supply. Similarly, during the evening, the diesel generator is used once again to cover the evening peak. However, in the second case (Case b), the cooperation between RES and ESS leads to less production curtailment, which demostrates the efficiency of storage devices in solving the temporary discrepancy problem between generation and consumption. Also, by integrating the ESS, the use of polluting energy production technologies is drastically reduced—especially the diesel generator, which, in this case study, is not started at all.
4.2. Scenario 2
For this case study, the desired survivability period as a goal in the optimal sizing of the energy storage system is 3 days (N = 3). In this case, the obtained capacity of the ESS is 759.22 kW. The considered hourly demand and maximum generation of RES are depicted in Figure 5. For PV production, similar profiles are considered for the 72-h analysis, while for wind generation, both high and very low production hours will be considered.
Figure 6 illustrates the ESS behavior over the 3-day period. It can be observed that during the first day, longer charging periods take place to ensure the necessary reserve to supply the critical load during the second operation day, which consists of low wind generation. On the other hand, prolonged charging periods occur during the last day of analysis in order to achieve the demand-production balance without resorting to wind and solar curtailment, as total power demand decreases while RES production is high.
Once again, the scenarios with and without the ESS are compared in Figure 7. It can be easily noted that without the use of ESS, load shedding measures (especially Load 3) are required for several time intervals throughout the 3 days. Also, the operation of the microturbine and the diesel generator is intensified, with multiple hours of operation at maximum capacity. Unlike the previous scenario, due to lower production from RES—even with ESS installation—it is necessary to start up the diesel generator to guarantee the load supply during peak demand.
4.3. Scenario 3
Finally, a 7-day analysis was performed. For this case study, the obtained sizing of the ESS is 584.48 kW. The considered load and RES generation curves are illustrated in Figure 8 and Figure 9. Once again, Load 1 is described by slight variations in consumption, while Loads 2 and 3 feature peaks and valleys in power demand. During the 7 days of the analysis, different production conditions for solar and wind were considered.
Figure 10 depicts the ESS operation planning over the 7-day period. It can be observed that charging mode focuses on RES peak production intervals, while discharging takes place during low generation hours. In the last two days of the analysis, the overlap of high wind production periods with the low consumption hours of Load 3 causes the charging-discharging cycles of the storage system to intensify in order to avoid RES generation curtailment.
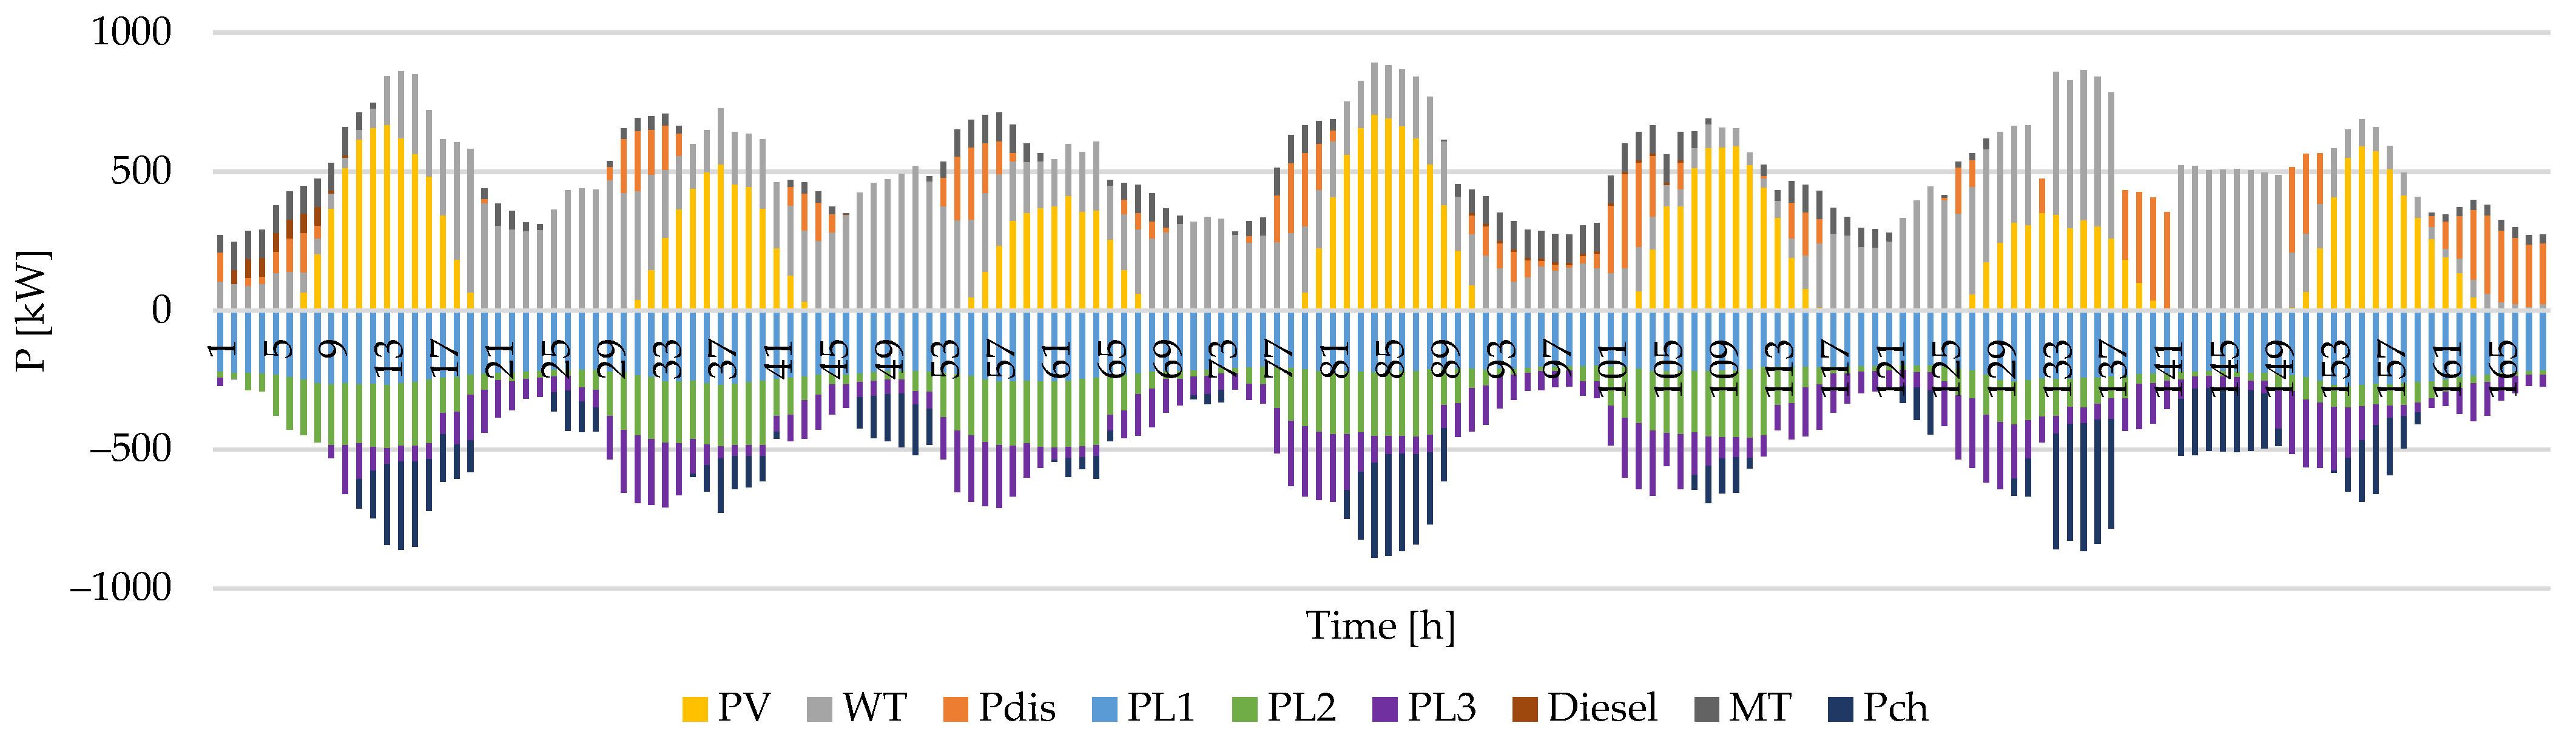
The comparative results between the cases with and without the storage system are illustrated in Figure 11 and Figure 12. In terms of pollutant generation units, it can be observed that in the first case, the use of diesel is mandatory to ensure critical load supply during peak intervals. The diesel unit is used along with Load 3 shedding in the second case—but only during the first hours of the outage—as a correlation between reduced wind generation and low ESS charge. However, for the rest of the 7-day period, the need of diesel and load shedding measures is completely eliminated due to the ESS operation.
4.4. Overall Results
The overall operation costs for the analyzed case studies are centralized in Table 7 for both cases (with/without ESS). It can be observed that for all cases, the optimal ESS sizing and scheduling reduce the MG operation costs by 65.74%, 29.51%, and 62.57%, respectively. These massive cost reductions are due to a better exploitation of the solar and wind power potential, which allows the minimization of the load shedding rates, simultaneously with a decrease in polluting generation technologies use. These aspects are visible in Scenarios 1 and 3, in which the operating costs of controllable generators and GHG emission penalties decrease by 99.74% and 73.7%, respectively.
In terms of supply restoration rates, it can be observed in Table 8 that without storage possibility, full supply of the loads during peak hours cannot be achieved. Despite ensuring 100% supply for Load 1, the load shedding for Load 2 reaches 1.68% for Scenario 2 and 25.84% for Load 3. However, with the improved interaction between the MG components due to the ESS integration, the reduction in load shedding penalties allows an extension in MT and diesel use. Without ESS, the sharp load variation and the limited ramp up/down capabilities of the controllable generation units confine the MT and diesel use, leading to higher rates of load shedding. Applying the resulting operating plan, the load curtailment costs are reduced to zero in Scenario 2.
To evaluate the algorithm’s performance regarding the MG resilience enhancement, the restoration and resilience indices defined in Section 2 are further computed in Table 9. If the restoration index is a quantitative indicator that monitors the loads’ restoration rate regardless of their type, the resilience index is a qualitative indicator that monitors the effectiveness of resilience strategies in terms of prioritizing the most important users. On these grounds, higher values of the resilience index, with respect to the restoration index, reveal efficient and resilient strategies as the limited generation resources are focused on the critical loads in the event of a long-term failure.
It can be noted that, compared to the scenario without ESS, the use of the energy storage system leads to indices closer to the maximum value in all three analyzed cases. However, for both cases, the optimization algorithm concentrates the microgrid resources on the critical loads supply, resorting to load shedding only among lower priority categories.
5. Conclusions
Energy storage systems are a recent and relevant topic in the field of energy efficiency, as they can help overcome the dependence on the main grid and can successfully improve the utilization of renewable energy sources. This paper proposes a deterministic ESS sizing approach focused on resilience enhancement for the remote users’ supply, as the optimal coordination of the ESS, renewable energy sources, and controllable generators maximizes the critical loads operation. In this regard, the total operation costs of a remote microgrid are considered in order to establish the proper capacity of the ESS. Based on the obtained results, it can be concluded that the optimal sizing of the energy storage system can provide the essential flexibility of a remote microgrid to fulfill the electricity demand during a multi-day interruption, without employing load and generation curtailment strategies. To prove the algorithm’s efficiency, three scenarios with different survivability periods set as goals were analyzed for a test microgrid. In all three cases, the integration of an optimally sized ESS led to an increase in the load restoration rate, despite the low RES generation conditions. At the same time, the total operating costs of the microgrid were significantly reduced, with polluting generation technologies being used to a lesser extent. Within these scenarios, various production and consumption profiles were analyzed to investigate the efficiency of the algorithm. The resulting sizes of the energy storage system varied depending on the analyzed case. The largest obtained size, of 759.22 kW rated power, resulted in Scenario 2, in which a 3-day survivability was desired for the MG. Here, extreme conditions were considered as operating scenarios by combining days with low RES production correlated with high consumption and days of high production with low power demand. To compensate for these sudden variations while maintaining the power balance in the MG without resorting to load or generation curtailment, a higher dimensioning of the ESS was necessary. The smallest size of the ESS was obtained in Scenario 3, where the longer period of operation allowed a more efficient distribution of resources throughout the 7 days of operation. Since the purpose of the analysis was the resilience enhancement in terms of operation planning, two quantification indicators were defined, namely the restoration index and the resilience index. Following their calculation, higher values were obtained by integrating the optimally sized ESS. However, even without ESS, the proposed operation scheduling algorithm prioritized the critical users for supply, at the expense of a higher rate of load shedding from lower-importance categories.
Author Contributions
Conceptualization, I.P. and M.L.; methodology, I.P., M.L. and A.T.; software, I.P. and A.T.; validation, I.P., M.E. and C.B.; formal analysis, I.P.; investigation, I.P., A.T. and D.S.; resources, A.T. and D.S.; data curation, I.P., M.E. and A.T.; writing—original draft preparation, I.P., A.T. and M.L.; writing—review and editing, A.T. and D.S.; visualization, I.P.; supervision, M.E. and C.B.; project administration, I.P.; funding acquisition, C.B. All authors have read and agreed to the published version of the manuscript.
Funding
This research received no external funding.
Institutional Review Board Statement
Not applicable.
Informed Consent Statement
Not applicable.
Data Availability Statement
Data are contained within the article.
Acknowledgments
The results presented in this article were obtained with the support of the Ministry of Investments and European Projects through the Human Capital Sectoral Operational Program 2014–2020, Contract no. 62461/03.06.2022, SMIS code 153735.
Conflicts of Interest
The authors declare no conflict of interest.
References
- Norişor, M.; Ban, D.; Pătraşcu, R.; Minciuc, E. Complex, energy, economic and environmental analysis of different solutions for integrating solar thermal panels (PT) into district heating substation (DHS). UPB Sci. Bull. Ser. C 2022, 84, 247–258. [Google Scholar]
- Brenna, M.; Foiadelli, F.; Longo, M.; Zaninelli, D. Correlation between renewable power plants and voltage dips in electrical distribution systems. UPB Sci. Bull. Ser. C 2017, 79, 153–170. [Google Scholar]
- Gielen, D.; Boshell, F.; Saygin, D.; Bazilian, M.D.; Wagner, N.; Gorini, R. The role of renewable energy in the global energy transformation. Energy Strategy Rev. 2019, 24, 38–50. [Google Scholar] [CrossRef]
- Wang, Q.; Hou, Z.; Guo, Y.; Huang, L.; Fang, Y.; Sun, W.; Ge, Y. Enhancing Energy Transition through Sector Coupling: A Review of Technologies and Models. Energies 2023, 16, 5226. [Google Scholar] [CrossRef]
- Al-Rubaye, H.; Smith, J.; Zangana, M.; Nagapurkar, P.; Zhou, Y.; Gelles, G. Advances in Energy Hybridization for Resilient Supply: A Sustainable Approach to the Growing World Demand. Energies 2022, 15, 5903. [Google Scholar] [CrossRef]
- Sanduleac, M.; Toma, L.; Bulac, C.; Eremia, M.; Golovanov, N.; Porumb, R.; Albu, M.; Gheorghe, S.; Chimirel, C. Energy storage for reaching 100% CO2 free and 100% RES–Preliminary case study for Romania. In Proceedings of the 2017 International Conference on Energy and Environment (CIEM), Bucharest, Romania, 19–20 October 2017. [Google Scholar]
- Liu, X.; Su, B. Microgrids—An integration of renewable energy technologies. In Proceedings of the 2008 China International Conference on Electricity Distribution, Guangzhou, China, 10–13 December 2008. [Google Scholar]
- Ivanov, O.; Neagu, B.; Cibotărică, A.; Gavrilaş, M. Multiobjective Prosumer Surplus Management for Optimal Microgrid Operation. In Proceedings of the 2021 10th International Conference on Energy and Environment (CIEM), Bucharest, Romania, 14–15 October 2021. [Google Scholar]
- Ali, Z.M.; Calasan, M.; Abdel Aleem, S.H.E.; Jurado, F.; Gandoman, F.H. Applications of Energy Storage Systems in Enhancing Energy Management and Access in Microgrids: A Review. Energies 2023, 16, 5930. [Google Scholar] [CrossRef]
- Panteli, M.; Pickering, C.; Wilkinson, S.; Dawson, R.; Mancarella, P. Power System Resilience to Extreme Weather: Fragility Modeling, Probabilistic Impact Assessment, and Adaptation Measures. IEEE Trans. Power Syst. 2017, 32, 3747–3757. [Google Scholar] [CrossRef]
- Busby, J.W.; Baker, K.; Bazilian, M.D.; Gilbert, A.Q.; Grubert, E.; Rai, V.; Rhodes, J.D.; Shidore, S.; Smith, C.A.; Webber, M.E. Cascading risks: Understanding the 2021 winter blackout in Texas. Energy Res. Soc. Sci. 2021, 77, 102106. [Google Scholar] [CrossRef]
- Salik, H.; Zahid, R.I.; Akhunzada, B.K. Cyber Threats to Pakistan’s National Power Grid. Geopolitics 2023, 3, 25–30. [Google Scholar]
- Du, X.; Li, X.; Hao, Y.; Chen, L. Sizing of centralized shared energy storage for resilience microgrids with controllable load: A bi-level optimization approach. Front. Energy Res. 2022, 10, 954833. [Google Scholar] [CrossRef]
- Bosisio, A.; Moncecchi, M.; Cassetti, G.; Merlo, M. Microgrid design and operation for sensible loads: Lacor hospital case study in Uganda. Sustain. Energy Technol. Assess. 2019, 36, 100535. [Google Scholar] [CrossRef]
- Nguyen, T.; Copp, D.; Byrne, R. Stacking Revenue from Energy Storage Providing Resilience, T&D Deferral and Arbitrage. In Proceedings of the 2019 IEEE Power & Energy Society General Meeting (PESGM), Atlanta, GA, USA, 4–8 August 2019. [Google Scholar]
- Aghdam, F.H.; Ghaemi, S.; Kalantari, N.T. Evaluation of loss minimization on the energy management of multi-microgrid based smart distribution network in the presence of emission constraints and clean productions. J. Clean. Prod. 2018, 196, 185–201. [Google Scholar] [CrossRef]
- Arpanahi, M.K.; Nateghi, A.; Shafie-khah, M. A Coordinated Decentralized Loss Minimization Scheme for Hybrid AC/DC Distribution System with Multiple Microgrids. In Proceedings of the 2021 International Conference on Smart Energy Systems and Technologies (SEST), Vaasa, Finland, 6–8 September 2021. [Google Scholar]
- Gao, J.; Chen, J.J.; Cai, Y.; Zeng, S.Q.; Peng, K. A two-stage microgrid cost optimization considering distribution network loss and voltage deviation. Energy Rep. 2020, 6, 263–267. [Google Scholar] [CrossRef]
- Bouchekara, H.R.E.H.; Sha’aban, Y.A.; Shahriar, M.S.; Abdullah, S.M.; Ramli, M.A. Sizing of Hybrid PV/Battery/Wind/Diesel Microgrid System Using an Improved Decomposition Multi-Objective Evolutionary Algorithm Considering Uncertainties and Battery Degradation. Sustainability 2023, 15, 11073. [Google Scholar] [CrossRef]
- Premadasa, P.N.D.; Silva, C.M.M.R.S.; Chandima, D.P.; Karunadasa, J.P. A multi-objective optimization model for sizing an off-grid hybrid energy microgrid with optimal dispatching of a diesel generator. J. Energy Storage 2023, 68, 107621. [Google Scholar] [CrossRef]
- Shahbazbegian, V.; Dehghani, F.; Shafiyi, M.A.; Shafie-khah, M.; Laaksonen, H.; Ameli, H. Techno-economic assessment of energy storage systems in multi-energy microgrids utilizing decomposition methodology. Energy 2023, 283, 128430. [Google Scholar] [CrossRef]
- Nebuloni, R.; Meraldi, L.; Bovo, C.; Ilea, V.; Berizzi, A.; Sinha, S.; Tamirisakandala, R.B.; Raboni, P. A hierarchical two-level MILP optimization model for the management of grid-connected BESS considering accurate physical model. Appl. Energy 2023, 334, 120697. [Google Scholar] [CrossRef]
- Liang, L.; Lin, L. A resilience enhanced hierarchical strategy of battery energy storage for frequency regulation. Energy Rep. 2023, 9, 625–636. [Google Scholar] [CrossRef]
- Alrashidi, M. Community Battery Storage Systems Planning for Voltage Regulation in Low Voltage Distribution Systems. Appl. Sci. 2022, 12, 9083. [Google Scholar] [CrossRef]
- Boonluk, P.; Siritaratiwat, A.; Fuangfoo, P.; Khunkitti, S. Optimal Siting and Sizing of Battery Energy Storage Systems for Distribution Network of Distribution System Operators. Batteries 2020, 6, 56. [Google Scholar] [CrossRef]
- Takano, H.; Hayashi, R.; Asano, H.; Goda, T. Optimal Sizing of Battery Energy Storage Systems Considering Cooperative Operation with Microgrid Components. Energies 2021, 14, 7442. [Google Scholar] [CrossRef]
- Sanduleac, M.; Sandulescu, A.; Efremov, C.; Ionescu, C.; Damian, I.C.; Mandis, A. Aspects of Design in Low Voltage Resilient Grids—Focus on Battery Sizing and U Level Control with P Regulation in Microgrids of Energy Communities. Energies 2023, 16, 1932. [Google Scholar] [CrossRef]
- Zolfagharia, M.; Ghaffarzadeha, N.; Ardakanib, A. Optimal sizing of battery energy storage systems in off-grid micro grids using convex optimization. J. Energy Storage 2019, 23, 44–56. [Google Scholar] [CrossRef]
- Xie, H.; Teng, X.; Xu, Y.; Wang, Y. Optimal Energy Storage Sizing for Networked Microgrids Considering Reliability and Resilience. IEEE Access 2019, 7, 86336–86348. [Google Scholar] [CrossRef]
- Hoyos-Velandia, C.; Ramirez-Hurtado, L.; Quintero-Restrepo, J.; Moreno-Chuquen, R.; Gonzalez-Longatt, F. Cost Functions for Generation Dispatching in Microgrids for Non-Interconnected Zones in Colombia. Energies 2022, 15, 2418. [Google Scholar] [CrossRef]
- Wei, W.; Ye, L.; Fang, Y.; Wang, Y.; Chen, X.; Li, Z. Optimal allocation of energy storage capacity in microgrids considering the uncertainty of renewable energy generation. Sustainability 2023, 15, 9544. [Google Scholar] [CrossRef]
- Macmillan, M.; Wilson, K.; Baik, S.; Carvallo, J.P.; Dubey, A.; Holland, C.A. Shedding light on the economic costs of long-duration power outages: A review of resilience assessment methods and strategies. Energy Res. Soc. Sci. 2023, 99, 103055. [Google Scholar] [CrossRef]
- Wang, J.; Wu, Z.; Zhao, Y.; Sun, Q.; Wang, F. A robust flexibility evaluation method for distributed multi-energy microgrid in supporting power distribution system. Front. Energy Res. 2023, 10, 1021627. [Google Scholar] [CrossRef]
- Pozo, D. Linear battery models for power systems analysis. Electr. Power Syst. Res. 2022, 212, 108565. [Google Scholar] [CrossRef]
- Watrin, N.; Roche, R.; Ostermann, H.; Blunier, B.; Miraoui, A. Multiphysical Lithium-Based Battery Model for Use in State-of-Charge Determination. IEEE Trans. Veh. Technol. 2012, 61, 3420–3429. [Google Scholar] [CrossRef]
- Fortenbacher, P.; Mathieu, J.L.; Andersson, G. Modeling, identification, and optimal control of batteries for power system applications. In Proceedings of the 2014 Power Systems Computation Conference, Wroclaw, Poland, 18–22 August 2014. [Google Scholar]
- Rehman, W.; Bo, R.; Mehdipourpicha, H.; Kimball, J.W. Sizing battery energy storage and PV system in an extreme fast charging station considering uncertainties and battery degradation. Appl. Energy 2022, 313, 118745. [Google Scholar] [CrossRef]
- Jacque, K.; Koltermann, L.; Figgener, J.; Zurmühlen, S.; Sauer, D.U. The influence of frequency containment reserve on the cycles of a hybrid stationary large-scale storage system. J. Energy Storage 2022, 52, 105040. [Google Scholar] [CrossRef]
- Picioroaga, I.I.; Tudose, A.M.; Sidea, D.O.; Bulac, C. Supply Restoration in Active Distribution Networks Based on Soft Open Points with Embedded DC Microgrids. Mathematics 2022, 10, 211. [Google Scholar] [CrossRef]
- Roy, K.; Mandal, K.K.; Mandal, A.C. Modeling and managing of micro grid connected system using Improved Artificial Bee Colony algorithm. Int. J. Electr. Power Energy Syst. 2016, 75, 50–58. [Google Scholar] [CrossRef]
- Nikmehr, N.; Najafi-Ravadanegh, S. Optimal operation of distributed generations in micro-grids under uncertainties in load and renewable power generation using heuristic algorithm. IET Renew. Power Gener. 2015, 9, 982–990. [Google Scholar] [CrossRef]
- Marchi, B.; Pasetti, M.; Zanoni, S. Life Cycle Cost Analysis for BESS Optimal Sizing. Energy Procedia 2017, 113, 127–134. [Google Scholar] [CrossRef]
- Sidea, D.O.; Picioroaga, I.I.; Bulac, C. Optimal Battery Energy Storage System Scheduling Based on Mutation-Improved Grey Wolf Optimizer Using GPU-Accelerated Load Flow in Active Distribution Networks. IEEE Access 2021, 9, 13922–13937. [Google Scholar] [CrossRef]
Figure 1.
The analyzed microgrid.

Figure 2.
The MG load curves (a) and forecasted PV and WT production (b) for Scenario 1.
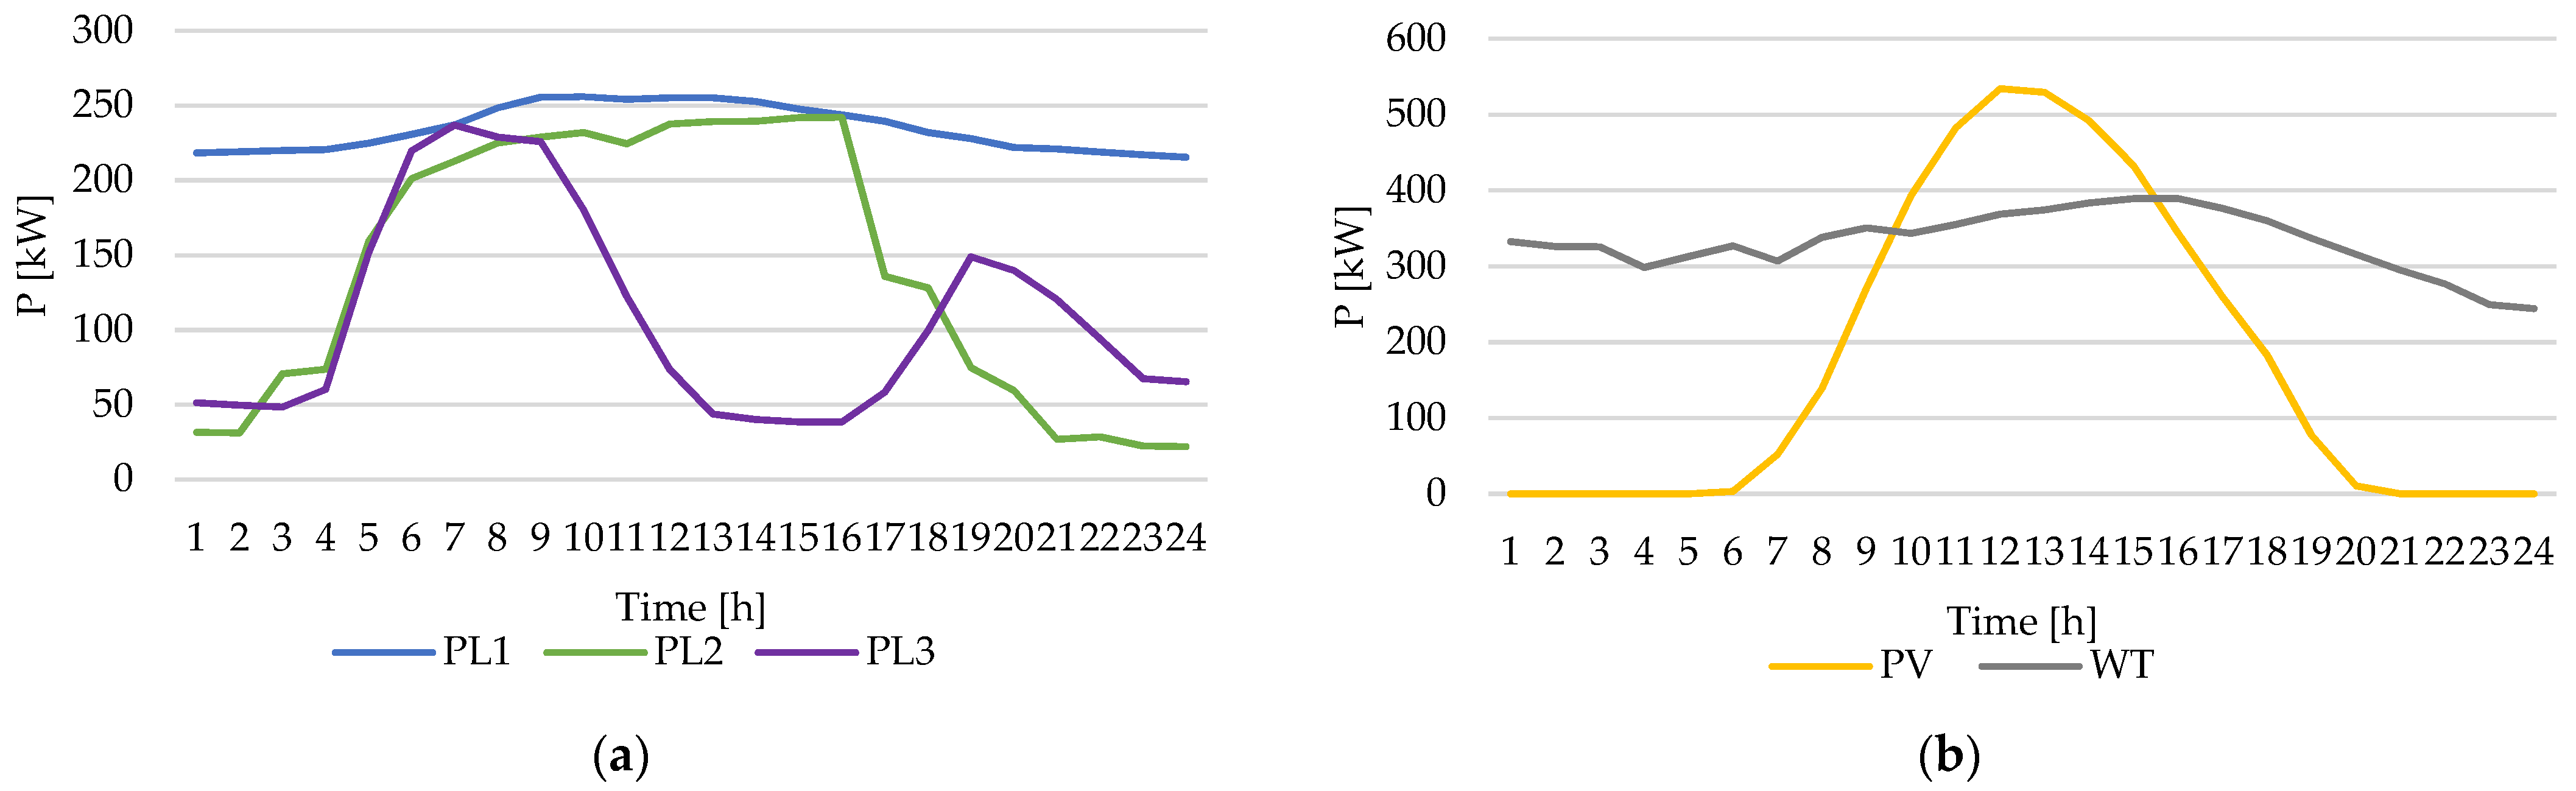
Figure 3.
The ESS operation scheduling (Scenario 1).
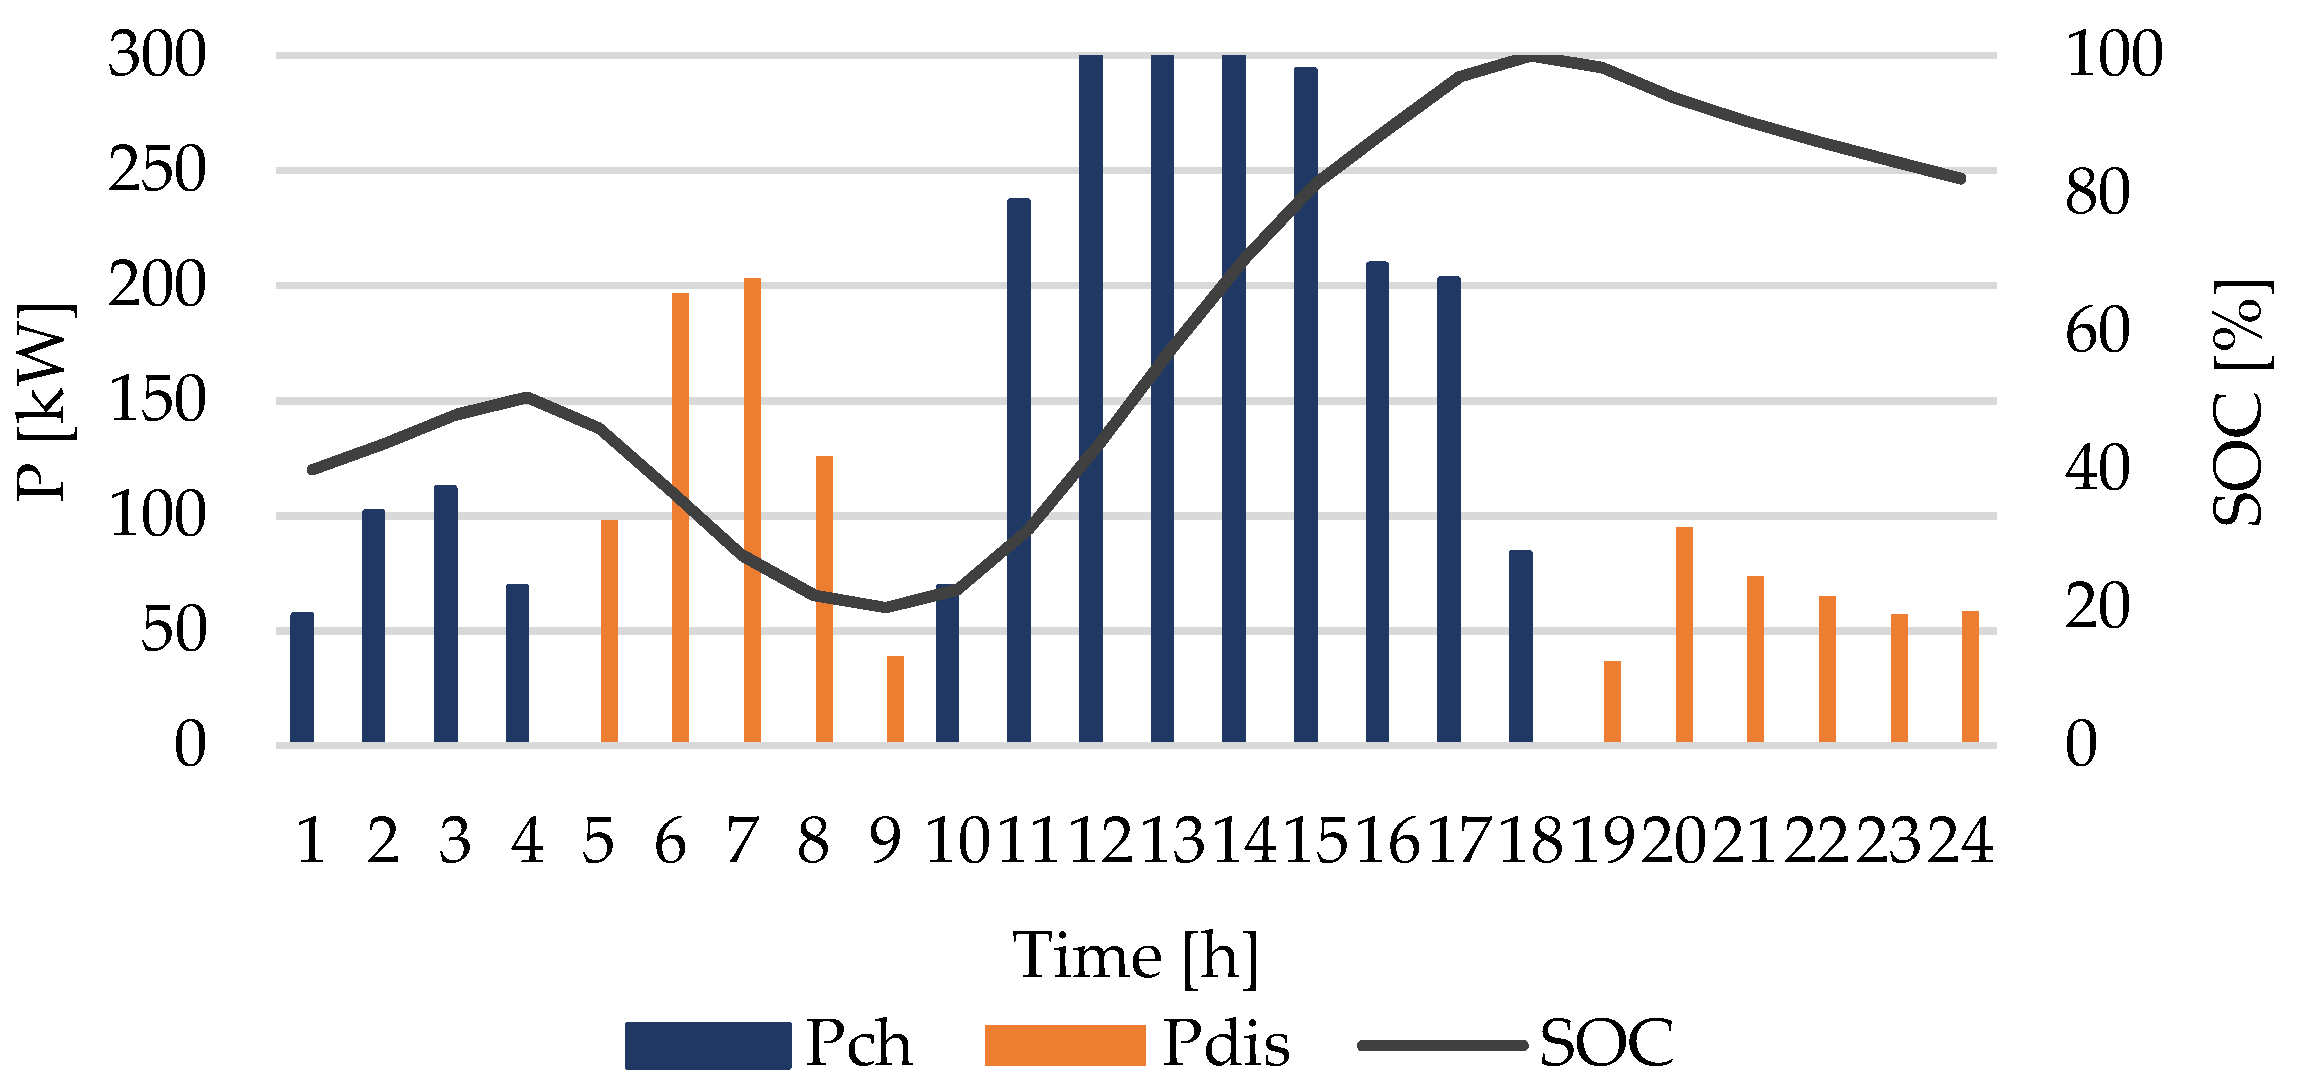
Figure 4.
Optimal power dispatch during 24 h resilient operation: (a) without ESS, (b) with ESS.

Figure 5.
The MG load curves (a) and forecasted PV and WT production (b) for Scenario 2.
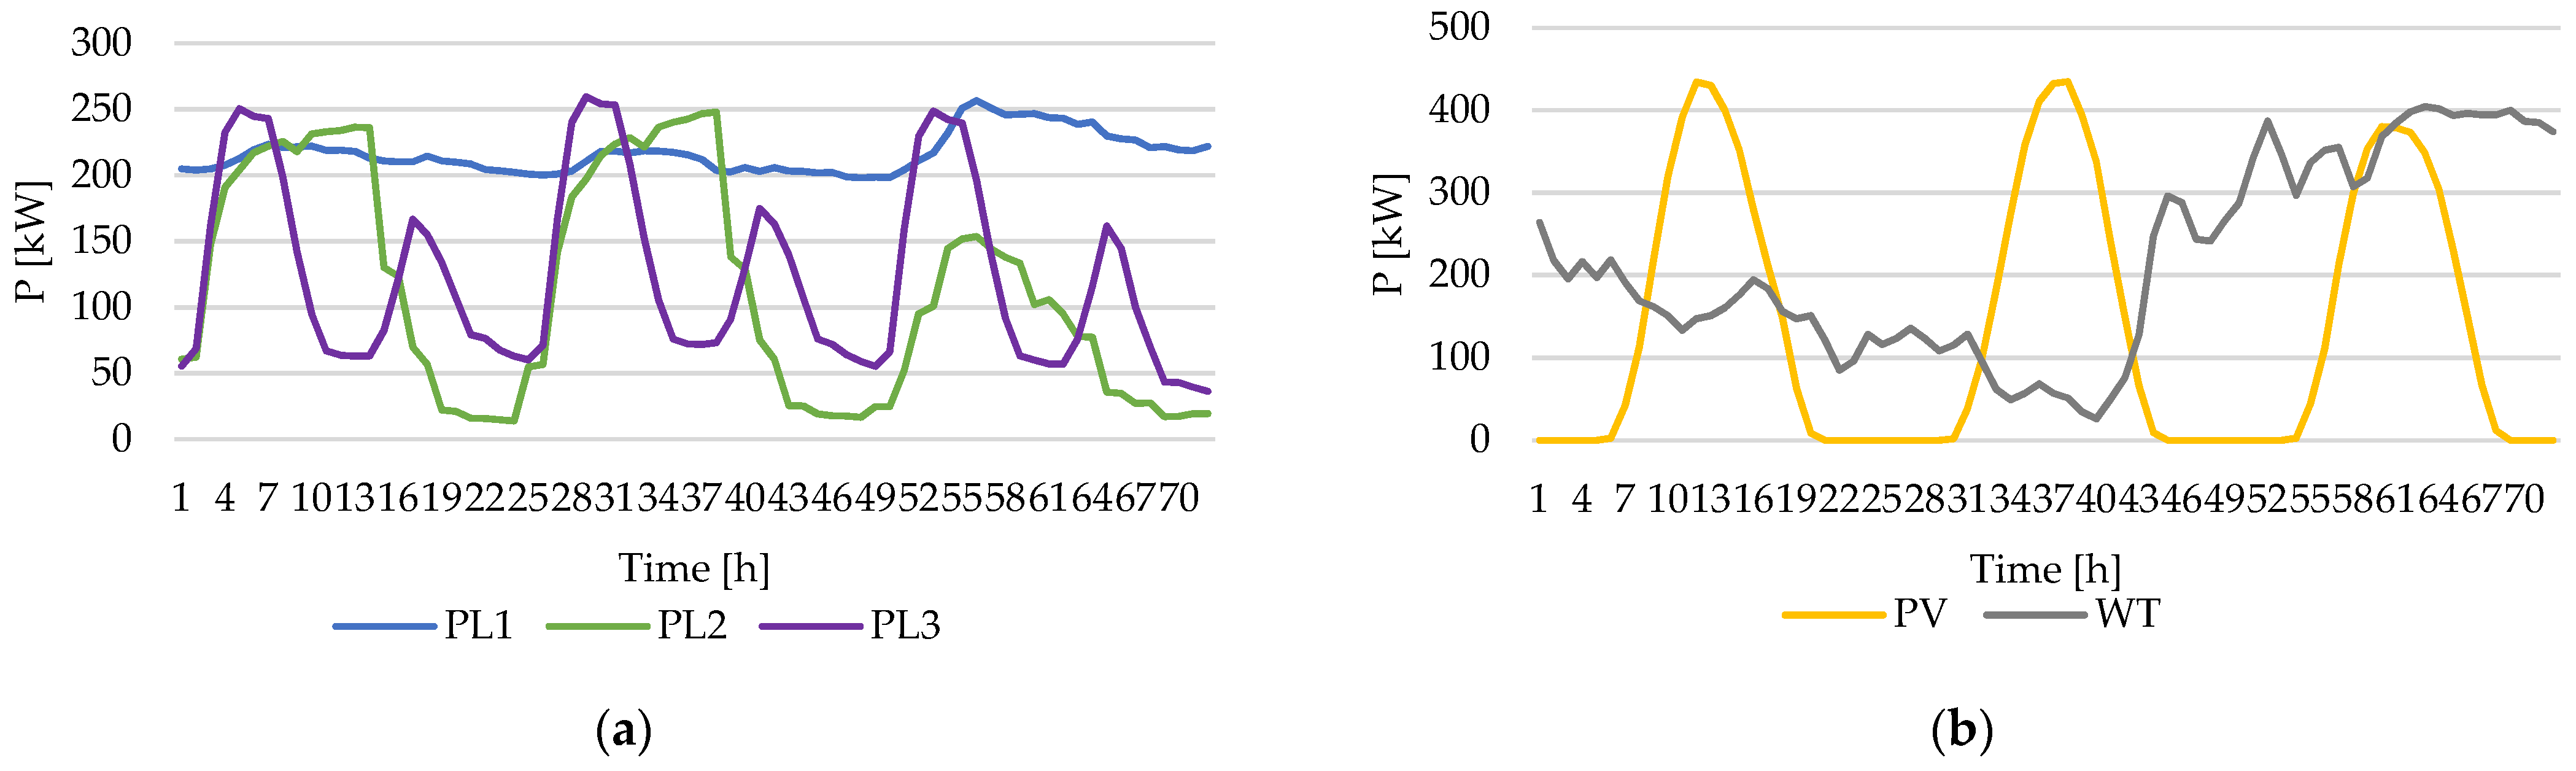
Figure 6.
The hourly operation of the ESS (Scenario 2).
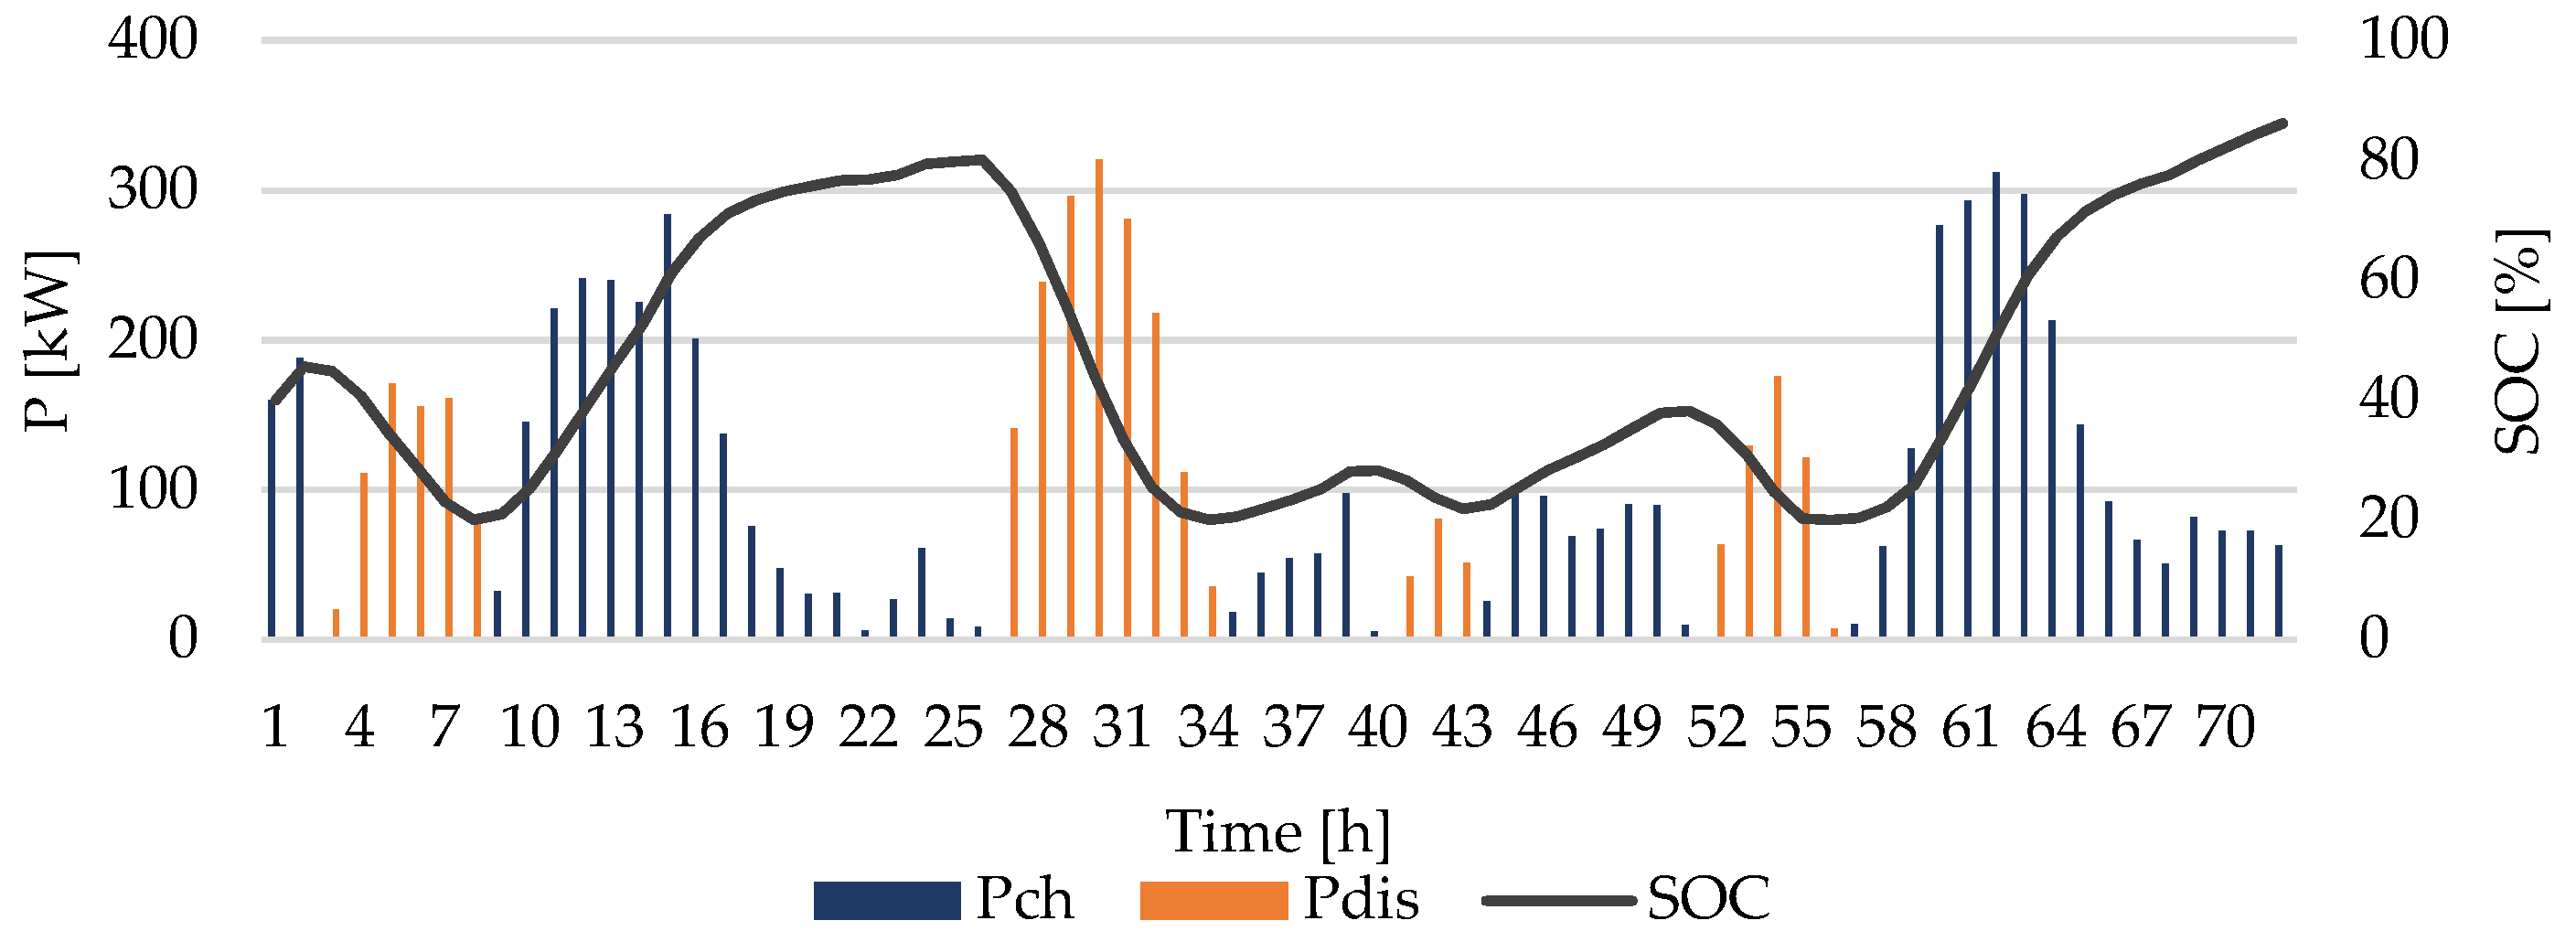
Figure 7.
Optimal power dispatch during 72 h resilient operation: (a) without ESS, (b) with ESS.

Figure 8.
The hourly load curves for Scenario 3.

Figure 9.
The hourly RES production curves for Scenario 3.

Figure 10.
The hourly ESS operation (Scenario 3).
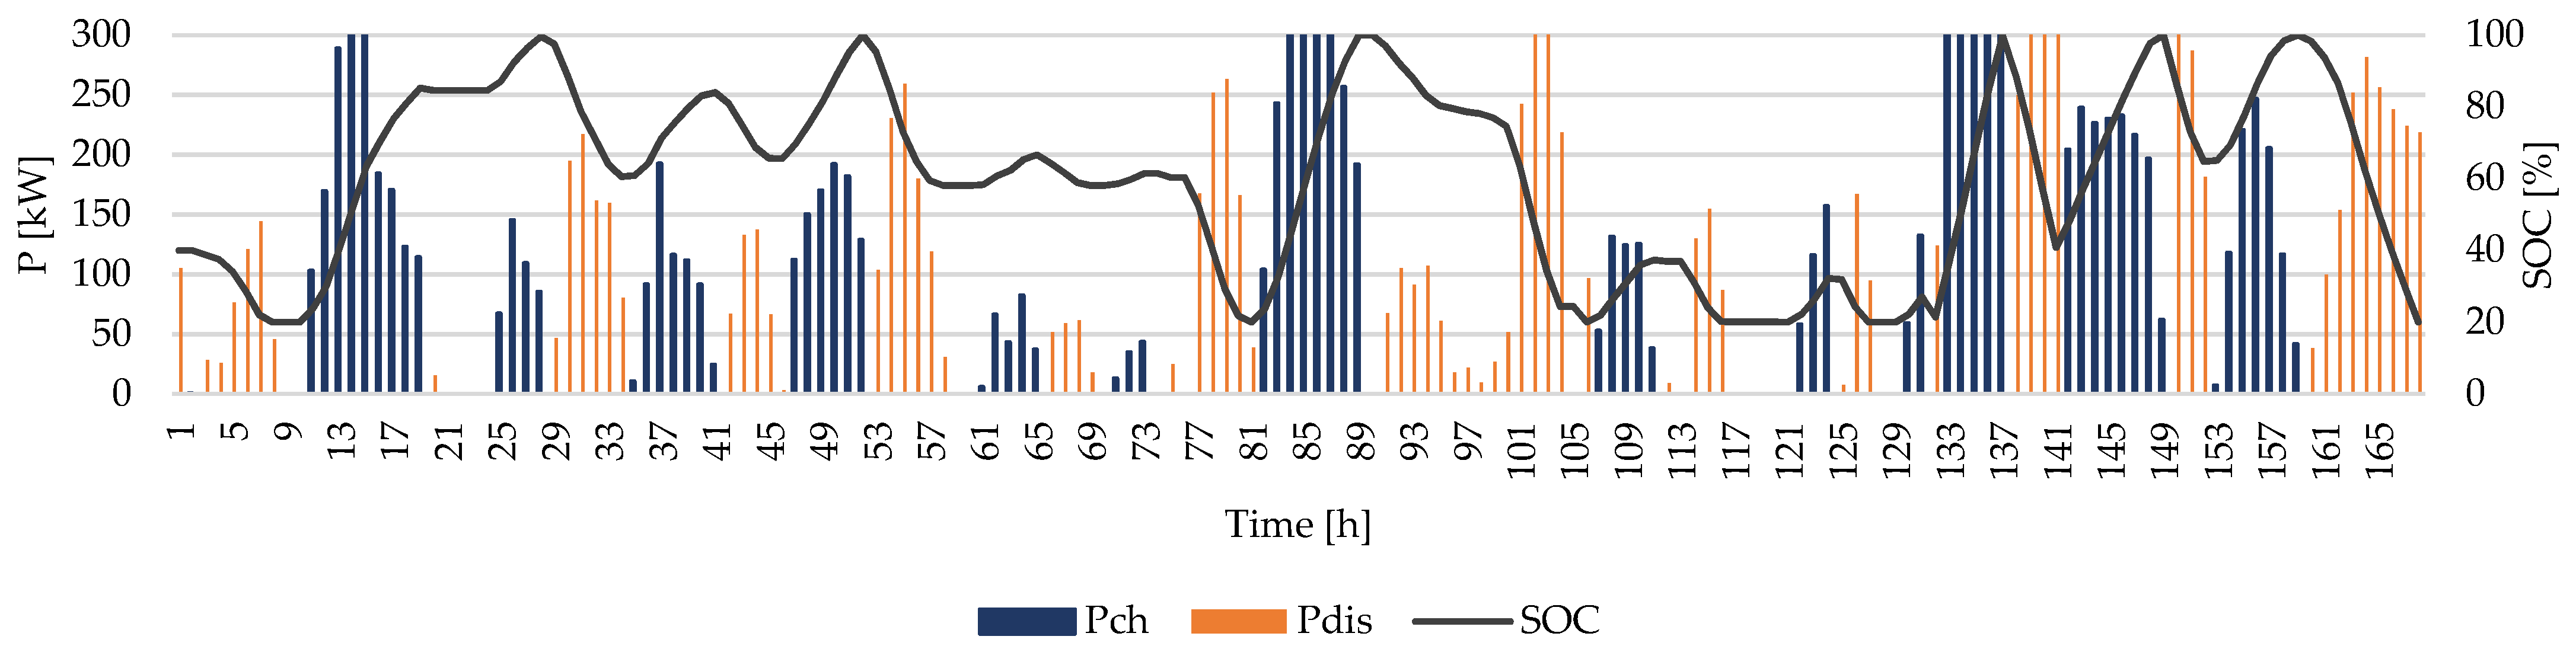
Figure 11.
Optimal power dispatch during 7-day resilient operation case without ESS.

Figure 12.
Optimal power dispatch during the 7-day resilient operation case with ESS.

Table 1.
Diesel generator parameters.
| Parameter | [€/kW] | [€/kW] | [€/kW] | [€/kWh] | [kW] | Ramp Up/Down Rate [kW/h] |
|---|---|---|---|---|---|---|
| Value | 0.4073 | 0.2193 | 0.0695 | 0.1433 | 125 | 50 |
Table 2.
Microturbine parameters.
| Parameter | [€/kW] | [€/kW] | [€/kWh] | [kW] | Ramp Up/Down Rate [kW/h] |
|---|---|---|---|---|---|
| Value | 0.2368 | 0.0155 | 0.0419 | 125 | 50 |
Table 3.
Pollutant emissions components and costs.
| Pollutant | [kg/kWh] | [kg/kWh] | [€/kg] |
|---|---|---|---|
| CO2 | 0.00131 | 0.000991 | 0.0309 |
| SO2 | 0.00041 | 0.000005 | 2.1847 |
| NOx | 0.02005 | 0.000027 | 9.2656 |
Table 4.
Energy storage system economical parameters [29].
Table 4.
Energy storage system economical parameters [29].
| Parameter | [€/kW] | [€/kWh] | [€/kW] | [kW] | r [%] | L [years] |
|---|---|---|---|---|---|---|
| Value | 250 | 450 | 60 | 150 | 5 | 10 |
Table 5.
Energy storage system technical parameters [13].
Table 5.
Energy storage system technical parameters [13].
| Parameter | [kW] | [%] | [%] | [cycles/day] | [%] |
|---|---|---|---|---|---|
| Value | 1000 | 90/90 | 20/100 | 2 | 0.4 |
Table 6.
Cost of short-duration electricity outages [32].
Table 6.
Cost of short-duration electricity outages [32].
| User | Load 1 | Load 2 | Load 2 |
|---|---|---|---|
| Shedding cost [€/kWh] | 37.52 | 23.41 | 0.53 |
Table 7.
Main MG operation costs.
| Scenario | Case | [€] | [€] | [€] | [€] | [€] | MG Total Operation Costs [€] |
|---|---|---|---|---|---|---|---|
| Scenario 1 | Without ESS | 2424.35 | 113.21 | 0 | 396.98 | 826.12 | 3760.66 |
| With ESS | 17.423 | 0.2839 | 760.05 | 510.3561 | 0 | 1288.11 | |
| Scenario 2 | Without ESS | 15,704.58 | 719.86 | 0 | 913.14 | 15,933 | 33,270.58 |
| With ESS | 18,674.6 | 839.73 | 2876.6 | 1058.7 | 0 | 23,449.63 | |
| Scenario 3 | Without ESS | 27,258.12 | 1266.65 | 0 | 2400.8 | 16,822 | 47,747.57 |
| With ESS | 6760.1 | 333.06 | 5167.3 | 2723.9 | 2886.1 | 17,870.49 |
Table 8.
Load shedding rates.
| Scenario | Case | Load 1 [%] | Load 2 [%] | Load 3 [%] |
|---|---|---|---|---|
| Scenario 1 | Without ESS | 0 | 0 | 5.74 |
| With ESS | 0 | 0 | 0 | |
| Scenario 2 | Without ESS | 0 | 1.68 | 25.84 |
| With ESS | 0 | 0 | 0 | |
| Scenario 3 | Without ESS | 0 | 0.61 | 13.28 |
| With ESS | 0 | 0 | 2.73 |
Table 9.
Resilience indexes values.
| Scenario | Case | ||
|---|---|---|---|
| Scenario 1 | Without ESS | 0.9872 | 0.9997 |
| With ESS | 1 | 1 | |
| Scenario 2 | Without ESS | 0.9257 | 0.9943 |
| With ESS | 1 | 1 | |
| Scenario 3 | Without ESS | 0.9654 | 0.9978 |
| With ESS | 0.9932 | 0.9999 |
Disclaimer/Publisher’s Note: The statements, opinions and data contained in all publications are solely those of the individual author(s) and contributor(s) and not of MDPI and/or the editor(s). MDPI and/or the editor(s) disclaim responsibility for any injury to people or property resulting from any ideas, methods, instructions or products referred to in the content. |
© 2023 by the authors. Licensee MDPI, Basel, Switzerland. This article is an open access article distributed under the terms and conditions of the Creative Commons Attribution (CC BY) license (https://creativecommons.org/licenses/by/4.0/).
Share and Cite
MDPI and ACS Style
Picioroaga, I.; Luca, M.; Tudose, A.; Sidea, D.; Eremia, M.; Bulac, C. Resilience-Driven Optimal Sizing of Energy Storage Systems in Remote Microgrids. Sustainability 2023, 15, 16002. https://doi.org/10.3390/su152216002
AMA Style
Picioroaga I, Luca M, Tudose A, Sidea D, Eremia M, Bulac C. Resilience-Driven Optimal Sizing of Energy Storage Systems in Remote Microgrids. Sustainability. 2023; 15(22):16002. https://doi.org/10.3390/su152216002
Chicago/Turabian StylePicioroaga, Irina, Madalina Luca, Andrei Tudose, Dorian Sidea, Mircea Eremia, and Constantin Bulac. 2023. "Resilience-Driven Optimal Sizing of Energy Storage Systems in Remote Microgrids" Sustainability 15, no. 22: 16002. https://doi.org/10.3390/su152216002
Note that from the first issue of 2016, this journal uses article numbers instead of page numbers. See further details here.