

Analysis of Sub-Optimization Impact on Partner Selection in VMI

1
School of Mechanical Engineering, Guangdong Ocean University, Zhanjiang 524088, China
2
School of Mathematics and Statistics, Huizhou University, Huizhou 516007, China
*
Author to whom correspondence should be addressed.
Sustainability 2023, 15(3), 2742; https://doi.org/10.3390/su15032742
Submission received: 7 December 2022
/
Revised: 16 January 2023
/
Accepted: 31 January 2023
/
Published: 2 February 2023
(This article belongs to the Special Issue Sustainable Logistics: Supply Chain Management Design)
Abstract
:Different combinations of elements will lead to different system functions, so a supply chain composed of enterprises with different characteristics will lead to differences in the system performance. In this study, a vendor-managed inventory (VMI) model is built; the model takes into consideration the factors of demand amplification, order and inventory cost change. Then, the change in the revenue of the supply chain and its members—due to VMI—are represented, and the influence of the different production parameters on this change is analyzed. On the basis of proving the distinctive feature of the Kaldor–Hicks improvement possessed by VMI, the profit fluctuations of enterprises in a supply chain that is composed of members with different characteristics using VMI are calculated by a numerical experiment. The conclusions of this paper indicate why enterprises prefer to choose VMI partners, and the results confirm the sub-optimal characteristic of this tendency. In addition, the results also reveal the inherent contradiction of VMI between supply chain efficiency improvement and coordination among the supply chain’s members. If an enterprise chooses VMI partners solely to maximize its own interests, the possibility of Pareto improvement in the supply chain will be maximized. However, at this time, a more effective supply chain system cannot be organized.
1. Introduction
The time when individual enterprises competed with each other has long been over; the era of supply chain competition has arrived. As the nature of traditional competition has transformed, the practice whereby an enterprise manages its own inventory and organizes production according to orders from downstream increasingly does not meet the requirements of supply chain competition. Therefore, a variety of efficient inventory management strategies for supply chains has emerged, and VMI is one of the most representative forms of those strategies. The implementation of VMI does not require complex technology, but VMI can effectively improve the relationship between supply chain members, reduce uncertainty regarding demand and availably and dramatically restrain the bullwhip effect [1]. The use of VMI can also drastically reduce excess inventory problems [2] and achieve better results than JIT and information sharing in terms of reducing supply chain costs [3]. For these reasons, VMI has attracted considerable attention from academia and business since its advent, and the huge success of the cooperation between Wal-Mart and P&G, using VMI, has proven the effectiveness of this strategy.
Similar to other supply chain strategies, VMI pursues stable and long-term cooperation and emphasizes the revenue improvement of the complete supply chain. There are two possible ways to achieve the goal of supply chain collaboration: the Pareto and Kaldor–Hicks improvement. The main difference between the two is whether to originally avoid profits decline for each supply chain member when increasing the overall revenue. As the organizations are obviously pursuing profits, enterprises in the supply chain are willing to accept the reasonable restraints imposed by the Pareto improvement and Kaldor–Hicks improvement in order not to violate the principle of individual benefit maximization. However, given the increasing market competition and the deepening of supply chain management, the possibility of the Pareto improvement is gradually disappearing; the Kaldor–Hicks improvement has become an inevitable trend.
A supply chain composed of enterprises with different characteristics will lead to different performance; local optimization also often leads to global sub-optimization. Thus, selecting unsuitable partners in a VMI strategy will not only lead to a waste of resources, manpower and time [4], but will also affect the overall performance of the supply chain. To clearly identify the preference of enterprises when choosing VMI partners, and to investigate the improvement effect of VMI for supply chain deeply, a VMI model is built in this study. The model considers the factors of demand amplification, as well as order and inventory cost change. Then, the influencing factors and profit fluctuation tendencies with regard to the upstream and downstream enterprises in VMI cooperation are analyzed. Finally, the influences of enterprise characteristics and market environment on partner selection are demonstrated through a numerical experiment. This research is helpful for predicting the implementation effect of VMI and provides a useful reference for building a more efficient supply chain system.
The rest of this paper is organized as follows: Section 2 provides a review of related literature. Section 3 explains the assumptions and parameters of the model. In Section 4, the profit changes of supply chain members due to VMI are analyzed in order to reveal the influencing factors and tendencies in choosing partners. Section 5 researches the sub-optimization on partner selection in a VMI strategy. Finally, the concluding remarks are presented in Section 6.
2. Literature Review
A VMI strategy aims to enhance the overall profitability of a supply chain through cooperation. However, every participant, as an independent economic entity, tends to maximize its own benefits. Therefore, the optimal strategy to member in the practice of VMI usually causes sub-optimal results for the whole [5]. To make VMI more effective and consistent, many studies have been conducted from two main perspectives, namely how to ensure the performance and how to coordinate the members.
In terms of improving VMI performance, Ryu [6] investigated VMI’s influence on supply chain performance over time. The study pointed out how VMI can allow the vendor to overcome the initial loss and how the VMI strategy eventually provides profits to every member. Kim and Shin [7] proposed the third-party logistics (TPL) service in VMI and found the optimal order quantity for that service. In the research of Beklari et al. [8], a new VMI model was proposed to maximize inventory turnover. Torres and García-Díaz’s paper [9] used an alternative VMI representation to obtain the mathematical conditions of determining the degree of stability of evolutionarily stable strategies. Chen et al. [10] developed an integrated model in order to determine the optimum delivery and production quantities at various locations in a VMI scenario. Cai et al. [11] introduced an option contract to improve the performance of a VMI supply chain under yield uncertainty. The study compared the effect of the option contract with a subsidy contract. Verma and Chatterjee [12] used a nonlinear mixed-integer programming model to obtain the optimal replenishment frequency and quantity for every retailer in a VMI supply chain. In Lee’s paper [13], a mathematical formulation was built to minimize the total cost, together with the constraint of the maximum allowable inventory level. Golmohammadi et al. [14] applied the Stackelberg game-theoretic approach and the corresponding equilibrium point to demonstrate the better performance of a centralized VMI system than a decentralized one. Choudhary and Shankar [15] applied mixed-integer linear programming formulations to determine the incremental value provided by VMI. Laganà et al. [16] introduced VMI strategy into the logistic system in the supermarket supply chain and discussed an effective heuristic method for improving coordination efficiency. De Maio and Laganà [17] applied a mathematical method to the supermarket distribution industry to improve VMI performance.
For coordinating VMI members, Cai et al. [18] proposed three flexible subsidy contracts to ensure that VMI members arrive at the optimal price, revenue-sharing ratio, inventory target and subsidy rate, and that they commit inventory early. Li et al. [19] established profit models under centralized and decentralized decisions based on VMI; a revenue-sharing contract was also offered to achieve Pareto improvement. Phan et al. [20] studied the coordination of a two-echelon consignment channel in VMI. The study proposed four contracts, combining revenue and cost sharing to coordinate supply chain collaborators. Choudhary et al. [21] compared an IS (information-sharing) scheme and a shift in decision-making responsibility scheme in VMI. The study revealed that the incremental value of VMI over IS is significant. The paper of Huynh and Pan [22] characterized the demand condition and minimum product selling price required for the retailer to engage in a VMI contract. The study also derived an analytical solution of the optimal purchase price for the retailer to pay to the manufacturer. The study [23] used the Nash bargaining model to address the joint VMI, cooperative advertising and profit-sharing decision making in a coordinated manner. Mateen et al. [24] discussed how the interaction between each member in a VMI supply chain, composed of a vendor and multiple retailers, can be realized under stochastic demand.
By combing the abovementioned previous studies, what is noticeable is that most research to date has focused on how to improve VMI performance or achieve coordination among members on the basis of an existing supply chain. However, few studies have examined the influence of partner selection, despite the fact that, as the first step of VMI, partner selection is bound to have a huge impact on both the performance and coordination of those partners. This paper examines partner selection in VMI and simultaneously studies supply chain efficiency and coordination among members. The authors attempt to analyze the sub-optimal selection caused by the conflict of interests between individual enterprises and the whole supply chain. Then, the contradiction between improving performance and maintaining the stability of a VMI system is revealed.
3. Preparation Work
In this section, two tasks need to be performed to complete the preparation for modeling. Specifically, the modeling assumptions are described first, and then the parameters are set.
3.1. Model Assumptions
This study establishes a supply chain model with a single wholesaler and a single retailer, and only one product is being sold. The demand faced by enterprises is determined by the market. The purchase, wholesale and retail prices depend on the relationship between supply and demand; they remain unchanged in the short term. Therefore, both the wholesaler and retailer are the recipients of market prices. This hypothesis differs from some studies, such as [25], in that purchase and sale prices are the functions of demand. However, in the authors’ opinion, this does not apply to a perfect competitive market environment and is not applicable to enterprises that are not large enough to exist in an imperfect competition environment. To increase universality, the model is built under an environment of complete competition. In order to achieve the lowest purchase and stock-holding costs, the wholesaler and retailer both use the economic order quantity (EOQ) for purchasing, and shortages are not allowed. Due to the ubiquitous bullwhip effect in the supply chain, the wholesaler will magnify the retailer’s demand and have surplus inventory at the end of the selling period before the implementation of VMI. However, the wholesaler can recover salvage value at a low price.
3.2. Parameter Settings
The key mathematical notations used in this paper are listed in Table 1.
Two points need to be emphasized with regard to the relationship of parameters. First, because of the scale effect on the wholesaler’s inventory management, one can obtain S1 < S2. In addition, VMI requires the wholesaler to manage not only its own inventory but also the retailer’s. Therefore, the inventory costs of the wholesaler after VMI will be higher than before, that is, S3 > S1. However, the retailer’s inventory costs can be reduced by VMI due to the more experienced and professional management provided by the wholesaler; thus, S3 < S2. Second, we assume the wholesaler’s ordering cost is composed of two parts. One is the cost of receiving orders from the retailer, and the other is the cost of sending orders to the manufacturer; both of them are D1. In VMI, the retailer’s ordering cost will disappear, but the wholesaler needs to assume the responsibility of obtaining demand from the retailer and sending the order to the upstream manufacturer. This will cause the cost of obtaining market demand to be higher than both D1 and D2, while the cost of sending an order to the upstream enterprise remains the same. However, all the above activities are transformed from being scattered behavior between upstream and downstream enterprises into centralized action by the wholesaler. This can effectively reduce the ordering cost in VMI. With the above analysis, this paper considers that the relationship of the ordering cost before and after VMI is MAX (D1 + D2) + D1 < D3 < 2D1 + D2.
4. Benefits Analysis in VMI
The transfer of inventory costs due to VMI will lead to changes in the accrued benefits of the whole supply chain and its members. This section analyzes the revenue fluctuation caused by VMI on the basis of the income functions of VMI members.
4.1. Modeling
This paper focuses on analyzing the impact of VMI on profits. Therefore, the assumption is made that enterprise profits are equal to the difference between sales revenue and procurement, inventory and ordering costs. Before the implementation of VMI, the retailer and wholesaler, respectively, are responsible for their inventory management. The retailer places an order with the wholesaler according to market demand. Then, the wholesaler will magnify the order received from the retailer (because of the bullwhip effect) and send its own order to the manufacturer. The revenue of the wholesaler and retailer can be represented as:
The terms 4-6 on the right of Formula (1) represent, respectively, the costs of the wholesaler processing the retailer’s order, the cost to send the order to the manufacturer and the residual value of excess inventory, which can be recovered at the end of the selling period.
After the implementation of VMI, the cost of the retailer sending and the wholesaler processing the order will be merged and borne by the wholesaler. Meanwhile, the retailer’s inventory will disappear. Hence, the revenue of the wholesaler and retailer can be described as:
Item 4 on the right of Formula (3) indicates that the cost of the wholesaler placing the order with the manufacturer still exists.
4.2. Revenue Fluctuation Analysis
With the implementation of VMI, the revenue change of the overall supply chain, retailer and wholesaler (respectively expressed by R3, R2 and R1) can be described as:
First, substitute into Formulas (5) to (7), respectively, and analyze the overall revenue change of the supply chain. With the assumptions of C0 < C, λ > 1 and S3 < S2, Parts 1 and 2 on the right side of Formula (5) are both non-negative. Part 3 converts to:
Square the sum of the first to third terms in parentheses to obtain:
Under the constraint of , . Therefore, (8) is greater than 0, Conclusion 1 can be drawn, i.e., that VMI can improve the overall revenue of the supply chain. This conclusion shows that VMI can ensure higher revenue for the entire supply chain.
Formula (6) is obviously greater than zero, so Conclusion 2 can be drawn; VMI can improve the retailer’s profits consequentially. In addition, the increment of profits is only related to the retailer’s own cost of inventory management and ordering and has nothing to do with wholesaler. More S2 and D2 will lead to more R2. This conclusion shows that the retailer has no preference for partner selection in VMI. However, the downstream enterprise with a lower inventory management level has a stronger desire to carry out VMI, because VMI can bring the downstream enterprise greater benefits.
For the wholesaler, Formula (7) can be converted to:
With the existing constraints, Formula (10) is not necessarily positive. When the wholesaler takes over the inventory management of the retailer, the variation of ordering cost D3 and inventory management cost S3 of VMI are decided by D2 and S2. They represent a reduction in original costs, so the wholesaler’s benefits in VMI will incrementally decline with the decrease of λ, S1 and D1 and the increase of C0. However, this reduction rate is slower than the change rate of D2 and S2. For example, when D2 and S2 go down by 10%, the room for the improvement of VMI is compressed, so D3 and S3 go down by less than 10%. When S2 becomes smaller, decreases at a lesser rate than , and this causes the value of Formula (10) to increase. When D2 becomes smaller, increases at a greater rate than and causes the value of Formula (10) to increase. On the other hand, when or become less than 0, the more Q will lead to a greater possibility of R1 < 0.
The lower the demand amplification factor, unit inventory cost, order cost and higher residual product processing price are, the more concrete will be the embodiment of a better inventory management capacity. Therefore, Conclusion 3 can be obtained, i.e., that VMI cannot necessarily guarantee that the wholesaler’s profits will improve. In addition, a better level of inventory management on the part of the retailer can help the wholesaler to improve revenue in VMI. However, the wholesaler will have a better level of inventory management instead of reduced revenue. In addition, market demand also affects the profit or loss of the wholesaler in the VMI. This conclusion shows that upstream enterprises with higher inventory management levels are more likely to suffer from a loss of interests in VMI. Therefore, in order to avoid risks, they have a clear tendency when choosing partners. In addition, a greater level of market demand may affect the stability of VMI cooperation.
Conclusions 1–3 indicate that VMI can improve the benefits of the supply chain and downstream enterprises, but VMI cannot ensure an increase of the upstream enterprise’s profits. Therefore, VMI has the attribute of Kaldor–Hicks improvement.
5. Numerical Experiment
The inventory management level not only reflects the profitability of enterprises, but also significantly influences the performance of supply chain management strategies, including VMI. In this section, the impact of inventory management capability on partner selection is analyzed; the sub-optimization property of partner selection in VMI is also proven by a numerical experiment. In order to make the conclusion more widely applicable, this paper uses data simulation for numerical analysis of our model.
5.1. Simulation Parameter Settings
In our model, the inventory management costs S1 and S2, and the ordering costs D1 and D2, of the wholesaler and retailer are the direct indicators reflecting the level of inventory management. In addition, the demand amplification factor λ and disposal price of the remaining product C0 directly relate to the profitability of the wholesaler. Therefore, they are all identified as the parameters of the inventory management level. The inventory management cost S3 and ordering cost D3 of VMI are determined by S1, S2 and D1, D2, respectively. As such, they are dependent variables and are not used as parameters to reflect the level of inventory management.
According to the above analysis, there are four parameters, S1, D1, λ and C0, and two parameters, S2 and D2, used to reflect the inventory management level of the upstream and downstream enterprises in VMI. In order to simplify the calculation and draw conclusions reflecting the tendency in partner selection, it is assumed that there are only two levels (high and low) for the inventory management of VMI collaborators. A high level of the upstream enterprise means lower S1, D1 and λ and higher C0. Conversely, a low level of the downstream enterprise means there will be higher S2 and D2.
5.2. Parameter Scope Determination
Set Q∼N (μ, σ2), C changes in a fixed interval; C0, λ, S1, S2, D1 and D2 are subject to uniform distribution. For S1 < S2, take an inventory cost accounting for 3% of the purchase cost as the boundary. Suppose S1∼U (0.01C, 0.03C), and S2∼U (0.03C, 0.05C). For dependent variable S3, because S1 < S3 < S2, set S3 = S1 + (1 − α)(S2 − S1). Here, α is the reduction coefficient of inventory cost that represents the ability of the upstream enterprise to reduce the cost of S2 higher than S1 after VMI. Suppose α∼U(0, 1) and a positive correlation with the inventory management level of the upstream enterprise (a high level of inventory management means a larger α). Set the dependent variable D3∼U (MAX (D1, D2) + D1, 2D1 + D2). Take C0∼U (0, 0.8C), λ∼U (1, 1.1), D1, D2∼U (500, 1000) as the experiment scope, and divide the inventory management level of the enterprise according to Table 2.
5.3. Analysis Object Selection
Although Conclusion 1 shows that VMI can improve the overall revenue of the supply chain, the primary motivation for enterprises to participate in supply chain cooperation is to increase their own profits. Both upstream and downstream enterprises will take their own benefits increasing in VMI as the first goal to pursue. Therefore, this study selected the increment of enterprise revenue generated by VMI (calculation result of R2 and R1) as the analysis object. On the other hand, as shown in Conclusion 3, the upstream enterprise is not necessarily able to benefit from VMI. In addition, once interests are damaged (R1 < 0), the possibility of participation in VMI cooperation will be negligible, so the possibility of a benefits loss on the part of the wholesaler (probability of R1 giving a negative value) was chosen to be the risk indicator for the upstream enterprise.
5.4. Experiment and Analysis
Based on the division of the inventory management level in Table 1, under the conditions of market demand Q with mean value changes from 10,000 to 100,000 and the same standard deviation of 1000 (the effect of standard deviation on simulation may be neglected), one million experiments were made for purchase price C in the interval from 10 to 100. The experiment results of R1 under different combinations between participators with different inventory management levels (combination (H, L) means cooperation between an upstream enterprise with high inventory management level and a downstream enterprise with low inventory management level) and the loss probability of the upstream enterprise (p) in VMI are shown in Figure 1 and Figure 2.
In Figure 1, one can find that the R1 of (H, H) and (L, H) is above (H, L) and (L, L). This finding means that cooperating with a downstream enterprise with a high inventory management level can bring more in the way of increased profits to the upstream enterprise than by cooperating with a low inventory management level.
Figure 2 not only reflects Conclusion 3, but also shows the relationship between Q and p. Therefore, Conclusion 4 can be drawn, i.e., that market demand is positively correlated with the probability of losses suffered by the upstream enterprise in VMI. This phenomenon is also especially obvious when the inventory management level of the upstream enterprise is high. This conclusion shows that increased market demand will increase the probability of a revenue reduction for upstream enterprises. The greater the market demand is, the weaker the willingness of upstream enterprises to VMI will be.
Based on Conclusion 2, regardless of the inventory management level of the upstream enterprise chosen by the downstream enterprise for cooperation, the benefits to the downstream enterprise from VMI are unchanged. The downstream enterprise has no preference for partner selection, so the choice of the upstream enterprise will determine the combination type of VMI. An upstream enterprise with a high inventory management level will choose downstream enterprises with high inventory management levels for VMI cooperation, both to improve profits (shown in Figure 1a) and to reduce the probability of loss (shown in Figure 2a,b). Similarly, an upstream enterprise with a low inventory management level will also choose downstream enterprises with high inventory management levels for the same reason (shown in Figure 1b and Figure 2c,d). Therefore, there is a clear propensity with regard to the upstream enterprises choosing VMI partners. They tend to choose downstream enterprises with better inventory management ability to cooperate.
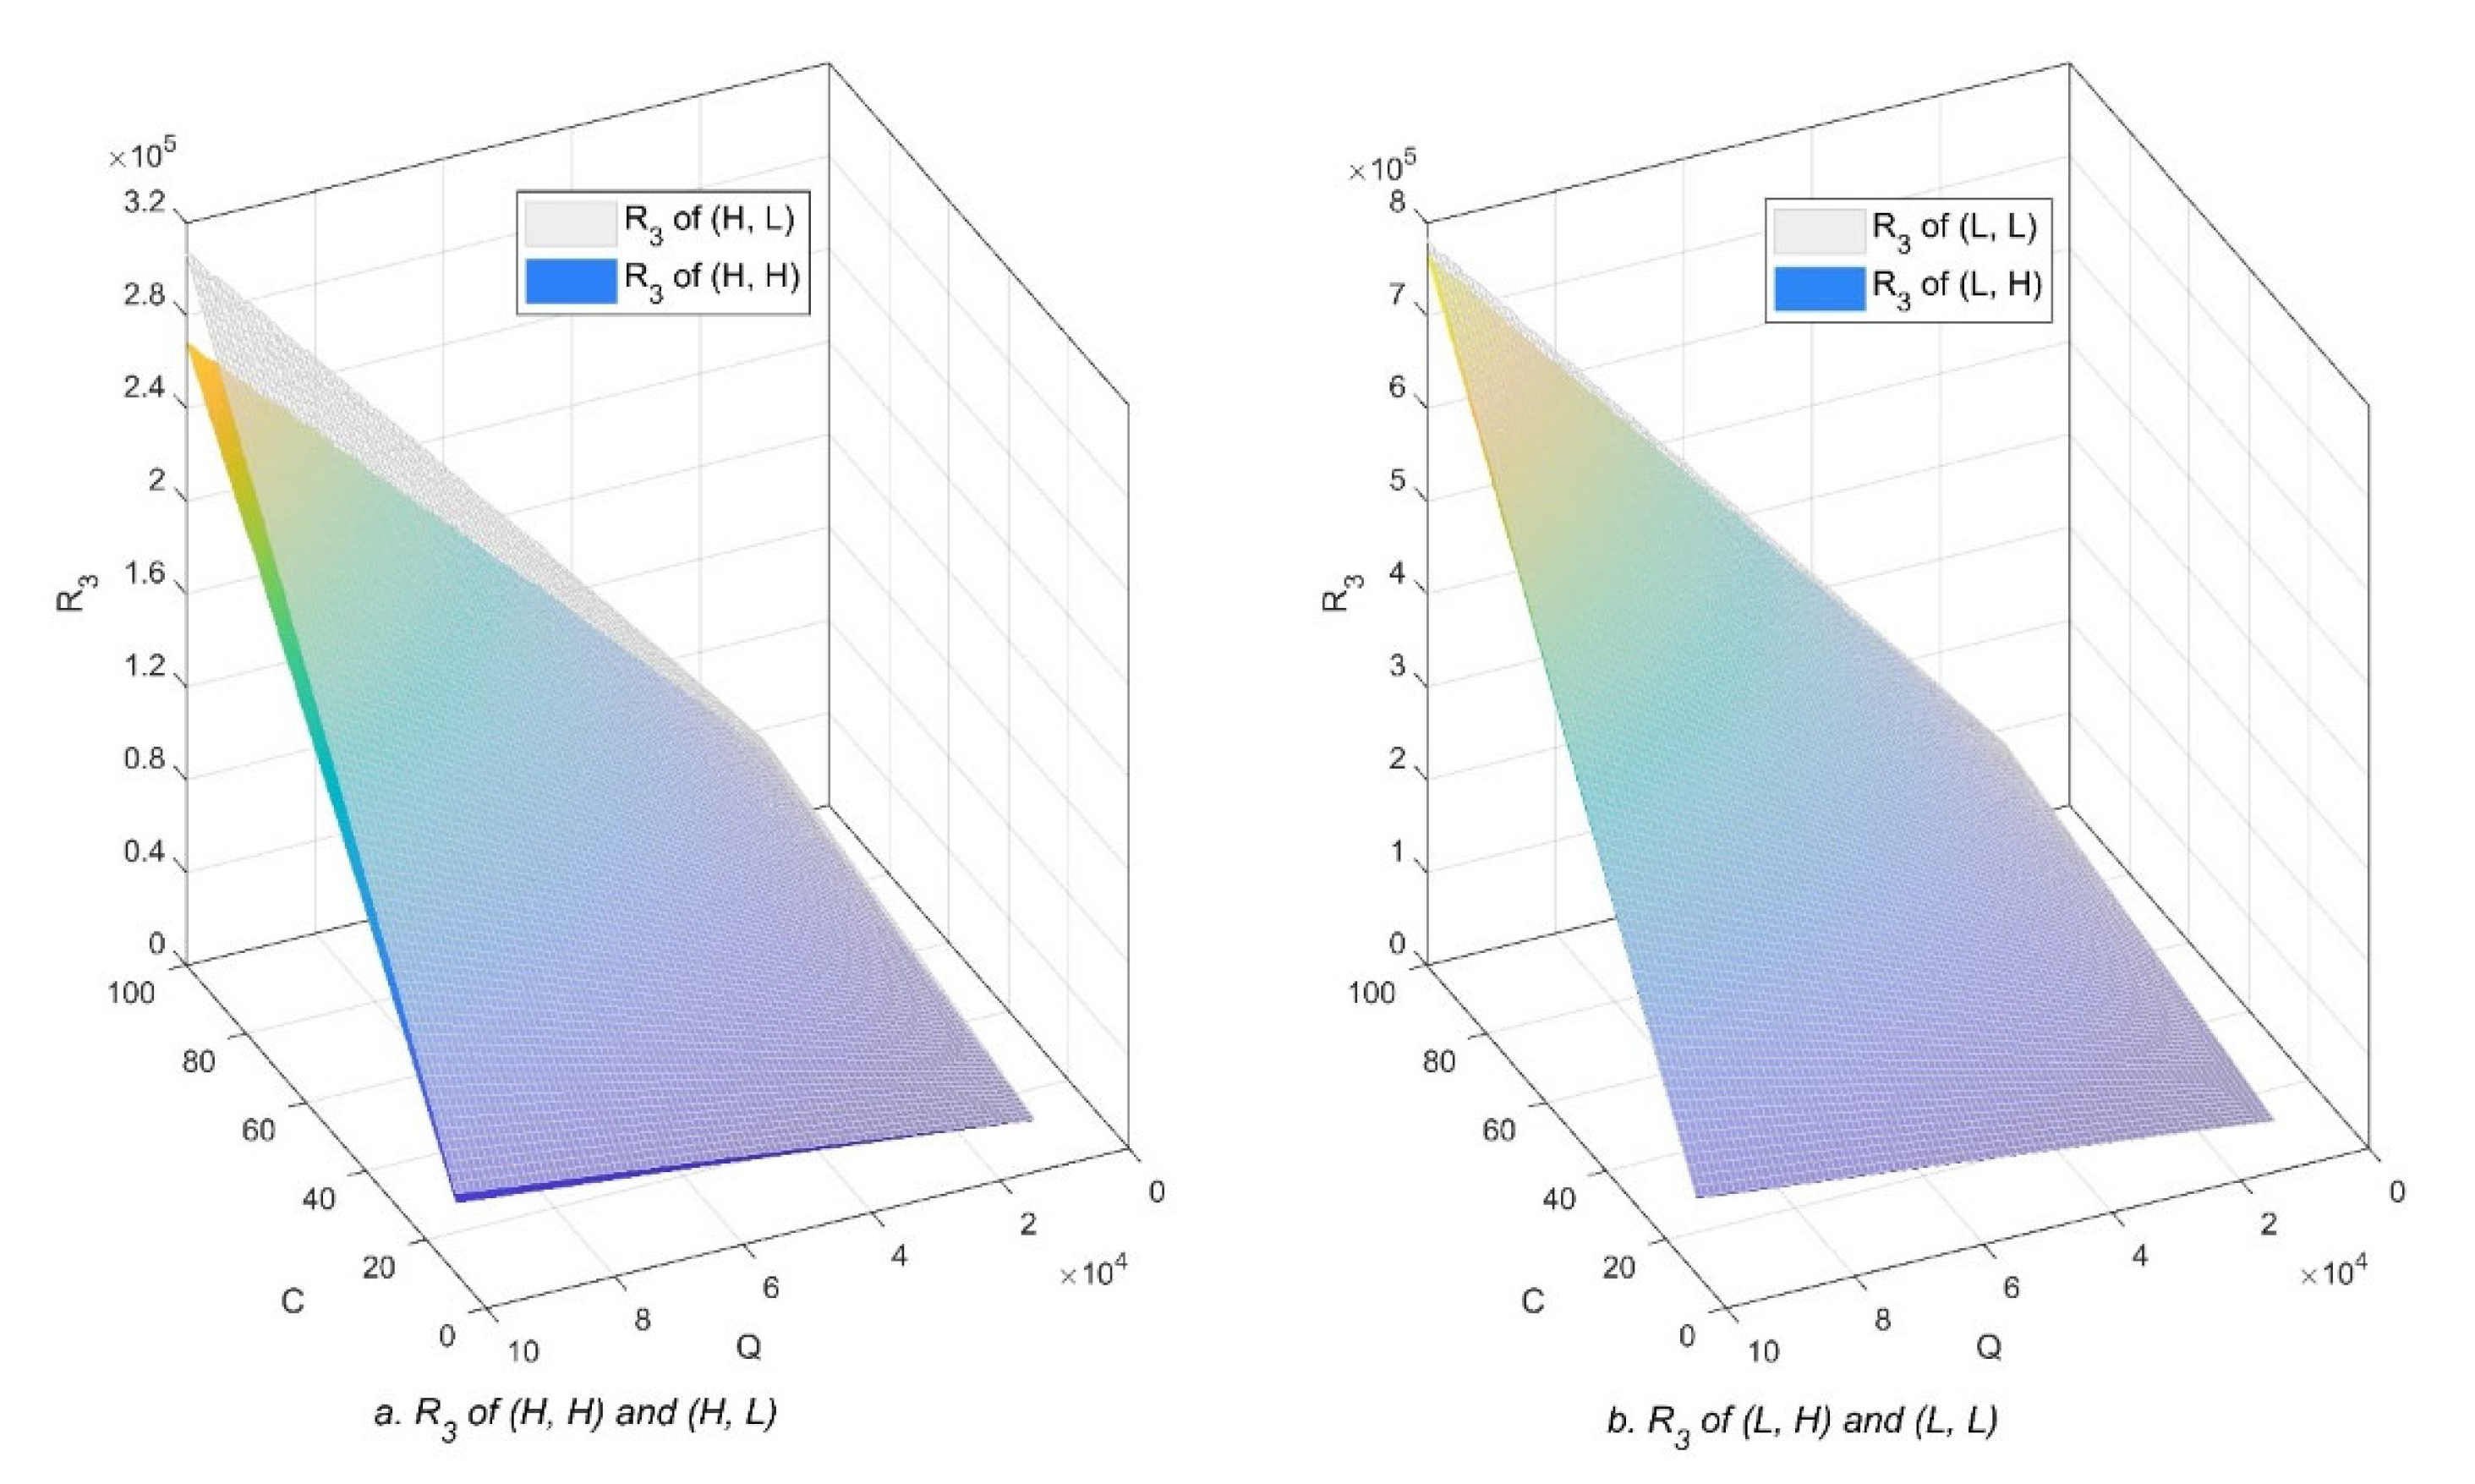
However, if the impact of VMI on the overall efficiency of the supply chain is considered (showed in Figure 3), one can find that neither combination (H, H) nor (L, H) can improve the overall performance of the supply chain to the same extent as combinations (H, L) or (L, L).
Through the above analysis, Conclusion 5 can be drawn, i.e., that upstream enterprises tend to choose downstream enterprises with better inventory management ability for VMI cooperation. However, this propensity will result in a failure to build a more efficient supply chain system, so the partner selection is sub-optimal. This conclusion shows that, under the premise of spontaneous selection, the VMI strategy is the overall sub-optimum led by the local optimum in the same conditions. In addition, an inherent contradiction exists between the two goals pursued by VMI, namely performance improvement and member coordination.
6. Conclusions
In this paper, we study the simultaneous revenue improvement of a supply chain and coordination among the supply chain’s members. These are the two major issues emphasized by VMI, and this paper proves the inherent contradiction between them. The preference in partner selection caused by avoiding loss has an obvious sub-optimal property. Under the influence of this tendency, Pareto improvement is more likely to be achieved in terms of ensuring the stability of VMI cooperation. However, such spontaneous coordination among members will be at the expense of a decrease in the performance of the overall supply chain. Local optimality leads to global sub-optimality. In the absence of external incentives, a more efficient VMI system cannot be formed through an independent selection of enterprises. This paper aims at the characteristic of VMI that downstream enterprises transfer their right of inventory management to upstream enterprises to study, so the conclusions are widely applicable.
However, this paper still has some limitations. The authors’ aim in this paper was to explain the changes in the profitability of enterprises in VMI and the tendencies of VMI participants in partner selection. As such, the question of how to establish a more efficient supply chain system was not answered. This issue will be addressed in future research.
Author Contributions
Conceptualization, J.S.; methodology, J.S.; software, S.Z.; formal analysis, J.S. and S.Z.; data curation, J.S. and S.Z.; writing—original draft preparation, J.S. and S.Z.; writing—review and editing, J.S. and S.Z.; visualization, S.Z.; supervision, J.S.; project administration, J.S. and S.Z.; funding acquisition, J.S. and S.Z. All authors have read and agreed to the published version of the manuscript.
Funding
This paper is supported by the 2022 Provincial and Municipal Joint Fund Project of Guangdong Basic and Applied Basic Research Foundation (grant number 2022A1515110437), the 2018 Higher Education of Guangdong Key Platforms and Scientific Research Projects: Young Innovative Talents Program (grant number 2018KQNCX251) and the 2017 Scientific Research Project of Guangdong Ocean University (grant number 101502/R18014).
Institutional Review Board Statement
This study did not involve humans or animals.
Data Availability Statement
The data used to support the findings of this study are all derived from computer simulation, so no real data were used in this study.
Conflicts of Interest
All authors declare that they have no conflict of interest.
References
- Disney, S.M.; Towill, D.R. The effect of vendor managed inventory (VMI) dynamics on the Bullwhip Effect in supply chains. Int. J. Prod. Econ. 2003, 85, 199–215. [Google Scholar] [CrossRef]
- Ma, J.; Lou, W.; Tian, Y. Bullwhip effect and complexity analysis in a multi-channel supply chain considering price game with discount sensitivity. Int. J. Prod. Res. 2019, 57, 5432–5452. [Google Scholar] [CrossRef]
- Yao, Y.; Dresner, M. The inventory value of information sharing, continuous replenishment, and vendor-managed inventory. Transp. Res. Part E: Logist. Transp. Rev. 2008, 44, 361–378. [Google Scholar] [CrossRef]
- Graham, T.S.; Daugherty, P.J.; Dudley, W.N. The long-term strategic impact of purchasing partnerships. J. Supply Chain. Manag. 1994, 30, 13. [Google Scholar] [CrossRef]
- Sha, J.; Wang, A.; Lv, T.; Wu, W. Coordination of advertising free riding in hybrid channel supply chain. Discret. Dyn. Nat. Soc. 2016, 2016, 7423043. [Google Scholar] [CrossRef]
- Ryu, C. Investigation on How VMI affects Ongoing Performance of Supply Chain System. J. Distrib. Sci. 2020, 18, 85–94. [Google Scholar]
- Kim, S.C.; Shin, K.S. Negotiation Model for Optimal Replenishment Planning Considering Defects under the VMI and JIT Environment. Asian J. Shipp. Logist. 2019, 35, 147–153. [Google Scholar] [CrossRef]
- Beklari, A.; Nikabadi, M.S.; Farsijani, H.; Mohtashami, A. A Hybrid Algorithm for Solving Vendors Managed Inventory (VMI) Model with the Goal of Maximizing Inventory Turnover in Producer Warehouse. Ind. Eng. Manag. Syst. 2018, 17, 570–587. [Google Scholar] [CrossRef]
- Torres, F.; García-Díaz, C. Evolutionary dynamics of two-actor VMI-driven supply chains. Comput. Math. Organ. Theory 2018, 24, 351–377. [Google Scholar] [CrossRef]
- Chen, M.C.; Hsiao, Y.H.; Huang, H.Y. Semiconductor supply chain planning with decisions of decoupling point and VMI scenario. IEEE Trans. Syst. Man Cybern. Syst. 2016, 47, 856–868. [Google Scholar] [CrossRef]
- Cai, J.; Zhong, M.; Shang, J.; Huang, W. Coordinating VMI supply chain under yield uncertainty: Option contract, subsidy contract, and replenishment tactic. Int. J. Prod. Econ. 2017, 185, 196–210. [Google Scholar] [CrossRef]
- Verma, N.K.; Chatterjee, A.K. A multiple-retailer replenishment model under VMI: Accounting for the retailer heterogeneity. Comput. Ind. Eng. 2017, 104, 175–187. [Google Scholar] [CrossRef]
- Lee, D. VMI with Upper Limit of Inventory for Vendor and Retailer. J. Soc. Korea Ind. Syst. Eng. 2017, 40, 105–111. [Google Scholar] [CrossRef]
- Golmohammadi, A.M.; Javid, N.J.; Poursoltan, L.; Esmaeeli, H. Modeling and analyzing one vendor-multiple retailers VMI SC using Stackelberg game theory. Ind. Eng. Manag. Syst. 2016, 15, 385–395. [Google Scholar] [CrossRef]
- Choudhary, D.; Shankar, R. The value of VMI beyond information sharing under time-varying stochastic demand. Int. J. Prod. Res. 2015, 53, 1472–1486. [Google Scholar] [CrossRef]
- Laganà, D.; Longo, F.; Vocaturo, F. Vendor-managed inventory practice in the supermarket supply chain. Int. J. Food Eng. 2016, 12, 827–834. [Google Scholar] [CrossRef]
- De Maio, A.; Laganà, D. The effectiveness of vendor managed inventory in the last-mile delivery: An industrial application. Procedia Manuf. 2020, 42, 462–466. [Google Scholar] [CrossRef]
- Cai, J.; Hu, X.; Tadikamalla, P.R.; Shang, J. Flexible contract design for VMI supply chain with service-sensitive demand: Revenue-sharing and supplier subsidy. Eur. J. Oper. Res. 2017, 261, 143–153. [Google Scholar] [CrossRef]
- Li, J.; Zhang, Y.; Wang, Z.; Jiang, H. Multi-Period Coordination Mechanism Based on Revenue Sharing Contract in VMI Model. Adv. Appl. Math. Mech. 2019, 11, 980–1004. [Google Scholar]
- Phan, D.A.; Vo, T.L.H.; Lai, A.N.; Nguyen, T.L.A. Coordinating contracts for VMI systems under manufacturer-CSR and retailer-marketing efforts. Int. J. Prod. Econ. 2019, 211, 98–118. [Google Scholar] [CrossRef]
- Choudhary, D.; Shankar, R.; Tiwari, M.K.; Purohit, A.K. VMI versus information sharing: An analysis under static uncertainty strategy with fill rate constraints. Int. J. Prod. Res. 2016, 54, 3978–3993. [Google Scholar] [CrossRef]
- Huynh, C.H.; Pan, W. Operational strategies for supplier and retailer with risk preference under VMI contract. Int. J. Prod. Econ. 2015, 169, 413–421. [Google Scholar] [CrossRef]
- Jiang, N.; Zhang, L.L.; Yu, Y. Optimizing cooperative advertizing, profit sharing, and inventory policies in a VMI supply chain: A Nash bargaining model and hybrid algorithm. IEEE Trans. Eng. Manag. 2015, 62, 449–461. [Google Scholar] [CrossRef]
- Mateen, A.; Chatterjee, A.K.; Mitra, S. VMI for single-vendor multi-retailer supply chains under stochastic demand. Comput. Ind. Eng. 2015, 79, 95–102. [Google Scholar] [CrossRef]
- Jing, X.; Liu, Z. Formulation on VMI System Integration and Income Sharing Contract. In Proceedings of the 2011 International Conference on Information Management, Innovation Management and Industrial Engineering, Shenzhen, China, 26–27 November 2011; Volume 2, pp. 33–37. [Google Scholar]
Figure 1.
The R1 under all combinations.

Figure 2.
The p under all combinations.
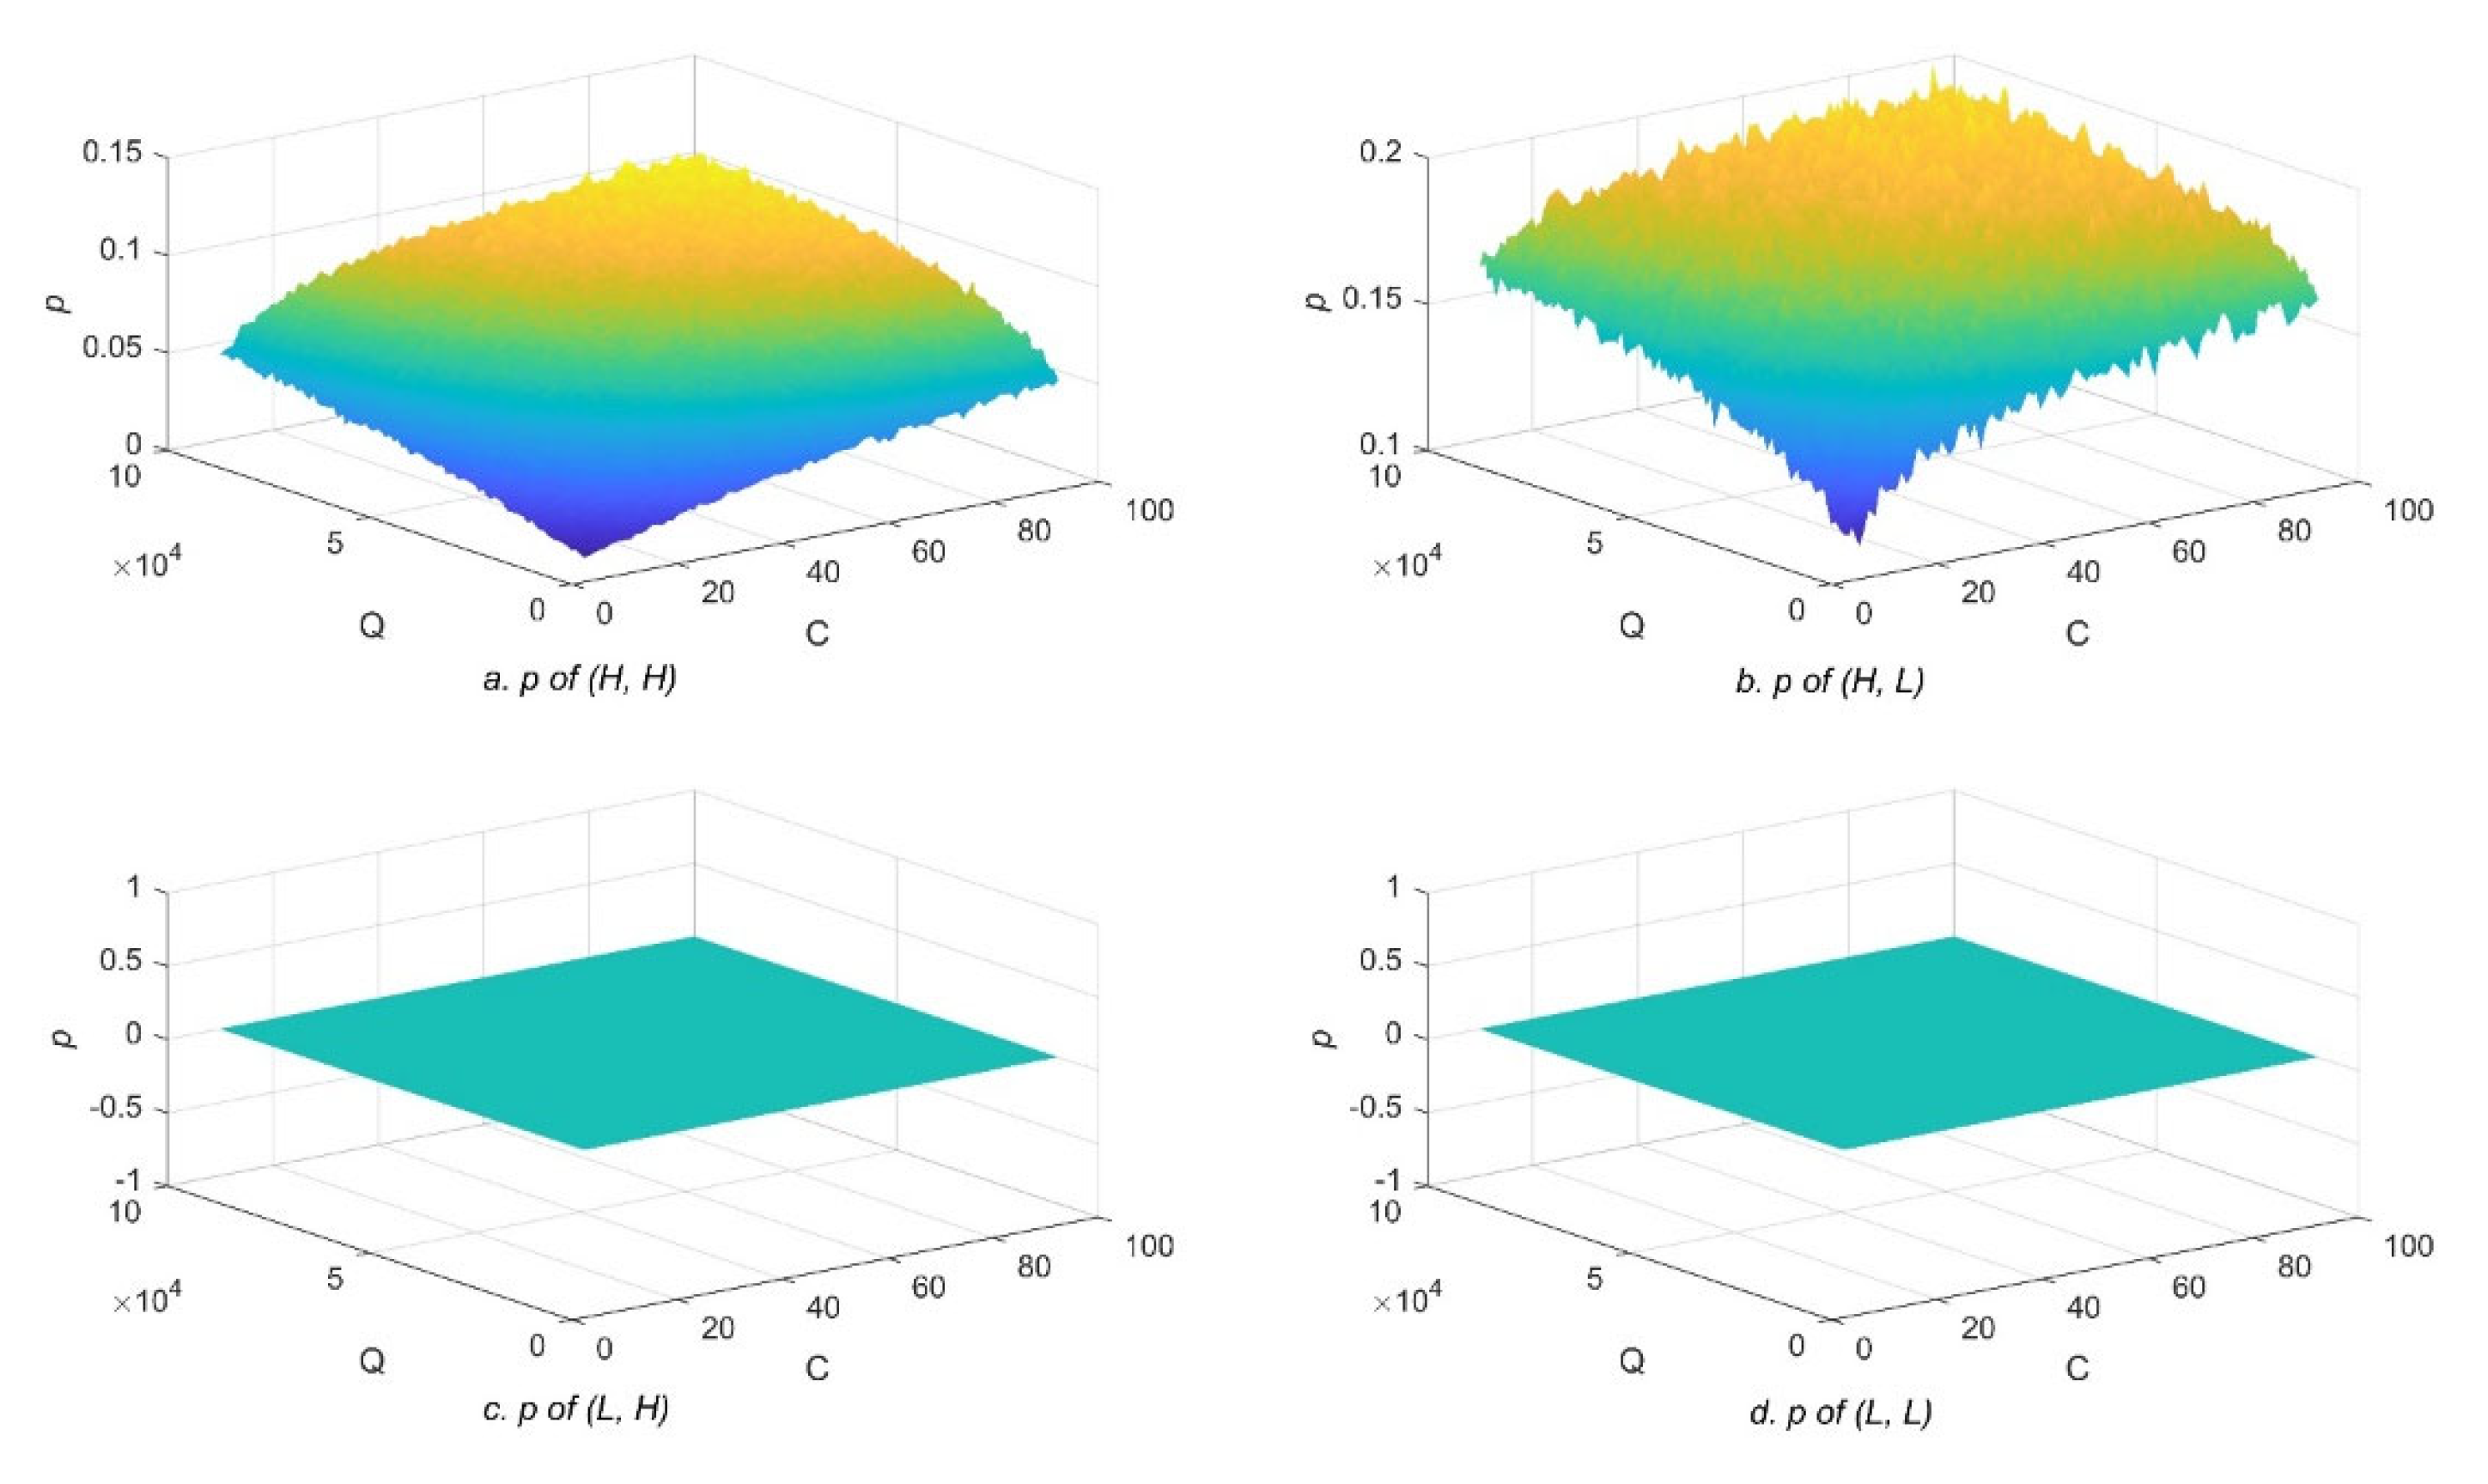
Figure 3.
The R3 under all combinations.

Table 1.
Notations used in this paper.
| Symbol | Description | Additional Information |
|---|---|---|
| Q | Market demand faced by retailer | Q ≥ 0 |
| C | Purchase price of wholesaler | C ≥ 0 |
| C0 | Wholesaler’s sale price at the end of the selling period | C0 ≥ 0 and C0 < C |
| P1, P2 | Product price of upstream wholesaler and downstream retailer | Pi ≥ 0 |
| V1A, V1B | Profits of wholesaler before and after the implementing of VMI | - |
| V2A, V2B | Profits of retailer before and after the implementing of VMI | - |
| S1, S2, S3 | Inventory cost per unit of upstream wholesaler, downstream retailer and VMI | Si ≥ 0 |
| D1, D2, D3 | Ordering cost of upstream wholesaler, downstream retailer and VMI | Di ≥ 0 |
| Q1*, Q2*, Q3* | Economic order quantity (EOQ) of upstream wholesaler, downstream retailer and VMI | Qi* ≥ 0 |
| R1, R2, R3 | Revenue change of wholesaler, retailer and overall supply chain | - |
| λ | Demand amplification factor | λ > 1 |
| α | Reduction coefficient of inventory cost | 0≤α≤1 |
Table 2.
Classification of inventory management level.
| Inventory Management Level | High | Low | |
|---|---|---|---|
| Supply Chain Location | |||
| Upstream | λ∼U (1, 1.05) C0∼U (0.4C, 0.8C) S1∼U (0.01C, 0.02C) α∼U (0.5, 1) D1∼U (500, 750) | λ∼U (1.05, 1.1) C0∼U (0, 0.4C) S1∼U (0.02C, 0.03C) α∼U (0, 0.5) D1∼U (750, 1000) | |
| Downstream | S2∼U (0.03C, 0.04C) D2∼U (500, 750) | S2∼U (0.04C, 0.05C) D2∼U (750, 1000) | |
Disclaimer/Publisher’s Note: The statements, opinions and data contained in all publications are solely those of the individual author(s) and contributor(s) and not of MDPI and/or the editor(s). MDPI and/or the editor(s) disclaim responsibility for any injury to people or property resulting from any ideas, methods, instructions or products referred to in the content. |
© 2023 by the authors. Licensee MDPI, Basel, Switzerland. This article is an open access article distributed under the terms and conditions of the Creative Commons Attribution (CC BY) license (https://creativecommons.org/licenses/by/4.0/).
Share and Cite
MDPI and ACS Style
Sha, J.; Zheng, S. Analysis of Sub-Optimization Impact on Partner Selection in VMI. Sustainability 2023, 15, 2742. https://doi.org/10.3390/su15032742
AMA Style
Sha J, Zheng S. Analysis of Sub-Optimization Impact on Partner Selection in VMI. Sustainability. 2023; 15(3):2742. https://doi.org/10.3390/su15032742
Chicago/Turabian StyleSha, Jin, and Sisi Zheng. 2023. "Analysis of Sub-Optimization Impact on Partner Selection in VMI" Sustainability 15, no. 3: 2742. https://doi.org/10.3390/su15032742
Note that from the first issue of 2016, this journal uses article numbers instead of page numbers. See further details here.