
Spatio-Temporal Evolution of High-Quality Development and the Impact of Carbon Emissions Trading Schemes


School of Economics and Management, Northeast Petroleum University, Daqing 163318, China
*
Author to whom correspondence should be addressed.
Sustainability 2023, 15(4), 2900; https://doi.org/10.3390/su15042900
Submission received: 5 January 2023
/
Revised: 29 January 2023
/
Accepted: 3 February 2023
/
Published: 6 February 2023
Abstract
:Carbon control has become a key strategy in the high-quality development (HQD) phase of emerging countries, but the spillover effects of implementing carbon control instruments on HQD remain to be verified. In order to explore the realistic level of HQD in China and the mechanism of how carbon controls impact on it, this paper analyzes the regional differences and spatio-temporal dynamics of HQD in China by using Chinese provincial panel data from 2006 to 2019. This study evaluated the implications of a regionally implemented carbon emissions trading scheme (ETS) on HQD by using the difference-in-differences (DID) model. The results show that the overall level of HQD in China’s provinces continues to rise. The level of HQD in most provinces showed a transition from low to high and then stabilization. Over the sample period, the national average HQD index increased from 18.95 to 29.96, a growth rate of 58.1%. There was significant regional heterogeneity in HQD. The highest HQD indices in the eastern, central and western regions were 35.67, 27.52 and 24.78, respectively. The level of HQD in the eastern regions was much higher than in the central and western areas. Further analysis revealed that ETS was able to significantly increase the overall level of HQD. Having found that there is regional heterogeneity in HQD, this research examines the specific effects of ETS on HQD and discovers that ETS supports regional HQD in the eastern and central areas, but has no significant influence on HQD in the western region. The robustness of the results was confirmed by the use of parallel trend tests, lagged effects, the removal of environmental disturbances and the replacement of evaluation variables or models. The above findings can be used as a reference for formulating low-carbon policy and promoting HQD levels.
1. Introduction
The current state of the global climate presents a significant challenge to all of humanity. At present, greenhouse gas emissions, represented by carbon dioxide, have been exacerbating the global climate crisis [1,2,3]. In 2020, General Secretary Xi Jinping proposed that “China will increase its autonomous national contribution, adopt more zealous policies and measures, and strive to peak CO2 emissions by 2030 and achieve carbon neutrality by 2060” (also known as the “double carbon targets”) in response to the dire ecological and environmental situation [4]. However, according to data from the 70th edition of the BP Statistical Yearbook of World Energy (2021), China ranked first globally in terms of carbon dioxide emissions in 2020, with 30.7% of the total. Compared with the previous year, China’s total carbon emissions increased by 0.6%. China is under intense pressure to address environmental concerns and cut its carbon emissions.
Currently, countries around the world have been actively implementing relevant measures to cope with the climate crisis. The carbon emissions trading scheme (ETS) is an essential tool for reducing carbon emissions. In 2011, the Chinese government formally presented a plan for establishing a market for trading carbon emissions. As of June 2014, ETS was operating as a pilot program in seven provinces and cities, including Beijing, Tianjin, Shanghai, Chongqing, Shenzhen, Hubei and Guangdong. The national carbon trading market for the electricity sector was formed in 2017 and the national carbon emissions trading market was constructed in 2021. China’s national carbon trading market is the largest carbon market in the world, accounting for 4.5 billion tons of CO2 emissions. However, the national carbon trading market in China is still in its early phases of growth, and neither the market nor the supporting policies have reached a sufficient level of maturity. Therefore, it is crucial to research how the policy has affected the ETS pilot regions.
China’s economy has expanded rapidly since the reform and opening up, but it still faces issues like structural imbalance, intensified environmental pollution and low efficiency [5,6]. China’s crude approach to economic development has put serious pressure on sustainable development [7,8]. Therefore, enhancing the quality of economic growth has become important due to the traditional economic development model’s increasingly visible flaws. China has actively adjusted the direction of its economic development, and General Secretary Xi Jinping noted in the report of the 19th National Congress of the Communist Party of China that China’s economy had transitioned from a period of high-speed growth to a stage of HQD. High-quality development (HQD) has emerged as a new requirement and direction for China’s social development [9].
HQD is a sustainable method of economic development. The core content of HQD is the new development concept of “innovation, coordination, green, openness and sharing”, which is a comprehensive method of development [10,11,12,13]. In the context of “double carbon targets”, it can be challenging for many countries to balance economic development with low carbon emissions. Additionally, regional differences may lead to regional heterogeneity in HQD levels. However, little research has been conducted on the evolutionary characteristics of HQD and its heterogeneity. Whether China’s ETS, as a representative low-carbon policy, can lead to output benefits in economic development while reducing emissions, and whether it has an impact on HQD and whether the impact is heterogeneous in different regions, are important issues to be resolved.
The main contributions of this paper are as follows.
(1) The paper enriches the system of indicators for HQD measurement. Based on previous research, this paper presents a comprehensive assessment of HQD using 43 indicators based on the concept of “innovation, coordination, green, openness and sharing”. We innovatively combine entropy and quadrant diagram methods to illustrate regional differences and the spatio-temporal evolution of HQD levels. This will make it easier for future policy makers to target their policies by comprehending the evolutionary traits of HQD.
(2) From the perspective of research, this work evaluates the varied features of the policy effects as well as the policy impact of ETS on HQD. This study enriches the assessment of the possible spillover effects of China’s ETS. The conclusions could offer fresh insight into how HQD and ETS function and serve as a reference for those who formulate low-carbon policies.
The rest of this essay is structured as follows. The literature on HQD and carbon trading is reviewed in Section 2. The approach and data description are presented in Section 3. The empirical findings from the model are discussed and described in Section 4. The results and policy suggestions are provided in Section 5.
2. Literature Review
2.1. The Policy Background of ETS
The ETS was created in the framework of a low-carbon economy. In accordance with the assessment of International Carbon Action Partnership (ICAP) on the state of global emissions trading in 2022, ETS has now covered 17% of global greenhouse gas emissions, 55% of the global GDP jurisdictions, and one-third of the worldwide population [14]. Scholars have conducted substantial research on the development of carbon markets. Mehling and Haites [15] investigated ways to connect the mechanisms of ETS. Chengping and Xu [16] developed a framework for the establishment of ETS in China, arguing that China should use the opportunity to establish a carbon market and that the establishment of China’s ETS would benefit the restructuring and upgrading of China’s industry. Liu et al. [17] analyzed the development of China’s carbon market and highlighted the challenges it faced. Furthermore, researchers have undertaken considerable research on carbon market subsidy methods, carbon market price influencing factors, carbon market efficiency and liquidity [18,19,20]. These studies have supported the development and enhancement of ETS.
2.2. The Policy Effects of ETS
Much of the research on carbon trading has focused on the policy implications of ETS. The majority of these studies have concentrated on the effects of carbon trading on emissions reduction. Most researchers have demonstrated that ETS can help reduce carbon emissions [21,22,23,24,25]. Researchers have also examined the dynamic impact of ETS on reducing carbon emissions, and have discovered that the impact has grown over time, year by year [26,27]. Additionally, ETS has policy implications in other areas. Zhou and Wang [28] discovered that China’s ETS could help enterprises raise their degree of green technology innovation. Qi et al. [29] used the DDD approach to analyze 33 industries in 30 Chinese provinces from 2009 to 2016 and indicated that a carbon emissions trading policy might improve low-carbon international competitiveness. Xiao et al. [30] adopted a DID model to assess data on listed enterprises in China from 2009 to 2018, demonstrating that ETS may greatly improve total factor productivity (TFP) and promote high-quality economic development. Nevertheless, some scholars consider that China’s ETS has not achieved economic, social and environmental effects. Dai et al. [31] investigated the productivity of a sample of Chinese manufacturing businesses and discovered that ETS had no “Porter effects” on the productivity of the sample firms.
2.3. The Meaning and Measurement of HQD
Scholars have extensively discussed the implications of high-quality development (HQD) in the wake of General Secretary Xi’s declaration that China’s economy had entered a stage of high-quality growth. The focus of economic development in China is gradually turning from seeking quantitative growth toward concentrating on quality and efficiency, as the economy of the country enters a stage of transition and slowing growth [32]. According to Jin [33], HQD is growth that satisfies people’s expanding and various needs for a better life. Li and Hu [34] suggested that encouraging environmentally friendly and ecological growth was essential to HQD. Li et al. [35] claimed that HQD led to improvement in the economy, polity, culture, society and ecosystem as a whole. This study contends that HQD is a comprehensive development model that embodies the new development concepts of “innovation, coordination, green, openness, and sharing”.
The level of HQD has been used to measure the state of economic development. People are becoming more concerned about the quality of economic development as a result of the environmental and social problems caused by the over-emphasis on GDP in the past. Barro [36] criticized the concept of evaluating economic progress simply in terms of GDP, and proposed a quality dimension of economic development that took more factors into account, such as education, health, fertility, income, welfare, law and order, politics and religion. Based on previous research, Mlachila et al. [37] constructed the Quality of Economic Growth Index (QGI), which measures the quality of economic growth in terms of both the intrinsic nature of growth and social outcomes, and argued that higher growth rates with more sustained, socially beneficial growth was the high-quality growth model. Held et al. [38] noted that GDP did not take household production and environmental factors into consideration, creating the National Sustainability Index (NWI) to measure national economic development.
Scholars have primarily studied single and composite indicators for measuring HQD. In several studies, the level of HQD has been assessed by a single indicator, such as total factor productivity (TFP), labor productivity and green total factor productivity (GTFP) [39,40,41]. However, one indicator hardly suffices to capture the entirety of HQD. Comprehensive indicators for HQD have been constructed by some academics. Kong et al. [42] developed a set of economic growth quality indicators based on the effectiveness, consistency and sustainability of economic growth. Li et al. [35] used the dynamics, structure and results of economic development to estimate the level of HQD. According to Huang et al. [43], the quality of economic development was estimated in terms of creative development, cooperation between urban and rural areas, ecological environment, openness to the outside world and people’s livelihoods. Others have created thorough evaluation indicators for HQD since researchers stated that the new development notion of “innovation, coordination, green, openness and sharing” was the foundation for promoting high-quality growth [10,11,12,13]. This study argues that the current HQD indicator system is insufficiently comprehensive, with too few indicators chosen for ecological environment, environmental governance, social openness and social security, which cannot accurately reflect the features of contemporary China’s HQD. In light of the extensive research of numerous scholars and the limitations of the existing HQD indicators, this study constructs a complete evaluation index system of HQD based on the new development concept.
2.4. The Influencing Factors of HQD
Scholars have explored the influencing variables of HQD based on several dimensions such as technological innovation, institutional restrictions and environmental pollution in the study of HQD. Ding et al. [44] used a mediating effects model and a spatial Durbin model to investigate the relationship between the digital economy and HQD, concluding that the digital economy could promote HQD and that technological innovation was an important transmission path from the digital economy to the economic. Li et al. [35] showed that green innovation and institutional constraints could have a significant positive impact on HQD. In their study of the Yangtze River Economic Zone in China, Wang et al. [45] discovered that environmental pollution had a significant negative impact and a negative spatial spillover effect on HQD of energy, while green finance had a significant positive impact and a spatial spillover effect on HQD. Shi et al. [46] studied the high-quality development of cultural tourism (HDCT) in China’s Yangtze River Delta urban agglomeration and found that the three primary elements influencing HDCT were economic development level, technical innovation and professional talent allocation. Wang and Li [47] developed a nonlinear threshold regression model to assess the HQD of China’s manufacturing industry and concluded that capacity utilization, profitability, foreign direct investment and government participation all significantly improved the manufacturing industry’s HQD. Environmental rules have had a considerably negative impact on the manufacturing industry’s HQD. However, few studies have considered the issue of the relationship between ETS and HQD.
In summary, a large number of studies exist on both HQD and ETS, but they still have the following areas for improvement. Firstly, when establishing a comprehensive assessment index system for HQD, the present studies are unable to thoroughly and systematically reflect the current requirements for quality and efficiency improvement of the economy as China enters a new era. For instance, the traditional total factor productivity (TFP) used to assess the level of HQD does not adequately capture the current context of China’s ecological civilization construction. Secondly, the geographical and spatio-temporal diversity of China’s provincial HQD levels is not adequately reflected in previous research. Due to regional environments in distinct provinces, there may be differences in population, industrial structure and energy intensity, which might result in some variations in the degree of HQD. The study of the evolutionary characteristics of HQD can help policymakers to formulate policies in a targeted manner. Thirdly, little attention has been paid to the policy implications of the ETS on China’s high-quality economic development, with the majority of studies on carbon trading concentrating on the consequences of carbon market development and carbon emission reduction. As a result, this article applies an entropy weighting method, quadrant diagram method and visual analysis approaches to evaluate the level of HQD development in 30 Chinese provinces, while analyzing regional differences and spatio-temporal evolution characteristics. Following that, the difference-in-differences model is built to examine the policy impact of ETS on HQD.
3. Methodology and Data
3.1. Methodology
3.1.1. Measurement of High-Quality Development Levels
This paper expands on previous research and employs the new development concept as the overarching framework for developing indicators. To meet the new requirements of China’s economic development, this paper combines the research of Wei and Li [48], Lu et al. [49], Du et al. [10], Huang et al. [43] and Li et al. [12] to construct a comprehensive evaluation index for HQD in the context of innovation-driven development, ecological civilization construction and “double carbon targets”, as shown in Figure 1.
In the area of socio-economics, the entropy weighting approach is frequently adopted. The entropy weighting approach determines the weight of each indicator based on its entropy value [50]. An indicator’s weight will be higher if its data are more discrete, since it contains more information and should be given more attention. Conversely, an indicator will have more uncertainty if its data are less discrete and then it will be assigned a smaller weight. It is a way of objective weighting that has the advantage of being more precise and impartial [10]. Drawing on Li et al. [35], this study applied the method to standardize the indicators and then assigned objective weights to measure the quality development index for each province from 2006 to 2019. The specific calculation steps are given as follows.
The first step was to standardize the indicators for the level of HQD. The following is the mathematical formula for the positive indicators:
The formula for negative indicators is:
where denotes the province, denotes the year, is the raw data and is the standardized indicators.
Second, the information entropy of the standardized index was estimated:
Third, the weights for were calculated.
The high-quality development (HQD) index was then calculated via multiplying the standardized value of each indication by the relevant weight. The level of HQD increases as the value rises.
3.1.2. Evolutionary Analysis of Heterogeneity Characteristics
The quadrant diagram approach uses a mathematical matrix to describe the interrelationships between components. This method can be applied to assess the importance of various factors qualitatively and quantitatively from different perspectives [51]. This method is intuitive, clear and universal, and it is frequently applied to analyze how urbanization affects economic and ecological systems [52]. Following the approach of Zhang and Li [53], the quadrant diagram approach was used to categorize and assess the spatio-temporal variation in the development of high-quality development (HQD) levels. The level of HQD () and growth rate () of province were compared with the national average level of HQD () and average growth rate (). The average level and average growth rate of the HQD index of province from 2006 to 2019 were used as a reference. The average level of HQD was represented by the and the average growth rate of the level of HQD was represented by the . Based on the level of HQD () and growth rate (), provinces were classified into four different categories over time, namely high speed (), growth (), low speed () and stable ().
3.1.3. Difference-in-Differences Model
The difference-in-differences (DID) method has been extensively utilized to evaluate the effects of policy. This method has the advantage of largely avoiding the problem of endogeneity, and the model setting is more scientifically precise and simple to comprehend and apply [54]. However, this method is generally only applicable to panel data. This research examines the influence of ETS on the level of HQD by Chinese provincial panel data from 2006 to 2019. In this study, Beijing, Shanghai, Tianjin, Hubei, Guangdong and Chongqing were chosen as the six pilot provinces and cities that would get treatment for the impacts of the ETS (Shenzhen was included in the calculation of Guangdong province for the study’s convenience). The remaining 24 provinces served as the control group (with the exception of regions including Tibet, Hong Kong, Macao and Taiwan). The baseline DID model was set up as follows.
In this equation, indicates the province and indicates the year. represents the HQD index of Province in year , which was obtained from the comprehensive score of the HQD index system. indicates the dummy variable for the experimental group, and is assigned a value of 1 if the province has implemented an ETS, and 0 otherwise. indicates a series of control variables, including log population, value added of the secondary sector share of GDP, energy intensity and log of the number of industrial enterprises above scale (Huang and Du [55]; Dong et al. [24]). denotes province fixed effects, denotes year fixed effects, and denotes random disturbance terms.
3.2. Data
For this study, the sample was made up of data from 30 Chinese provinces from 2006 to 2019 (with the exception of Tibet, Hong Kong, Macao and Taiwan). The data were obtained from the 2006–2019 provincial statistical yearbooks and China Statistical Yearbook, China Environmental Statistical Yearbook, China Science and Technology Statistical Yearbook and China Social Statistical Yearbook. Data were available from the Office for National Statistics website http://www.stats.gov.cn/tjsj/ (accessed on 1 February 2023). For the few missing values, this paper used interpolation to fill in the gaps. Table 1 gives the definitions and descriptive statistical analysis of the key variables, where HQD is measured by the entropy method. In order to ensure the smoothness of the data, the data on population and industrial enterprises above the scale are logarithmically processed.
4. Results and Discussion
4.1. Test Results of HQD Level
4.1.1. Provincial Levels of HQD and Spatial and Temporal Patterns
Figure 2 shows the average high-quality development (HQD) level and growth rate for 30 Chinese provinces from 2006 to 2019. The average level of HQD was higher in the provinces of Beijing, Guangdong, Shanghai, Zhejiang, Jiangsu, Tianjin and Shandong, with an index ranging from 34.22 to 42.66. Most of the mentioned provinces have higher HQD levels due to better economic development quality, stable economic structure, superior geographical location and excellent macroeconomic development structure [56]. The provinces of Gansu, Xinjiang, Qinghai, Ningxia, Inner Mongolia, Shanxi and Yunnan displayed a lower degree of HQD, with an average HQD index ranging from 16.63 to 18.73. These provinces are largely inland provinces with a comprehensive economic structure but still require additional improvement to issues such as uneven industrial development, insufficient economic development dynamics and poor social openness [57,58]. The levels of HQD in China’s provinces’ varied significantly [10]. The average growth rate of the HQD level in all 30 Chinese provinces remained positive. Among them, Anhui, Gansu, Sichuan, Henan, Hebei and Guizhou had the highest average growth, with an average growth rate of over 5%. Tianjin, Beijing and Shanghai had the lowest average growth rate of less than 2%. It can be observed that the central and western regions are gradually developing and narrowing the gap with the eastern regions. This could be attributed to the diffusion impact in terms of government policy orientation and production factors [57]. There was a clear heterogeneity in the average level of quality development and growth rates between Chinese provinces.
The spatio-temporal dynamics of China’s provincial HQD are depicted in Figure 3. From 2006 to 2009, the level of HQD in the provinces was low, and only Beijing, Shanghai and Guangdong had a HQD level above 30. Gansu had the lowest HQD at 11.22, while Beijing had the highest at 39.42. From 2010 to 2013, the overall level of HQD increased, with the central region experiencing rapid growth. The level of HQD significantly grew from 2014 to 2017, particularly in the eastern and central regions. This could be attributed to the development of ETS in a few eastern and central provinces from 2013 to 2014, which increased the level of HQD. From 2018 to 2019, the level of HQD increased rapidly. The level of HQD in the east and central regions increased quickly and spread to the western region. The overall level of HQD has greatly increased, and the spatio-temporal patterns of HQD in China have changed significantly [44].
4.1.2. Temporal Evolution-Type Heterogeneity
Figure 4 uses the quadrant diagram method to divide the period from 2006 to 2019 into four time periods to map out the spatio-temporal evolutionary characteristics of China’s provincial HQD levels [53]. From an overall perspective, the majority of provinces belonged to the growth type and had high growth rates of HQD levels and notable regional differences from 2006 to 2019. The quadrant type characteristics of HQD showed a transition from a high growth type in certain provinces to a general growth type in most provinces. Those in the first and fourth quadrants have higher levels of HQD than the national average, but with different growth rates. It can be observed that after 2014, provinces in the eastern coastal region gradually transitioned from quadrant one to quadrant four, which indicated a higher level of HQD in this part of the country. However, the growth rate gradually stabilized over time. This reflects the reality that China’s economy is transitioning from old to new dynamics, as well as the objective trend of slowing development in the Chinese economy at this point [59]. Provinces in the central and western regions were mainly focused in the second quadrant, where the HQD level grew at a quicker rate. After 2014, the rate of HQD increased significantly in Heilongjiang, Jiangxi, Hunan and Sichuan, moving from low to high speed. Hubei, Anhui, Guizhou, Yunnan and Xinjiang developed rapidly after 2018, which moved towards high-speed type and growth type stage.
From 2006 to 2009, the overall level of HQD was low, with most provinces in growth mode and no high-speed provinces. From 2010 to 2013, there was an overall rise in HQD, with several provinces continuing to experience rapid growth. Provinces in the middle and western regions gradually changed from low-speed to growth type from 2014 to 2017, whereas provinces in the eastern region turned from high-speed to steady type. From 2018 to 2019, most of the eastern and central provinces tended to stabilize, while the rate of HQD in the western region increased dramatically.
4.1.3. Regional Heterogeneity
The regional heterogeneity of HQD is illustrated in this research by using the average level of HQD in each region. Figure 5 displays the regional differences and evolutionary characteristics of HQD from 2006 to 2019. From 2006 to 2019, HQD levels tended to increase nationally and regionally, with the national average HQD index rising from 18.95 to 29.96, an increase of 58.1%, but with substantial variations between regions. The eastern region had the highest HQD level, which was notably higher than the national average. The central region had a slightly higher level of HQD than the western region, and both of them were below the national average. The eastern region maintained a steady growth in the level of HQD from 2006 to 2019. From 2006 to 2012, the western region grew rapidly and gradually narrowed the difference with the central region, reaching a state of basic parity with the central region in terms of HQD in 2012. From 2013 to 2019, the central region experienced rapid growth, progressively decreasing the gap with the eastern region. The results of the rising level of HQD in China are reflected in the shrinking spatial disparities [57].
4.2. Effects of ETS on HQD
4.2.1. Results of the Baseline Analysis
The average effect of the ETS on the level of HQD is shown in Table 2. In Model 1, the control variables, province fixed effects and year fixed effects were not taken into account. Model 1 demonstrates that the ETS significantly increased the level of HQD. Model 2 added a number of control variables, including the log of the population, the share of secondary industry’s value added to GDP, the energy intensity and the log of the number of industrial enterprises above the scale. As can be observed, the HQD level was still markedly improved by the ETS. This validates that HQD may be promoted by ETS by encouraging clean and low-carbon technological innovation, industrial structure transformation and upgrading, and lowering carbon emissions [35]. The findings of this study are congruent with those of Xiao et al. [30]. This implies that from a national perspective, this article verifies the policy effect of ETS on HQD, but the robustness of its conclusions has to be verified further.
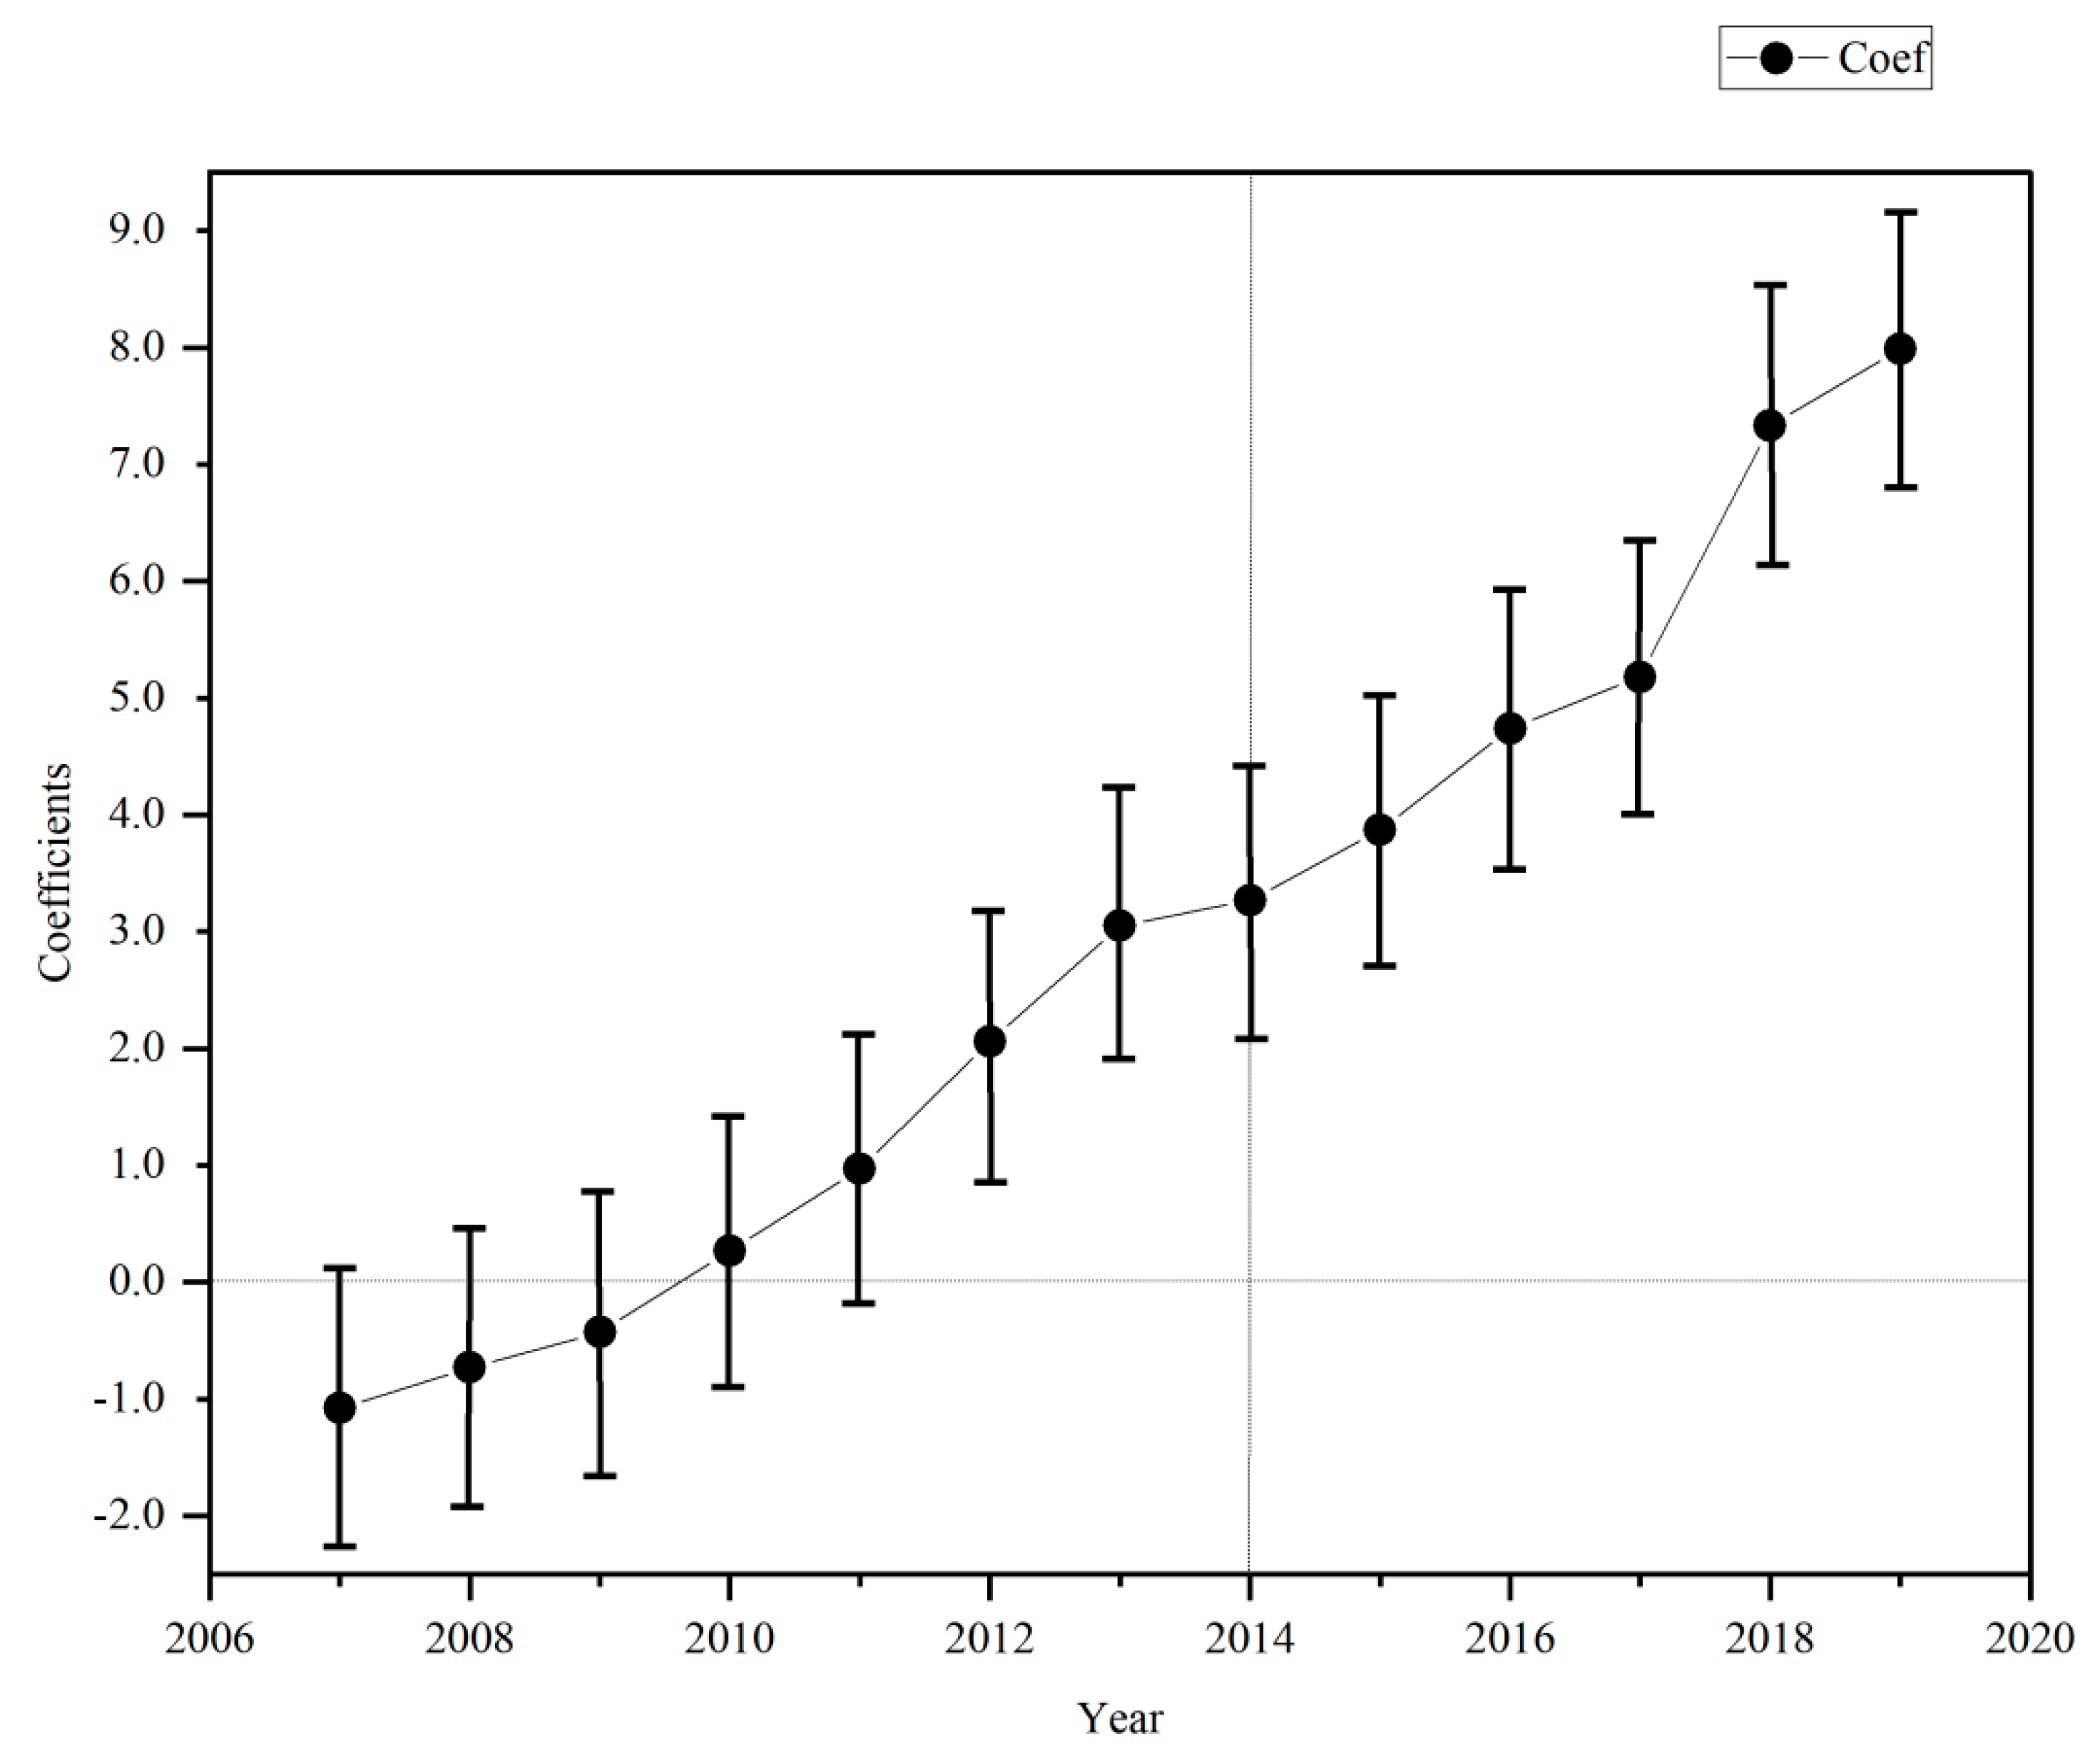
The treatment and control groups meet the parallel trend hypothesis, which is the basis for using the DID model in the study. In other words, there was no noticeable difference in the trend in the level of HQD between the experimental and control groups before the adoption of the ETS. We verified this and found that prior to the implementation of ETS, HQD levels maintained a relatively stable trend, as shown in Figure 6. The trends in HQD levels between the experimental and control groups in this study did not differ statistically and met the requirements for using DID model. China’s ETS pilot started in November 2013, and, as of June 2014, China had implemented ETS pilots in seven provinces and cities. According to Figure 6, the correlation coefficient is positive and significantly higher after the adoption of the ETS pilot policy, indicating that ETS can contribute to improving HQD levels. In addition, we discovered that the correlation coefficient rose dramatically after 2017. This may be related to the establishment of China’s national electricity sector ETS market in 2017. These observations are consistent with those of Zhang et al. [60]. The sample in this study passed the parallel trend test.
4.2.2. Robustness Test
Various robustness tests are conducted in this paper, including consideration of lagged effects, exclusion of environmental interference and replacement of evaluation variables or models.
(1) Robustness tests considering lagged effects.Table 3 reports the results of robustness tests that take into account lagged effects. In this research, we consider the possibility of implementation lags for local innovation, coordination, green, openness and sharing policies related to carbon trading, which may have an impact on the level of HQD. The estimation results with one lag were reported in Model 1 and with two lags reported in Model 2. The estimates were still reliable in terms of the symbol of the coefficient values and the significance of the estimated lag effects. Additionally, ETS lags 1 and 2 still had a considerable impact on the level of HQD, supporting the hypothesis that the effect of the policy was delayed [61].
(2) Robustness test for exclusion of environmental interference. The spatial spillover effect of policies and the impact of regional collaborative governance initiatives need to be excluded. Yu and Li [61] verified that ETS had spatial spillover effects. ETS may also influence the HQD levels of nearby regions through factor flow and technological dissemination under the institutional framework of shared prevention and control of air pollution, leading to bias in the estimation results. Therefore, the sample of provinces adjacent to ETS was excluded. The results of Model 1 in Table 4 show that even when the neighboring provinces were excluded, ETS continued to have a strong beneficial impact on the level of HQD.
Furthermore, variations in regional economic development levels could affect the results of estimation. The coastal provinces and the municipalities (Beijing, Tianjin, Shanghai and Chongqing) are more developed and have an advantage in terms of their level of social resources and economic development. The sample data of municipalities directly under the central government and coastal provinces were left out of this research to increase the generalizability of the conclusions on the impact of ETS on the level of HQD. Table 4 displays the outcomes of further estimation. After eliminating municipalities, results in Model 2 show that the positive impact of ETS on HQD level was greatly increased. ETS still had a significant contribution to HQD in Model 3 when the coastal provinces were excluded.
(3) Robustness testing of replacement evaluation variables or models. The results of the robustness tests for changing the estimation variables or models are shown in Table 5. First, the starting year of the deployment of ETS was uniformly set to the year of the implementation of this policy and re-estimated the parameters by referring to Yan et al. [62] (The time taken for the pilot provinces and cities to implement carbon trading schemes was Shanghai (26 November 2013), Beijing (28 November 2013), Guangdong (19 December 2013), Tianjin (26 December 2013), Hubei (2 April 2014) and Chongqing (19 June 2014)). In Model 1, the results were still significant after changing the implementation time of ETS. In addition, green total factor productivity (GTFP) was considered to represent HQD level [30]. In this study, GTFP is adopted as a stand-in for HQD, and Model 2 reports the relevant findings. As can be observed, the level of HQD was significantly improved by ETS.
Many scholars developed the PSM–DID model based on the DID model to eliminate the self-selection effect of the policy and thus reduce the estimation bias [30,55,63,64]. Using the PSM–DID approach, this research re-estimated the impact of ETS on HQD, and the results are shown in Model 3. In addition, different evaluation methods may skew the results. The level of HQD was re-evaluated via factor analysis and the parameters were estimated. The corresponding results are presented in Model 4. After replacing the model, ETS still had significantly impacted on the level of HQD.
4.2.3. Heterogeneity Analysis Results
In terms of the regions covered by the carbon emissions trading pilot policy, it covers almost the whole of the eastern, central and western regions. However, there are some regional variations between the eastern, central and western regions, such as geographical location, natural resource endowment, investment distribution, industrial structure and technological innovation [56]. Therefore, after the implementation of ETS, there may be differences in the impact on the level of HQD.
The findings of the test for regional heterogeneity are presented in Table 6. Models 1 to 3 represent regression statistics in the eastern, central and western areas. ETS had a positive effect on all three regions, with significant effects in the eastern and central regions and little effects in the western. The estimated coefficients of the eastern, central and western regions were 2.209, 1.877 and 0.327, respectively. The calculated coefficient was highest in the eastern region, then in the middle region and finally in the western region. The eastern and central regions have some advantages over the western regions in terms of the economic environment, infrastructure and talent concentration, which can be more attractive to factors like humans and capital, as well as enabling better performance of the ETS’s responsibility for resource allocation. This may be the main reason for the difference in the impact of ETS on HQD in the eastern, central and western regions.
5. Conclusions and Policy Implications
5.1. Conclusions
Balancing economic development and low-carbon emissions is an important issue for all countries in the context of the “double carbon targets” and the promotion of high-quality economic development (HQD). However, previous studies have focused less on the comprehensive assessment of HQD levels. This study uses data from 2006 to 2019 for each province in China and uses 43 indicators to thoroughly evaluate HQD levels. The impact of ETS, a globally representative low-carbon policy, on HQD levels is then analyzed by using DID methodology, and the regional heterogeneity of the policy is explored. The main conclusions are as follows.
- (1)
- This study found that HQD levels continued to increase over the sample period, with the national average HQD index rising from 18.95 to 29.96, an increase of 58.1%. In addition, the average growth rate of HQD remained positive in all 30 Chinese provinces. The level of HQD in most provinces showed a transition from low to high and then stabilization.
- (2)
- There is remarkable spatio-temporal heterogeneity in HQD levels. In the time dimension, only nine provinces in the country had an HQD index above 20 from 2006 to 2009, while the average HQD index was above 20 in all provinces in 2018 and 2019, with HQD levels in all provinces increasing over time. In the spatial dimension, the HQD shows a clear regional diversity. The highest HQD indices in the eastern, central and western regions were 35.67, 27.52 and 24.78, respectively. The eastern HQD level was much higher than that in the central and western regions.
- (3)
- ETS can significantly improve HQD levels. This study passed the parallel trend test, considered lagged effects, excluded environmental interference and replaced evaluation variables or models whose results remained significant. Further analysis of the regional heterogeneity of ETS policy reveals that ETS does not have a significant impact on the western region. ETS has greatly increased HQD levels in the eastern and central regions.
5.2. Policy Implications
This study measures the level of HQD in the context of “double carbon targets” and explores the impact of ETS on HQD with some policy implications.
First, using the new development concept as a guide could promote progress in regional HQD levels. This study found that, while the general level of HQD improved greatly during the sample period, there were still significant differences between provinces and regions. On the one hand, eastern areas should capitalize on their existing assets, establish regional ties and maximize their economic development potential. On the other hand, in response to the lower level of HQD development in the central and western regions, the essence of their development should be further dissected. To promote the level of HQD development, attention should be paid to the possible problems behind the development of these provinces, using the new development concept as the guide.
Second, this study aids adherence to and improvements in the carbon tube control policy represented by ETS to promote the improvement of HQD. It shows that ETS can significantly contribute to the improvement of HQD. Under the current “double carbon targets” scenario, the national carbon market should continue to be built and gradually improved, carbon trading pilot projects should be integrated with the national carbon market at a faster rate, and the national carbon market’s coverage should gradually be increased. In addition, other low-carbon policies can be established to complement carbon trading mechanisms under appropriate conditions.
Third, the study shows that regional differences should be taken into account to assist the creation of low-carbon policies. This study shows that the policy effects of ETS on HQD are regionally heterogeneous. As a result, it is crucial to take regional disparities into account when advocating for the development of a national carbon market. To better support the HQD of the central and western areas, different carbon emission trading strategies should be put into place. Additionally, we must learn from the implementation of carbon trading pilot policies to develop localized carbon markets and promote HQD.
Finally, the limitations of this study may guide future research in certain directions. First, the mechanism of how ETS affects HQD could be further analyzed in future research. Second, with the establishment of the national carbon market in China, further evaluation work could be carried out in the future. Third, we can analyze how to balance carbon control and economic development at the enterprise level from the perspective of enterprises.
Author Contributions
R.C.: Conceptualization, Modelling, Methodology, Data curation, Visualization, Software, Validation, Writing—original draft, Writing—review & editing. Y.X.: Conceptualization, Supervision, Methodology, Formal analysis, Validation, Writing—review & editing. F.Y.: Supervision, Formal analysis, Visualization, Validation, Writing–review & editing. All authors have read and agreed to the published version of the manuscript.
Funding
This research was funded by the Daqing Philosophy and Social Science Planning Research Project “Research on Carbon Emissions and Low Carbon Strategy of Petroleum Petrochemical Industry” (NO. DSGB2015054) and The National Natural Science Foundation of China (NSFC) project “Study on the mechanism of local officials’ turnover on green technology innovation in high energy-consuming enterprises” (No. 72002029).
Institutional Review Board Statement
Not applicable.
Informed Consent Statement
This submission does not require an ethics statement.
Data Availability Statement
Data was obtained from National Bureau of Statistics of China.
Conflicts of Interest
The authors have declared that no competing interest exist.
References
- Heidari, N.; Pearce, J.M. A review of greenhouse gas emission liabilities as the value of renewable energy for mitigating lawsuits for climate change related damages. Renew. Sustain. Energy Rev. 2016, 55, 899–908. [Google Scholar] [CrossRef]
- Dino, I.G.; Akgül, C.M. Impact of climate change on the existing residential building stock in Turkey: An analysis on energy use, greenhouse gas emissions and occupant comfort. Renew. Energy 2019, 141, 828–846. [Google Scholar] [CrossRef]
- Rehman, A.; Ma, H.; Ahmad, M.; Irfan, M.; Traore, O.; Chandio, A.A. Towards environmental Sustainability: Devolving the influence of carbon dioxide emission to population growth, climate change, Forestry, livestock and crops production in Pakistan. Ecol. Indic. 2021, 125, 107460. [Google Scholar] [CrossRef]
- Xi, J.P. Xi Jinping’s Speech at the Climate Ambition Summit. 2020. Available online: http://www.gov.cn/xinwen/2020-12/13/content_5569138.htm. (accessed on 20 May 2022).
- Wang, Q.; Hao, D.; Li, F.; Guan, X.; Chen, P. Development of a new framework to identify pathways from socioeconomic development to environmental pollution. J. Clean. Prod. 2020, 253, 119962. [Google Scholar] [CrossRef]
- Yuan, H.; Zhang, T.; Hu, K.; Feng, Y.; Feng, C.; Jia, P. Influences and transmission mechanisms of financial agglomeration on environmental pollution. J. Environ. Manag. 2021, 303, 114136. [Google Scholar] [CrossRef]
- Sun, C.; Tong, Y.; Zou, W. The evolution and a temporal-spatial difference analysis of green development in China. Sustain. Cities Soc. 2018, 41, 52–61. [Google Scholar] [CrossRef]
- Sun, Y.; Wang, N. Sustainable urban development of the π-shaped Curve Area in the Yellow River basin under ecological constraints: A study based on the improved ecological footprint model. J. Clean. Prod. 2022, 337, 130452. [Google Scholar] [CrossRef]
- Liu, J.; Zhang, L.; Zhang, N. Analyzing the South-North Gap in the High-Quality Development of China’s Urbanization. Sustainability 2022, 14, 2178. [Google Scholar] [CrossRef]
- Du, J.; Zhang, J.; Li, X. What Is the Mechanism of Resource Dependence and High-Quality Economic Development? An Empirical Test from China. Sustainability 2020, 12, 8144. [Google Scholar] [CrossRef]
- Liu, R.; Guo, T. Construction and Application of the High-quality Development Index—Also on the High-quality Development of Northeast China’s Economy. J. Northeast. Univ. (Soc. Sci.) 2020, 22, 31. (In Chinese) [Google Scholar] [CrossRef]
- Li, X.; Lu, Y.; Huang, R. Whether foreign direct investment can promote high-quality economic development under environmental regulation: Evidence from the Yangtze River Economic Belt, China. Environ. Sci. Pollut. Res. 2021, 28, 21674–21683. [Google Scholar] [CrossRef]
- Yang, G.; Deng, F.; Wang, Y.; Xiang, X. Digital Paradox: Platform Economy and High-Quality Economic Development—New Evidence from Provincial Panel Data in China. Sustainability 2022, 14, 2225. [Google Scholar] [CrossRef]
- ICAP. Emissions Trading Worldwide: Status Report 2022; International Carbon Action Partnership: Berlin, Germany, 2022. [Google Scholar]
- Mehling, M.; Haites, E. Mechanisms for linking emissions trading schemes. Clim. Policy 2009, 9, 169–184. [Google Scholar] [CrossRef]
- Chengping, C.; Xu, Z. A Study on the Construction of China’s Carbon EmissionsTrading System. Energy Procedia 2011, 5, 1037–1043. [Google Scholar] [CrossRef]
- Liu, L.; Chen, C.; Zhao, Y.; Zhao, E. China׳s carbon-emissions trading: Overview, challenges and future. Renew. Sustain. Energy Rev. 2015, 49, 254–266. [Google Scholar] [CrossRef]
- Perino, G.; Willner, M. Procrastinating reform: The impact of the market stability reserve on the EU ETS. J. Environ. Econ. Manag. 2016, 80, 37–52. [Google Scholar] [CrossRef]
- Lin, B.; Jia, Z. What are the main factors affecting carbon price in Emission Trading Scheme? A case study in China. Sci. Total Environ. 2019, 654, 525–534. [Google Scholar] [CrossRef] [PubMed]
- Wu, R.; Qin, Z. Assessing market efficiency and liquidity: Evidence from China’s emissions trading scheme pilots. Sci. Total Environ. 2021, 769, 144707. [Google Scholar] [CrossRef]
- Zhang, Y.-J.; Wei, Y.-M. An overview of current research on EU ETS: Evidence from its operating mechanism and economic effect. Appl. Energy 2010, 87, 1804–1814. [Google Scholar] [CrossRef]
- Wang, K.; Wei, Y.-M.; Huang, Z. Potential gains from carbon emissions trading in China: A DEA based estimation on abatement cost savings. Omega 2016, 63, 48–59. [Google Scholar] [CrossRef]
- Zhang, Y.-J.; Peng, Y.-L.; Ma, C.-Q.; Shen, B. Can environmental innovation facilitate carbon emissions reduction? Evidence from China. Energy Policy 2017, 100, 18–28. [Google Scholar] [CrossRef]
- Dong, F.; Dai, Y.; Zhang, S.; Zhang, X.; Long, R. Can a carbon emission trading scheme generate the Porter effect? Evidence from pilot areas in China. Sci. Total. Environ. 2019, 653, 565–577. [Google Scholar] [CrossRef] [PubMed]
- Li, X.; Shu, Y.; Jin, X. Environmental regulation, carbon emissions and green total factor productivity: A case study of China. Environ. Dev. Sustain. 2022, 24, 2577–2597. [Google Scholar] [CrossRef]
- Yan, Y.; Zhang, X.; Zhang, J.; Li, K. Emissions trading system (ETS) implementation and its collaborative governance effects on air pollution: The China story. Energy Policy 2020, 138, 111282. [Google Scholar] [CrossRef]
- Zhang, H.; Duan, M. China’s pilot emissions trading schemes and competitiveness: An empirical analysis of the provincial industrial sub-sectors. J. Environ. Manag. 2020, 258, 109997. [Google Scholar] [CrossRef]
- Zhou, F.; Wang, X. The carbon emissions trading scheme and green technology innovation in China: A new structural economics perspective. Econ. Anal. Policy 2022, 74, 365–381. [Google Scholar] [CrossRef]
- Qi, S.-Z.; Zhou, C.-B.; Li, K.; Tang, S.-Y. The impact of a carbon trading pilot policy on the low-carbon international competitiveness of industry in China: An empirical analysis based on a DDD model. J. Clean. Prod. 2021, 281, 125361. [Google Scholar] [CrossRef]
- Xiao, J.; Li, G.; Zhu, B.; Xie, L.; Hu, Y.; Huang, J. Evaluating the impact of carbon emissions trading scheme on Chinese firms’ total factor productivity. J. Clean. Prod. 2021, 306, 127104. [Google Scholar] [CrossRef]
- Dai, Y.; Li, N.; Gu, R.; Zhu, X. Can China’s Carbon Emissions Trading Rights Mechanism Transform its Manufacturing Industry? Based on the Perspective of Enterprise Behavior. Sustainability 2018, 10, 2421. [Google Scholar] [CrossRef]
- Mei, L.; Chen, Z. The Convergence Analysis of Regional Growth Differences in China: The Perspective of the Quality of Economic Growth*. J. Serv. Sci. Manag. 2016, 09, 453–476. [Google Scholar] [CrossRef] [Green Version]
- Jin, B. Economics research on “high-quality development. China Ind. Econ. 2018, 4, 5–18. (In Chinese) [Google Scholar] [CrossRef]
- Li, D.; Hu, S. How does Technological Innovation Mediate the Relationship between Environmental Regulation and High-Quality Economic Development?: Empirical Evidence from China. Sustainability 2021, 13, 2231. [Google Scholar] [CrossRef]
- Li, C.; Wan, J.; Xu, Z.; Lin, T. Impacts of Green Innovation, Institutional Constraints and Their Interactions on High-Quality Economic Development across China. Sustainability 2021, 13, 5277. [Google Scholar] [CrossRef]
- Barro, R.J. Quantity and Quality of Economic Growth; Banco Central de Chile: Santiago, Chile, 2002. [Google Scholar]
- Mlachila, M.; Tapsoba, R.; Tapsoba, S.J.A. A Quality of Growth Index for Developing Countries: A Proposal. Soc. Indic. Res. 2016, 134, 675–710. [Google Scholar] [CrossRef]
- Held, B.; Rodenhäuser, D.; Diefenbacher, H.; Zieschank, R. The National and Regional Welfare Index (NWI/RWI): Redefining Progress in Germany. Ecol. Econ. 2018, 145, 391–400. [Google Scholar] [CrossRef]
- He, X.Y.; Shen, K.R. Modern economic system, full factor productivity and high-quality development. Shanghai Econ. Res. 2018, 6, 25–34. (In Chinese) [Google Scholar] [CrossRef]
- Chen, S.Y.; Chen, D.K. Air Pollution, Government regulations and High-quality Economic Development. Econ. Res. 2018, 53, 20–34. (In Chinese) [Google Scholar]
- Liu, P.; Zhu, B.; Yang, M. Has marine technology innovation promoted the high-quality development of the marine economy?—Evidence from coastal regions in China. Ocean Coast. Manag. 2021, 209, 105695. [Google Scholar] [CrossRef]
- Kong, Q.; Peng, D.; Ni, Y.; Jiang, X.; Wang, Z. Trade openness and economic growth quality of China: Empirical analysis using ARDL model. Finance Res. Lett. 2020, 38, 101488. [Google Scholar] [CrossRef]
- Huang, X.; Cai, B.; Li, Y. Evaluation Index System and Measurement of High-quality Development in China. Rev. Cercet. Interv. Sociala 2020, 68, 163–178. [Google Scholar] [CrossRef]
- Ding, C.; Liu, C.; Zheng, C.; Li, F. Digital Economy, Technological Innovation and High-Quality Economic Development: Based on Spatial Effect and Mediation Effect. Sustainability 2021, 14, 216. [Google Scholar] [CrossRef]
- Wang, F.; Wang, R.; He, Z. The impact of environmental pollution and green finance on the high-quality development of energy based on spatial Dubin model. Resour. Policy 2021, 74, 102451. [Google Scholar] [CrossRef]
- Shi, Z.; Xu, D.; Xu, L. Spatiotemporal characteristics and impact mechanism of high-quality development of cultural tourism in the Yangtze River Delta urban agglomeration. PLoS ONE 2021, 16, e0252842. [Google Scholar] [CrossRef] [PubMed]
- Wang, H.; Li, B. Environmental regulations, capacity utilization, and high-quality development of manufacturing: An analysis based on Chinese provincial panel data. Sci. Rep. 2021, 11, 1–13. [Google Scholar] [CrossRef] [PubMed]
- Wei, M.; Li, S.H. Study on the Measurement of Economic High-Quality Development Level in China in the New Era. Quant. Tech. Econ. 2018, 35, 3–20. (In Chinese) [Google Scholar] [CrossRef]
- Lu, B.K.; Xing, M.Y.; Yang, Q.L. Measurement and Spatio-temporal Differences Analysis of High Quality Development Level of China’s Economy. Stat. Decis. 2019, 35, 113–117. (In Chinese) [Google Scholar] [CrossRef]
- Ji, Y.; Huang, G.H.; Sun, W. Risk assessment of hydropower stations through an integrated fuzzy entropy-weight multiple criteria decision making method: A case study of the Xiangxi River. Expert Syst. Appl. 2015, 42, 5380–5389. [Google Scholar] [CrossRef]
- Chen, M.; Liu, W.; Tao, X. Evolution and assessment on China’s urbanization 1960–2010: Under-urbanization or over-urbanization? Habitat Int. 2013, 38, 25–33. [Google Scholar] [CrossRef]
- Shen, L.; Peng, Y.; Zhang, X.; Wu, Y. An alternative model for evaluating sustainable urbanization. Cities 2012, 29, 32–39. [Google Scholar] [CrossRef]
- Zhang, H.; Li, S. Carbon emissions’ spatial-temporal heterogeneity and identification from rural energy consumption in China. J. Environ. Manag. 2022, 304, 114286. [Google Scholar] [CrossRef]
- Li, J.; Lin, B. Environmental impact of electricity relocation: A quasi-natural experiment from interregional electricity transmission. Environ. Impact Assess. Rev. 2017, 66, 151–161. [Google Scholar] [CrossRef]
- Huang, Z.; Du, X. Toward green development? Impact of the carbon emissions trading system on local governments’ land supply in energy-intensive industries in China. Sci. Total. Environ. 2020, 738, 139769. [Google Scholar] [CrossRef] [PubMed]
- Lu, X.; Kuang, B.; Li, J. Regional difference decomposition and policy implications of China’s urban land use efficiency under the environmental restriction. Habitat Int. 2018, 77, 32–39. [Google Scholar] [CrossRef]
- Wang, Q.; Zhao, C. Regional difference and driving factors of industrial carbon emissions performance in China. Alex. Eng. J. 2021, 60, 301–309. [Google Scholar] [CrossRef]
- Liu, H.; Wang, C.; Tian, M.; Wen, F. Analysis of regional difference decomposition of changes in energy consumption in China during 1995–2015. Energy 2019, 171, 1139–1149. [Google Scholar] [CrossRef]
- Lu, S.; Shen, J.H.; Li, W.; Zhang, J. A theory of economic development and dynamics of Chinese economy. Econ. Model. 2020, 86, 69–87. [Google Scholar] [CrossRef]
- Zhang, Z.; Zhang, J.; Feng, Y. Assessment of the Carbon Emission Reduction Effect of the Air Pollution Prevention and Control Action Plan in China. Int. J. Environ. Res. Public Health 2021, 18, 13307. [Google Scholar] [CrossRef]
- Yu, D.-J.; Li, J. Evaluating the employment effect of China’s carbon emission trading policy: Based on the perspective of spatial spillover. J. Clean. Prod. 2021, 292, 126052. [Google Scholar] [CrossRef]
- Yan, Z.; Zou, B.; Du, K.; Li, K. Do renewable energy technology innovations promote China’s green productivity growth? Fresh evidence from partially linear functional-coefficient models. Energy Econ. 2020, 90, 104842. [Google Scholar] [CrossRef]
- Zhu, B.; Zhang, M.; Huang, L.; Wang, P.; Su, B.; Wei, Y.-M. Exploring the effect of carbon trading mechanism on China’s green development efficiency: A novel integrated approach. Energy Econ. 2020, 85, 104601. [Google Scholar] [CrossRef]
- Ogunpaimo, O.R.; Oyetunde-Usman, Z.; Surajudeen, J. Impact of Climate Change Adaptation on Household Food Security in Nigeria-a Difference-in-Difference Approach. Sustainability 2021, 13, 1444. [Google Scholar] [CrossRef]
Figure 1.
HQD Indicator System. Notes: (+) indicates a positive indicator, while (−) indicates a negative indicator.
Figure 1.
HQD Indicator System. Notes: (+) indicates a positive indicator, while (−) indicates a negative indicator.

Figure 2.
Average Provincial High Quality Development Levels and Growth Rates in China. Notes: The lengths of the yellow bars in Figure 2 reflect the growth rate of the average level of HQD (from high to low), while the colors in the graph show the average level of HQD for the province from 2006 to 2019 (from lighter to darker).
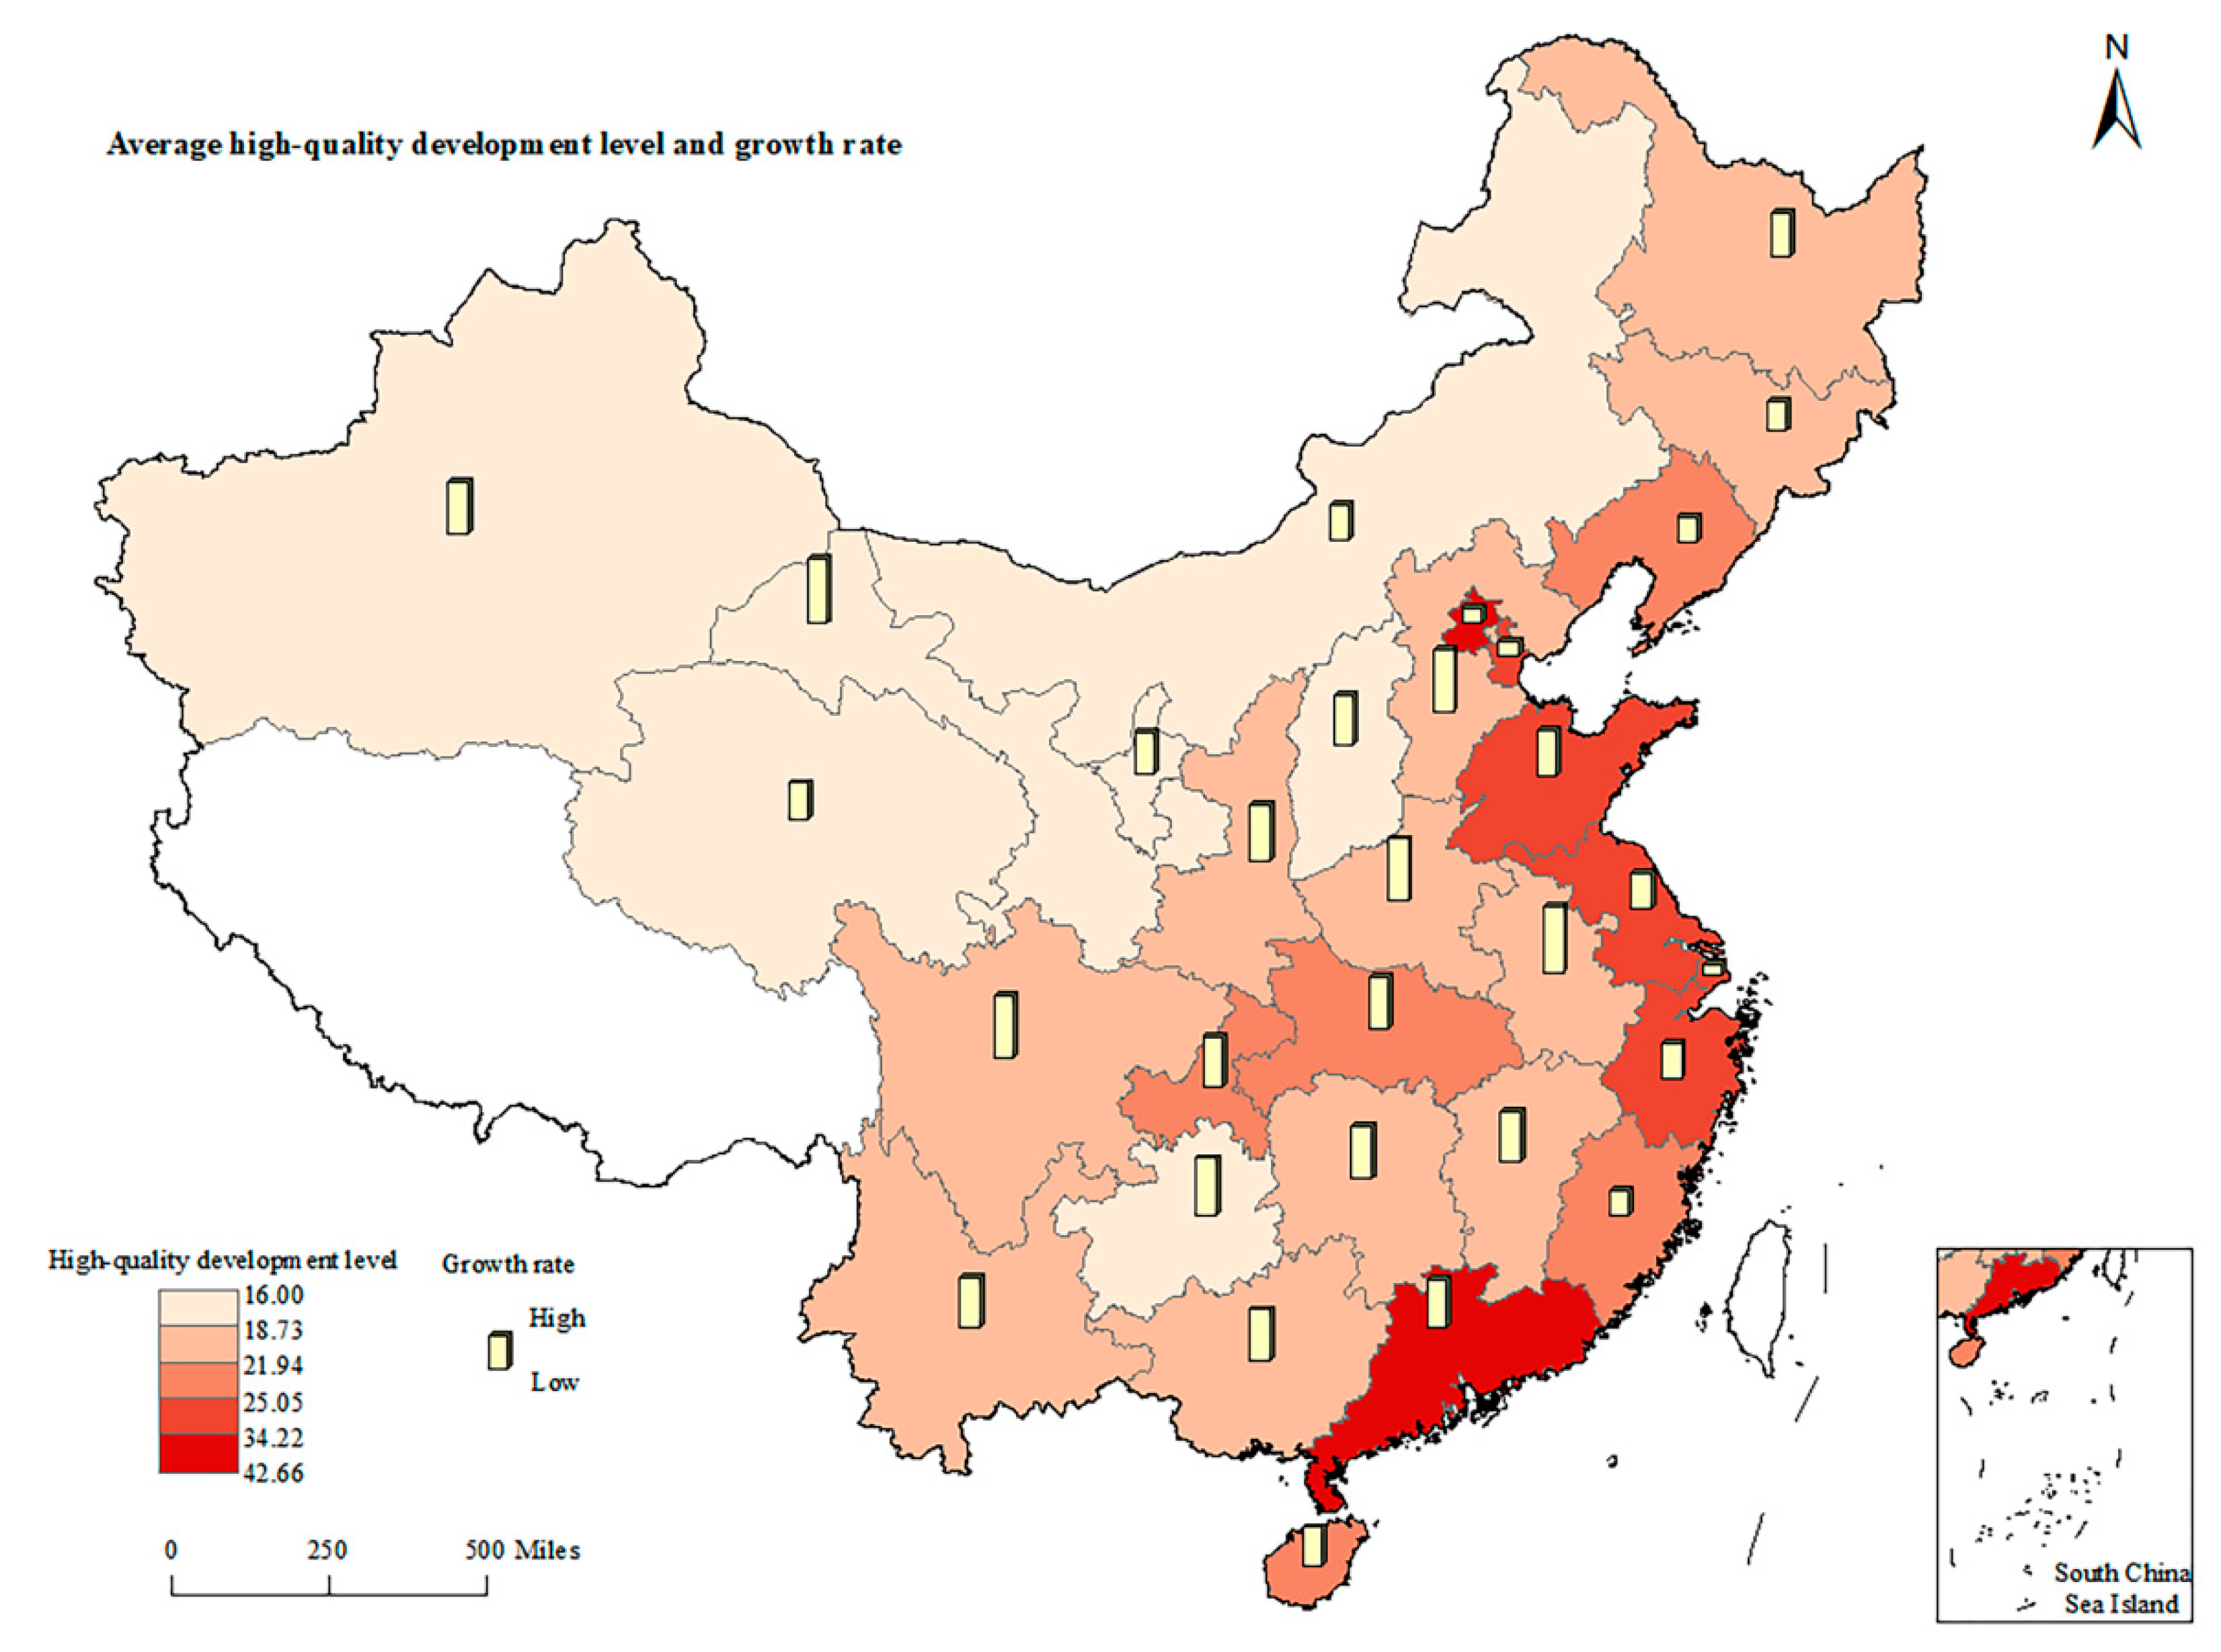
Figure 3.
Spatio-temporal dynamics of the level of HQD in China’s provinces. Notes: The colors in Figure 3 represent the average level of HQD in the province (from lighter to darker), with blank areas of color representing no relevant data.
Figure 3.
Spatio-temporal dynamics of the level of HQD in China’s provinces. Notes: The colors in Figure 3 represent the average level of HQD in the province (from lighter to darker), with blank areas of color representing no relevant data.
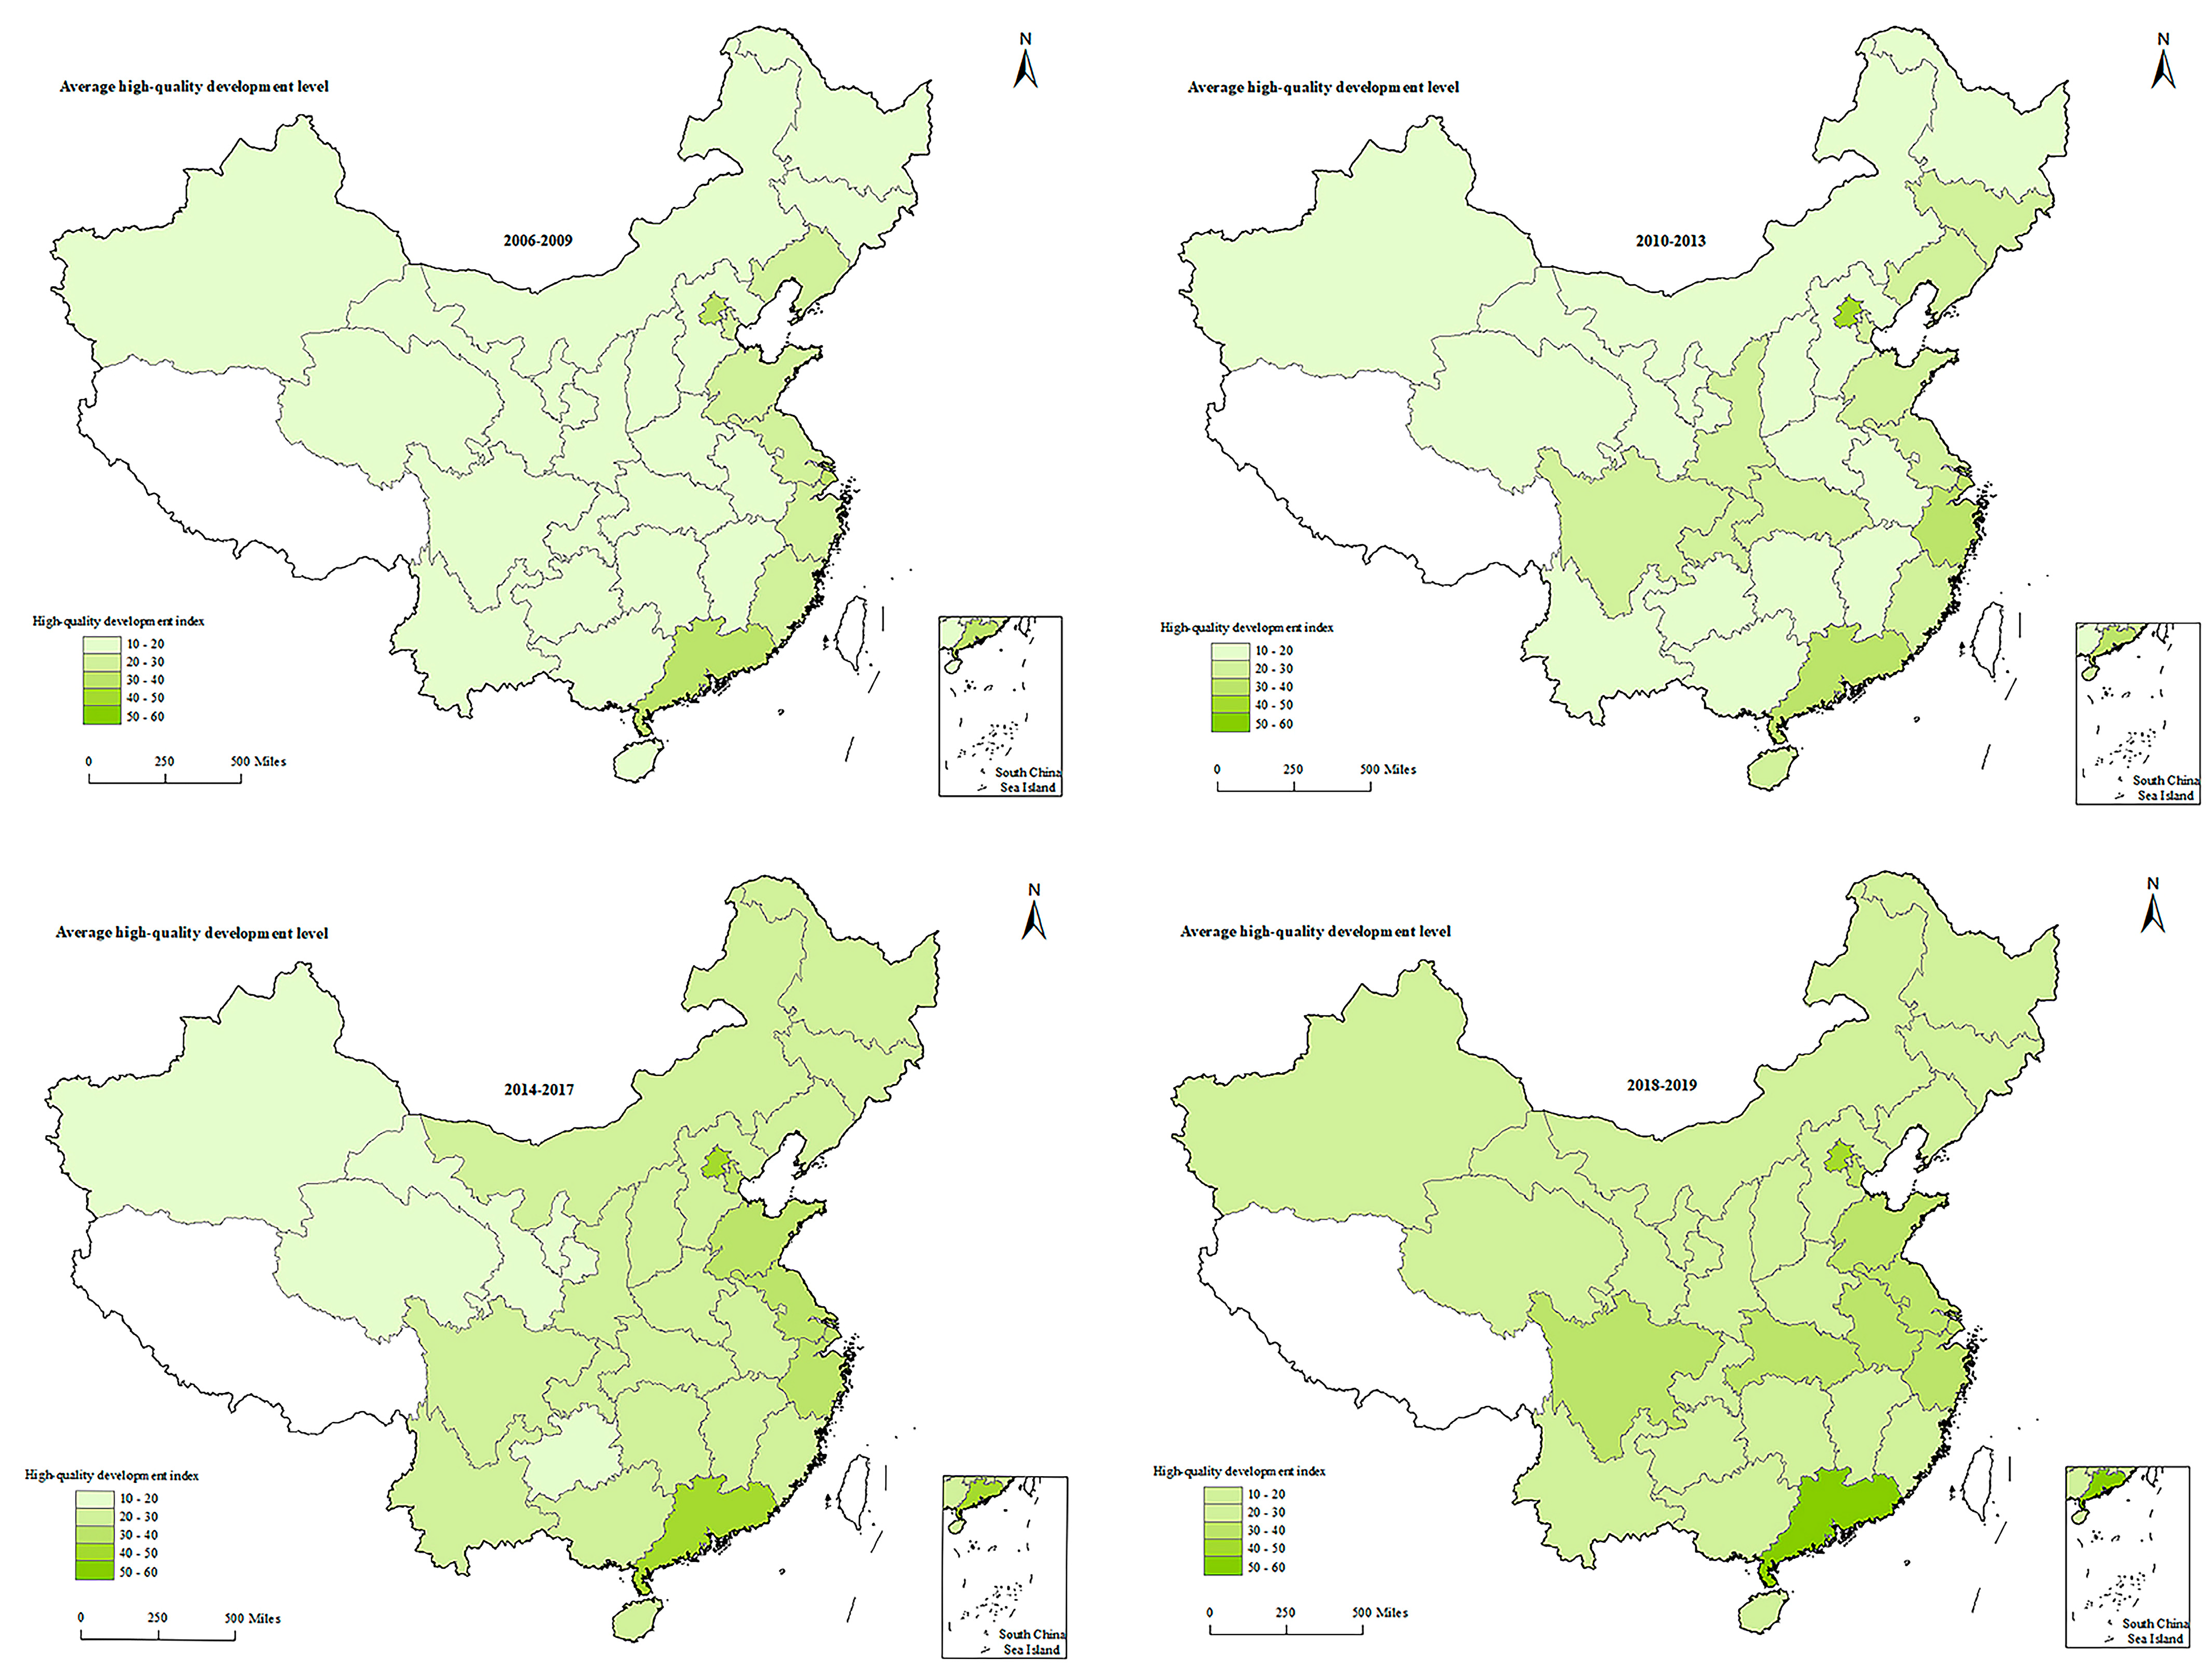
Figure 4.
Temporal changes in different types of HQD levels. Notes: The map shades depict the types of HQD level from 2006 to 2019 (from dark to light, high speed, growth, low speed and steady, respectively); different colors symbolize various time periods (from left to right, 2006–2009 (green), 2010–2013 (yellow), 2014–2017 (blue) and 2018–2019 (red), respectively); and the rectangle’s heights represent the levels of the various types of HQD (from high to low, quadrant Ⅰ (high speed), quadrant Ⅱ (growth), quadrant Ⅲ (low speed) and quadrant Ⅳ (steady)).
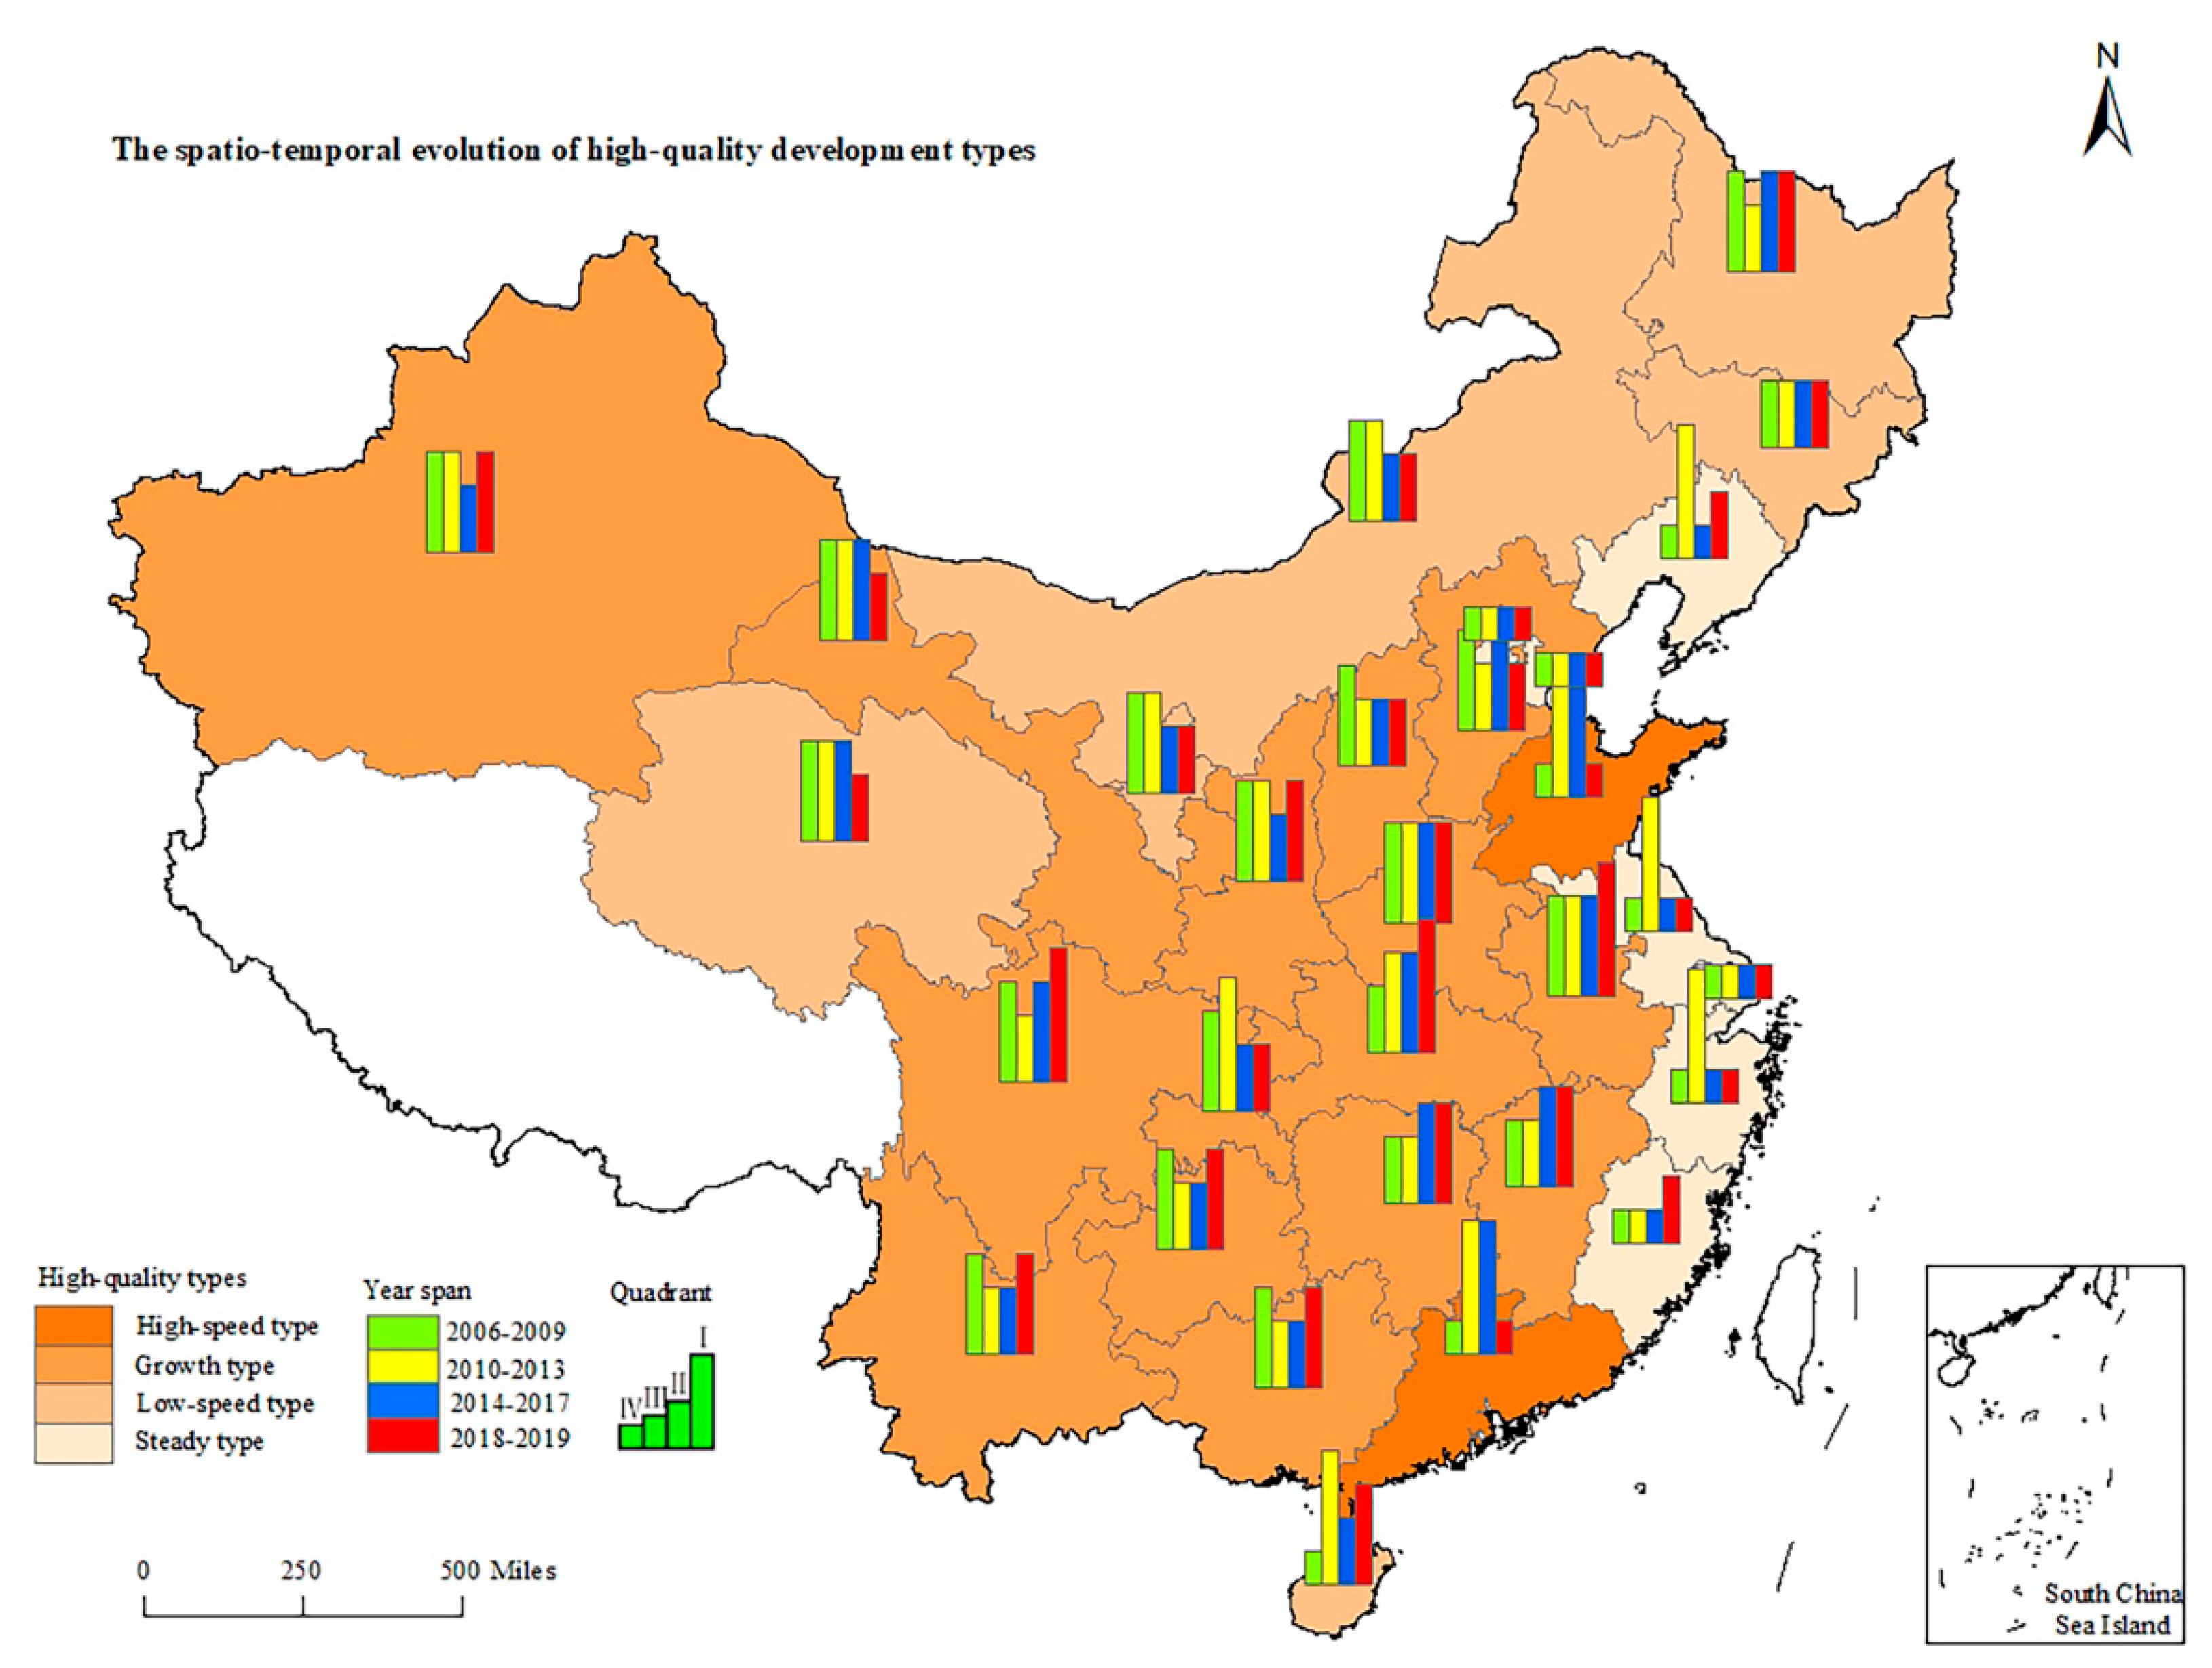
Figure 5.
Regional differences and changes in the level of HQD from 2006 to 2019.
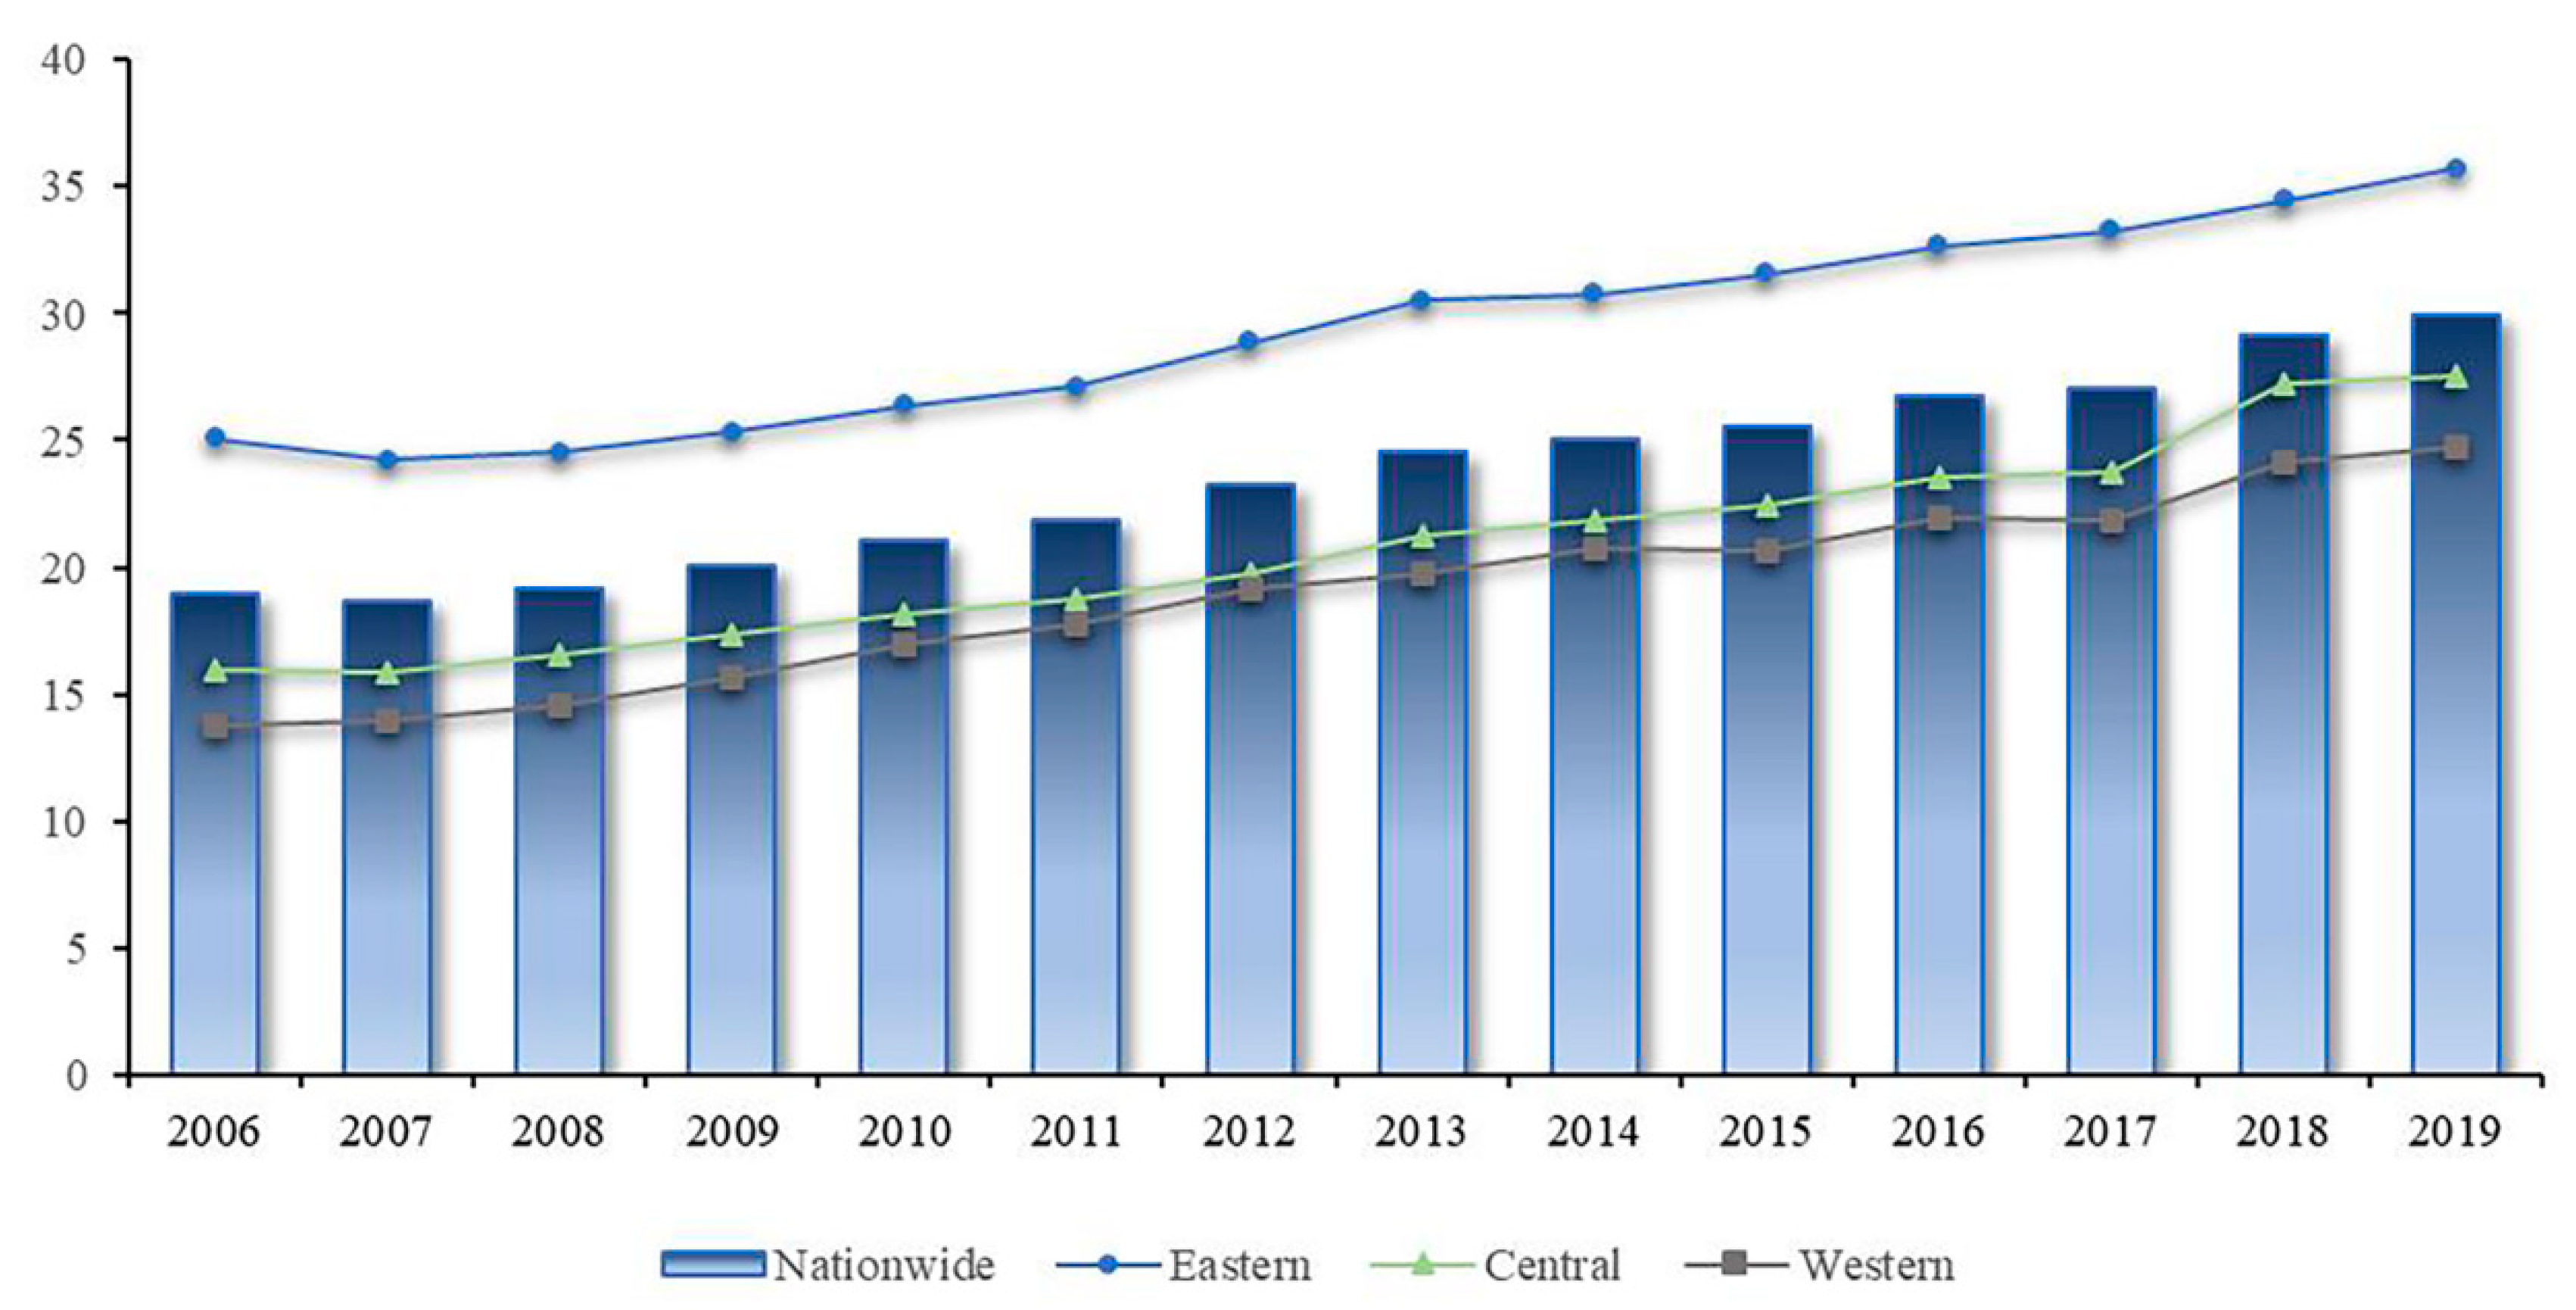
Figure 6.
Parallel trend test of the effect of ETS on HQD.

Table 1.
Description of variables.
| Variables | Definition | Obs | Mean | Std. Dev. | Min | Max |
|---|---|---|---|---|---|---|
| HQD | High-quality development index | 420 | 16.85 | 8.39 | 6.86 | 55.92 |
| lnpop | Logarithmic population | 420 | 8.19 | 0.74 | 6.31 | 9.35 |
| industry | The proportion of added value of the secondary industry in GDP | 420 | 43.56 | 8.41 | 16.2 | 62 |
| energy | energy intensity | 420 | 1.43 | 0.93 | 0.47 | 5.62 |
| lnep | Logarithm of industrial enterprises above designated size | 420 | 8.82 | 1.21 | 5.81 | 11.09 |
Table 2.
Carbon emissions trading scheme and high-quality development index.
| Variables | Model 1 | Model 2 |
|---|---|---|
| Treated × Period | 5.782 *** (7.61) | 1.836 *** (3.38) |
| lnpop | −9.445 *** (−2.63) | |
| industry | −0.0420 (−1.07) | |
| energy | 2.078 *** (3.27) | |
| lnep | 2.319 *** (3.88) | |
| _cons | 16.35 *** (90.64) | 69.22 ** (2.26) |
| Control variable | No | Yes |
| Province fixed effects | No | Yes |
| Year fixed effects | No | Yes |
| Observations | 420 | 420 |
| R-squared | 0.129 | 0.724 |
Notes: t statistics in parentheses. * p < 0.1, ** p < 0.05, *** p < 0.01.
Table 3.
Robustness tests considering lagged effects.
| Variables | Model 1 | Model 2 |
|---|---|---|
| Treated × time | 1.527 *** (2.81) | 1.414 ** (2.53) |
| lnpop | −5.123 (−1.29) | −4.049 (−0.88) |
| industry | −0.0433 (−1.04) | −0.0368 (−0.83) |
| energy | 2.269 *** (3.24) | 2.230 *** (2.82) |
| lnep | 2.098 *** (3.35) | 2.134 *** (3.26) |
| _cons | 34.33 (1.02) | 25.23 (0.66) |
| Control variable | Yes | Yes |
| Province fixed effects | Yes | Yes |
| Year fixed effects | Yes | Yes |
| Observations | 390 | 360 |
| R-squared | 0.737 | 0.729 |
Notes: t statistics in parentheses. * p < 0.1, ** p < 0.05, *** p < 0.01.
Table 4.
Robustness test for exclusion of environmental interference.
| Variables | Model 1 | Model 2 | Model 3 |
|---|---|---|---|
| Treated × time | 2.374 *** (3.64) | 6.563 *** (9.25) | 1.240 ** (2.49) |
| lnpop | −8.958 ** (−2.16) | 7.156 (1.35) | −10.43 *** (−2.95) |
| industry | −0.0121 (−0.25) | −0.104 *** (−2.80) | −0.00254 (−0.08) |
| energy | 1.845 ** (2.23) | 1.399 ** (2.39) | 0.948 * (1.84) |
| lnep | 2.469 *** (3.33) | 1.259 ** (2.16) | 1.270 ** (2.03) |
| _cons | 62.01 * (1.79) | −55.21 (−1.27) | 83.43 *** (2.75) |
| Control variable | Yes | Yes | Yes |
| Province fixed effects | Yes | Yes | Yes |
| Year fixed effects | Yes | Yes | Yes |
| Observations | 280 | 364 | 266 |
| R-squared | 0.663 | 0.800 | 0.827 |
Notes: t statistics in parentheses. * p < 0.1, ** p < 0.05, *** p < 0.01.
Table 5.
Robustness tests for replacement of evaluation variables or models.
| Variables | Model 1 | Model 2 | Model 3 | Model 4 |
|---|---|---|---|---|
| Treated × time | 2.204 *** (4.02) | 0.345 *** (10.86) | 2.606 *** (3.81) | 0.0561 *** (3.40) |
| lnpop | −11.19 *** (−3.05) | 0.639 *** (3.04) | −4.224 (−0.85) | −0.242 ** (−2.22) |
| industry | −0.0427 (−1.09) | 0.00255 (1.11) | −0.264 *** (−4.78) | −0.000960 (−0.80) |
| energy | 2.100 *** (3.32) | 0.00467 (0.13) | 5.892 *** (4.72) | 0.0292 (1.52) |
| lnep | 2.372 *** (3.99) | −0.310 *** (−8.86) | 4.348 *** (5.50) | 0.0610 *** (3.36) |
| _cons | 82.95 *** (2.66) | −1.399 (−0.78) | 13.50 (0.32) | 1.269 (1.36) |
| Control variable | Yes | Yes | Yes | Yes |
| Province fixed effects | Yes | Yes | Yes | Yes |
| Year fixed effects | Yes | Yes | Yes | Yes |
| Observations | 420 | 420 | 295 | 420 |
| R-squared | 0.728 | 0.684 | 0.768 | 0.895 |
Notes: t statistics in parentheses. * p < 0.1, ** p < 0.05, *** p < 0.01.
Table 6.
Geographical location heterogeneity test.
| Variables | Model 1 | Model 2 | Model 3 |
|---|---|---|---|
| Treated × time | 2.209 ** (2.18) | 1.877 *** (3.00) | 0.327 (0.45) |
| lnpop | −10.13 * (−1.68) | 18.61 ** (2.55) | −30.49 *** (−4.57) |
| industry | −0.171 (−1.52) | −0.00584 (−0.19) | −0.166 ** (−2.62) |
| energy | 3.922 (1.40) | 0.333 (0.39) | 0.939 (1.36) |
| lnep | 7.625 *** (5.83) | 4.837 *** (5.81) | 0.827 (0.73) |
| _cons | 35.27 (0.67) | −187.3 *** (−2.99) | 244.8 *** (4.86) |
| Control variable | Yes | Yes | Yes |
| Province fixed effects | Yes | Yes | Yes |
| Year fixed effects | Yes | Yes | Yes |
| Observations | 168 | 126 | 126 |
| R-squared | 0.718 | 0.911 | 0.852 |
Notes: t statistics in parentheses. * p < 0.1, ** p < 0.05, *** p < 0.01.
Disclaimer/Publisher’s Note: The statements, opinions and data contained in all publications are solely those of the individual author(s) and contributor(s) and not of MDPI and/or the editor(s). MDPI and/or the editor(s) disclaim responsibility for any injury to people or property resulting from any ideas, methods, instructions or products referred to in the content. |
© 2023 by the authors. Licensee MDPI, Basel, Switzerland. This article is an open access article distributed under the terms and conditions of the Creative Commons Attribution (CC BY) license (https://creativecommons.org/licenses/by/4.0/).
Share and Cite
MDPI and ACS Style
Cao, R.; Xiao, Y.; Yin, F. Spatio-Temporal Evolution of High-Quality Development and the Impact of Carbon Emissions Trading Schemes. Sustainability 2023, 15, 2900. https://doi.org/10.3390/su15042900
AMA Style
Cao R, Xiao Y, Yin F. Spatio-Temporal Evolution of High-Quality Development and the Impact of Carbon Emissions Trading Schemes. Sustainability. 2023; 15(4):2900. https://doi.org/10.3390/su15042900
Chicago/Turabian StyleCao, Rui, Yanling Xiao, and Fengxue Yin. 2023. "Spatio-Temporal Evolution of High-Quality Development and the Impact of Carbon Emissions Trading Schemes" Sustainability 15, no. 4: 2900. https://doi.org/10.3390/su15042900
Note that from the first issue of 2016, this journal uses article numbers instead of page numbers. See further details here.