


Establishment and Application of a Specialized Physical Examination Indicator System for Urban Waterlogging Risk in China

1
Key Laboratory of Urban Stormwater System and Water Environment, Ministry of Education, Beijing University of Civil Engineering and Architecture, Beijing 100044, China
2
Beijing Energy Conservation & Sustainable Urban and Rural Development Provincial and Ministry Co-Construction Collaboration Innovation Center, Beijing 100044, China
*
Author to whom correspondence should be addressed.
Sustainability 2023, 15(6), 4998; https://doi.org/10.3390/su15064998
Submission received: 19 January 2023
/
Revised: 22 February 2023
/
Accepted: 8 March 2023
/
Published: 11 March 2023
(This article belongs to the Special Issue Disaster Risk Reduction: In Support of the Sendai Framework and Improved Societal Well-Being)
Abstract
:With the rapid development of urbanization in China, urban waterlogging has become a significant problem in constructing the safety of the human environment. As an essential manifestation of the modernization of the urban governance system and capacity, the city physical examination establishes a multi-criteria evaluation system for problem diagnosis, rectification, and improvement. In order to accurately identify the risk of urban waterlogging, the concept of special physical examination of urban waterlogging risk was established, and the evaluation mechanism and indicator definition were improved on the basis of the “four-factor method” of flooding disaster assessment. From the perspective of urban basin flood control capacity, background disaster-bearing conditions, “Major-Minor-Micro” drainage system capacity, crucial locations and personnel protection, and emergency management capacity, twenty-four indicators in five categories were selected. The interaction between multiple factors is considered to establish a special physical examination indicator system as a characteristic evaluation mechanism of waterlogging with the goal of urban safety and resilience. The results of the study could provide theoretical and technical support for the diagnosis of urban waterlogging risk problems and the formulation of prevention and control strategies.
1. Introduction
Urban waterlogging is a prominent problem faced by many countries and regions under the background of global warming and rapid urbanization [1,2,3]. In recent years, rainstorms and waterlogging events occur frequently in many cities around the world, which not only cause huge property losses but also threaten people’s safety. Since July 2021, heavy rainfall has hit many cities around the world, and Europe has suffered the worst floods in 50 years, causing heavy casualties and economic losses. Germany was affected by heavy and persistent rainfall, including the overflow of the Rhine River, which caused flooding in the western and southwestern regions. As a traditionally developed country with complete drainage facilities, Germany has suffered up to 180 casualties and billions of euros in property damage [4]. On 17 July 2021, a severe storm disaster occurred in Henan Province of China, flooding many cities, paralyzing urban traffic, and flooding into the subway space, causing severe casualties [5,6]. According to the statistics of China Flood and Drought Disaster Bulletin, from 2016 to 2020, waterlogging disasters occurred in more than 180 Chinese cities every year, with an average impact of more than 60 million people. Urban waterlogging is a type of urban flooding that is defined as a phenomenon in which heavy or continuous rainfall within a town exceeds the capacity of the town’s stormwater facilities, resulting in the accumulation of water on the surface of the town [7], also known as “urban flooding and pluvial floods (flash floods and surface water)”. In the context of increasingly serious global flood disasters, scientific and reasonable urban flood disaster risk assessment is helpful to improve urban disaster prevention and mitigation capacity and reduce flood losses.
The urban waterlogging prevention and control plan is related to the quality of life and work efficiency of urban residents, which is the key object under the goal of “safety resilience”. Since 2018, the Ministry of Housing and Urban-Rural Development of China has proposed the “urban physical examination” as a specific practice to implement high-quality urban development. In April 2021, The General Office of the State Council of China issued the “Implementation Opinions of the General Office of the State Council on Strengthening Urban Waterlogging Control”, requiring that urban waterlogging under rainfall conditions be eliminated within the scope of prevention and control by 2035.
Accurate identification and assessment of risk factors for waterlogging is an essential prerequisite for the efficient development of prevention and control plans. When assessing the risk of urban waterlogging, the assessment system should comprehensively involve social, economic, natural, ecological [8,9], and other factors. At present, scholars and research institutions worldwide have conducted multi-level assessment studies on the risk of flooding in cities. According to the evaluation method of disaster science, the typical “three-factor” evaluation method—hazard-causing factor, disaster-preventing environment, and disaster-bearing body—is a vital evaluation dimension to explain the risk of urban flooding. On the urban scale, the risk assessment index framework is mainly based on “Hazard—Exposure—Vulnerability” [10,11,12,13]. Rainfall is selected as the hazard assessment indicator, including the average number of days of rainfall, and rainfall amount [14]. The influence of groundwater level is also considered in some studies [15]. The population density [16], road network density [5,17], per capita gross product [18], and patch density [19] were selected as indicators of vulnerability evaluation. Using hierarchical analysis to assess the application of the study area, the main consensus on the definition of flood risk is the superposition of the three factors of “hazard, exposure, and vulnerability”, and the weight of each indicator is analyzed according to the assessment model to calculate the total risk score [20,21]. In the current study, the indicators of “flood resilience” were added to the above “three factors” [22] (disaster prevention and adaptive capacity) to express the resistance of the drainage system and the ability of the city to recover from disaster losses [23,24], forming a “four-factor” evaluation method that reflects the flood resilience of the city. They believe that the risk of flooding results from the combined effect of “the hazards of the causative factor, the vulnerability of the disaster-preventing environment, the exposure of the disaster-bearing body, and the disaster prevention and mitigation capacity”. On the scale of neighborhoods and facilities, some scholars have also proposed corresponding flood risk assessment methods for key urban flood protection areas or individual facilities, such as subway flood risk [15], road flood risk [25], and building flood risk [26], to establish a targeted indicators system and propose corresponding disaster thresholds and management countermeasures. Some studies have also added the simulation evaluation of property loss to analyze the threat of urban flooding risk to the urban economy [27,28]. However, the existing indicators of waterlogging risk assessment have the limitation of unclear and overly indirect instruction inclusion relationships. They need to be rated with the help of subjective methods in the assessment stage [29]. The previous indicator system can only vaguely evaluate the comprehensive waterlogging risk level of a city, but cannot clearly distinguish the impact of urban natural and man-made construction factors. It also lacks the quantifiable ability of natural indicators, facilities indicators, and control ability indicators. Because the selection of indicators only considers the characteristics of the study area, it cannot be used as a universal guide for urban waterlogging risk assessment. For the existing evaluation indicators, there is a mutual inclusion relationship between indicators [30]. There are both natural and man-made risk factors [31,32]. The evaluation is subjective, which makes it difficult to put forward direct engineering suggestions. Indirect indicators need to be obtained from a large amount of data, and a numerical analysis model should be established to analyze their correlation and importance [14,33].
On the basis of the “four factors” assessment method of waterlogging risk assessment, we deeply refined and sorted out the hierarchical relationship between the existing indicators, corresponding to the causes of waterlogging, further refined, and added innovative indicators, and proposed the “special physical examination of urban waterlogging risk”. The risk of waterlogging is explained from the perspective of urban operation, including the risk of waterlogging caused by river flood at the basin scale, the risk of waterlogging caused by the defects of land use planning and drainage and waterlogging prevention facilities, the risk of disaster in key areas and personnel, and the emergency management level in the face of waterlogging risk, which directly reflects the weakness of urban waterlogging risk. The establishment of an evaluation index system and scoring mechanism provides theoretical guidance for urban physical examination and has important practical significance for improving the precision prevention and control ability of urban waterlogging.
2. Methodology
The methodology is an innovative combination of techniques and uses indicators to identify waterlogging-prone areas. The overall application process of the specialized physical examination for urban waterlogging risk, including city preliminary research, indicator selection, scoring, and finally obtaining the city examination report, is briefly described in Figure 1.
2.1. Analysis of Causes of Urban Waterlogging
The cause of urban waterlogging has multiple factors, including the increase in short-term heavy rainfall caused by climate change, urban heat islands, the rain island effect, and other factors. The natural terrain slope and land use are the main factors of waterlogging risk on large and small scales [34,35]. At the same time, social and human factors are also important factors causing urban waterlogging, including poor urban planning and control, imperfect technical systems, inadequate emergency measures, and inadequate management resulting in unreasonable urban layout, vertical damage, destruction of storage space, increase in impervious area, and destruction of river systems, along with imperfect internal flood control systems and low resilience to flooding. Complex relationships exist between urban waterlogging and driving factors at various analysis scales [36]. This paper examines the city at a large scale (over 5 km2). When waterlogging occurs, it may be the result of the superposition of multiple factors, and the specialized physical examination index closely follows the causes of waterlogging, as well as the risk factors directly caused by waterlogging.
2.2. The Selection of Specialized Physical Examination Items
2.2.1. River Basin Flood Control Capacity
The occurrence and risk evolution of urban waterlogging are interlinked and have multiple impacts. Urban development along rivers has resulted in a high risk of waterlogging, and the risk rises with increasing development [37,38]. We set up an examination of the flood control capacity of urban watersheds to evaluate whether there is a risk of “waterlogging caused by fluvial flooding”, including two indicators of flood control engineering capacity and the connection effect of flood control and drainage systems, and analyze the overflow of river flood and the jacking possibility of drainage systems [39,40].
2.2.2. Urban Background Disaster-Bearing Conditions
The Urban background disaster-bearing conditions are selected from two indicators, namely infiltration and storage requirements and vertical planning effect, which are the primary breeding environments for waterlogging [36,41]. The urban background conditions vary in different cities with different characteristics so the potential flooding in the urban hydrological cycle could be found. In addition, drainage and flood prevention facilities could be built and improve urban planning according to the local conditions.
2.2.3. “Major-Minor-Micro” Drainage System Capacity
The urban waterlogging control system contains several subsystems, which can be summarized as “1 + 3 + 1” [42]. The two “1”s refer to the water conservancy and flood control system at the basin scale and the emergency response system including early warning and prediction, emergency rescue, and disaster relief, respectively. The “3” refers to the “Major-Minor-Micro” drainage system (i.e., major drainage system, drainage pipe system, and source emission reduction system). The construction and operation of drainage systems need to be comprehensively screened in the specialized physical examination of urban waterlogging risk. Their good operation capacity can improve the waterlogging resilience in the region [43,44].
2.2.4. Crucial Locations and Personnel Protection
The urban waterlogging disaster-bearing bodies include urban residents and various properties of social development and disaster mitigation engineering facilities in public service facilities. It is important to establish exposure risk assessment indicators for property loss and population density in residential, commercial, industrial, and office areas. Good waterlogging resilience in crucial regions can improve the quality of the human living environment and work productivity.
2.2.5. Emergency Management Capacity
The emergency management system for urban waterlogging risk includes the policy system [45] and technical system [46]. The special physical examination of flooding risk selects a more assessable technical system, among which the flooding joint drainage and joint adjustment technology and the waterlogging early warning technology correspond to the response-ability in disaster prediction ability, respectively. The improved technical system can reduce the loss caused by waterlogging risk and improve the waterlogging prevention rate.
2.3. Evaluation Mechanism Establishment Approach
2.3.1. Indicator System Establishment Approach
The specialized physical examination of urban waterlogging risk has multiple connotations. In terms of purpose, the goal of the specialized physical examination is to focus on the urban safety toughness under the waterlogging risk problem, accurately identify the constructive defects that lead to waterlogging, and evaluate the “methodology”. This examination is a part of the urban physical examination work. The setting of the index system establishes five physical examination items in terms of the watershed flood control capacity, background conditions, drainage system capacity, key location and personnel protection, and emergency management capability. This indicator system is a simple and improved “four-factor” evaluation method.
Explaining evaluation standards, layout, and facilities avoids the limitation of mixed inclusion relations between levels and indirect indicator expression and accurately identifies the problem of waterlogging in urban construction. From the perspective of applicability, the set indicator system closely focuses on the planning and construction problems caused by urban social and human factors and urban waterlogging risk factors caused by natural background conditions. The evaluation results can directly provide recommendations for engineering and non-engineering transformation and maintenance. The specialized physical examination of urban waterlogging risk is a “specialized hospital” for urban waterlogging problems, which is a working mechanism of the whole process of screening, diagnosis, and finally putting forward prevention and control plans for waterlogging problems.
2.3.2. Weight Scoring Approach
To determine the score of each indicator in the assessment system, each indicator’s weight must be determined first. The Delphi process and the analytic hierarchy process (AHP) were adopted to design the weights of the indicators for the specialized physical examination system of urban waterlogging risk. When using AHP for multi-level problem decision-making, artificial subjective judgment is required to determine the relative importance of the elements at each level. In order to ensure the scientific authority of the evaluation indicators and the objective rationality of the evaluation results, this study selected 10 high-level experts from universities, planning and design companies, and scientific research institutes with sufficient capacity, willingness, and time to participate. Due to experts’ full understanding of the urban waterlogging risk based on professional judgment scores, the research results are of reference value and persuasive. Then, after the weight calculation and consistency test, we calculate the average value of the weight to get the final score.
In this paper, for the scoring criteria of the judgment matrix, we adopted the 1–9 scale method, and the numbers between 1 and 9 represent the relative importance of different elements at various levels. represents the importance of factor i relative to element j, and = 1 indicates that element i is equally essential relative to element j.
where is the judgment matrix; the relative importance of factor i to factor j, which ranges from 1 to 9; the weights (w) of the factors can be calculated from Equation (2)
where =.
The value of the consistency ratio (CR) can be calculated by Equation (3)
where CI = ( − n)/(n − 1) and is the largest eigenvalue of the judgment matrix, which can be calculated from Equation (4). RI is the average random consistency indicator.
3. Results
3.1. Establishment of the Indicator System
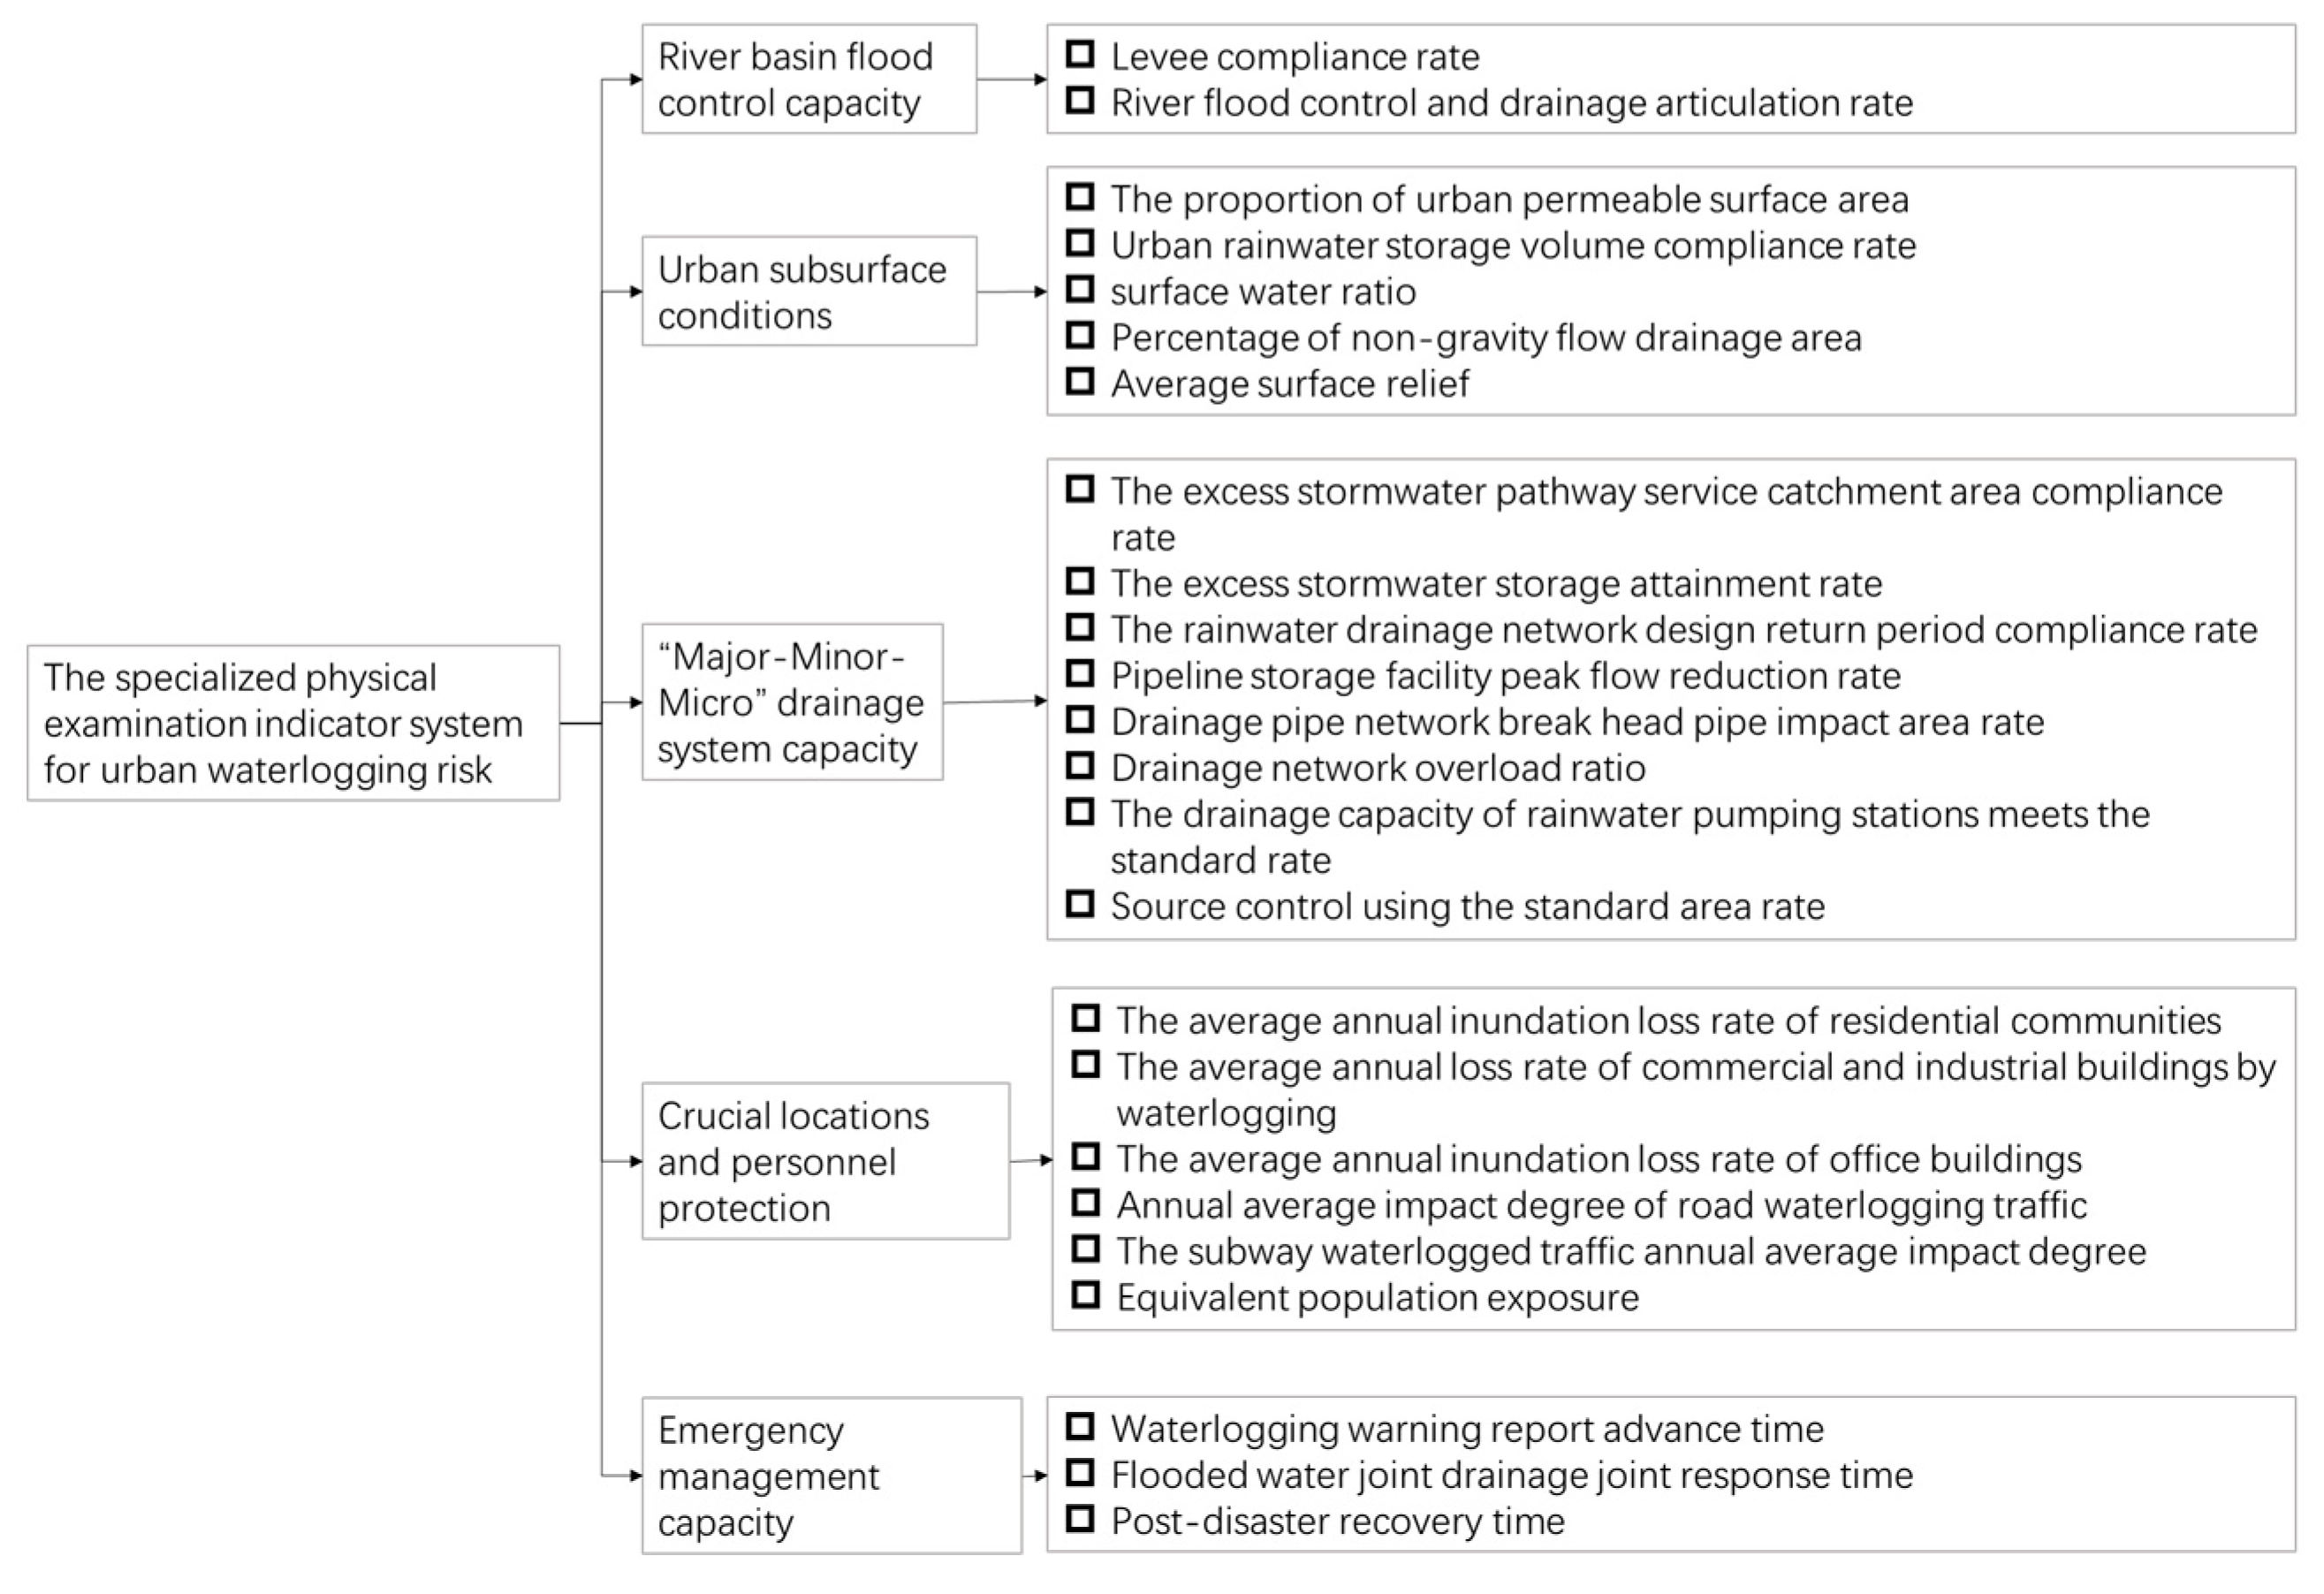
The assessment indicators are selected from the subsurface conditions of each city, the status of water conservancy and municipal engineering, and other elements to comprehensively assess whether the city’s construction meets the requirements of waterlogging prevention and control standards. Figure 2 represents the formation process of urban waterlogging disasters. The green process line is the rainwater formation runoff to effective collection or discharge. The red process line indicates the inundation due to river flooding and the inability to effectively control the rainwater runoff that exceeds the drainage pipe design return period standard, resulting in flooding parts of the city and causing economic losses and casualties. In contrast, the excellent layout and application management of facilities or natural conditions expressed in the green box can reduce the risk of inundation disaster occurrence. According to the above methods and principles, a specialized physical examination indicators system for urban waterlogging risk is constructed, as shown in Figure 3 and Table 1, Table 2, Table 3, Table 4 and Table 5.
3.2. Indicator Scores and Scoring Standard
After calculating the weight of each indicator by the hierarchical analysis method, the final evaluation system was determined after several iterations of manual discussion. According to the weight of each assessment indicator, the scores of the specialized physical examination of urban waterlogging risk and the scoring criteria were determined as shown in Table 6.
3.3. The Evaluation Method System
Facing the increasingly complex urban system and changing information flow, the comprehensive application of new technologies and new methods should be noted in urban physical examination evaluations, and multidimensional, all-factor, and verifiable technical methods should be adopted to ensure scientific and reasonable assessment conclusions. The specific application methods for each indicator are shown in Table 7.
4. Discussion
The special physical examination of urban waterlogging risk should involve paying attention to the correlation between indicators. For example, the evaluation of large drainage system indicators is not the “hard technology” of traditional gray-green facilities but makes full use of natural background conditions. It forms surface overflow channels, natural ditches, and ponds through vertical control and belongs to the overall planning and construction project.
To evaluate these indicators, it is necessary to first identify the risk of excessive rainwater flooding in the region, determine the rationality of vertical planning, determine the planning of drainage channels and rainwater storage here, and then evaluate whether the catchment area, drainage capacity, and other indicators services meet the regional waterlogging requirements. Relevance correlation indicators are progressive or mutually included in each other. Cutting the whole and taking a single one will reduce the evaluability of the indicators.
The specialized physical examination of urban waterlogging risk should consider the differentiation of indicators. The waterlogging risk scenarios in different cities are different, and the evaluation indicators should be focused on specific circumstances. For cities along rivers and rivers with the risk of flooding, the indicators related to rivers and joint drainage should be focused on. For cities in mountainous areas with large changes in surface elevation and slope, the waterlogging indicators of low-lying key areas should be emphasized. For plain cities with intensive traffic, the flooding of traffic facilities should be focused on. For micro-level city scales such as streets and communities, it is necessary to conduct empirical evidence-based and differentiated assessment analysis.
5. Conclusions
Based on the analysis of the causes of urban waterlogging, we set twenty-four evaluation indicators in five categories based on the “four elements” of “hazard, vulnerability, exposure, and resilience” in urban waterlogging disasters, plus risk identification indicators from different perspectives. The specific conclusions are as follows:
- (1)
- The specialized physical examination of urban waterlogging risk is an essential means to express the degree of flooding risk under the goal of urban safety and resilience. At the same time, it reflects the defects in urban engineering construction and planning layout. The indicators system contains the screening and target guidance for waterlogging caused by the watershed, background disaster-bearing conditions, drainage system capacity, key areas, personnel protection, and emergency management capacity. This system explains the urban waterlogging risk from multiple perspectives and provides a reference for the waterlogging prevention and control plans for various departments.
- (2)
- The selection of indicators for the specialized physical examination of urban waterlogging risk involves both universality and particularity. The required inspection indicators are mainly aimed at the disaster assessment of urban facilities that can directly define the existence or universal inclusion of risks, while the optional inspection indicators include the assessment of city-specific facilities, background characteristics, or management modes so that all types of cities are evaluable.
- (3)
- The urban waterlogging risk indicator system includes direct and indirect indicators. The direct indicators can be directly obtained from accurate evaluation values through monitoring, modeling, historical data analysis, and other ways. The indirect indicators need to be divided into multiple supporting items, and the qualitative analysis of such indicators can be obtained by using multiple methods of superimposing.
- (4)
- The indicators system of the special physical examination of urban waterlogging risk includes two types of indicators, positive and negative. The higher the evaluation score of positive indicators, the better the resilience of urban waterlogging control, while the higher the absolute value of the evaluation score of negative indicators, the more serious the waterlogging risk problem in such physical examination items. The final score of the special medical examination is obtained by combining the two indicators.
The establishment of the specialized physical examination of urban waterlogging risk provides theoretical and technical support for the accurate identification of urban waterlogging risk problems and the formulation of efficient waterlogging prevention and control plans. The study can provide policy recommendations for the development of urban waterlogging prevention and control plans under the “safe and resilient” guideline of China’s urban physical examination to improve the quality of urban habitats. In the future, relevant characteristic evaluation indicators should be added and evaluation criteria should be optimized according to local conditions in combination with factors such as urban economic development level and urban development orientation.
Author Contributions
Conceptualization, J.L. and H.Z.; Methodology, J.L. and H.Z.; Supervision, W.W.; Writing—original draft, H.Z.; Writing—review and editing, J.L. and X.Z. All authors have read and agreed to the published version of the manuscript.
Funding
National Key R&D Program of China (Grant No. 2022YFC3800500).
Institutional Review Board Statement
Not applicable.
Informed Consent Statement
Not applicable.
Data Availability Statement
No new data were created or analyzed in this study. Data sharing is not applicable to this article.
Conflicts of Interest
The authors do not have any commercial or associative interests that represent conflicts of interest in connection with the submitted work.
References
- Wu, M.; Wu, Z.; Ge, W.; Wang, H.; Shen, Y.; Jiang, M. Identification of sensitivity indicators of urban rainstorm flood disasters: A case study in China. J. Hydrol. 2021, 599, 126393. [Google Scholar] [CrossRef]
- Kc, S.; Shrestha, S.; Ninsawat, S.; Chonwattana, S. Predicting flood events in Kathmandu Metropolitan City under climate change and urbanisation. J. Environ. Manag. 2021, 281, 111894. [Google Scholar] [CrossRef]
- Vargas, N.; Magaña, V. Climatic risk in the Mexico city metropolitan area due to urbanization. Urban Clim. 2020, 33, 100644. [Google Scholar] [CrossRef]
- Bosseler, B.; Salomon, M.; Schlüter, M.; Rubinato, M. Living with Urban Flooding: A Continuous Learning Process for Local Municipalities and Lessons Learnt from the 2021 Events in Germany. Water 2021, 13, 2769. [Google Scholar] [CrossRef]
- Zheng, Q.; Shen, S.-L.; Zhou, A.; Lyu, H.-M. Inundation risk assessment based on G-DEMATEL-AHP and its application to Zhengzhou flooding disaster. Sustain. Cities Soc. 2022, 86, 104138. [Google Scholar] [CrossRef]
- Dong, B.; Xia, J.; Li, Q.; Zhou, M. Risk assessment for people and vehicles in an extreme urban flood: Case study of the “7.20” flood event in Zhengzhou, China. Int. J. Disaster Risk Reduct. 2022, 80, 103205. [Google Scholar] [CrossRef]
- GB 51222-2017; Technical Code for Urban Flooding Prevention and Control. Ministry of Housing and Urban-Rural Construction of the People’s Republic of China: Beijing, China, 2017.
- Chang, H.; Pallathadka, A.; Sauer, J.; Grimm, N.B.; Zimmerman, R.; Cheng, C.; Iwaniec, D.M.; Kim, Y.; Lloyd, R.; McPhearson, T.; et al. Assessment of urban flood vulnerability using the social-ecological-technological systems framework in six US cities. Sustain. Cities Soc. 2021, 68, 102786. [Google Scholar] [CrossRef]
- Brouwer, R.; van Ek, R. Integrated ecological, economic and social impact assessment of alternative flood control policies in the Netherlands. Ecol. Econ. 2004, 50, 1–21. [Google Scholar] [CrossRef]
- Kittipongvises, S.; Phetrak, A.; Rattanapun, P.; Brundiers, K.; Buizer, J.L.; Melnick, R. AHP-GIS analysis for flood hazard assessment of the communities nearby the world heritage site on Ayutthaya Island, Thailand. Int. J. Disaster Risk Reduct. 2020, 48, 101612. [Google Scholar] [CrossRef]
- Bralewska, K. Publicly Available Data-Based Flood Risk Assessment Methodology: A Case Study for a Floodplain in Poland. Water 2021, 14, 61. [Google Scholar] [CrossRef]
- Ekmekcioğlu, O.; Koc, K.; Özger, M. Stakeholder Perceptions in Flood Risk Assessment: A Hybrid Fuzzy AHP-TOPSIS Approach for Istanbul, Turkey. Int. J. Disaster Risk Reduct. 2021, 60, 102327. [Google Scholar] [CrossRef]
- Peng, J.; Zhang, J. Urban flooding risk assessment based on GIS- game theory combination weight: A case study of Zhengzhou City. Int. J. Disaster Risk Reduct. 2022, 77, 103080. [Google Scholar] [CrossRef]
- Wu, J.; Chen, X.; Lu, J. Assessment of long and short-term flood risk using the multi-criteria analysis model with the AHP-Entropy method in Poyang Lake basin. Int. J. Disaster Risk Reduct. 2022, 75, 102968. [Google Scholar] [CrossRef]
- Lyu, H.-M.; Shen, S.-L.; Zhou, A.; Yang, J. Perspectives for flood risk assessment and management for mega-city metro system. Tunn. Undergr. Space Technol. 2019, 84, 31–44. [Google Scholar] [CrossRef]
- Waghwala, R.K.; Agnihotri, P.G. Flood risk assessment and resilience strategies for flood risk management: A case study of Surat City. Int. J. Disaster Risk Reduct. 2019, 40, 101155. [Google Scholar] [CrossRef]
- Quesada-Román, A. Flood risk index development at the municipal level in Costa Rica: A methodological framework. Environ. Sci. Policy 2022, 133, 98–106. [Google Scholar] [CrossRef]
- Liao, X.; Xu, W.; Zhang, J.; Qiao, Y.; Meng, C. Analysis of affected population vulnerability to rainstorms and its induced floods at county level: A case study of Zhejiang Province, China. Int. J. Disaster Risk Reduct. 2022, 75, 102976. [Google Scholar] [CrossRef]
- Li, C.; Liu, M.; Hu, Y.; Wang, H.; Zhou, R.; Wu, W.; Wang, Y. Spatial distribution patterns and potential exposure risks of urban floods in Chinese megacities. J. Hydrol. 2022, 610, 127838. [Google Scholar] [CrossRef]
- Lyu, H.-M.; Sun, W.-J.; Shen, S.-L.; Arulrajah, A. Flood risk assessment in metro systems of mega-cities using a GIS-based modeling approach. Sci. Total Environ. 2018, 626, 1012–1025. [Google Scholar] [CrossRef] [PubMed]
- Lin, T.; Liu, X.; Song, J.; Zhang, G.; Jia, Y.; Tu, Z.; Zheng, Z.; Liu, C. Urban waterlogging risk assessment based on internet open data: A case study in China. Habitat Int. 2018, 71, 88–96. [Google Scholar] [CrossRef]
- Wang, L.; Cui, S.; Li, Y.; Huang, H.; Manandhar, B.; Nitivattananon, V.; Fang, X.; Huang, W. A review of the flood management: From flood control to flood resilience. Heliyon 2022, 8, e11763. [Google Scholar] [CrossRef]
- Bertilsson, L.; Wiklund, K.; de Moura Tebaldi, I.; Rezende, O.M.; Veról, A.P.; Miguez, M.G. Urban flood resilience—A multi-criteria index to integrate flood resilience into urban planning. J. Hydrol. 2019, 573, 970–982. [Google Scholar] [CrossRef]
- Disse, M.; Johnson, T.G.; Leandro, J.; Hartmann, T. Exploring the relation between flood risk management and flood resilience. Water Secur. 2020, 9, 100059. [Google Scholar] [CrossRef]
- Qi, X.; Zhang, Z. Assessing the urban road waterlogging risk to propose relative mitigation measures. Sci. Total Environ. 2022, 849, 157691. [Google Scholar] [CrossRef]
- Nofal, O.M.; Lindt, J.; Do, T.Q. Multi-variate and Single-variable Flood Fragility and Loss Approaches for Buildings. Reliab. Eng. Syst. Saf. 2020, 202, 106971. [Google Scholar] [CrossRef]
- Sušnik, J.; Strehl, C.; Postmes, L.A.; Vamvakeridou-Lyroudia, L.S.; Savić, D.A.; Kapelan, Z.; Mälzer, H.J. Assessment of the Effectiveness of a Risk-reduction Measure on Pluvial Flooding and Economic Loss in Eindhoven, the Netherlands. Procedia Eng. 2014, 70, 1619–1628. [Google Scholar] [CrossRef] [Green Version]
- Wang, H.; Zhou, J.; Tang, Y.; Liu, Z.; Kang, A.; Chen, B. Flood economic assessment of structural measure based on integrated flood risk management: A case study in Beijing. J. Environ. Manag. 2021, 280, 111701. [Google Scholar] [CrossRef] [PubMed]
- Esmaiel, A.; Abdrabo, K.I.; Saber, M.; Sliuzas, R.V.; Atun, F.; Kantoush, S.A.; Sumi, T. Integration of flood risk assessment and spatial planning for disaster management in Egypt. Prog. Disaster Sci. 2022, 15, 100245. [Google Scholar] [CrossRef]
- Zhang, Q.; Wu, Z.; Guo, G.; Zhang, H.; Tarolli, P. Explicit the urban waterlogging spatial variation and its driving factors: The stepwise cluster analysis model and hierarchical partitioning analysis approach. Sci. Total Environ. 2021, 763, 143041. [Google Scholar] [CrossRef]
- Berndtsson, R.; Becker, P.; Persson, A.; Aspegren, H.; Haghighatafshar, S.; Jönsson, K.; Larsson, R.; Mobini, S.; Mottaghi, M.; Nilsson, J.; et al. Drivers of changing urban flood risk: A framework for action. J. Environ. Manag. 2019, 240, 47–56. [Google Scholar] [CrossRef] [PubMed]
- Abass, K.; Dumedah, G.; Frempong, F.; Muntaka, A.S.; Appiah, D.O.; Garsonu, E.K.; Gyasi, R.M. Rising incidence and risks of floods in urban Ghana: Is climate change to blame? Cities 2022, 121, 103495. [Google Scholar] [CrossRef]
- Li, G.; Wu, X.; Han, J.-C.; Li, B.; Huang, Y.; Wang, Y. Flood risk assessment by using an interpretative structural modeling based Bayesian network approach (ISM-BN): An urban-level analysis of Shenzhen, China. J. Environ. Manag. 2023, 329, 117040. [Google Scholar] [CrossRef]
- Zeng, Z.; Wang, D. Observations of heavy short-term rainfall hotspots associated with warm-sector episodes over coastal South China. Atmos. Res. 2022, 276, 106273. [Google Scholar] [CrossRef]
- Lei, X.; Chen, W.; Panahi, M.; Falah, F.; Rahmati, O.; Uuemaa, E.; Kalantari, Z.; Ferreira, C.S.S.; Rezaie, F.; Tiefenbacher, J.P.; et al. Urban flood modeling using deep-learning approaches in Seoul, South Korea. J. Hydrol. 2021, 601, 126684. [Google Scholar] [CrossRef]
- Wang, Y.; Li, C.; Liu, M.; Cui, Q.; Wang, H.; Lv, J.; Li, B.; Xiong, Z.; Hu, Y. Spatial characteristics and driving factors of urban flooding in Chinese megacities. J. Hydrol. 2022, 613, 128464. [Google Scholar] [CrossRef]
- Chan, F.K.S.; Yang, L.E.; Scheffran, J.; Mitchell, G.; Adekola, O.; Griffiths, J.; Chen, Y.; Li, G.; Lu, X.; Qi, Y.; et al. Urban flood risks and emerging challenges in a Chinese delta: The case of the Pearl River Delta. Environ. Sci. Policy 2021, 122, 101–115. [Google Scholar] [CrossRef]
- Tierolf, L.; de Moel, H.; van Vliet, J. Modeling urban development and its exposure to river flood risk in Southeast Asia. Comput. Environ. Urban Syst. 2021, 87, 101620. [Google Scholar] [CrossRef]
- Shih, S.-S.; Kuo, P.-H.; Lai, J.-S. A nonstructural flood prevention measure for mitigating urban inundation impacts along with river flooding effects. J. Environ. Manag. 2019, 251, 109553. [Google Scholar] [CrossRef]
- Qiang, Y.; Zhang, L.; He, J.; Xiao, T.; Huang, H.; Wang, H. Urban flood analysis for Pearl River Delta cities using an equivalent drainage method upon combined rainfall-high tide-storm surge events. J. Hydrol. 2021, 597, 126293. [Google Scholar] [CrossRef]
- Hu, C.; Xia, J.; She, D.; Song, Z.; Zhang, Y.; Hong, S. A new urban hydrological model considering various land covers for flood simulation. J. Hydrol. 2021, 603, 126833. [Google Scholar] [CrossRef]
- Li, J. Rational Understanding of Sponge Cities, Scientific Management of Urban Flooding. Availabe online: https://www.cuwa.org.cn/shuiwuyuqing6/4776.html (accessed on 19 January 2022). (In Chinese).
- McClymont, K.; Fernandes Cunha, D.G.; Maidment, C.; Ashagre, B.; Vasconcelos, A.F.; Batalini de Macedo, M.; Nóbrega dos Santos, M.F.; Gomes Júnior, M.N.; Mendiondo, E.M.; Barbassa, A.P.; et al. Towards urban resilience through Sustainable Drainage Systems: A multi-objective optimisation problem. J. Environ. Manag. 2020, 275, 111173. [Google Scholar] [CrossRef] [PubMed]
- Dong, X.; Guo, H.; Zeng, S. Enhancing future resilience in urban drainage system: Green versus grey infrastructure. Water Res. 2017, 124, 280–289. [Google Scholar] [CrossRef] [PubMed]
- Sayers, P.; Gersonius, B.; den Heijer, F.; Klerk, W.J.; Fröhle, P.; Jordan, P.; Ciocan, U.R.; Rijke, J.; Vonk, B.; Ashley, R. Towards adaptive asset management in flood risk management: A policy framework. Water Secur. 2021, 12, 100085. [Google Scholar] [CrossRef]
- Henriksen, H.J.; Roberts, M.J.; van der Keur, P.; Harjanne, A.; Egilson, D.; Alfonso, L. Participatory early warning and monitoring systems: A Nordic framework for web-based flood risk management. Int. J. Disaster Risk Reduct. 2018, 31, 1295–1306. [Google Scholar] [CrossRef]
Figure 1.
Method framework for special medical examination of urban waterlogging risk research.
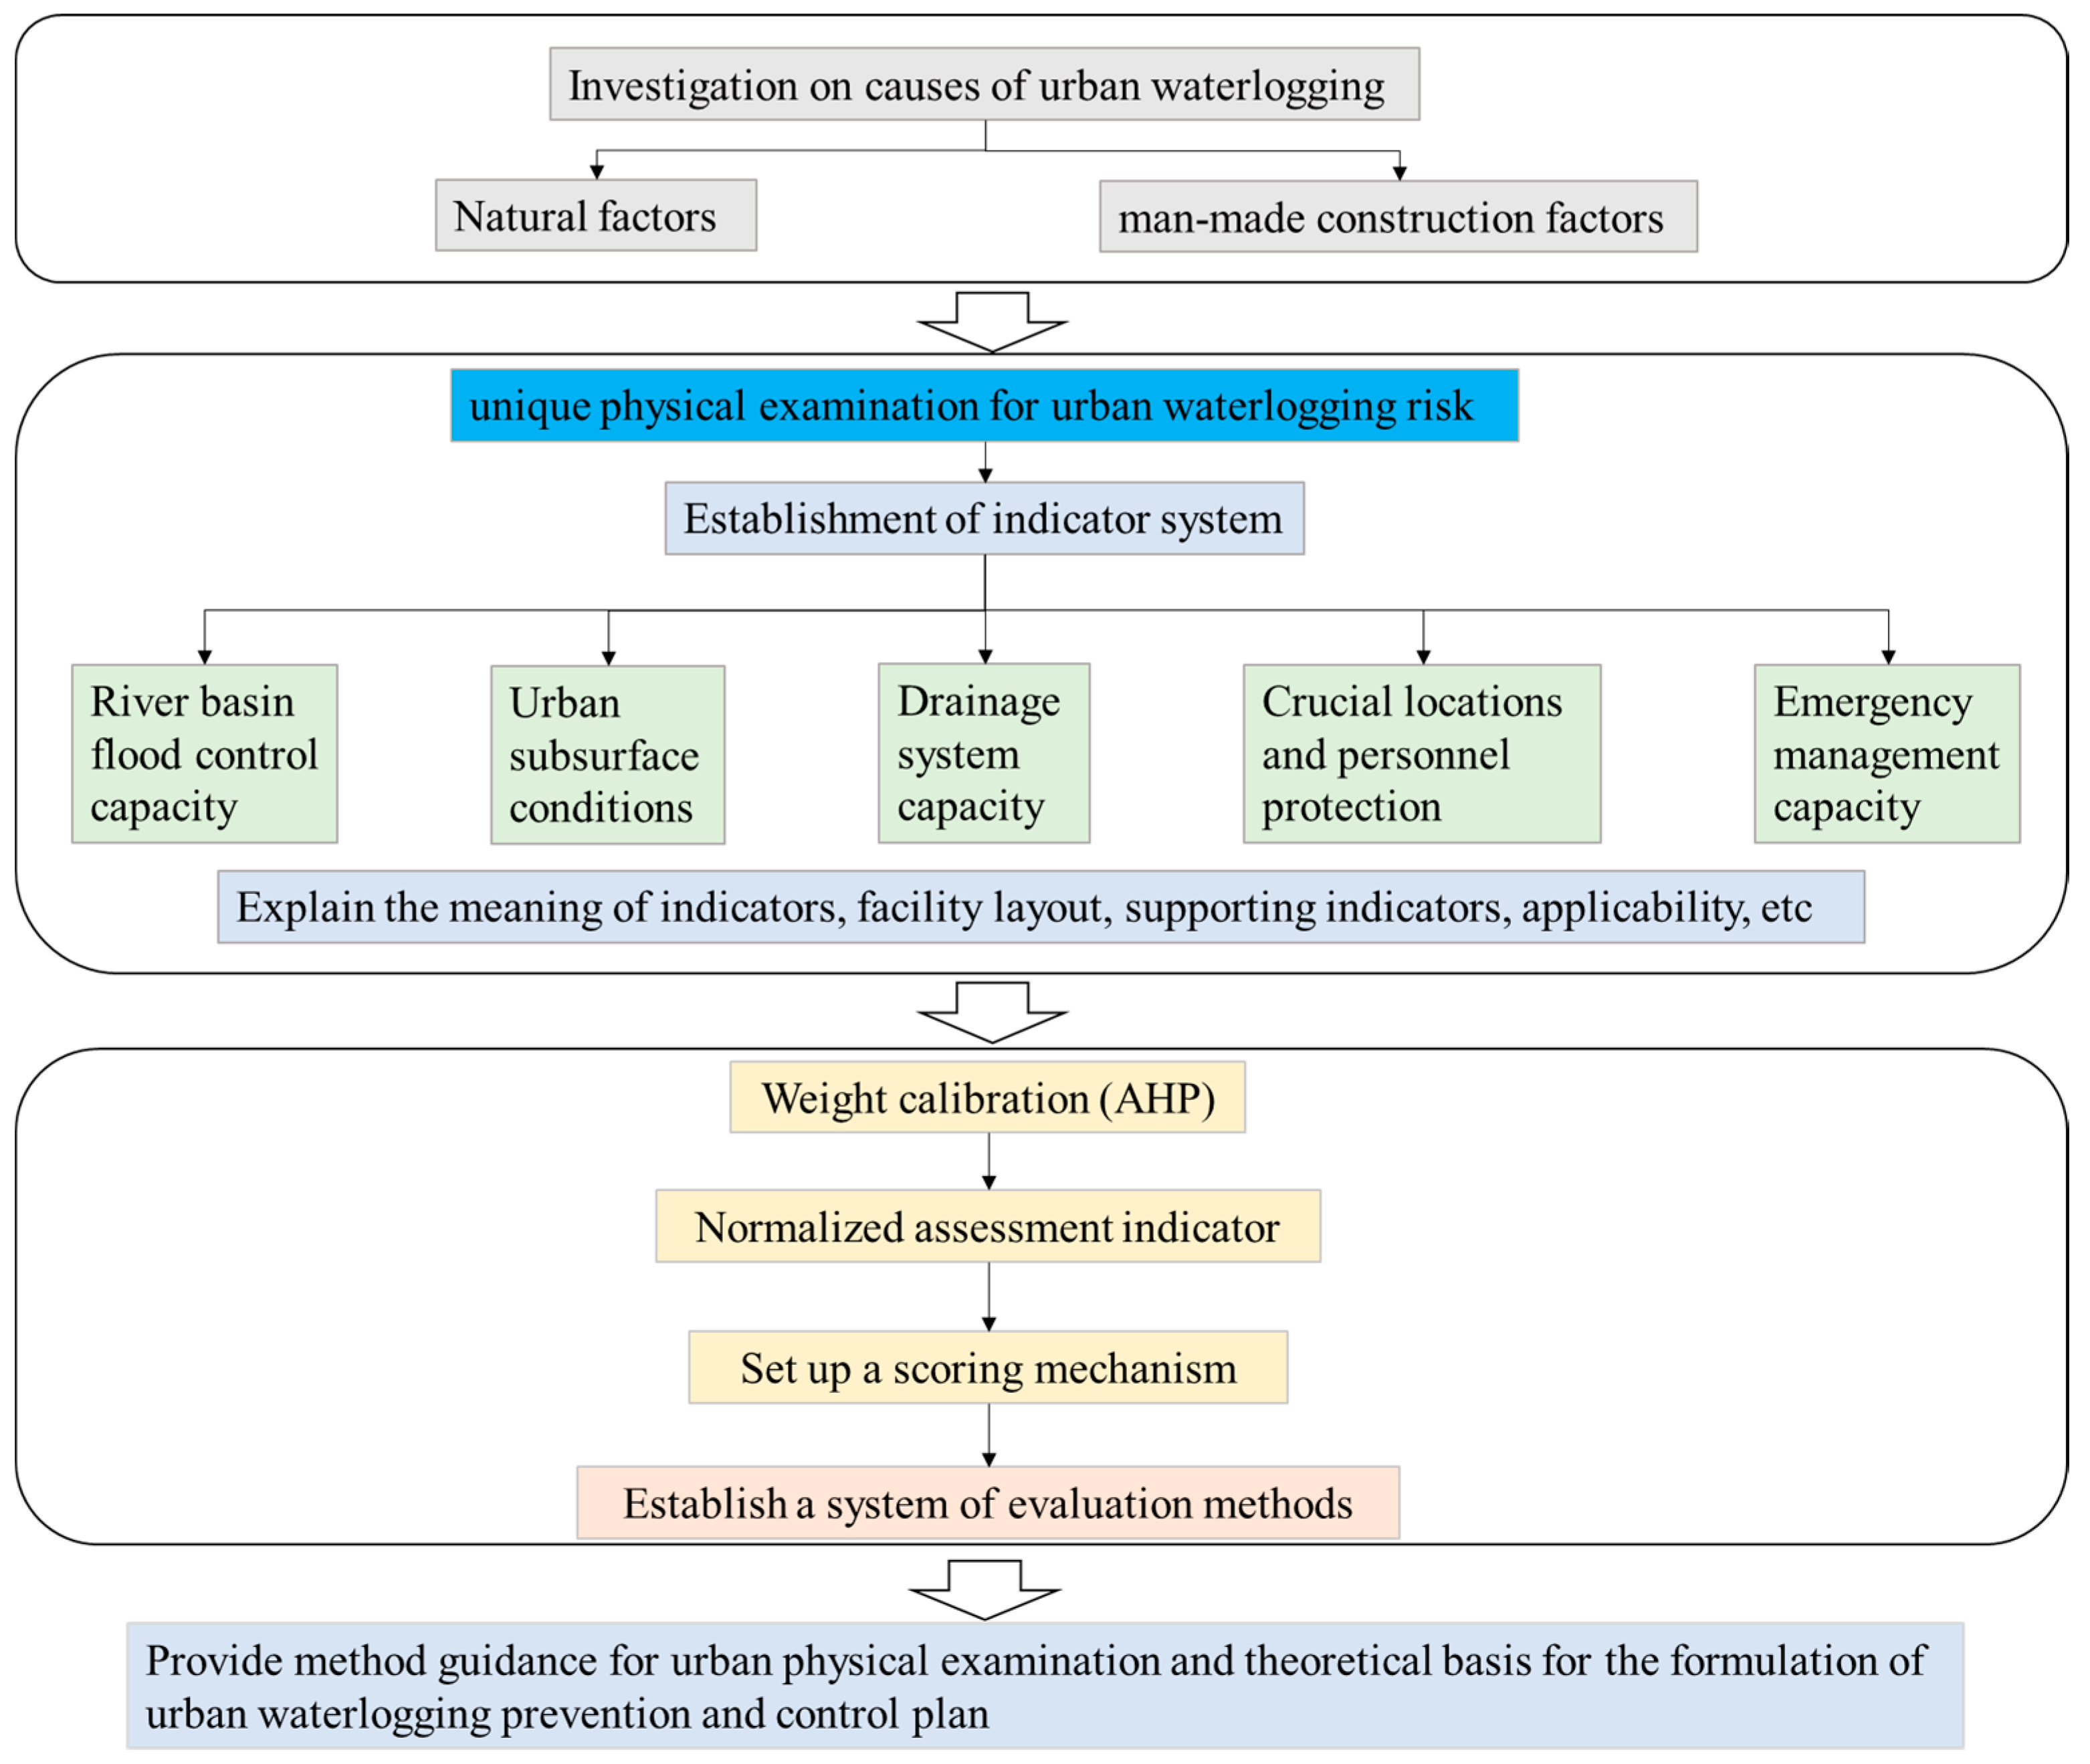
Figure 2.
Analysis of the causes of urban waterlogging risk corresponding to the indicator system.
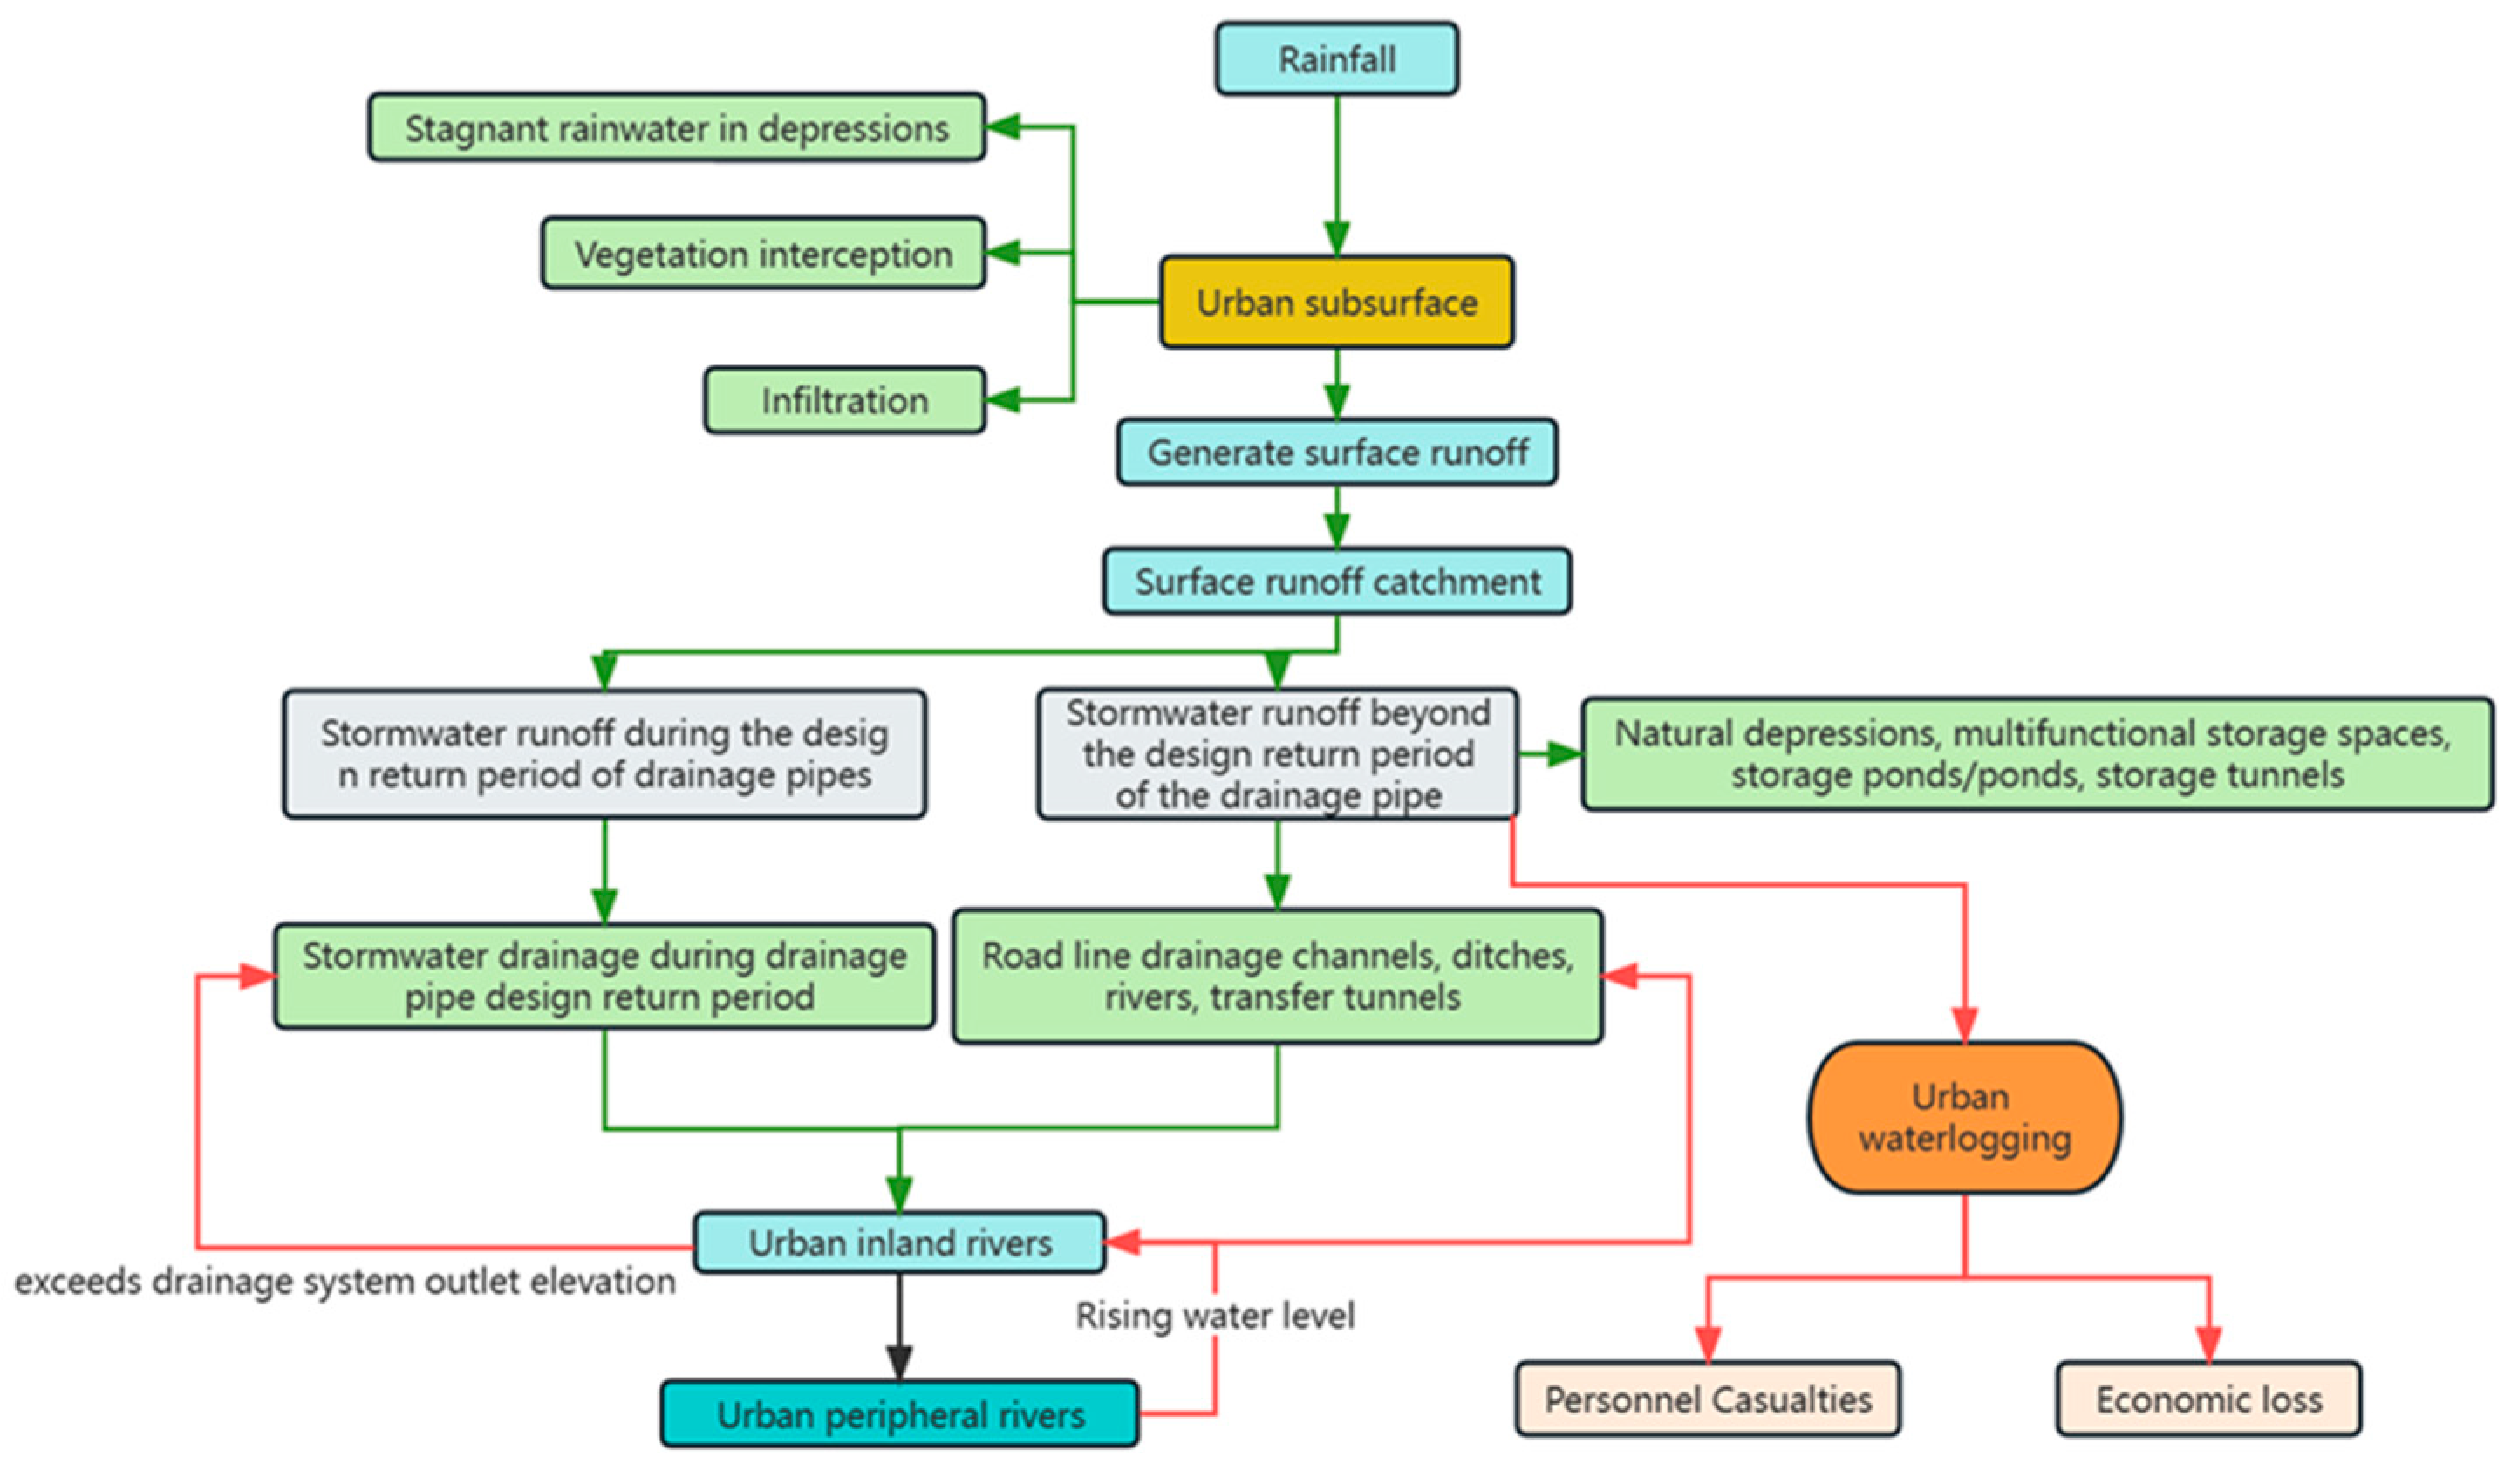
Figure 3.
The framework of the urban waterlogging risk special examination indicator system.

Table 1.
The specialized physical examination items of river basin flood control capacity.
| Examination Items | Type of Indicators | Core Indicators | Description of Evaluation Criteria | Layout | Facilities | Support Indicators | Applicability |
|---|---|---|---|---|---|---|---|
| River basin flood control capacity A1 | River flood control engineering capability B1 | Levee compliance rate (%) C1 | Evaluate the ratio of the length of flood control levees meeting the requirements of relevant planning flood control standards to the total length of the current levees | Reasonable delineation of flood control works and ecological space based on no increase in engineering land occupation | Flood protection levee | Levee construction length Levee construction height | ●■□+ |
| River flood control system and drainage system articulation effect | River flood control and drainage articulation rate (%) C2 | Evaluate the probability of not having a flooding roof during the rainfall of the design flood prevention recurrence period, using the simultaneous occurrence of upstream flooding and regional floodwater peak flow as the most unfavorable condition | Flooding river channel drainage rivers | Atormwater pipe | Rainwater discharge elevation Drainage river water level | ●■+ |
Table 2.
The specialized physical examination items of urban background disaster-bearing conditions.
Table 2.
The specialized physical examination items of urban background disaster-bearing conditions.
| Examination Items | Type of Indicators | Core Indicators | Description of Evaluation Criteria | Layout | Facilities | Support Indicators | Applicability |
|---|---|---|---|---|---|---|---|
| Urban background disaster-bearing conditions A2 | Infiltration, retention, and storage conditions | The proportion of urban permeable surface area (%) C3 | Assessment of the percentage of permeable surface area in cities | Water surface, lawn, woodland, engineering infiltration area, permeable pavement, etc., within the city limits | Infiltration facilities | Area of water areas, lawns, woodlands, engineered infiltration areas, permeable paving materials | ○□+ |
| Urban rainwater storage volume compliance rate (%) C4 | Meet the standard rate of rainwater storage volume to be built per hectare of the hardened area in the city | Meet the standard rate of rainwater storage volume to be built per hectare of hardened areas in the city | Storage water bodies, storage ponds, sunken green belts, sunken plazas, etc. | Sunken green space rate Reservoir volume | ●□+ | ||
| Surface water ratio (%) C5 | The ratio of water area to the total area of the region | Urban river water system | / | River encroachment | ●■□+ | ||
| Vertical condition B4 | Percentage of non-gravity flow drainage area (%) C6 | Assess the percentage of area that cannot rely on the natural topographic background for drainage due to local low-lying terrain or high water topping of peripheral rivers | Reasonable planning of suitable slopes and ground forms for various types of urban land, so that rainwater can be discharged by gravity flow | / | / | ●■− | |
| Average surface relief C7 | Maximum relative elevation difference per square kilometer area on average within the urban area | / | / | / | ●■− |
Table 3.
The specialized physical examination items of drainage system capacity.
| Examination Items | Type of Indicators | Core Indicators | Description of Evaluation Criteria | Layout | Facilities | Support Indicators | Applicability |
|---|---|---|---|---|---|---|---|
| Drainage system capacity A3 | Major drainage system capacity B5 | The excess stormwater pathway service catchment area compliance rate (%) C8 | Evaluate the vertical and cross-sectional conditions of the existing roads in the built-up area, assess the planned roads, drains, and rivers as excess stormwater pathways, etc., and comprehensively analyze the current drainage capacity in terms of water depth and water extension width when heavy rainfall occurs, and whether it meets the design service catchment area in the area | Cities can be used as floodwater drainage channels city roads, roadside ditches, planting ditches, river channels, etc. | All kinds of facilities and sites in the urban built-up area, etc., through vertical control, form surface diffuse flow channels, natural ditches, and ponds | Exceeding the standard rainfall Vertical conditions Water distribution | ○■+ |
| The excess stormwater storage attainment rate (%) C9 | Assessment of flood control design return period, the road line drainage channel to meet the safe water depth, storage facilities can accept the surrounding catchment area in the case of overloading of drainage facilities overflow rainwater standards | Urban green space, square, tunnel storage project | Exceeding the standard rainfall Drainage and de-risking of storage volume | ○■+ | |||
| Minor drainage system capacity B6 | Rainwater drainage network design return period compliance rate (%) C10 | Percentage of the length of rainwater drainage canals with drainage capacity to meet the design return period of different functional areas of the city (central city, important areas within the central city, recessed interchanges, etc.) | Combined flow system and diversion system rainwater drainage network | Rainwater drainage pipes | Rainwater pipe construction density Rainwater pipe flow rate Rainwater pipe diameter, length | ●■+ | |
| Pipeline storage facility peak flow reduction rate (%) C11 | Evaluate the ability of pipeline storage facilities to reduce the peak flow of stormwater from the pipeline system | Integrated planning with urban water bodies, landscaping, drainage pumping stations, and other related facilities (concerning technical specifications for urban flood control) | Irrigation and drainage pumping stations, water transmission and distribution pipes and canals, water distribution buildings and ditches, storage tanks, etc. | / | ○■+ | ||
| Drainage pipe network break head pipe impact area rate (%) C12 | Percentage of catchment area served by pipelines with no outlet downstream of drainage | / | Rainwater drainage pipes | / | ●■− | ||
| Drainage network overload ratio (%) C13 | Length of pipe in which pressure flow occurs in gravity flow pipe as a percentage of total pipe length | / | Rainwater drainage pipes | Drainage capacity of the drainage pipe network | ●■− | ||
| The drainage capacity of rainwater pumping stations meets the standard rate (%) C14 | Assessment of the actual operation of drainage pumping stations to meet the design discharge of the percentage of compliance | Rainwater cannot self-flow drainage, rainwater pumping station set up in front of the rainwater pipe outlet | Rainwater pumping station | Non-gravity drainage area | ○■+ | ||
| Micro drainage system capacity B7 | Source control using the standard area rate (%) C15 | Percentage of the area that achieves 75% of rainfall for local consumption and use | Urban construction land | Infiltration facilities, transfer facilities, storage facilities | Integrated runoff coefficient of the lower bedding surface | ○■□+ |
Table 4.
The specialized physical examination items of crucial locations and personnel protection.
| Examination Items | Type of Indicators | Core Indicators | Description of Evaluation Criteria | Layout | Facilities | Support Indicators | Applicability |
|---|---|---|---|---|---|---|---|
| Crucial locations and personnel protection A4 | Protection of crucial locations B8 | The average annual inundation loss rate of residential communities (%) C16 | Assessment of the average annual loss rate of infrastructure and indoor property flooding within the residential community over the past five years | Urban residential areas | Includes drainage pipes and drains, source reduction facilities, and consider vertical articulation relationships | Waterlogging depth Indoor property value | ●■− |
| The average annual loss rate of commercial and industrial buildings by waterlogging (%) C17 | Evaluate the average annual rate of property loss due to inundation of commercial buildings over the last five years, such as indoor property, lost production, and reduced customer traffic | Urban commercial area, industrial area | Waterlogging depth Indoor property value Lost work loss assessment | ●■− | |||
| The average annual inundation loss rate of office buildings (%) C18 | Evaluate the average annual rate of property loss due to the inundation of office buildings over the last five years due to interior property, lost work, etc. | City office area | Waterlogging depth Indoor property value Lost work loss assessment | ●■− | |||
| Annual average impact degree of road waterlogging traffic (%) C19 | Assessment of the average annual length of roads that are in an unsafe condition due to waterlogging in the last five years as a percentage | City roads | Waterlogging depth Flooded water flow rate Road network density Traffic flow | ●■− | |||
| Subway waterlogged traffic annual average impact degree (%) C20 | Assessment of the average annual number of subway stations that were in an unworkable state due to waterlogging in the last five years as a percentage of | City subway | Ponding depth Retreat time | ○■− | |||
| Personnel exposure B9 | Equivalent population exposure (number of people) C21 | The exposure of the population in flood-prone areas is evaluated by overlaying the equivalent population at important locations in the region such as medical, educational, research, and commercial areas | Within the city macroscope | Population size Number of schools Number of scientific research institutions Number of malls | ●■− |
Table 5.
The specialized physical examination items of emergency management capability.
| Examination Items | Type of Indicators | Core Indicators | Description of Evaluation Criteria | Layout | Facilities | Support Indicators | Applicability |
|---|---|---|---|---|---|---|---|
| Emergency management capability A5 | Pre-disaster prevention capability B10 | Waterlogging warning report advance time (min) C22 | Obtain the advance time to reach the water depth threshold before flooding through technologies such as intelligent sensing and simulation | Rainfall monitoring equipment Internet transmission equipment Integrated analysis management system | Early warning accuracy | ○■□+ | |
| Response capability in disaster B11 | Flooded water joint drainage joint response time (min) C23 | Waterlogging when making the river storage space, weir gate, and pumping station joint scheduling to ensure the rapid response time for safe discharge of stormwater | Inner city rivers and lakes | Gates, dams, dikes | / | ○■□+ | |
| Disaster resilience B12 | Post-disaster recovery time (min) C24 | The time to fully restore the traffic facilities that are restricted and stranded due to flooding | City roads, subways, and other access facilities | Emergency drainage equipment | / | ○■□+ |
● and ○ indicate the mandatory inspection items and optional inspection items, respectively. Because some cities do not have mandatory inspection conditions (such as the subway), the indicators can be selected according to the actual situation; ■ and □ indicate the application of built-up areas and new areas, respectively; + and − denote positive and negative effects, respectively. (Applicable to Table 1, Table 2, Table 3, Table 4 and Table 5).
Table 6.
The indicator scoring criteria.
| Indicator Name | Weights | Indicator Score | Scoring Criteria |
|---|---|---|---|
| Levee compliance rate C1 | 0.08 | 8 | More than 90%, 8 points; 80% to 90%, 6 points; 70% to 80%, 4 points; 60% to 70%, 2 points; below 60%, 0 points |
| River flood control and drainage articulation rate C2 | 0.16 | 16 | More than 90%, 16 points; 80% to 90%, 12 points; 70% to 80%, 8 points; 60% to 70%, 4 points; below 60%, 0 points |
| The proportion of urban permeable surface area C3 | 0.03 | 3 | New construction area: hardened ground permeable area of more than 40%, 3 points; 30~40%, 2 points; 20~30%, 1 point; less than 60%, 0 points Built-up area: more than 60 permeable areas, 3 points; 50% to 55%, 2 points; 45% to 50%, 1 point; less than 45%, 0 points |
| Urban rainwater storage volume compliance rate (%) C4 | 0.04 | 4 | More than 80%, 3 points; 60% to 80%, 2 points; 40–60%, 1 point; less than 40%, 0 points |
| Surface water ratio C5 | 0.07 | 7 | 10% or more, 7 points; 5–10%, 4 points; 0–5%, 1 point |
| Percentage of non-gravity flow drainage area C6 | 0.07 | 7 | More than 50%, 0 points; 40% to 50%, 2 points; 30% to 40%, 4 points; 20% to 30%, 6 points; less than 20%, 7 points |
| Average surface relief C7 | 0.02 | 2 | 0° to 1°, 0 points; 1° to 2°, 1 points; more than 2°, 2 points |
| Excess stormwater pathway service catchment area compliance rate C8 | 0.05 | 5 | More than 90%, 5 points; 80% to 90%, 4 points; 70% to 80%, 3 points; 60% to 70%, 2 points; below 60%, 0 points |
| Excess stormwater storage attainment rate C9 | 0.05 | 5 | More than 40%, 5 points; 30% to 40%, 4 points; 20% to 30%, 3 points; 10% to 20%, 2 points; less than 10%, 0 points |
| Rainwater drainage network design return period compliance rate C10 | 0.04 | 4 | More than 90%, 4 points; 80% to 90%, 3 points; 70% to 80%, 2 points; 60% to 70%, 1 point; below 60%, 0 points |
| Pipeline storage facility peak flow reduction rate C11 | 0.03 | 3 | More than 90%, 4 points; 80% to 90%, 3 points; 70% to 80%, 2 points; 60% to 70%, 1 point; below 60%, 0 points |
| Drainage pipe network break head pipe impact area rate C12 | 0.03 | 3 | More than 50%, 0 points; 30% to 50%, 1 point; 30% to 10%, 2 points; less than 10%, 3 points |
| Drainage network overload ratio C13 | 0.02 | 2 | More than 30%, 0 points; 30% to 20%, 1 point; less than 20%, 2 points |
| The drainage capacity of rainwater pumping stations meets the standard rate C14 | 0.02 | 2 | More than 90%,2 points; 80% to 90%, 1; below 80%, 0 points |
| Source control using the standard area rate C15 | 0.05 | 5 | More than 90%, 5 points; 80% to 90%, 4 points; 70% to 80%, 3 points; 60% to 70%, 2 points; below 60%, 0 points |
| The average annual inundation loss rate of residential communities C16 | 0.03 | 3 | More than 10%, 0 points; 6% to 10%, 1 point; 2% to 6%, 2 points; less than 2%, 3 points |
| The average annual loss rate of commercial and industrial buildings by flooding C17 | 0.03 | 3 | More than 10%, 0 points; 6% to 10%, 1 point; 2% to 6%, 2 points; less than 2%, 3 points |
| The average annual inundation loss rate of office buildings C18 | 0.02 | 2 | More than 10%, 0 points; 5% to 10%, 1 point; less than 5%, 2 points |
| Annual average impact degree of road waterlogging traffic C19 | 0.05 | 5 | More than 20%, 0 points; 15% to 20%, 1 point; 10% to 15%, 3 points; 5% to 10%, 4 points, less than 5%, 5 points |
| Subway waterlogged traffic annual average impact degree C20 | 0.02 | 2 | More than 10%, 0 points; 5% to 10%, 1 point; less than 5%, 2 points |
| Equivalent population exposure C21 | 0.02 | 2 | More than 10%, 0 points; 5% to 10%, 1 point; less than 5%, 2 points |
| Flooding warning report advance time C22 | 0.03 | 3 | Predicted flooding depth accuracy of 60%, to achieve 1 h ahead, 1 point; to achieve 2 h, 2 points; to achieve more than 3 h, 3 points |
| Flooded water joint drainage joint response time C23 | 0.02 | 2 | Response time 1 h, 1 point; reach 30 min, 2 points |
| Post-disaster recovery time C24 | 0.02 | 2 | Within 1 h, 2 points; 1 to 2 h, 1 point; more than 2 h, 0 points |
Table 7.
Specialized physical examination assessment method of waterlogging risk.
| Indicator Name | Evaluation Methodology |
|---|---|
| Levee compliance rate | ① Consider weirs, gates, water-blocking bridges, and the exchange of water between zones to establish a mathematical model. ② Whether the height of the original design levee under the flood control standard meets the standard. ③ Field research to assess whether there are missing and broken sections of the levee |
| Flood control and drainage articulation to meet the standard rate | ① Generalized river network to establish a hydrological model. ② Set upstream flooding and regional flood water flood flow at the same time as unfavorable conditions. ③ Assess the proportion of 24 h rainfall without road elevation below the river level under the flood control design recurrence period |
| The compliance rate of urban infiltrative ground area ratio | ① Apply high-precision satellite images and local geographic information system (GIS) vector maps for data-based analysis to identify different land types such as water, urban construction land, agricultural and forestry land, and grassland. ② For new areas: use the product of the area of different types of parcels and their respective corresponding permeable area ratios; ③ for built-up areas: the current land classification, deducting vacant parcels, and then using the above method to calculate |
| Regional rainwater storage volume compliance rate | ① If there is a clear urban landmark requirement, the application of GIS extracts urban hardened area (including roof, non-permeable paving hardened pavement), calculates the required volume of storage and ② calculates the urban area rainwater storage ponds, depressed green space storage volume, and the ratio of the required volume for the rate of compliance. ③ If there is no clear urban landmark, the required volume of storage should be determined according to precipitation patterns, water surface evaporation, runoff control rate, rainwater reuse, and other parameters through the annual water balance analysis, and then calculated as above |
| Percentage of non-gravity flow drainage area | ① Division of catchment area. ② Hydrological model evaluation |
| Water surface rate | GIS extraction analysis, the ratio of the water area of the regional river at normal water level to the overall area of the region |
| Average surface relief | Loading DEM data in Arc Map to extract maximum elevation value and minimum elevation value |
| Excess stormwater pathway service catchment area compliance rate | ① Review urban planning information to determine the landmark runoff channel. ② Catchment area hydrological analysis. ③ Determine the surface drainage channel design return period and storm intensity. ④ Meet the safety conditions of the drainage capacity of the drainage channel. ⑤ Calculate the service area and the actual demand ratio |
| Excess stormwater storage attainment rate | ① Establish a hydrological model. ② Simulate the proportion of unsaturated storage facilities when the road travel discharge channel reaches the safe water depth threshold |
| Drainage pipe design reproduction period compliance rate | Simulation of pipe drainage capacity using modeling tools such as MIKE URBAN |
| Peak flow reduction rate of pipe and canal storage facilities | SWMM is used to establish a generalized model of the regional pipeline network and set up storage facilities to simulate peak reduction according to the actual situation |
| Drainage pipe network break head pipe impact area rate | City pipe network plan interception |
| Overload ratio of the drainage pipe network | The network simulation technology is used to simulate the operation of the network under different recurrence periods (1, 2, and 5 years) by combining the Chicago rain pattern with the same frequency distribution |
| Drainage pumping station design discharge rate to meet the standard | ① Check the recessed interchange, underground passages, and urban low-lying areas with drainage pumping stations. ② Calculate the drainage pumping station drainage capacity to meet the design requirements |
| Percentage of the area with 75% total annual runoff control rate | Accounting for facility runoff volume combined with monitoring and model evaluation |
| The residential community, commercial, industrial, and office building impact degree | ① Basic information statistics. ② Build the loss rate-property-water depth correlation model curve |
| Road and subway traffic impact degree | ① Basic information statistics. ② Build the loss rate-delay loss-water depth correlation model curve |
| Equivalent population exposure | Basic information statistics |
| Flooded water joint drainage joint response time | Research on urban planning materials |
| waterlogging warning report advance time | Research on urban planning materials |
| Post-disaster recovery time | On-site research |
Disclaimer/Publisher’s Note: The statements, opinions and data contained in all publications are solely those of the individual author(s) and contributor(s) and not of MDPI and/or the editor(s). MDPI and/or the editor(s) disclaim responsibility for any injury to people or property resulting from any ideas, methods, instructions or products referred to in the content. |
© 2023 by the authors. Licensee MDPI, Basel, Switzerland. This article is an open access article distributed under the terms and conditions of the Creative Commons Attribution (CC BY) license (https://creativecommons.org/licenses/by/4.0/).
Share and Cite
MDPI and ACS Style
Li, J.; Zhang, H.; Zhang, X.; Wang, W. Establishment and Application of a Specialized Physical Examination Indicator System for Urban Waterlogging Risk in China. Sustainability 2023, 15, 4998. https://doi.org/10.3390/su15064998
AMA Style
Li J, Zhang H, Zhang X, Wang W. Establishment and Application of a Specialized Physical Examination Indicator System for Urban Waterlogging Risk in China. Sustainability. 2023; 15(6):4998. https://doi.org/10.3390/su15064998
Chicago/Turabian StyleLi, Junqi, Haohan Zhang, Xiaoran Zhang, and Wenliang Wang. 2023. "Establishment and Application of a Specialized Physical Examination Indicator System for Urban Waterlogging Risk in China" Sustainability 15, no. 6: 4998. https://doi.org/10.3390/su15064998
Note that from the first issue of 2016, this journal uses article numbers instead of page numbers. See further details here.