

The Double C Block Project: Thermal Performance of an Innovative Concrete Masonry Unit with Embedded Insulation

Department of Environmental Design, Faculty for the Built Environment, University of Malta, MSD 2080 Msida, Malta
*
Author to whom correspondence should be addressed.
Sustainability 2023, 15(6), 5262; https://doi.org/10.3390/su15065262
Submission received: 13 January 2023
/
Revised: 10 March 2023
/
Accepted: 13 March 2023
/
Published: 16 March 2023
(This article belongs to the Special Issue Sustainable Development of Energy, Water and Environment Systems (SDEWES 2022))
Abstract
:The Double C Block (DCB) is an innovative composite Concrete Masonry Unit (CMU) developed to offer enhanced thermal performance over standard hollow core blocks (HCBs). The DCB features an original design consisting of a polyurethane (PUR) foam inserted between two concrete c-shaped layers, thus acting as the insulating layer and the binding agent of the two concrete elements simultaneously. The purpose of this research is to describe the results obtained when assessing the thermal transmittance (UDCB and UHCB) of these blocks using three different methodologies: theoretical steady-state U-value calculations, numerical simulation using a Finite Element Method (FEM), and in situ monitoring of the U-value by means of the Heat Flow method (HFM). The results obtained show that the three methodologies corroborated each other within their inherent limitations. The DCB showed a performance gap of 52.1% between the predicted FEM simulation (UDCB was 0.71 W/(m2K)) and the values measured via HFM, which converged at 1.47 W/(m2K). Similarly, a gap of 19.9% was observed when assessing the HCB. The theoretical value via FEM of UHCB was 1.93 W/(m2K) and the measured one converged at 2.41 W/(m2K). Notwithstanding this, the DCB showed superior thermal performance over the traditional block thanks to a lower U-value, and it complies with the Maltese building energy code. Further improvements are envisaged.
1. Introduction
A recent study from the International Energy Agency (IEA) has shown that a technical solution to improve the energy efficiency of buildings [1], and hence the energy-related CO2 emissions of the building industry [2], is the use of efficient building envelopes. From a thermodynamic point of view, the building envelope has significant importance in determining the heating, cooling, ventilation, and lighting demands of a building [3]. However, to date, these solutions are not meeting desired goals. Some of the reasons for this include that a large number of countries still lack mandatory building energy codes for new buildings [1], often have a non-active building retrofitting market (only 1% circa in EU) [4], and have low market readiness for industry-friendly, energy-efficient building products [5]. Other reasons can be associated with the so-called “building fabric performance gap” [6], meaning that a substantial deviation from theoretical design is measured when real performance is assessed. One of the most common metrics that is often misaligned from the design stage is thermal transmittance (U-value) or its inverse, namely thermal resistance (R-Value).
In this context, an innovative concrete masonry unit (CMU) called a Double C Block (DCB) was developed. The block features an original design wherein a polyurethane (PUR) foam is inserted between two concrete c-shaped layers, thus acting as the insulating layer as well as a binding for the two concrete skins simultaneously. The idea behind this design is to enhance the thermal performance of CMUs by completely eliminating the point of contact between the concrete elements and by filling the unvented cavities with insulation. This approach is different from traditional geometrical optimization accomplished via a concrete web and an array of unvented air cavities.
This research is a further development of a previous study carried out between 2013 and 2014 [7]. It presents the results of a thorough monitoring campaign carried out between June and July 2022 at the University of Malta. In this monitoring campaign, three modes of testing were used: (i) a full-scale, real-life measurement of the U-value; (ii) a calculation using analytical methods; and (iii) a numerical simulation approach using the Finite Element Method (FEM). Specifically, for the full-scale measurement tests, this paper also has the scope of enriching the set of case studies using the Heat Flow Method (HFM), which, to date, has mostly been applied to single or multilayered walls and less frequently to single-leaf walls made of composite CMUs.
2. Literature Review
Conventional CMUs, also known as Hollow Concrete Blocks (HCBs), are, in most countries, produced to merely satisfy structural requirements of load-bearing walls. They feature a rectangular block with two cores: two unvented air cavities. This reduces the overall weight of the block, ensuring enough compression strength, and accommodating the passage of concealed building services, if necessary. Compared to a wall made of solid block, this typology can, due to the presence of unvented cavities, reduce the wall’s overall thermal transmittance.
By looking at the technology itself, CMUs can be thermally improved through exploiting the following strategies: the use of concrete and insulation mix designed with high-performance thermophysical properties, geometry optimization, and filling air cavities with materials characterized by high R-values as presented in the literature review.
2.1. The Role of Thermophysical Material Properties in CMUs
The typical declared thermal conductivity (λd) of PUR foams available in technical and academic literature is 0.025 ≤ λd ≤ 0.035 W/(mK) [8]. Concrete thermal conductivity, on the other hand, can vary, with densities up to values that are a hundred times higher compared to PUR foams [7] and λd value ranges from 0.69 up to 1.72 W/(mK) and densities between 1600 and 2400 kg/m3 [9,10]. It is important to note that these declared values are obtained by analyzing conditioned specimens at 23 °C and 50% relative humidity. The “designed” λ value allows the designer to factor the effect of the real range of temperature and relative humidity, influencing the behavior of the material as described in ISO 10356 [11].
Within a dense material, such as concrete, heat is propagated mainly by conduction at an atomic level. Al-Hadhrami, et al. [12] measured heat flow under steady state conditions using a guarded hot plate to obtain the equivalent thermal conductivity (which included the overall impact of air cavities) of conventional concrete blocks used in Saudi Arabia. When using ordinary concrete mortar, the thermal conductivity was 0.976 W/(mK). The introduction of lightweight perlite aggregate in the concrete mix design reduced the thermal conductivity down to 0.489 W/(mK); this is around 50% lower.
Air has a very low thermal conductivity, as long as it is still. However, within cavities (or air spaces), heat transfer is mainly driven by convection and radiation (emissivity “e” of the cavity surface), and to a much lesser extent by conduction [13]. Indeed, before the widespread use of plastic materials in building construction, air cavities were initially introduced in northern Europe to reduce the amount of water seepage (e.g., due to driving rain) adsorbed by the external layers by the brick veneers and hence to keep the internal load-bearing wall dry. As a result, an improved U-value of the whole multilayered assembly could be experienced thanks to the low thermal conductivity of the unvented air cavity between an internal loadbearing wall and external layer. In general, the scope of any good insulating material is therefore to encapsulate air with as little material as possible. Insulation material in the form of pores or fibers fulfills the role of reducing convection heat transfer due to air movement.
Polyurethane foams due to their density, and hence their porosity, have a particular behavior as described by de Luca Bossa et al. [14]. Thermal conductivity measured in laboratory experiments is the sum of several mechanisms: conduction through the polymeric material, heat conducted through the fluid (blowing agent or air depending on their aging conditions), convection inside the fluid, and radiation between pore surfaces. Due to this complex combination of different modes of heat transfer, the overall thermal conductivity is ”apparent” (ISO 22007-1), as opposed to an ”effective” measured value for other types of homogeneous materials, where heat transfer is mainly driven by conduction [15].
Insulation can also lead to some disadvantages, especially in warm or hot climates [16] where cooling needs are relevant. Over-insulation may lead to the risk of overheating, albeit even in winter, and therefore it is important to strike the right balance in the choice of applied insulation. Feist and other authors [17,18], for example, proposed that the thicknesses of the wall insulation in residential buildings between 40 and 100 mm are reasonably effective whenever applied in conjunction with other energy-efficient design strategies.
Urban et al. [19] obtained results that showed good agreement with previously mentioned strategies. The results of 3D finite difference simulation (FDM) concluded that the best design for the selected types of CMUs (two-core, multicore, serpentine, and interlocking) in terms of low thermal resistances had to implement a serpentine-like shape insulation layer or multicore insulation able to fill all the air cavities. These insulation options were also evaluated against raising concrete resistivity (the inverse of thermal conductivity) towards lower density mix designs.
The ASHRAE Fundamentals Handbook [20] also emphasizes the effect of mortars on the measured wall R-value by reviewing several empirical studies using the hot box apparatus on insulated and uninsulated masonry walls. Neglecting the horizontal mortar joint could lead to a difference in the actual wall R-value of up to 16% (depending on thermal properties and density of the masonry). When multicore insulation is considered, the measured thermal resistance of the wall is 1–6% lower than the value measured including the mortar joints.
2.2. To Increase the Thermal Transfer Path Length via Geometrical Optimization
Another strategy to decrease the thermal transmittance of a CMU is through optimization of the design of the block. This relates to the investigation of the effects of complex patterns of vertical cavities with known aspect ratios (height/width) in order to minimize the heat transfer inside them, reduce the overall block weight, and to increase the length of the thermal path through the concrete web. Lacarrière et al. [21] numerically calculated the equivalent thermal conductivity of air inside cavities of vertically perforated blocks based on the finite volumes method (FVM). Inside these cavities with an aspect ratio of 23.3, heat transfer by convection is negligible. Diaz et al. [22] proved that topological optimization can successfully lead to new block geometries with the added value of reduced overall weight without losing load-bearing capabilities. A 3D FEM was used to test the compressive strength. No thermal studies of the blocks were performed.
Although applied on clay bricks, other interesting studies could be used as reference for CMUs as well. Li et al. [23] found that a reduction of 41% compared to the highest equivalent thermal conductivity could be achieved via the finite volume method (FVM) simulation from a set of 72 different patterns of air cavities. The ideal pattern consisted of vertical cavities (with a rectangular or square shape in a horizontal cross-section) numbering eight lengthwise and four in widthwise. With a similar methodology, Bustamante et al. [24] introduced a diagonal path in the web matrix of clay bricks and then studied the heat flow path via FEM simulation. Although an evident reduction of the thermal transmittance was achieved compared to the traditional Chilean block, it was found that the thermal improvements tended to weaken the overall compressive strength.
2.3. Exploiting Full-Scale Tests and Complementing HFM with Other Methodologies
Several researchers insist that in order to provide tangible evidence and to find reliable solutions to this performance gap, that is, a closer agreement between theoretical and actual performance, full-scale test facilities, laboratory tests, and material characterization studies [25] are required. Whenever combined, these methods complement each other and reduce the inherent uncertainties embedded in the assessment of theoretical energy performance of building components. Indeed, the latter is often assessed by practitioners through standard calculation methods implemented in computer software or via other analytical methods. Bridging the performance gap cannot therefore be considered only a purely scholarly activity. Indeed, for architecture, engineering, and construction (AEC) professionals, it can be seen as tangible evidence of the energy-related environmental impact of building construction. It is also relevant for policy and decision makers who oversee the setting up of building energy codes.
In 2011, the DYNASTEE and INIVE networks, through a series of workshops [6], shed light on the types of advanced facilities currently available across the world at that time. Stemming from these activities, in 2017, IEA EBC Annex 58 launched the international research collaboration topic called “Reliable Building Energy performance characterization based on full-scale dynamic measurements” [25]. A series of reports were therefore released in the field of dynamic testing and data analysis to support the characterization of the actual energy performance of both building components and whole buildings. In one of these, the use of Heat Flux Meter (HFM) measurements was explored for medium to heavy opaque assembly and for a glazing unit; the strategy was described as a robust methodology with appropriate limitations and advantages in measuring the U-value (or R-value) in situ.
As highlighted earlier, the scientific literature available when assessing in situ performance via HFM mostly relates to single-leaf wall assemblies with internal plaster and rendered wall and multilayered walls (including insulation layers and air cavities as per local construction techniques) [26,27,28]. Most of the time these assessments are carried out via non-destructive methodologies in order to preserve the integrity of the wall assembly. The selection of the most representative area of the wall, which should be free from any alien materials, is done via infrared cameras. A relevant set of previous studies using these methodologies are described hereunder.
Dudek et al. [29] assessed a typical UK double-leaf wall with an external skin in face bricks, an air cavity, and a concrete block with 30 mm PUR panel bonded to one face and plastered internally. They assessed the performance by using commercial software to perform FEM analysis and then compared it with in situ HFM measurements to establish the performance gap.
Asdrubali et al. [30] selected six wall types from buildings implementing bio-architectural features located in the Umbria region in Italy. They made use of analytical calculation by means of ISO 6946 [31] for theoretical calculation as a way to compare HFM results.
Baker [32] assessed traditional buildings in Scotland, most of them constructed in single-leaf stone walls; for one of them, the author has compared the in situ assessment with an identical assembly purposely rebuilt under laboratory conditions and tested inside the environmental chamber (known as the hot box apparatus).
When assessing buildings in the Catalunia Region in Spain, Gaspar et al. [33], implemented the “dynamic analysis method” and compared it to the “average method”; both included in ISO 9869-1:2014 [34] standard. Then, the performance gap was established by performing theoretical calculations according to ISO 6896 [31].
To reduce the oscillation of outdoor environmental variables, when assessing existing buildings in Italy, Evola et al. [35] surrounded the HFM and related thermocouples in a small portable hotbox and attached the whole apparatus to the external wall.
In order to shorten the measuring campaign, without sacrificing precision, Rhasoli and Itard [36] investigated the use of two HFM sensors installed in series: one on the inside and one on the outside face of the wall. The predicted U-value was calculated through an algorithm solved in MATLAB for the selected type of multilayer walls. When insulation was sandwiched between layers or installed on the indoor side of the walls, HFM placed inside converged faster due to a much more stable indoor environment. Conversely, when insulation was applied outside, the measurements taken by the (shielded) outdoor HFM converged faster.
Some authors such as Atsonios et al. [37] focused on comparing the two main international standards for in situ U-value assessments via the HFM method, as described in ISO 9869-1 [34] and ASTM C1155 [38]. Using the ISO standard, they performed the “Average method” and “Dynamic Analysis methods” and the results were then compared to the equivalent “Summation Method” and the “Sum of the least squares” as provided by the ASTM standard.
It is also important to mention that earlier studies in Malta showed that, for a 230 mm thick HCB wall (without plaster and render layer), a typical U-value is in the region of 2.41 W/(m2 K) via the HFM method [39]. A single-leaf wall made up of these blocks would not be compliant with the local Maltese Building Energy code, Part F, prescribing 1.57 W/(m2 K) for exposed wall elements [40].
Micallef [7] carried out several tests on DCB prototypes made with a variety of hand-made PUR foams, testing different constituents, and then prepared 25 blocks. These DCB prototypes were tested through a set of hot box experiments. The U-value was expressed through the measurement of the temperature differences across the hot–cold chambers and the heat provided by ceramic resistors, as shown in Table 1.
These tests included 0.1 (m2K)/W surface resistance on both sides and were carried out on specimens laid without plaster. Outputs results indicate that the DCB values were well within the part F limit as opposed to the previous conventional wall built in HCB units.
3. Methodology
The methodology described in this research is based on three different approaches to obtain the U-value (and R-value) of both DCB UDCB and RDCB and HCB UHCB and RHCB under steady-state conditions. The block dimensions are shown in Figure 1.
This pilot study started in January 2022, but the data regarding the use of the HFM sensor on full-scale test cells are related to measures carried out between June and July 2022. The first approach, a purely theoretical one, involved the application of the two methodologies proposed by ISO 6946:2017 [31]. This standard proposes a theoretical calculation using the “simplified method” applicable to elements containing inhomogeneous layers, although with some limitations. In the same standard, a leeway to overcome these limitations is given by the “detailed method” wherein numerical simulations are carried out with established modelling rules in accordance with those in ISO 10211 [41]. In this research, software using two-dimensional (2D) FEM steady-state conduction and radiation heat-transfer analysis based on the FEM was deployed specifically for this task.
The third methodology employed used in situ measurements of the U-value (and R-value) by means of Heat Flux Meters placed on the walls of two geometrically identical test cells: one built in conventional HCB walls and the other built using DCB walls.
The overall dimensions of the test cells in terms of length, depth, and height were 5 × 4 × 3.15 m, comparable to the minimum dimensions described by EBC Annex 58 report for full-scale test facilities [25]. The two test cells were also identical in terms of ground slab and the roof build ups: they were both equipped with 10 cm EPS insulation. The roof finishes included a reflective white paint with Solar Reflective Index (SRI) >104 on top of a torch-welded black waterproofing membrane. Thermal bridge correction at the wall-roof/ground slab edge were included too. Thermal bridge corrections around the window and door jamb and sill and lintel were introduced in the DCB room only. Trickle ventilators (10 × 15 cm wide wall opening) were also provided on the eastern and western façades to resemble local construction practices. Both rooms were externally rendered in white with lime and cement mix and internally plastered with gypsum. An air conditioning split unit with heat pump was installed in each test cell to control and ensure stable indoor conditions.
In each test cell, a couple of Heat Flux Meters and a total of four thermocouples for surface temperature readings were installed on the north facing walls to avoid any interference from direct solar radiation. This methodology is described by ISO 9869-1:2014 [34] and was also influenced by the previously mentioned peer-reviewed research regarding in situ measurements of full-scale single-leaf and multilayered walls, as shown in Figure 2 below. The assumptions made for the theoretical calculation performed according to ISO 6896 are listed in Table 2. The thermal performance of the unvented air cavities in HCB is expressed via an equivalent thermal resistance as per ISO 6946 rules. The value of this thermal resistance is 0.17 m2K/W. The equations provided by this standard consider the effect of emissivity of materials surrounding the cavity (assumed e = 0.93 for conventional concrete). A fictitious thermal conductivity was inputted in the FEM analysis. This value was obtained by dividing the thickness of the air cavities of the HCB, 130 mm, by the mentioned resistance, giving a value of 1.01 W/(mK) in order to satisfy the set of inputs required by the FEM software.
From this dataset listed in Table 2, the specific heat capacity of the whole block can be calculated as the sum of the multiplication of each layer’s thickness by the relative specific heat capacity and density. For the DCB, the value is 278 kJ/(m2K) and for the HCB, it is 181 kJ/(m2K).
Table 3 includes the indoor and outdoor surface resistances (or film coefficients, Rsi and Rse) used for the theoretical calculations. The related temperatures, 20 °C and 10 °C, respectively, also constitute the chosen boundary conditions for finite element simulation.
3.1. First Method—ISO 6946:2017—U-Value—the “Simplified Method”
ISO 6946:2017 is a recognized standard describing the approximate calculation method for the steady-state conductive heat transfer by conduction through building assemblies whenever inhomogeneous layers are present; this is the case regarding air cavities or composite materials. Two accepted methods are described: “the simplified calculation method” and “the detailed calculation method”. ISO 6946:2017 follows an electrical analogy of parallel and series circuits to address the presence of adjacent thermally dissimilar material layers. Since heat behaves like a current flowing through the path of least resistance, the flow tends to bend towards highly conducting concrete elements in order to maximize the heat transfer rate.
For this reason, the simplified method requires two calculations: one can be described as “parallel path” (mono-dimensional flow), which can lead to an overestimated result, Rtot upper, while the second is called “isothermal planes”, which can lead to an underestimated result, Rtot lower, of the actual thermal resistance of the buildup. The overestimate is related to the exclusion of any lateral components of the heat flow included in the Rtot lower instead. As also described in ASHRAE fundamentals [20], since the actual value is somewhat between Rtot upper and Rtot lower, then ISO 6946:2017 proposes an arithmetic average between the two calculated thermal resistances, as shown in Equations (1)–(5). Given the copious number of subscripts, a nomenclature table was added at the end of this paper for clarity.
Utot is thus the reciprocal of Rtot. In addition to the block itself, heat transfer may also occur through the mortar. Indeed, when insulation is introduced, the effect of ordinary mortars can create thermal bridges because they constitute an additional path to heat flow.
3.2. Second Method—ISO 6946:2017—U-Value—”Detailed Method”
Since the first methodology is subject to some limitations, a detailed calculation can facilitate the assessment of complex geometries included in the presence of composite materials, such as in the DCB. The advantage of using FEM software described hereunder is that most of the material properties applied in the “simplified method” can be implemented in the numerical analysis (i.e., surface resistances, film coefficients, etc.) so that a comparison is possible. Computer simulations were performed in THERM (version 7.8.16). This software numerically resolves the steady state two-dimensional heat radiation–conduction problem under the assumption of constant physical material properties for isotropic medium; no heat is stored in the cross-section, and so all energy that enters the cross section on the interior surface leaves through the exterior surface.
In the program, the magnitude of the heat flux vector normal to the boundary is given by Fourier’s law:
where T = f(x,y) and qf = q boundary condition. Refer to the nomenclature at the end of the paper for greater clarity.
The numerical resolution via FEM was performed automatically using the proprietary Finite Quadtree Method (FQM) [42]. The mesh was generated and adapted through several iterations up to the desired accuracy. During the simulations, the selected parameters that influenced the FQM were chosen according to ISO 10211: 10 iterations and 5% max error. The program integrates the heat flux over the tagged boundary segment (or group of segments that have been given the same tag), divides that flux by the projected length of the segment and the defined temperature difference, and returns a U-value. Hence, U-values were dependent on the assigned boundary.
3.3. Third Method—In Situ Thermal Transmittance Measurements
The experimental set up was built on the north facing façades of the two test cells and, as described earlier, carried out according to ISO 9869:2014 [34]. To increase the heat flux sensitivity, and hence improve the measurements, a set of two Heat Flux Meters were used and the related indoor and outdoor surface temperatures were recorded through thermocouples type T, as shown in Table 4. The reported measurements refer to the first two weeks of June 2022, during which no rainy days occurred.
The indoor temperature was maintained at a constant of 18 °C with an air conditioning split unit (with a selected cooling set point of 16 °C) turned on in order to guarantee at least 5 °C temperature difference between indoors and outdoors. Heat flux and surface temperatures were recorded every three minutes and then averaged up to 30 min so as to be comparable with indoor and outdoor temperature sensor timesteps (Figure 5). The total recording session lasted 2 months (from June 2022 until the end of July 2022).
An infrared camera was used to identify the most thermally uniform area of the wall where the sensors should be applied. For this purpose, the test cells were built with surface conduits in order to avoid placing any alien material underneath the plaster (Figure 5).
The equation used to calculate the U-value at which the measurement should converge was determined according to ISO 9869-1’s [34] “average method” shown in Equation (9) below, where
q, is the density of the heat flow rate (W/m2),
Tij interior ambient temperature (°C),
Tej outdoor environmental temperature (°C).
Index j enumerates the individual measurements according to the established sampling time.
In order to obtain reliable measurements, the difference in temperature between indoor and outdoor had to be more than 5 °C. The cooling set point was selected in order to stabilize the indoor temperature and establish a constant heat flux from the outdoor environment towards the indoor environment. Indeed, during the hottest days, temperatures above 30 °C were recorded. To ascertain the end of the test, the criterion used was to calculate the integer obtained from the following Equation (10), where Dt is the overall duration of the test in days. This equation is valid for heavy elements with a specific heat capacity higher than 20 kJ/(m2K). Measurements should not deviate more than ±5% from the values measured during this time.
4. Results
4.1. Theoretical U Calculation According to ISO 6946—Simplified Method
In 1 m2 of wall, either DCB or HCB, the surface of each block was 450 × 250 mm2, while the area of ordinary mortar (assumed 10 mm thick) was approximately 0.03 m2 (only horizontal mortar joints were considered to resemble the typical local building practice). Assumed mortar λd 0.75 W/(mK) (Figure 6).
The U-value of the mortar applied in the DCB wall is slightly different from the HCB because it follows the block thickness. The DCB is 2.38 W/(m2K) and the HCB is 2.17 W/(m2K).
For the DCB, the increase in the U-value of the wall due to the presence of ordinary premix mortar, calculated as a weighted average Ub+m, is 0.81 W/(m2K)
For the Ub+m HCB, a similar weighted average can be calculated by simply replacing the related U-value. This average is 2.4 W/(m2K).
As shown in Table 5, the theoretically calculated U-value of the DCB without considering the effects of the mortar is 0.76 W/(m2K) with a relative error of 29%. UDCB then increases up to 7%, 0.81 W/(m2K), when considering ordinary mortars. Since the acceptable limit for the relative error should be equal to or less than 20%, the simplified method is not the correct way to calculate the theoretical UDCB.
The UHCB wall is 2.01 W/(m2K) and the relative error is 1%. This limit is within the limit established by the standard. When corrected to consider the presence of mortars, there is no increase.
It can be noted that the complexity of the DCB geometry has increased the likelihood of a cumulative source of errors within this method. Both isothermal and parallel path calculations, due to the simultaneous presence of a resistive material (PUR foam) and a conductive material (concrete), have led to a significant increase in the acceptable relative error (re), well beyond the limits established by ISO 6946. These uncertainties are probably located around the change in direction of the s-shaped insulation. The overall homogeneity of the HCB mix design and the mortar used have led to a relative error that is within the limit instead. The air cavity’s equivalent thermal resistance is not as high as the PUR insulation, and hence, for this reason, the theoretical calculation for the conventional block was found to be within the limits of ISO 6946.
It is important to note that in the literature [20], a calculation method based on the same principles of ISO 6946’s “simplified method” called the “modified zone method” is proposed. This method can be used for assemblies containing metal elements (with high thermal conductivity) that may locally increase the thermal transmittance of the overall buildup. It consists of the combination of thermal resistance calculated through a parallel path (when the insulation is not interfering with other materials) and an isothermal path when there are local conditions characterized by composite materials.
The authors believe that the significantly high error in the UDCB could be attributed to the stark difference between concrete and PUR thermal conductivity; assessing the theoretical UDCB method may be considered for further research on this aspect alone. This is because the proposed methodology strictly follows the calculation methods described by ISO 6946; hence, the mentioned UDCB cannot be used for comparison with the other methodologies.
4.2. Numerical FEM Analysis According to ISO 6946:2017’s Detailed Method
FEM analysis includes the effect of mortars when solving Fourier’s law. In Figure 7, the results of the simulations show the temperature gradients across the buildup.
It is evident from these images that the DCB isotherms show an evident variation of the heat flux due to the presence of materials with a relevant difference in terms of thermal conductivity (concrete, foam, and cement mortar). The variations are higher in proximity of the change in direction of the insulation layer. The overall results for the UDCB based on the FEM analysis are listed in Table 6.
The weighted average between the four cross-sections is 0.68 W/(m2K).
The arithmetic average between vertical and horizontal sections is 0.71 W/(m2K). This value was chosen for comparison with HFM measurements.
A more uniform set of isotherms is shown throughout the HCB section so that there is no relevant distortion even when geometrical or material changes occur. The overall results for the UHCB based on the FEM analysis are listed in Table 7.
The weighted average between the vertical cross section is 1.97 W/(m2K) (Figure 8).
The arithmetic average between vertical and horizontal section is 1.93 W/(m2K). This value was chosen for comparison with HFM measurements.
4.3. In Situ Measurement of the U-Value via HFM
The generated raw data for the in situ measurements showed significant oscillations in terms of surface temperatures and related heat flux, especially at the beginning of the testing period. A steady single U-Value calculation was therefore not possible to be obtained throughout the entire measurement campaign. ISO 9869-1 specifically recommends extending tests beyond 72 h when the specific heat capacity of the component is above 20 kJ/(kgK). This is certainly the case for the DCB having 278 kJ/(m2K) and HCB having 181 kJ/(m2K). According to Equation (10), the measurement campaign could end after 12 days. Using such an experimental setup, the U-value can be calculated according to the selected timestep of the datalogger (3 min was selected). The surface resistances were assumed to be fixed according to Table 3. The plotted results in Figure 9 are the averages over 24 h for each day of the 12 days considered. Regarding the DCB, it can be observed that the typical range of the thermal transmittance is most of the time within 1 ≤ UDCB ≤ 1.5 W/m2K. The convergence value of UDCB calculated via Equation (9) is 1.47 W/(m2K). Likewise, for the HCB, it can be observed that the typical range of the thermal transmittance is within 2 ≤ UHCB ≤ 3 W/m2K. The UHCB according to the “average method” is 2.41 W/(m2K), which is in good accord with results obtained by Caruana et al. [39].
The relatively long duration of the test could be attributed to the effect of high daily swings of the outdoor temperature and excessive heat stored in the walls. Both walls have a relevant specific heat capacity, as previously mentioned. This increased the oscillation of the U-value, delaying the convergence. It can also be noted that the insulation embedded in the DCB has the beneficial effect of smoothing the peaks as experienced by the HCB. Table 8 shows the comparison between FEM results and the convergence values obtained by the in-situ measurement is shown in Table 8.
It is also worth noting that the values listed in Table 1, when the difference in temperature is above 10 K, are very close to the one measured via HFM. However, the previous studies on the DCB did not report the value of the thermal conductivity of either the foam or the concrete, and so a more detailed comparison is not possible.
According to the authors, the relatively high range of uncertainties and the discrepancy between the theoretical and measured values could be attributed essentially to the thermophysical parameters of the building materials as shown in Table 2.
The declared values assumed in Table 2 may not be truly representative of the actual value of the materials exposed to external environmental conditions. ISO 6946 recommends obtaining the designed thermal conductivity values from the declared data provided by manufacturer in the technical sheets. In this way, designers could expect more realistic values of the thermal transmittance beyond the limits of 23 °C and 50% relative humidity environmental conditions. This difference could be taken into consideration in future papers. Additionally, it is valid to measure the thermal conductivity under laboratory conditions by means of a guarded hot plate, as per the ISO 8302:1991 [43] standard. This methodology requires the sampling of the material, and it is a destructive approach. Alternatively, a hot box apparatus (either calibrated or guarded) could be used according to ISO 8990:1994 [44], wherein a representative sample wall has to be built and monitored under laboratory conditions.
When it comes to the HFM method, the following refinement is being considered:
- To measure the surface resistances (convection and radiation) instead of using the values listed in standards. This can be made possible by adding an extra sensor on top of the HFM transducer;
- To shield both thermocouples and the HFM from direct and diffuse radiation with reflective materials;
- To add another HFM sensor outside to double-check convergence from both sides;
- To quantify the effect of heat storage of high thermal mass components such as the ones considered in this research and compared to corrected heat flux. This approach improves the measurements when in conjunction with thermal conductivity studies.
5. Conclusions
CMU is a popular construction technology manufactured in a variety of thicknesses whose main application is building both load-bearing and non-load-bearing walls. On its own, this basic building technology falls short when there is an exigency to have an energy-efficient facade. This paper has demonstrated that building envelopes built in simple HCB are performing seriously below minimum requirements; therefore, there is an urgent need to address the performance gap between predicted U-values (or R-values) and those values measured on site. Studies of this kind are relevant not only for architects and building engineers but moreover for policy and decision makers who are advised by academics on the establishment of new or upgraded building energy codes.
In this context, the innovative Double C Block (DCB) presented in this paper purports to do just that: raise awareness on the relevance of the building envelope performance gap. The block features an original geometric design wherein a polyurethane (PUR) foam is inserted between two concrete C-shaped layers; this acts as the insulating layer as well as binds the two concrete skins together. This idea outperforms the thermal performance of HCB by completely eliminating the thermal bridging between the concrete skins and by replacing the unvented air cavities with insulation. This approach is different from the traditional geometrical optimization done via a concrete web and an array of unvented air cavities. The role of high performance thermophysical properties is also briefly explored. This paper has also the scope of enriching the set of case studies using the Heat Flow Method (HFM), which, to date, has mostly been applied to single or multilayered walls and less frequently to single-leaf walls made of composite CMU blocks.
Promising results were obtained when assessing the thermal performance of the block against three different methodologies: (i) theoretical steady-state U calculations; (ii) a two-dimensional radiation–conduction steady-state heat-transfer simulation based on FEM; and (iii) in situ monitoring of the U-value by means of the HFM.
The UDCB according to ISO 6946’s ”simplified method” had to be modified due to the effect of ordinary cement mortar leading to a 7% increase, and the value found was 0.81 W/(m2K). However, with a relative error of 29%, higher than the acceptable threshold, this value is less reliable compared to numerical simulation. The reason for this high relative error could be found in the cumulative source of errors because of the combination of thermally different layers (concrete, mortar, and insulation foam). For this reason, the said theoretical UDCB was excluded for comparison with the other methodologies. This is not the case for the HCB, wherein the UHCB is 2.01 W/(m2K) and the effect of the bedding joints of mortars is deemed irrelevant. UHCB was then excluded too for the sake of coherence.
Instead, the output of ISO 6946’s “detailed method” via FEM analysis led to a more reliable UDCB equal to 0.71 W/(m2K), including the effect of mortar. The UHCB was equal to 1.93 W/m2K (approximately 12% lower than “simplified method”).
The results obtained so far show that the first two methodologies corroborate each other, including when the effect of mortar is taken in consideration. The FEM results were eventually compared to in situ monitoring of a full-scale north-facing wall made with the same material used in computer simulations. The in situ results showed that after 12 days of monitoring, campaign data seemed to tend towards the converged value according to eq 10. UDCB converged at 1.47 W/(m2K) and the theoretical value was 51.2% lower than measured one. The UHCB converged at 2.41 W/(m2K) and the theoretical value obtained via FEM value was approximately 19.9% lower than in the in situ campaign.
There is an evident performance gap between predicted and measured U-values, as discussed in the cited scientific literature. Despite this gap, the DCB technology showed superior thermal performance, because of the lower U-value, compared to conventional HCB across all the described methodologies. Moreover, novel DCB is now compliant and actually outperforms the minimum standards of the Maltese building energy code.
Author Contributions
Conceptualization, V.M.B.; methodology, V.M.B., L.C., and S.P.B.; formal analysis, L.C.; investigation, V.M.B. and L.C.; resources, V.M.B.; data curation, L.C.; writing—original draft preparation, L.C.; writing—review and editing, L.C., V.M.B., and S.P.B.; visualization, L.C.; supervision, V.M.B.; project administration, V.M.B. and L.C.; funding acquisition, V.M.B. All authors have read and agreed to the published version of the manuscript.
Funding
This research is the outcome of the Double C-Block project, a three year research project, for which funding was provided by the Malta Council for Science and Technology (MCST) under the Technology Development Programme (TDP) grant reference R&I_2019_010T.
Institutional Review Board Statement
Not applicable.
Informed Consent Statement
Not applicable.
Data Availability Statement
The data generated through all experiments, software, and calculations, as presented in this article, are being made available as an integral part of the article protected by international IP rights. Design geometry of the DCB is protected by a design registration, as filed to the Industrial Property Registrations Directorate, Ministry for the Economy, Investment and Small Business, Government of Malta Design Number 1462.
Acknowledgments
The manuscript is a revised version of an original scientific contribution that was presented at the 17th Sustainable Development of Energy, Water and Environmental Systems (SDEWES) conference held between the 6th and the 10 of November 2022 in Paphos, Cyprus, and that was subsequently invited to be submitted for review for inclusion in a Special Issue of Sustainability dedicated to the said Conference. Compared to the original Conference paper, the abstract, introduction, methodology, and the literature review have been extensively revised and expanded to further explain the research available on the subject matter and to address how the paper tackles existing research gaps. The results and the figure at page 14 were also updated to present an updated analysis, carried out after the deadline for the submission to the said conference. The authors acknowledge the work on the data logging setup by Nicholas Azzopardi and Alex Falzon, Assistant Laboratory Manager and Laboratory Officer, respectively, at the University of Malta. The authors are also grateful to Cementstone Ltd. as the commercial partner in the MCST awarded grant, and Cuschieri Group for providing the fenestration in kind for both test cells.
Conflicts of Interest
The authors declare no conflict of interest.
Nomenclature
| Variable | Name | Unit of Measure |
| Q | Heat Flow | [W] |
| R-value | Thermal Resistance | [(m2K)/W] |
| U-value | Thermal Transmittance | [W/(m2K)] |
| A | Surface of a building component | [m2] |
| Equations (1)–(5) [31] | ||
| Tind | Indoor Ambient Temperature | [°C] |
| Tout | Outdoor Environmental Temperature | [°C] |
| λd | Declared thermal conductivity | [W/mK] |
| Rcomp | Thermal Resistance of the building component | [(m2K)/W] |
| Rsi | Indoor Surface Resistance | [(m2K)/W] |
| Rse | Outdoor Surface Resistance | [(m2K)/W] |
| e | Emissivity | [-] |
| Rtota, …, Rtotq | The total Thermal Resistances from environment to environment for each layer used to calculate the upper limit of total thermal resistance | [(m2K)/W] |
| Rtot upper | The upper limit of the total Thermal Resistance | [(m2K)/W] |
| Rtot lower | The lower limit of the total Thermal Resistance | [(m2K)/W] |
| fa, fb, …, fq | the fractional areas of each section | [-] |
| Rj | Equivalent Thermal Resistance for each thermally inhomogeneous layer for each section used to calculate lower limit of the total thermal resistance | [(m2K)/W] |
| re | relative error | [%] |
| Rtot | The thermal resistance of the buildup calculated with ‘simplified method’ | [(m2K)/W] |
| Utot | The Thermal transmittance of the buildup calculated with ‘simplified method’ | [W/(m2K)] |
| Equations (6)–(8) [42] | ||
| ce | convergence error | [%] |
| T | Temperature Boundary condition | [°C] |
| qf | known heat flux, boundary condition | [W] |
| qc | convection/linearized radiation boundary condition | [W] |
| qr | radiation boundary condition | [W] |
| Adsorption of the single material | [-] | |
| Stefan-Boltzmann constant | [W/(m2K4)] | |
| Adsorption of the single material | V | |
| Irradiation of the surface | [W] | |
| Surface Temperature of the single material | [°C] | |
| Equation (11) | ||
| Ub+m | Weighted Average Thermal Transmittance including effect of Mortars | [W/(m2K)] |
References
- Delmastro, C.; Abergel, T. Building Envelopes; International Energy Agency (IEA): Paris, France, 2021. Available online: https://www.iea.org/reports/building-envelopes (accessed on 12 January 2023).
- United Nations Environment Programme (UNEP). UNEP 2021 Global Status Report for Buildings and Construction: Towards a Zero-Emission, Efficient and Resilient Buildings and Construction Sector. 2021. Available online: https://www.unep.org/resources/report/2021-global-status-report-buildings-and-construction (accessed on 12 January 2023).
- Attia, S. Regenerative and Positive Impact Architecture: Learning from Case Studies; Springer International Publishing: London, UK, 2018. [Google Scholar]
- Questions and Answers on the Renovation Wave. Available online: https://ec.europa.eu/commission/presscorner/detail/en/qanda_20_1836 (accessed on 12 January 2023).
- Environment and Resources Authority (ERA). Long Term Renovation Strategy 2050; Ministry for the Environment, Climate Change and Planning: Valletta, Malta, 2021. Available online: https://environmentcms.gov.mt/en/Pages/longTermRenovationStrategy2050.aspx (accessed on 12 January 2023).
- Janssens, A.; Roels, S.; Vandaele, L. Full Scale Test Facilities for Evaluation of Energy and Hygro-Thermal Performances. 2011. Available online: https://core.ac.uk/download/pdf/55745987.pdf (accessed on 12 January 2023).
- Micallef, L. Improved Thermal Performance of Maltese HCB: The C-Block. Master’s Thesis, University of Malta, Msida, Malta, 2014. [Google Scholar]
- Fiorito, F. Involucro Edilizio e Risparmio Energetico: Soluzioni Progettuali e Tecnologie; Dario Flaccovio Editore: Palermo, Italy, 2009. [Google Scholar]
- Chartered Institution of Building Services Engineers (CIBSE). CIBSE Guide A—Environmental Design, 8th ed.; Chartered Institution of Building Services Engineers (CIBSE): London, UK, 2015. [Google Scholar]
- BS EN 1745:2012; Masonry and Masonry Products. Methods for Determining Thermal Properties. British Standards Institution: London, UK, 2012.
- ISO 10456:2007; Building Materials and Products—Hygrothermal Properties—Tabulated Design Values and Procedures for Determining Declared and Design Thermal Values. International Standard Organization (ISO): Geneva, Switzerland, 2007.
- Al-Hadhrami, L.M.; Ahmad, A. Assessment of thermal performance of different types of masonry bricks used in Saudi Arabia. Appl. Therm. Eng. 2009, 29, 1123–1130. [Google Scholar] [CrossRef]
- Zold, A.; Szokolay, S. Thermal Insulation, PLEA Notes, Note 2. 2001. Available online: http://www.plea-arch.org/index.php/plea-publications/ (accessed on 12 January 2023).
- de Luca Bossa, F.; Verdolotti, L.; Russo, V.; Campaner, P.; Minigher, A.; Lama, G.C.; Boggioni, L.; Tesser, R.; Lavorgna, M. Upgrading sustainable polyurethane foam based on greener polyols: Succinic-based polyol and Mannich-based polyol. Materials 2020, 13, 3170. [Google Scholar] [CrossRef] [PubMed]
- ISO 22007-1:2017; Plastics—Determination of Thermal Conductivity and Thermal Diffusivity—Part 1: General Principles. International Standard Organisation: Geneva, Switzerland, 2017.
- Attia, S.; Eleftheriou, P.; Xeni, F.; Morlot, R.; Ménézo, C.; Kostopoulos, V.; Betsi, M.; Kalaitzoglou, I.; Pagliano, L.; Cellura, M. Overview and future challenges of nearly zero energy buildings (nZEB) design in Southern Europe. Energy Build. 2017, 155, 439–458. [Google Scholar] [CrossRef]
- Feist, W. Design Strategies for Passive Buildings in the Mediterranean; International Passive Haus Institut: Darmstadt, Germany; Available online: https://www.youtube.com/watch?v=ObO20UukNQc&t=370s&ab_channel=InternationalPassiveHouseAssociation (accessed on 12 January 2023).
- Pindar, A.; Zangheri, P.; Pagliano, L.; Schnieders, J. The Passivhaus Standard in Southern Europe. In Proceedings of the Palenc Conference and 28th AIVC Conference on Building Low Energy Cooling and Advanced Ventilation Technologies in the 21st Century, Crete Island, Greece, 27–29 September 2007. [Google Scholar]
- Urban, B.; Engelmann, P.; Kossecka, E.; Kosny, J. Arranging insulation for better thermal resistance in concrete and masonry wall systems. In Proceedings of the 9th Nordic Symposium on Building Physics, Tampere, Finland, 29 May–2 June 2011. [Google Scholar]
- American Society of Heating, Refrigerating and Air-Conditioning Engineers (ASHRAE). Ashrae Fundamentals 2017; SI Edition; ASHRAE: Peachtree Corners, GA, USA, 2017; pp. 752–764. [Google Scholar]
- Lacarrière, B.; Lartigue, B.; Monchoux, F. Numerical study of heat transfer in a wall of vertically perforated bricks: Influence of assembly method. Energy Build. 2003, 35, 229–237. [Google Scholar] [CrossRef]
- del Coz Díaz, J.J.; García Nieto, P.J.; Álvarez Rabanal, F.P.; Lozano Martínez-Luengas, A. Design and shape optimization of a new type of hollow concrete masonry block using the finite element method. Eng. Struct. 2011, 33, 1–9. [Google Scholar] [CrossRef]
- Li, L.P.; Wu, Z.G.; He, Y.L.; Lauriat, G.; Tao, W.Q. Optimization of the configuration of 290 × 140 × 90 hollow clay bricks with 3-D numerical simulation by finite volume method. Energy Build. 2008, 40, 1790–1798. [Google Scholar] [CrossRef]
- Bustamante, W.; Bobadilla, A.; Navarrete, B.; Vidal, S.; Saelzer, G. Thermal Improvement of Perforated Ceramic Bricks. Rev. Constr. 2009, 8, 24–35. [Google Scholar]
- Janssens, A. Inventory of Full-Scale Test Facilities for Evaluation of Building Energy Performances. International Energy Agency, EBC Annex 58, Reliable Building Energy Performance Characterisation Based on Full Scale Dynamic Measurements. 2016. Available online: https://www.iea-ebc.org/Data/publications/EBC_PSR_Annex_58.pdf (accessed on 12 January 2023).
- Evangelisti, L.; Guattari, C.; Gori, P.; Vollaro, R.D. In-situ Thermal Transmittance Measurements for Investigating Differences between Wall Models and Actual Building Performance. Sustainability 2015, 7, 10398. [Google Scholar] [CrossRef] [Green Version]
- Cucumo, M.; Rosa, A.D.; Ferraro, V.; Kaliakatsos, D.; Marinelli, V. A method for the experimental evaluation in-situ of the wall conductance. Energy Build. 2006, 38, 238–244. [Google Scholar] [CrossRef]
- Ahmad, A.; Maslehuddin, M.; Al-Hadhrami, L.M. In-situ measurement of thermal transmittance and thermal resistance of hollow reinforced precast concrete walls. Energy Build. 2014, 84, 132–141. [Google Scholar] [CrossRef]
- Dudek, S.M.; Armstrong, S.; Stamatiou, G. Thermal performance of insulated concrete blocks: Series of in-situ measurements of the thermal transmittance of a range of masonry wall construction undertaken, discrepancies of 25% were found between measurements and approved calculation methods. Build. Res. Inf. 1993, 21, 36–41. [Google Scholar] [CrossRef]
- Asdrubali, F.; D’Alessandro, F.; Baldinelli, G.; Bianchi, F. Evaluating in-situ thermal transmittance of green buildings masonries—A case study. Case Stud. Constr. Mater. 2014, 1, 53–59. [Google Scholar] [CrossRef]
- ISO 6946:2017; Building Components and Building Elements—Thermal Resistance and Thermal Transmittance—Calculation Methods. International Standard Organization: Geneva, Switzerland, 2017.
- Baker, P. U-values and traditional buildings: In-situ measurements and their comparisons to calculated values. Hist. Scotl. Tech. Pap. 2011, 10, 70. [Google Scholar]
- Gaspar, K.; Casals, M.; Gangolells, M. A comparison of standardized calculation methods for in-situ measurements of façades U-value. Energy Build. 2016, 130, 592–599. [Google Scholar] [CrossRef]
- ISO 9869-1:2014; Thermal Insulation-Building Elements—In-Situ Measurement of Thermal Resistance and Thermal Transmittance—Part 1: Heat Flow Meter Method. International Standard Organization (ISO): Geneva, Switzerland, 2014.
- Evola, G.; Marletta, L.; Marino, C.; Nucara, A.; Panzera, M.F.; Pietrafesa, M.; Taverriti, A.M.; Tronchin, L. Experimental measurement of thermal transmittance in reinforced concrete buildings. In Proceedings of the 2020 IEEE International Conference on Environment and Electrical Engineering and 2020 IEEE Industrial and Commercial Power Systems Europe (EEEIC/I & CPS Europe), Madrid, Spain, 9–12 June 2020; IEEE: Piscataway, NJ, USA, 2020; pp. 1–5. [Google Scholar] [CrossRef]
- Rasooli, A.; Itard, L. In-situ characterization of walls’ thermal resistance: An extension to the ISO 9869 standard method. Energy Build. 2018, 179, 374–383. [Google Scholar] [CrossRef]
- Atsonios, I.A.; Mandilaras, I.D.; Kontogeorgos, D.A.; Founti, M.A. A comparative assessment of the standardized methods for the in–situ measurement of the thermal resistance of building walls. Energy Build. 2017, 154, 198–206. [Google Scholar] [CrossRef]
- ASTM C1155-95(2007); Standard Practice for Determining Thermal Resistance of Building Envelope Components from the In-Situ Data. American Society for Testing and Materials International (ASTM): West Conshohocken, PA, USA, 2014.
- Caruana, C.; Yousif, C.; Bacher, P.; Buhagiar, S.; Grima, C. Determination of thermal characteristics of standard and improved hollow concrete blocks using different measurement techniques. J. Build. Eng. 2017, 13, 336–346. [Google Scholar] [CrossRef] [Green Version]
- Building Regulation Office (BRO). Document F—Conservation of Fuel, Energy and Natural Resources (Minimum Requirements on the Energy Performance of Buildings, 2015); Government of Malta: Valletta, Malta, 2015.
- ISO 10211:2017; Thermal Bridges in Building Construction—Heat Flows and Surface Temperatures—Detailed Calculations. International Standard Organization (ISO): Geneva, Switzerland, 2017.
- Finlayson, E.; Mitchell, R.; Arasteh, D.; Huizenga, C.; Curcija, D. THERM 2.0; Program Description. A PC Program for Analyzing the Two-Dimensional Heat Transfer through Building Products; Lawrence Berkeley National Laboratory: Berkeley, CA, USA, 1998. [Google Scholar]
- ISO 8990:1994; Thermal Insulation—Determination of Steady-State Thermal Transmission Properties—Calibrated and Guarded Hot Box. International Standard Organization (ISO): Geneva, Switzerland, 1994.
- ISO 8302:1991; Thermal Insulation—Determination of Steady-State Thermal Resistance and Related Properties—Guarded Hot Plate Apparatus. International Standard Organization (ISO): Geneva, Switzerland, 1991.
Figure 1.
Conventional HCB (a) and the new DCB (b).
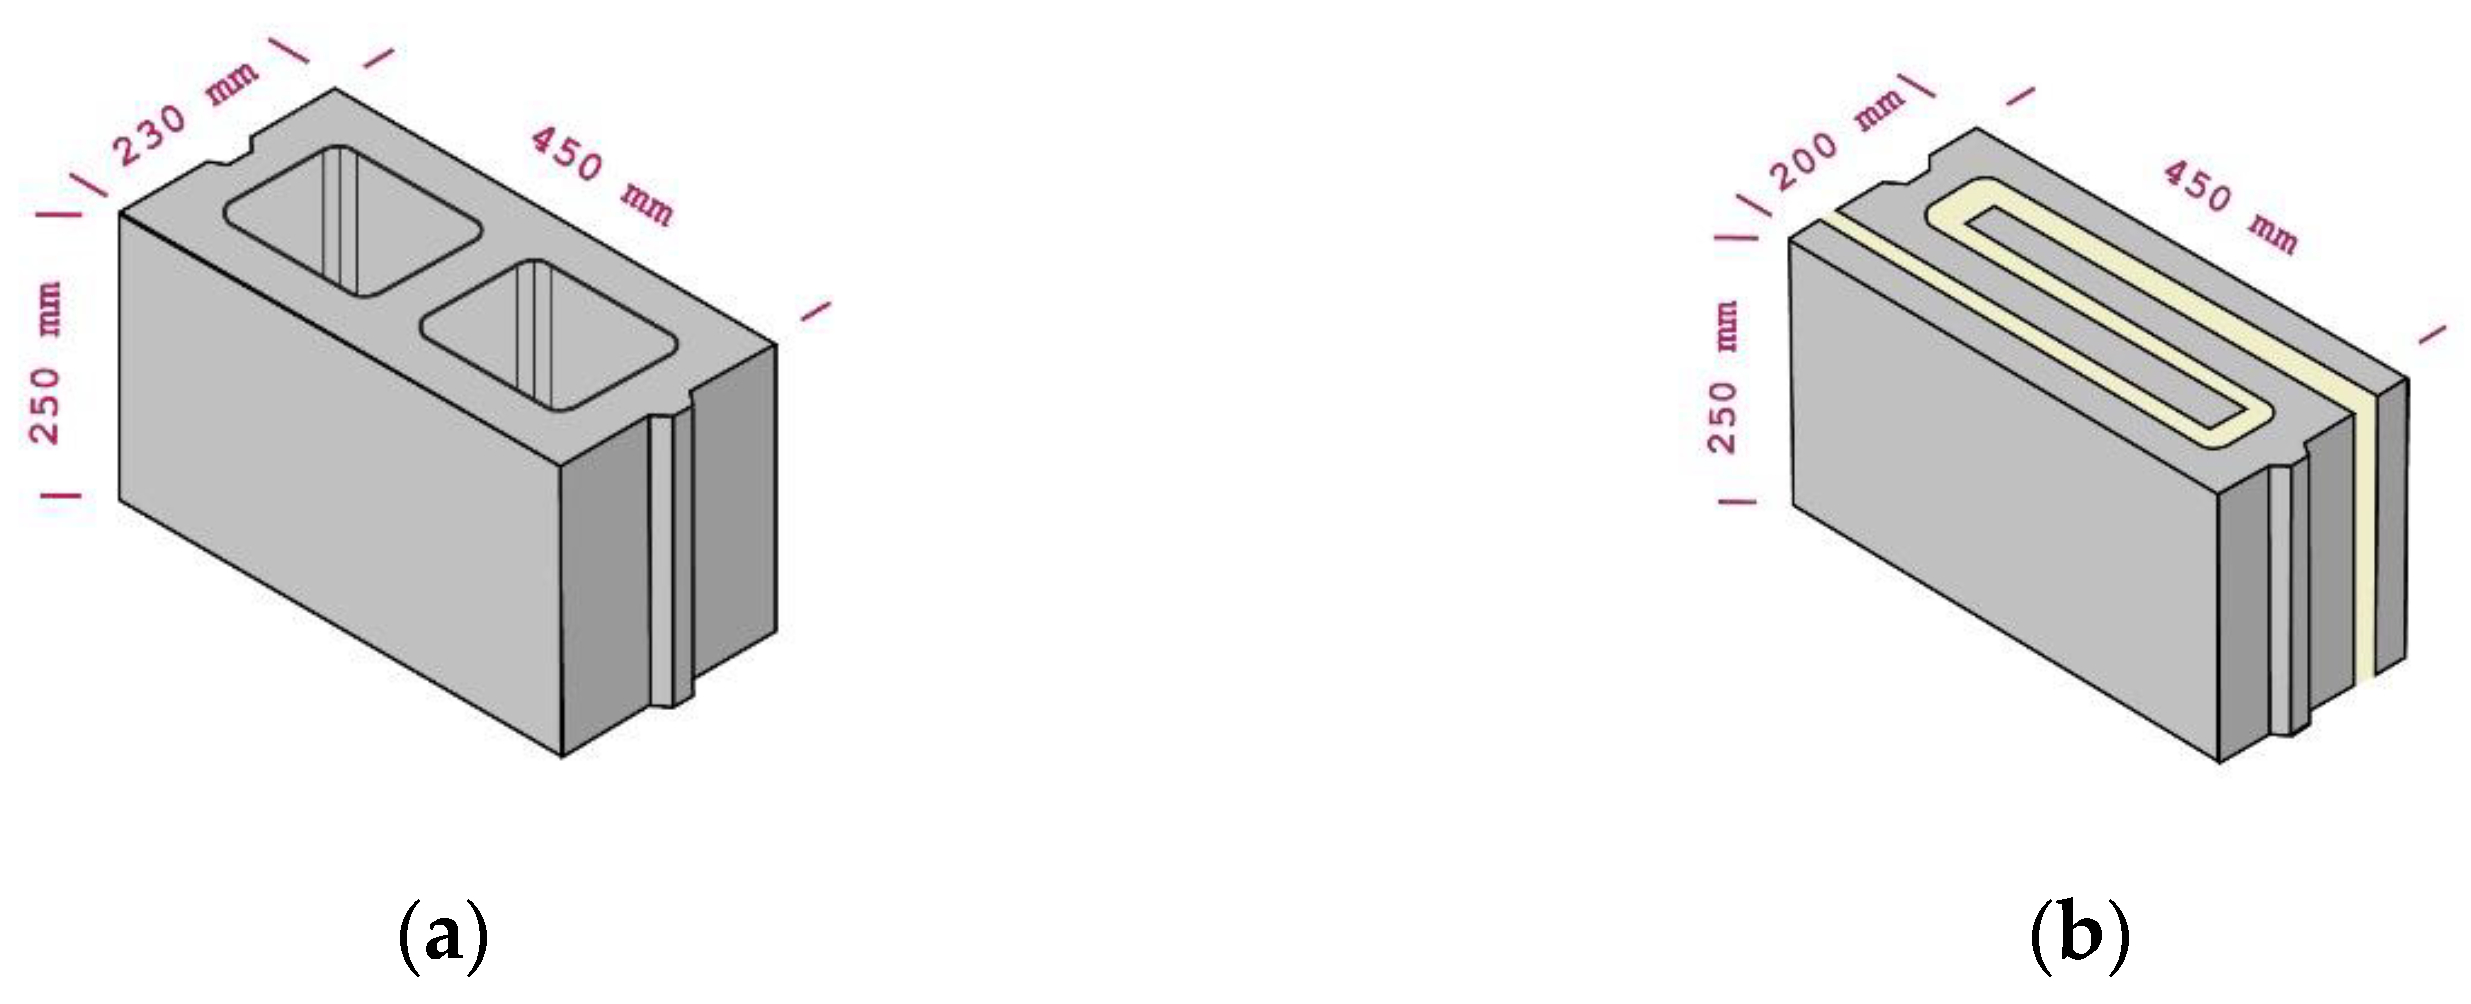
Figure 2.
(a) Overall dimensions of the test cells (top) and test cells as built at the University of Malta campus. (b) Axonometric view of the HCB and DCB test cell’s external fabric, wall, and roof layers.
Figure 2.
(a) Overall dimensions of the test cells (top) and test cells as built at the University of Malta campus. (b) Axonometric view of the HCB and DCB test cell’s external fabric, wall, and roof layers.

Figure 3.
DCB-Schematic representation of the block dimensions (a) and the electrical analogy used for ISO 6946’s “simplified method” (b); all dimensions in mm.
Figure 3.
DCB-Schematic representation of the block dimensions (a) and the electrical analogy used for ISO 6946’s “simplified method” (b); all dimensions in mm.

Figure 4.
HCB-Schematic representation of the block dimensions (a) and the electrical analogy used for ISO 6946’s “simplified method” (b); all dimensions in mm.
Figure 4.
HCB-Schematic representation of the block dimensions (a) and the electrical analogy used for ISO 6946’s “simplified method” (b); all dimensions in mm.

Figure 5.
(a) Thermal image to ensure that the HFM location was representative of the wall; (b) outdoor and (c) indoor thermocouples and HFM sensor attached on the north façades of both test cells.
Figure 5.
(a) Thermal image to ensure that the HFM location was representative of the wall; (b) outdoor and (c) indoor thermocouples and HFM sensor attached on the north façades of both test cells.

Figure 6.
Diagram of the wall dimensions including the layer of mortar.

Figure 7.
DCB wall: the four sections used to calculate the UDCB; all units in °C.

Figure 8.
HCB wall: the calculated U and relative convergence; all units in °C.

Figure 9.
Plotted results of the U-value measurement campaign lasted twelve days.


Table 1.
The U-value obtained via a hotbox apparatus (adapted from Micallef [7]).
Table 1.
The U-value obtained via a hotbox apparatus (adapted from Micallef [7]).
| Test Name | 1 | 2 | 3 | 4 | 5 | 6 | 7 |
|---|---|---|---|---|---|---|---|
| U-value [W/(m2K)] | 0.69 | 0.67 | 0.72 | 0.90 | 1.04 | 1.14 | 1.24 |
| ΔT [K] | 4.41 | 3.26 | 5.85 | 10.46 | 14.93 | 19.21 | 23.32 |
| Power [W] | 15.23 | 15.23 | 30.46 | 60.79 | 90.24 | 121.21 | 153.5 |
Table 2.
List of material properties used for theoretical and FEM calculations.
| Material Name | Thickness [m] | λd [W/(mK)] | e [-] | Specific Heat Capacity [J/(kgK)] | Density [kg/m3] | Source |
|---|---|---|---|---|---|---|
| Cement Mortar | 0.01 | 0.72 | 0.93 | 920 | 1860 | [9] |
| Lime and Cement Render (Fassa Bortolo KC1) | 0.01 | 0.55 | 0.91 | 840 | 1530 | Product Datasheet |
| Gypsum Plaster (Alcitek Gold) | 0.01 | 0.43 | 0.91 | 960 | 860 | Product Datasheet |
| Concrete (Load Bearing) | 0.05 | 0.8 | 0.93 | 840 | 1900 | [9] |
| Spray PUR foam | 0.03 | 0.029 | 0.91 | 1470 | 30 | [9] |
| Unvented air cavity | 0.130 | 1.01 | - | 1007 | 1.23 | [10] |
Table 3.
List of boundary conditions applied in ISO 6946’s "simplified method” and FEM analysis.
| Boundary Condition Name | DBT [°C] | Surface Resistance Rs [m2K/W] | 1/Rs [W/(m2K)] | Source |
|---|---|---|---|---|
| Adiabatic | 0 | 0 | 0 | [42] |
| Exterior Surface Resistance— (Horizontal) | 10 | 0.04 | 25 | ISO 6946 |
| Indoor Surface Resistance— (Horizontal) | 20 | 0.13 | 7.69 | ISO 6946 |
Table 4.
List of the equipment used during HFM in situ monitoring.
| Instrument | Range | Accuracy |
|---|---|---|
| HOBO Loggers UX100 | DBT: −20° to 70 °C | ±0.21 °C (0 to 50 °C) |
| RH: 15% to 95% | ±3.5% (25% to 85%) | |
| Hukesflux HFP01 | 2000 W/m2 | ±5% |
| N.I. 9238 datalogger | ±0.5 V | ADC Volt. Res. ±0.0596 μV |
| Thermocouples type T | −250 °C + 300 °C | ±0.5 °C |
| NI 9213 datalogger | −40 °C to 70 °C | ±0.8 °C |
Table 5.
Application of the “simplified method” to the DCB and HCB with and without mortar joints.
| Metric | DCB | HCB |
|---|---|---|
| Rtot, upper [m2K/W] | 1.69 | 0.500 |
| Rtot, lower [m2K/W] | 0.939 | 0.494 |
| Rtot [m2K/W] | 1.32 | 0.497 |
| Utot [W/(m2K)] | 0.76 | 2.01 |
| re | 29% | 1% |
| Umortar [W/(m2K)] | 2.38 | 2.17 |
| Ub+m [W/(m2K)] | 0.81 | 2.01 |
Table 6.
UDCB calculated via FEM according to ISO 6946’s “detailed method”.
| Section Plane | Plan View (a) | Section AA (b) | Section BB (c) | Section CC (d) |
|---|---|---|---|---|
| UDCB [W/(m2K)] | 0.74 | 1.14 | 0.56 | 1.14 |
| Convergence [%] | 3.95 | 4.80 | 3.73 | 4.26 |
Table 7.
UHCB calculated via FEM according to ISO 6946’s “detailed method”.
| Section Plane | Plan View (a) | Section AA (b) | Section BB (c) |
|---|---|---|---|
| UHCB [W/(m2K)] | 1.89 | 1.93 | 2.04 |
| Convergence [%] | 2.17 | 0.42 | 0.14 |
Table 8.
Comparison of the U-values obtained according to ISO 6946’s “detailed method” and ISO 9869-1’s “average method”.
Table 8.
Comparison of the U-values obtained according to ISO 6946’s “detailed method” and ISO 9869-1’s “average method”.
| Wall | FEM Analysis [W/(m2K)] | HFM ‘Average Method’ [W/(m2K)] | Difference |
|---|---|---|---|
| DCB | 0.71 | 1.47 | 51.2% |
| HCB | 1.93 | 2.41 | 19.9% |
Disclaimer/Publisher’s Note: The statements, opinions and data contained in all publications are solely those of the individual author(s) and contributor(s) and not of MDPI and/or the editor(s). MDPI and/or the editor(s) disclaim responsibility for any injury to people or property resulting from any ideas, methods, instructions or products referred to in the content. |
© 2023 by the authors. Licensee MDPI, Basel, Switzerland. This article is an open access article distributed under the terms and conditions of the Creative Commons Attribution (CC BY) license (https://creativecommons.org/licenses/by/4.0/).
Share and Cite
MDPI and ACS Style
Caruso, L.; Buhagiar, V.M.; Borg, S.P. The Double C Block Project: Thermal Performance of an Innovative Concrete Masonry Unit with Embedded Insulation. Sustainability 2023, 15, 5262. https://doi.org/10.3390/su15065262
AMA Style
Caruso L, Buhagiar VM, Borg SP. The Double C Block Project: Thermal Performance of an Innovative Concrete Masonry Unit with Embedded Insulation. Sustainability. 2023; 15(6):5262. https://doi.org/10.3390/su15065262
Chicago/Turabian StyleCaruso, Luca, Vincent M. Buhagiar, and Simon P. Borg. 2023. "The Double C Block Project: Thermal Performance of an Innovative Concrete Masonry Unit with Embedded Insulation" Sustainability 15, no. 6: 5262. https://doi.org/10.3390/su15065262
Note that from the first issue of 2016, this journal uses article numbers instead of page numbers. See further details here.