
Investigation of Dynamic Processes of Rolling Stock–Track Interaction: Experimental Realization


1
Institute of Mechanical Engineering and Transport, Lviv Polytechnic National University, 79000 Lviv, Ukraine
2
Faculty of Mechanical Engineering and Design, Kaunas University of Technology, Studentų Str. 56, 51424 Kaunas, Lithuania
3
Department of Technical Mechanics, Ukrainian State University of Science and Technologies, 49010 Dnipro, Ukraine
*
Author to whom correspondence should be addressed.
Sustainability 2023, 15(6), 5356; https://doi.org/10.3390/su15065356
Submission received: 14 February 2023
/
Revised: 12 March 2023
/
Accepted: 14 March 2023
/
Published: 17 March 2023
(This article belongs to the Special Issue Sustainable Railway Infrastructure and Rolling Stock)
Abstract
:The dynamic process of the railway track–rolling stock interaction is characterized by time-dependent dynamics that are determined by both the varying characteristics of the interaction objects and the varying climatic conditions. This study investigated the effect of different groups of influence on the dynamic process, with a view towards the reduction of the cases of randomness during the registration of the process in experiments and an expansion of the understanding of the processes happening during the assessment of the registered data. The static nature of the rolling stock has been demonstrated to be not uniform and to influence the scattering of dynamic values under the variation of vertical and horizontal forces due to the characteristics of a rolling stock. The position of the rolling stock truck relative to the track axis during the movement of the rolling stock has been shown to enhance static non-uniformity. The results of the longitudinal force measurements under the three-point and Schlumpf methods have suggested that it is necessary to investigate the process of rail warping under the action of the rolling stock wheels. To enhance the output of the experiments, it is proposed to consider not only the stiffness of the basis of the oscillatory processes that imitate the physical process of oscillation of the system elements by means of the oscillation amplitude, but also the time of response to the oscillation process by using and assessing the triggering time rather than the frequencies of the oscillation processes.
1. Introduction
Although usually the most expensive element of any knowledge-building activity, experiments are an inseparable aspect of any new knowledge and are necessary to verify theories, upscale theories to cover more than one area, determine correlation dependencies in order to reinforce existing theories, and verify and validate technosphere objects. In fact, tracking conditions are also experiments that take place over time [1,2,3,4,5].
Analysis of the existing methodologies for the conduction of experiments utilized in the verification and validation of rail track elements and structures, and in the investigation of the influential issues of rolling stock on rail tracks [6,7,8,9,10,11], has suggested that the concepts and ideas about the process to be measured, based on the theoretical fundamentals of determining strength, stability, and fatigue strength [12,13,14,15,16,17,18,19], are the determining factors during the setup of an experiment. These properties of the elements and structures determine their suitability for their intended functions under the defined operating conditions and the maintenance system. Nevertheless, the above properties do not account for the aspects of functional safety, i.e., for the rationale behind the use of these properties on the basis of risk assessment.
Consideration of the aspects related to the operation of transport infrastructure throughout its life cycle is closely related to the aspects of design, operation, and repair of two components: the elements and structure of the rail track and the elements and structures of the rolling stock [20,21,22,23,24,25,26,27,28,29,30]. Consideration of the requirements of both components helps explore and understand the nature of the development of certain phenomena [31,32] in the process of the interaction between the components. These phenomena influence the functional safety of transport infrastructure [33,34,35,36,37,38,39,40,41,42,43].
The difficulty lies in the fact that the interaction between track structure and rolling stock is a dynamic process, and the technical condition of both the track structure and its elements is determined by dynamic change. Dynamic change occurs during operation and depends on the influence of the characteristics of the impact of the rolling stock [44,45,46] and on the influence of changing climatic conditions. Geometric measurements are a considerable part of the measurements that characterize the condition of the track [4,47,48,49,50,51]. They are included in the track condition monitoring system [52,53,54,55,56,57,58,59] to determine the beginning of the technical states that require intervention to restore the operable state to a certain level. Exploring the causes of these technical states is the basis for a longer time-dependent track state prediction [60,61,62,63,64,65,66,67,68,69,70]. However, the variety of factors that are present in different spans of the rail track and influence its state impede attempts to understand the patterns behind the variation of the dynamic processes of the vehicle–track interaction, adjusted for the effect of the structure of the state of the track as a whole and of its individual elements. Therefore, the present paper aims to identify and investigate the conditions that restrict the assessment of dynamic processes of vehicle–track interaction by means of experiments on the action of the rolling stock on the rail track.
2. Measurement Methods
Resistance strain gauge schemes installed on the rail track and depicted in Figure 1 were used to measure the dynamic vertical forces exerted by the wheels of the rolling stock on the rails. Resistance strain gauges 1–2 were installed in pairs on the rail web on the inner and outer sides of the rail, at the level of the neutral axis of the rail in the rail section of interest. The required number of rail sections to measure the vertical forces was determined by using the respective software application and testing methodology. The general rule was that the minimum number of sections was 8 for the turnouts and 16 for other tested spans [69].
A calibration check of the strain gauge schemes was performed by running the rolling stock or applying the reference loads. The rolling stock moved at the velocity of 5 to 10 km/h [69]. The respective loads were considered static and were equated to the values determined for each wheel during weighing.
To measure the lateral forces exerted on the rail head, the resistance strain gauge schemes installed on the rail or for the rolling stock wheel plates (strain gauge–wheel pairs) were used. The strain gauge schemes installed on the rail can be used to measure the lateral forces by one of the following two methods:
- Method 1 involves experimentally determined tensile stress values on the lateral side of the rail base and the outer side of the rail head (three-point method) [69].
To obtain the lateral force value, it is first necessary to determine the stress on the lateral sides of the rail base and at the outer side of the rail head by using Method 1. To determine the stress on the outer side of the rail head, the resistance strain gauge was installed 13 mm lower than the wheel rolling surface on the rail. The sensor layout is presented in Figure 2.
- Method 2 is based on the difference between the opposite bending moments emerging in the rail web under the action of lateral forces (Schlumpf method) [69].
Under the Schlumpf method, the resistance strain gauge schemes installed on the rail web are used to measure the lateral forces based on the difference between the opposite bending moments emerging in the rail web under the action of lateral forces. Strain gauges 1–4 (Figure 3) were placed in pairs in the measured section of the rail on the inner and outer sides of the rail web. The longitudinal axis of the strain gauges was located above the neutral axis of the rail cross-section (strain gauges 1 and 2) and under the neutral axis (strain gauges 3 and 4) in the sections with uniform web thickness.
3. Measurement Analysis Results
As noted above, this article investigates the rail track under the action of the rolling stock. In the analysis of restraining conditions of assessment of the dynamic processes of vehicle–track interaction during the experiments, it was first necessary to establish the approach towards this issue.
According to the existing approach, the oscillation process registered by the sensors during the movement of the rolling stock was considered. In this case, the focus is placed on the result of the superposition of various oscillations registered at a certain location of the sensor and transferred further in view of the connection schemes for subsequent processing and analysis. For example, a stage microphone during an orchestral performance registers the time-dependent composition of the scores of each musical instrument rather than each score of each individual instrument. Moreover, each sensor registers the oscillations not only at a certain location, but also in a certain direction.
The described approach deals with a process that involves a multitude of different factors that affect the registration process. These factors belong to the following main groups of influence: (a) characteristics of the rolling stock [71,72,73,74]; (b) movement mode of the rolling stock [75,76,77,78]; (c) climatic conditions [79,80,81]; (d) length- and depth-wise characteristics of the rail track structure [29,82,83,84,85]; (e) characteristics of the measurement equipment [86,87,88,89,90]; and (f) registration techniques [91,92,93,94,95,96,97,98,99].
Hence, analysis of the dynamic process was performed on the basis of the collected statistics provided by the similarly installed sensors at different locations without considering the causes behind the oscillation of sensors during the passage of the rolling stock.
The above approach is fully acceptable for the determination of maximum values during registration. However, it involves an excessively large number of random factors; therefore, it is not suitable for the assessment of the dynamic processes that occur in the track structure during the passage of the rolling stock. Figure 4 shows the sensor layout on the straight track span and the rolling stock that exerted the influence under evaluation. The geometric characteristics of the railway track during the experiment corresponded to a good technical condition. The stiffness modulus was 25 MPa.
Therefore, for the purpose of subsequent analysis, the influence of the specified groups on the dynamic process was investigated in view of the reduction in the randomness of the occurrences during the process registration in the experiment. The analysis was performed using the experimental data obtained during the tests on the influence of passenger rolling stock on the rail track.
Figure 5 and Figure 6 show photographs of the actual layout of the sensors in the span and a fragment of the wagon truck.
The vertical static load had to be determined by weighing in order to conduct the experiments. The static vertical load was considered to be the load of the rolling stock unit on the rail per pair adjusted for the actual position of the center weight of the bolster assembly. Wheel weighing of the rolling stock units was performed to determine the conditions of its state of serviceability (operating condition).
The results presented in Table 1 demonstrate the non-uniformity of not only the axle weight values of wagons of the same type, but also the weight difference between the wheels on the same axle. These characteristics belong to group (a) (characteristics of the rolling stock) and are considered primarily in the investigation of occurrences of randomness during registration of the force actions by the rolling stock on the track. This is absolutely acceptable for any unit of a loaded rolling stock, but implies a considerably non-uniform static character of the rolling stock. This non-uniformity subsequently affected the scatter of dynamic values during the measurement of vertical and horizontal forces in the experiment. These characteristics belong to group (b) (movement mode of the rolling stock) and amplify the factor of randomness occurrences during the registration of the vehicle–track interaction process in the experiment. The results presented in Table 1 demonstrate the non-uniformity of not only the axle weight values of wagons of the same type, but also the weight difference between the wheels (wheel profile PRICAR R7) on the same axle.
Figure 7 shows (i) the values of vertical forces obtained during the wagon wheel weighing; (ii) the values registered for one of the passages of the rolling stock through the defined zone; and (iii) the interval of the maximum values observed during the unification of data for all axes and points of measurement during all the passages at the same speed as a single passage. It should be noted that two samples were automatically formed during the sampling: one sample for loaded wheels, and another for unloaded wheels. As a result, two values of the maximum observed dimensions were obtained.
For the purpose of the existing methodology, to assess the influence of vertical forces on the rail track, the values of vertical forces should not exceed the dynamic load (210 kN) exerted by the wheel on the rail [69]. The permitted value must not be exceeded, and the bottom values were not the limiting factor, as the investigation deals with the influence of the passenger wagons. The indicated value of the allowed load was considerably higher than the load resulting from the influence of the passenger wagons. This implied a possible 2-fold increase in the dynamic value of vertical load for specific rolling stock in relation to static load. This situation is related to the principles of elasticity theory that underpin the measurement methodology, as this approach is aimed at the identification of maximum values. Restraining requirements were introduced to rule out the ambiguity of the situation. The first requirement was the correspondence of the random values measured in the experiment to the normal distribution, i.e., the non-uniformity of the influence of different factors on the analyzed value, and the values not corresponding to this distribution were ruled out from the consideration. The second requirement was that the values scattered in the sample within the respective recommended value of the coefficient of variation should be considered. In view of this requirement, the sampling was performed without an analysis of the causes of elimination of the values measured in the experiment. As suggested in Figure 7, the results of the single passage did not meet the requirements set above and were excluded from consideration. The reason for the elimination was that the results were considerably lower than the values that met the above requirements. The results related to these values are presented in Figure 5 as an interval of maximum values during the unification of the data for all axes and measurement points. However, the scatter of dynamic values of the vertical forces measured in the experiment was determined by factors such as the wheel pair relative to the track section equipped with the sensors that formed the contact plane for each section, as well as the function that characterized the pattern of the variation of wheel–rail interaction (change of value and direction) within the contact plane during the interaction period for each track section. The two samples, based on the results of the recording of lateral forces and stresses at the edges of the rail foot, were automatically formed in the same way, and unification was carried out according to the position of the wheel pair relative to the track axis. The difference between them was only the number of combined values, which is explained by the different number of sensors used to measure the values of lateral forces and stresses at the edges of the rail foot in the experiment. As a result, samples were proposed with minimum to maximum intervals of values of 18.28 to 48.76 kN for lateral forces and 17.92 to 80.87 MPa for stresses at the edges of the rail foot. Therefore, there should be a range of dynamic values of vertical forces observed during the influence of specific static loads exerted by the wheels on the rails during the movement of the wheels at different velocities. The range should be determined by the two factors mentioned above and characterize the influence of the rolling stock on the track.
The maximum values of vertical forces themselves did not qualify as functional safety of the influence of the rolling stock. The reason was that, in accordance with elasticity theory, the track elements and structure accepted the mode for which they had initially been designed under the influence of quasi-dynamic vertical and horizontal loads rather than the complex processes that would vary and accumulate over time. These processes will lead to loss of stability and the emergence of defects in the tracks and structures under the action of dynamic forces with vertical, horizontal, and longitudinal components.
The investigated time of the rolling stock truck had the lowest number of random factors that influenced the value of the dynamic forces exerted by the truck wheels on the rail. This was related to the single-axle type of truck (Figure 6) used; that is, the influence of a single force was considered. Moreover, the truck structure restrained the swaying motion as the truck was a tilting train-type truck. Therefore, the possibility of dynamic increases due to the effect of the wheels of neighboring trucks was ruled out, and the deviation range of the dynamic increases related to the values of the direction of the force during movement was restricted. The dimension of the direction of the force from the wheels to the rails was related to several factors.
First, rolling stock trucks are known to have a sinusoidal movement shape along the track in the case of an ideal track condition and ideal mode of movement of the rolling stock. Under the conditions defined, the wheel pair showed a symmetrical movement trajectory along the rail track during movement. The trajectory may be represented as the movement from the central position of the wheel pair relative to the track (the position where the track axis matched the kinetic axle of the rolling stock) towards the outer rail (reaching the maximum deviation from the central position by either resting and scrolling of the wheel on the rail or smooth turning without resting on the wheel). Then, the reverse movement to the central position of the wheel pair relative to the track took place. The following part of the movement towards the inner rail could be considered as a reverse symmetry of the preceding movement of wheels towards the outer rail. Detailed analysis of this movement showed that the force of action of the wheels on the rail during its projection had not only vertical and/or horizontal components, but also a longitudinal component that influenced the dynamic increment of vertical forces without restraint, as an increment caused by the restraint of the horizontal forces during a tilting train-type truck movement. The principles of elasticity theory ruled out any consideration of the influence of longitudinal forces on the rail track. Longitudinal forces were not considered in rail track strength and stability calculations. Moreover, elasticity theory does not consider the warping of the rail section in general and, specifically, in the evaluation of the share of influence of the longitudinal forces. Therefore, typical experiments do not involve the registration of these forces. In the experiment carried out as part of the study, the installed sensors were used to record warping processes in both the longitudinal sections and the cross-sections of the rail. Warping in the cross-section of the rail was of particular interest, as it is usually not accounted for during the design of the clamping structures for the reinforced concrete sleepers of different configurations. For the purpose of comparison, the sensors measuring the forces in the cross-section of the rail by using the three-point method and the Schlumpf method were installed. Furthermore, the sensors measuring the lateral forces using the Schlumpf method were installed at different positions: sensors 1 and 2 and sensors 3 and 4 were positioned in the same section at distances of 50 and 100 mm from each other (Figure 8). According to the results of the experiment, the horizontal force was adequate with respect to the values measured using method 1 (the three-point method) with the sensors offset by 50 mm compared to the values provided by the sensors positioned in the same section or offset by 100 mm. The processes recorded by the sensors that were installed without an offset differed significantly from the other two cases, both by sign and by the horizontal force values, which were 1.26 to 1.63 times higher than the values registered by the sensors offset by 50 mm. The processes registered by the sensors offset by 50 mm and 100 mm were similar in their nature. The force values registered by the sensors offset by 100 mm were 1.1 to 2 times lower than the force values registered by the sensors offset by 50 mm. Thus, there was a range of dynamic forces characterized by a certain range of vertical, horizontal, and longitudinal components. The probability of its occurrence was determined by the probability of the occurrence of certain types of wheel-to-rail contact.
Table 2 presents the width values of the wheel-to-rail contact zone and the values of the clearances δ between the rail and wheel flange in the case of the functionally safe wheel-to-rail contact. It should be noted that the experiment took place on a track section with a track gauge of 1520 mm and the railway track design included rails of the P65 type, which is absolutely non-standard for European road conditions, so these tables were obtained in the process of modeling, taking into account the design features of the track.
A change in the width of the wheel-to-rail contact zone of the rolling surface led to a change in the deformity process inside the rail even in the case of single-point contact of the rail head with the rolling surface and uniform force direction. This was related to the fact that the directions of the force influence inside the rail tended to change during the travel of the contact plane along the specified zones.
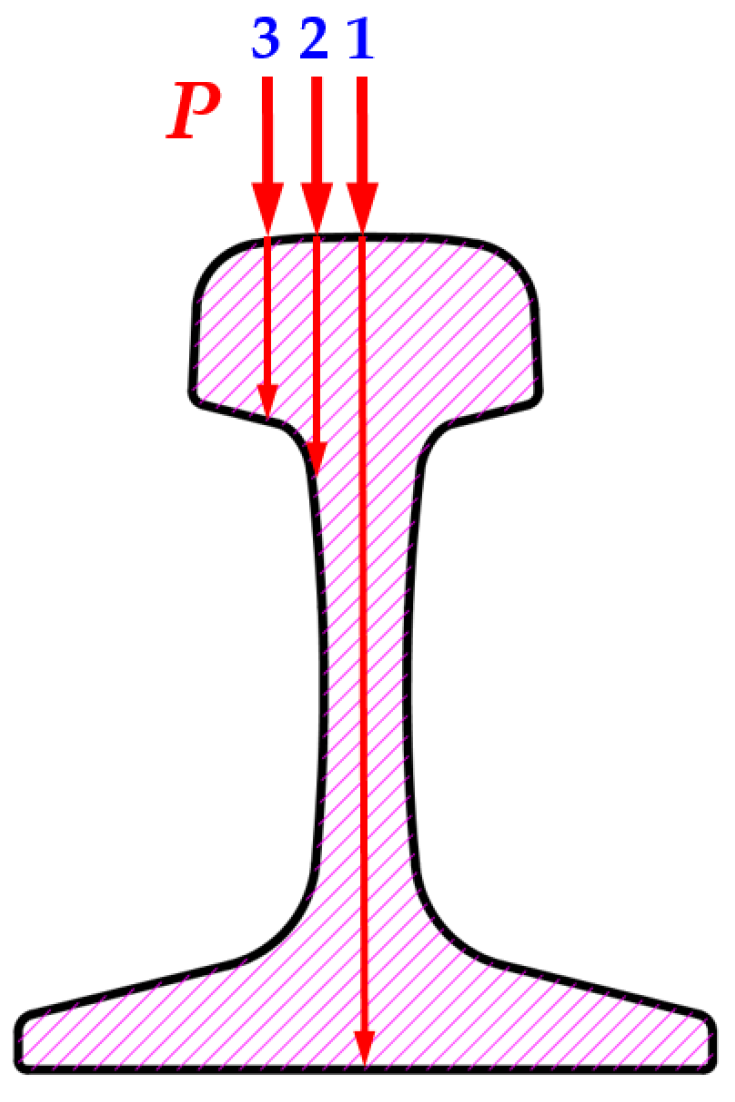
Thus, in the same direction of the influence of external vertical force displaced transversally to the rail head, the influence of the force inside the rail may reach the following three surfaces: (1) rail base, (2) rail web, and (3) rail head (Figure 9).
This has a considerable effect on the stress concentration inside the rail. Due to the gradual reduction of the influence of the vertical dynamic force along the distribution length from the highest value at the rail head to the lowest value at the rail base, the forces accepted by the rail head were always higher than the forces reaching the rail base. When reaching any boundary of the rail, the force actions transitioned into a different medium, and if they reached the boundary of the rail head, complete deformation of the rail in the respective direction could take place, as the rail was not restrained by another element. If the forces reached the rail base, the subsequent force action was limited to the rail pad that was characterized by greater resistance than that of the air. Consequently, the rail deformations in this direction were smaller than the deformations of the rail that was not supported. Meanwhile, in both cases, the rail was subject to the deformation in the direction of force action as the rail stiffness was considerably higher than the air and pad stiffness (and aggregate stiffness of the elements located under the rail). If an element with higher stiffness had been located under the rail, the rail would have had a different nature of deformation, i.e., it would have not extended in the direction of force action but would have rather compressed when the rigid medium had been reached. Therefore, the appearance of defects in the rail head was considerably influenced by the action of dynamic forces that reached the corner of the rail head due to the direction of the action compared to the action of the dynamic force reflected from the base of the rail. Thus, there was a certain range of dynamic stages inside the state of the rail that depended on the wheel and the rail and the conditions of their interaction. The range was registered by the sensors installed at different locations.
Third, each track structure was subjected to the dynamic process of deformation that depended on the aggregate state of elements comprising the track structure and on the state of the link between them. The non-uniformity of the states of a track’s structure along its length may be caused by the following:
- (a)
- Modification of the alignment and profile of the track structure;
- (b)
- Presence of constructive works and stop-off or crossing points;
- (c)
- Characteristics of train traffic of the track section;
- (d)
- Rolling stock movement mode;
- (e)
- Track maintenance system;
- (f)
- Climatic conditions of the region.
During the experiment, the span already had the established state of the track structure under the action of the above factors. The duration of tests per span of the operated track could last up to two weeks depending on the test program, with an interval per day of tests. Each day of tests started and ended with a calibration check, and the repetition of the process was mandatory in case weather conditions changed during the test period. This technological aspect of the process of testing the action of rolling stock on the track emphasizes the possibility of variation of the experimental data even when invariable states of the track section and rolling stock are tested and even when the calibration check is performed within the invariable velocity range. A maximum of 5% error had to be applied to the measurement and registration of experimental values of the indicators of action of the rolling stock on the rail track and in turn [69]. The registration of vertical forces of action of rolling stock on the rail track and turnouts had to ensure statistical data processing within the range of frequencies 0–250 Hz [69]. The aspects of the sensitivity of the equipment used and the application of the filters to receive adequate experimental data were subject to different variations and were crystallized by means of practical experience, as elasticity theory did not explain the pattern of time-dependent propagation of the force actions in the rail structure. Therefore, where the existing quasi-dynamic model used in the track strength calculations was considered, the following should be expected a rolling stock velocity of 30 km/h and with complete disregard for the elements of the reaction of the track structure to the dynamic action of the rolling stock per second of the digital record: 87 reflected waves for the whole structure, 335—without the roadbed, 457—without the sand bed and road bed, 5400—without the ballast (soil–sand–crushed ballast), 14,000—from the rail only. In total, 20,279 impulses should be expected. At least five surface processes were excluded from the above simplifications. Performing the analysis of the superposition of all the wave processes that shape the process of the time-dependent deformation of the track structure registered by the sensors with a respective perception base and response inertia located at different locations on the rails is a complex task. The task becomes considerably easier when the maximum values are calculated. However, this means the loss of a great deal of information that would otherwise help account for the action of the state of the track structure in general and its individual elements, as well as in understanding the patterns behind the variation of registered values.
Fourth, an increase in the velocity of a rolling stock is known to lead to an increase in the value of the dynamic load exerted by the wheel on the rail relative to its static value because of the emergence of the dynamic increment. The physical process of the effect of an increase in the movement velocity on the process of deformation in the track structure is discussed below without consideration of the methods of limiting these values.
Two terms are usually used to describe dynamic processes: oscillation and vibration. The principal difference is that an oscillation is a displacement of the object under investigation, whereas a vibration is a movement caused by oscillations. This means that a vibration is a superposition of oscillations. Hence, all elements and structures are subject to vibrations under the actions of the rolling stock, whereas the passages used on the basis of elasticity theory represent oscillations.
An interaction is the source of any oscillation. An impulse (of force, pressure, temperature, etc.) is the characteristic of interaction, i.e., it represents the pattern of time-dependent variation of the acting measure. This pattern is generally characterized by the parameters such as amplitude and cyclic frequency. Energy exchange, distribution, and absorption take place at objects under the action of an impulse. A variation in the amount of energy during the specified processes is characterized by the type and amount of work taking place above and/or inside the interaction objects.
Hence, the velocity of rolling stock is the dimension that characterizes the cyclic frequency of the impulse of pressure on the wheel-to-rail contact areas. The dimension of pressure characterizes the amplitude.
Oscillations are usually viewed as repetitive processes, and in this case, when dealing with the action of the rolling stock on the rail, it is important to understand which processes can be classified as repetitive.
The first process of repetition is the repetition of the action of rolling stock wheels characterized by the geometric parameters of structural aspects of the rolling stock trucks and wagons on certain sections of the track. It should be noted that, in general, the process is difficult to classify as cyclic as, first, there is a non-uniformity caused by the geometric parameters of the structural aspects of the rolling stock trucks. Second, the trajectories of movement of the rolling stock wheels along the rails are not identical. As a result, the types of contacts during the passage of the rolling stock wheels down the rail with the same section will not be identical. During wheel passage down the rail, single- and double-point contacts with the rail are possible. In addition, for single-point contact, this could be a rolling surface contact or contact with a lateral side of the rail. This creates even greater non-uniformity, amplifying the random character of the characteristic of the wheel pressure impulse on the rail section. Moreover, the distance between the wheels of trucks and the distances between the trucks along the rolling stock are used as the dimension of repetition. However, this dimension does not characterize the duration of the action on the rail directly. Hence, the structural aspects of the rolling stock cannot be viewed as the frequencies of the action impulse, but could be accepted as the frequencies of repetition of the action impulses.
The second process is the direct wheel-to-rail contact along the tested span, where the velocity of the rolling stock determines the time of impulse of action for each contact plane. This process was also not cyclic from a conventional point of view and could not be represented by a complete sinusoidal or cosinusoidal period. In the case analyzed, the action of the wheel on the rail could be represented only by a half-period of these functions. Using the full period of the functions would imply, from the physical perspective, that the rail is first subjected to the force action aiming to bring it down to the maximum displacement from the resting state and raising it afterward to the maximum displacement, then followed by a return to the original level. This contradicts the real physical action, in which the rail was brought down under the growing action of the wheel rolling onto the rail section, and rose to the original level under the decreasing action of the wheel rolling off the railway section during movement to the following contact plane. Movement above the rail section did initially resemble the influence line of the force action that was used for the calculation of track strength under the elasticity theory. However, in the case analyzed, the “influence line” was formed from the smooth action of the impulse along the tested range by the movement of the impulse in the trajectory of movement of each wheel over time, in view of the time in each contact plane. This meant that the time of action of the wheel on the contact plane defined the cyclic frequency of the impulse. The higher the velocity of the rolling stock, the shorter the time of action in each contact plane. The higher the velocity of the rolling stock, the longer the track span that accepted the load from the wheel on the rail per time unit. The rate of increase in the value of the dynamic increase in the force upon the increase in the rolling stock velocity was considerably lower than the gradient of the same velocity. The totality of these factors led to a decrease in the value of the impulse dimension of the wheel action on the rail in the case of an increase in the velocity. This also meant a decrease in the amount of energy required for the deformation process [100].
Another factor that needed to be considered to identify the influence of a change in movement velocity on the process of deformation of the track structure was the speed of distribution of the action impulse in the track structure. The speed of distribution of mechanical actions in the materials is known to be transferred by means of elastic waves. Each material has certain values of the speed of the distribution of elastic waves depending on the modulus of elasticity, density, and Poisson’s ratio of the material. The speed of distribution of elastic waves does not depend on the direction of impulse action. Hence, irrespective of the value and duration of action of the impulse, the time of its distribution in the elements and structure within the span was virtually the same, since it depended only on the trajectory of distribution inside the elements and structure. This meant that the time of distribution of the impulse in the same track structure did not depend on the speed of the rolling stock on the track. This explains the non-correspondence (delay, lagging) within a single track section, between the time to achieve the maximum value of the impulse dimension and the time to achieve the maximum value of the rail deflection as a dimension that characterizes the process of deformation in the track structure under the action of the impulse. At movement velocities up to 12 km/h, the speed of the deformation process of the track structure corresponded to the speed of variation of the impulse within a single track section, and the track structure was subject to complete deformation under the impulse action in a single wheel–rail contact plane. Hence, during the calibration check, the values measured during the experiment could be equated with the static ones. With the increase in the rolling stock velocity, not only the impulse frequency, but also the oscillation frequency of the track elements and structure was subject to variation. As a result, the energy expended in the deformation process was redistributed between the track elements and structure. As the amount of energy for the deformation process decreased with the increase in the rolling stock velocity, the volume of the track structure involved in the energy acceptance process decreased as well. The load on the pads and the ballast layer increased with the increasing speed of the rolling stock, although the load on the track structure was generally decreasing. Nonetheless, this dependence was not linear and was characterized by a complex nature, as the vibrations of both the elements and structure of the track were essentially the superposition of wave oscillations in time and space. Due to the use of a bridge during signal registration (see Figure 1), the aggregate of variations in the sensors was registered rather than the data on variations in each sensor with respect to a certain dimension. As previously mentioned, the signal registration did not cover the full scope. This significantly complicated the analysis of the dynamic processes that take place in the track structure under the action of the rolling stock.
Moreover, while the experiment was expected to generate valid values, their validity was questionable without knowledge of the true value. According to [69], the range of rolling stock velocities is defined for the purpose of the experiment in order to determine the indicators of permissible action on the rail track. Depending on the type of experiments, the maximum velocity for the determination of the experimental dynamic indicators was the following: the velocity of the rolling stock was 10 km/h, or 10% higher than the design velocity. The methodology of track strength calculations (the strength indicators determined by the experiment) involved the coefficients and values obtained in the experiments. This implied linear dependence of the variation of the specified indicators upon an increase in movement velocity. Therefore, the experiment itself was the major indicator of the elements of the vibration process of the track and structure under the action of the rolling stock and was aimed at determining abnormal phenomena in the track structure during the superposition of element vibrations that led to the sympathetic vibrations in the track structure under the action of the rolling stock. Determining the action of a certain factor based on an experiment alone was a fairly complex task in the case of the generalized approach towards the tests, as the approach towards the implementation of the experiment did not imply an investigation of the physical process that took place inside the tested object.
In this respect, it is important to emphasize the difference between laboratory experiments that employ stamp or pressure test machines and in situ experiments conducted on the operative span of the track. During laboratory experiments, there are three parameters that define, but do not fully reflect, the process.
The first parameter is the frequency of application of the load. As demonstrated above, the duration of the actual transfer of the pressure from the pressure-testing machine to the tested object determined the frequency of load application. The duration of straight and reverse movement was not considered.
The second parameter is the frequency of load repetition. Cyclic tests are usually conducted in laboratories by applying the same time of repetition of the load. Moreover, the location of the load application remains constant. Therefore, during the test, the load was applied to the section of the tested object with the cyclic impulse that follows the same pattern of variation over time and direction of action. From a physical perspective, this meant that the action exerted by the stamp or pressure-testing machine functions as the rolling stock with a uniform layout of the wheels along the length of the rolling stock (frequency of repetition) that passes at a constant velocity (load application frequency) with the absence of oscillations of the rolling stock transverse to the track axis, i.e., under the action on the same contact plane.
The third parameter is the modeling of the elastic properties. In this case, elasticity was viewed as specific processes that create links between the elements.
The conventional understanding of the modulus of elasticity in the vertical plane (Young’s modulus) is the first component of modeling the elastic properties. The theoretical foundation behind the wave processes has largely developed as a part of electrodynamics; therefore, the frequency and amplitude of the oscillation process are usually evaluated as these values are created and adjusted artificially in power grids. However, from the perspective of natural vibration processes, these dimensions in objects that the action is exerted on are created by using the geometric and physical–mechanical characteristics of the objects accepting the action. Therefore, it would be more appropriate to use and evaluate the time of the causes of oscillation processes rather than their frequency. Under this approach, it was necessary to consider not only the stiffness of the basis of the oscillation processes that simulated the physical process of oscillation of the system of elements by means of the oscillation amplitude, but also the time of response to the oscillation process. Therefore, the simulation of the required stiffness of the tested element did not fully simulate the real physical process as, in view of the simulation of the oscillation, it was only the amplitude parameter that was simulated, without simulation of the respective frequency parameter. Subsequently, the clamping tests under laboratory conditions reflected the tests that did not account for the response of the structure located under the rail. The present investigation analyzed the behavior of the clamping located on the rigid foundation and not subjected to additional vibrations exerted by the track elements located under the sleeper.
The second component of the modeling of the elastic properties was the relationship in the horizontal plane. This kind of relationship is often neglected during modeling using software applications and during laboratory tests. This is the reflection of links along the investigated object. On the one hand, it was important to account for the effect of the length of the investigated object, since the application of load on the same element of different lengths at the same support conditions generated different oscillation processes. Hence, to model the track span (rail-clamping-reinforced concrete sleeper–ballast 0.4 m–soil 3 m) in the software applications based on numerical modeling, the minimum length of the track span that did not influence the deformations in the vertical plane under single forces that simulated the position of wheel pair located in the center of the span was 6 m. On the other hand, lateral struts caused the oscillation type to change, as they not only altered the shape of deflection, but also added torsion. As a result, the oscillations evolved into vibrations. Therefore, the length of the simulated track span should be 25 m due to the speed of wave distribution on the rails.
As a result, conditions that restrained the assessment of dynamic processes of vehicle–track interaction were demonstrated and analyzed. For this purpose, experiments on the rolling stock action on the rail track in order to reduce “random events” and expansion of understanding of the processes in order to perform the assessment of the registered data were conducted.
4. Discussion, Conclusions, and Future Recommendations
The arrangement of approaches and methodologies for the registration of data aimed at obtaining the maximum parameters of action for the validation of the strength, stability, and fatigue strength of the elements of the rail track presents the main challenge related to the collection, analysis, and interpretation of the experimental data for the assessment of the dynamic processes of action of the rolling stock on the rail track and its elements for the purpose of analyzing the functional safety of the process. This approach neither diminishes nor explains the randomness of the range of scatter of the values during the registration. Hence, it was necessary to investigate the effect of different groups of influence on the dynamic process with a view toward the reduction of occurrences of randomness during the registration of the process in the experiment and expansion of the understanding of the processes happening during the assessment of the registered data.
Laboratory tests simulate certain operating conditions, but their application to different conditions is impossible without understanding the dynamic process. This introduces the occurrences of randomness in the prediction of the performance of the investigated object not only for the same real operating conditions allegedly sought in the laboratory, but also for the variation of real operating conditions.
For a comprehensive assessment of dynamic processes of the vehicle–track interaction throughout the life cycle of operation, the following should be taken into account:
- Any formed rolling stock in the loaded state is characterized by non-uniformity of the loading on the wheel, which leads to the non-uniform static character of the rolling stock (this aspect can be referred to as the rolling stock specifications). This characteristic of rolling stock is one of the causes of the random character of the values registered in the experiment.
- The sampling methodology for the analysis of parameters of the rolling stock impact requires an adjustment related to accounting for the position of the wheel pair relative to the track axis and grouping samples in a similar way by all parameters investigated in view of these adjustments. This expands the volume of information obtained with the dynamic processes and enables the assessment of both the ratio of forces during the analysis of wheel stability on the rail and the processes of the wheel and rails during their interaction, as well as the processes of deformation inside the elements for the purpose of prediction of implementation of the maintenance system. Moreover, this leads to greater efficiency in the use of the data pool obtained during the registration.
- For the assessment of aspects of functional safety of clamping performance in different states of the rail substructure (sleepers and ballast) during the vehicle–track interaction, rail warping in different planes should be taken into consideration.
- To obtain information on the running of the deformation processes during the experiment, the data registered by each sensor individually must be available.
- To assess the random scatter of the registered values, it is necessary to account for the geometric and physical–mechanical characteristics of the rail track structure.
- For greater efficiency in the application of laboratory tests to the prediction of object behavior under real operating conditions, it is necessary to account for the links neglected and considered during the laboratory tests.
- The simulation of real processes implies the provision of the complex system of amplitude and frequency relationships which may be recreated under laboratory conditions on the basis of knowledge of the physics of the process and taking into account the time component.
- It is necessary to determine the correlation of the requirements for elements and structures, for example, cramping points, applicable during laboratory tests with the requirements for elements and structures applicable to specific operating conditions. This would allow us to:
- Qualify the technical states of the rail track elements and structures in view of the functional safety requirements on the basis of risk assessment for different operating conditions;
- Optimize the maintenance system for rail track structures throughout the life cycle of operation, taking into account the probability of risks;
- Optimize the monitoring system for railway infrastructure in view of climatic, structural, and operational variations in the process of operation.
Author Contributions
Conceptualization, I.B., V.L., R.K. and L.N.; methodology, I.B., V.L., R.K. and L.N.; software, I.B., V.L., R.K. and L.N.; validation, I.B., V.L., R.K. and L.N.; formal analysis, I.B., V.L., R.K. and L.N.; resources, I.B., V.L., R.K. and L.N.; data curation, I.B., V.L., R.K. and L.N.; writing—original draft preparation, I.B., V.L., R.K. and L.N.; writing—review and editing, I.B., V.L., R.K. and L.N. All authors have read and agreed to the published version of the manuscript.
Funding
This research received no external funding.
Institutional Review Board Statement
Not applicable.
Informed Consent Statement
Not applicable.
Data Availability Statement
Not applicable.
Conflicts of Interest
The authors declare no conflict of interest.
References
- Bouhlal, L.; Lamdouar, N.; Kassou, F. Experimental Measurement and Simulation of Railway Track Irregularities. Civ. Eng. J. 2022, 8, 2235–2242. [Google Scholar] [CrossRef]
- El Moueddeb, M.; Louf, F.; Boucard, P.-A.; Dadié, F.; Saussine, G.; Sorrentino, D. An Efficient Numerical Model to Predict the Mechanical Response of a Railway Track in the Low-Frequency Range. Vibration 2022, 5, 326–343. [Google Scholar] [CrossRef]
- Link, F.M.; Wigger, R.; Wahl, T.; Kuffa, M.; Wegener, K. Acoustic roughness measurement of railway tracks: Implementation of an optical measurement approach & possible improvements to the standard. Proc. Inst. Mech. Eng. Part F J. Rail Rapid Transit 2022, 236, 1210–1217. [Google Scholar] [CrossRef]
- Oliveira, R.H.; Loprencipe, G.; Filho, F.G.V.A.; Pissardini, R.S. Experimental investigation on the use of multiple very low-cost inertial-based devices for comfort assessment and rail track monitoring. Measurement 2023, 199, 111549. [Google Scholar] [CrossRef]
- Skrickij, V.; Šabanovic, E.; Shi, D.; Ricci, S.; Rizzetto, L.; Bureika, G. Visual Measurement System for Wheel–Rail Lateral Position Evaluation. Sensors 2021, 21, 1297. [Google Scholar] [CrossRef]
- Szmagliński, J.; Wilk, A.; Koc, W.; Karwowski, K.; Chrostowski, P.; Skibicki, J.; Grulkowski, S.; Judek, S.; Licow, R.; Makowska-Jarosik, K.; et al. Verification of Satellite Railway Track Position Measurements Making Use of Standard Co-Ordinate Determination Techniques. Remote Sens. 2022, 14, 1855. [Google Scholar] [CrossRef]
- Ižvolta, L.; Šmalo, M. Assessment of the Track Geometry Quality from the Aspect of Safe and Reliable Operation of the Railway Track. Procedia Eng. 2015, 111, 344–350. [Google Scholar] [CrossRef] [Green Version]
- Fu, L.; Zhou, S.; Guo, P.; Tian, Z.; Zheng, Y. Dynamic characteristics of multiscale longitudinal stress and particle rotation in ballast track under vertical cyclic loads. Acta Geotech. 2021, 16, 1527–1545. [Google Scholar] [CrossRef]
- Haigermoser, A.; Eickhoff, B.; Thomas, D.; Coudert, F.; Grabner, G.; Zacher, M.; Kraft, S.; Bezin, Y. Describing and assessing track geometry quality. Veh. Syst. Dyn. 2014, 52, 189–206. [Google Scholar] [CrossRef]
- Palo, M.; Galar, D.; Nordmark, T.; Asplund, M.; Larsson, D. Condition monitoring at the wheel/rail interface for decision-making support. Proc. Inst. Mech. Eng. Part F J. Rail Rapid Transit 2014, 228, 705–715. [Google Scholar] [CrossRef]
- Erhova, N.; Bondarenko, I.; Shibko, O.; Velmagina, N. Development of the procedure for verifying the feasibility of designing an active suspension system for transport carriages. East.-Eur. J. Enterp. Technol. 2018, 3, 53–63. [Google Scholar] [CrossRef]
- Chiou, S.-B.; Yen, J.-Y. Precise railway alignment measurements of the horizontal circular curves and the vertical parabolic curves using the chord method. Proc. Inst. Mech. Eng. Part F J. Rail Rapid Transit 2019, 233, 537–549. [Google Scholar] [CrossRef]
- Ren, X.; Wu, S.; Xing, H.; Fang, X.; Ao, N.; Zhu, T.; Li, Q.; Kang, G. Fracture mechanics based residual life prediction of railway heavy coupler with measured load spectrum. Int. J. Fract. 2022, 234, 313–327. [Google Scholar] [CrossRef]
- Ariaudo, C.; Kuka, N.; Verardi, R. Impact of track health on vehicle-track interaction loads. In Advances in Dynamics of Vehicles on Roads and Tracks; Springer International Publishing: Berlin/Heidelberg, Germany, 2020; pp. 762–768. [Google Scholar] [CrossRef]
- Bižić, M.B.; Petrović, D.Z.; Tomić, M.C.; Djinović, Z.V. Development of method for experimental determination of wheel–rail contact forces and contact point position by using instrumented wheelset. Meas. Sci. Technol. 2017, 28, 075902. [Google Scholar] [CrossRef]
- Dumitriu, M.; Fologea, D.; Cruceanu, I.C. Effects analysis of vertical track irregularities on bogie vibration—Method based on bogie modelling and wheelsets accelerations measurement. IOP Conf. Ser. Mater. Sci. Eng. 2021, 1018, 012001. [Google Scholar] [CrossRef]
- Yang, Y.; Liu, G.; Wang, X. Time–frequency characteristic analysis method for track geometry irregularities based on multivariate empirical mode decomposition and Hilbert spectral analysis. Veh. Syst. Dyn. 2021, 59, 719–742. [Google Scholar] [CrossRef]
- Matsuoka, K.; Kajihara, K.; Tanaka, H. Identification of Vibration Modes and Wave Propagation of Operational Rails by Multipoint Hammering and Reciprocity Theorem. Materials 2022, 15, 811. [Google Scholar] [CrossRef]
- Blanco, B.; Gil-Negrete, N.; Kari, L.; Alonso, A. On the correction of rail accelerations predicted by numerical track models based on Timoshenko beam theory. Veh. Syst. Dyn. 2022, 60, 1993–2017. [Google Scholar] [CrossRef]
- Zhou, W.; Abdulhakeem, S.; Fang, C.; Han, I.; Li, G.; Wu, Y.; Faisal, Y. A new wayside method for measuring and evaluating wheel-rail contact forces and positions. Measurement 2020, 166, 108244. [Google Scholar] [CrossRef]
- Bernal, E.; Spiryagin, M.; Vollebregt, E.; Oldknow, K.; Stichel, S.; Shrestha, S.; Ahmad, S.; Wu, Q.; Sun, Y.; Cole, C. Prediction of rail surface damage in locomotive traction operations using laboratory-field measured and calibrated data. Eng. Fail. Anal. 2022, 135, 106165. [Google Scholar] [CrossRef]
- Pires, A.C.; Mendes, G.R.; Santos, G.F.M.; Dias, A.P.C.; Santos, A.A. Indirect identification of wheel rail contact forces of an instrumented heavy haul railway vehicle using machine learning. Mech. Syst. Signal Process. 2021, 160, 107806. [Google Scholar] [CrossRef]
- Gao, T.; Cong, J.; Wang, P.; Liu, J.; Wang, Y.; He, Q. Vertical track irregularity analysis of high-speed railways on simply-supported beam bridges based on the virtual track inspection method. Proc. Inst. Mech. Eng. Part F J. Rail Rapid Transit 2020, 235, 328–338. [Google Scholar] [CrossRef]
- Jauregui-Correa, J.C.; Morales-Velazquez, L.; Otremba, F.; Hurtado-Hurtado, G. Method for predicting dynamic loads for a health monitoring system for subway tracks. Front. Mech. Eng. 2022, 8, 858424. [Google Scholar] [CrossRef]
- Kouroussis, G.; Verlinden, O.; Conti, C. Free field vibrations caused by high-speed lines: Measurement and time domain simulation. Soil Dyn. Earthq. Eng. 2011, 31, 692–707. [Google Scholar] [CrossRef]
- Li, H.; Yang, W.G.; Liu, P.; Wang, M. Prediction method and experimental verification of vibration response caused by underground high-speed railways. J. Low Freq. Noise Vib. Act. Control. 2022, 42, 452–469. [Google Scholar] [CrossRef]
- Olivier, B.; Verlinden, O.; Kouroussis, G. Comparison of X–T and X–X co-simulation techniques applied on railway dynamics. Multibody Syst. Dyn. 2022, 55, 39–56. [Google Scholar] [CrossRef]
- Joh, S.-H.; Magno, K.; Hwang, S.H. Dynamic Deflection of a Railroad Sleeper from the Coupled Measurements of Acceleration and Strain. Sensors 2018, 18, 2182. [Google Scholar] [CrossRef] [Green Version]
- Tong, Y.; Liu, G.; Yousefian, K.; Jing, G. Track Vertical Stiffness—Value, Measurement Methods, Effective Parameters and Challenges: A review. Transp. Geotech. 2022, 37, 100833. [Google Scholar] [CrossRef]
- Varandas, J.N.; Paixão, A.; Fortunato, E.; Zuada Coelho, B.; Hölscher, P. Long-term deformation of railway tracks considering train-track interaction and non-linear resilient behaviour of aggregates—A 3D FEM implementation. Comput. Geotech. 2020, 126, 103712. [Google Scholar] [CrossRef]
- Bondarenko, I.; Severino, A.; Olayode, I.O.; Campisi, T.; Neduzha, L. Dynamic Sustainable Processes Simulation to Study Transport Object Efficiency. Infrastructures 2022, 7, 124. [Google Scholar] [CrossRef]
- Bondarenko, I.; Keršys, R.; Neduzha, L. Analysis of Problem Related to Experimental Data Processing in the Study of the Rolling Stock Influence on the Track. In Proceedings of the 26th International Conference Transport Means, Kaunas, Lithuania, 5–7 October 2022; pp. 663–668. [Google Scholar]
- Xu, P.; Liu, R.-K.; Wang, F.; Wang, F.-T.; Sun, Q.-X. Railroad Track Deterioration Characteristics Based Track Measurement Data Mining. Math. Probl. Eng. 2013, 1742, 970573. [Google Scholar] [CrossRef] [Green Version]
- Doi, H.; Hondo, T.; Nishiyama, Y.; Kuniyuki, S.; Tanaka, T. Stationary Test Method for Evaluating Wheel Unloading of Railway Vehicle on Twisted Track Simulated with Spacers between Wheel and Rail. Proc. Transp. Logist. Conf. 2020, 29, 3801. [Google Scholar] [CrossRef]
- Gruber, C.; Hammer, R.; Gänser, H.-P.; Künstner, D.; Eck, S. Use of Surface Acoustic Waves for Crack Detection on Railway Track Components—Laboratory Tests. Appl. Sci. 2022, 12, 6334. [Google Scholar] [CrossRef]
- Majstorović, I.; Ahac, M.; Madejski, J.; Lakušić, S. Influence of the Analytical Segment Length on the Tram Track Quality Assessment. Appl. Sci. 2022, 12, 10036. [Google Scholar] [CrossRef]
- Offenbacher, S.; Neuhold, J.; Veit, P.; Landgraf, M. Analyzing Major Track Quality Indices and Introducing a Universally Applicable TQI. Appl. Sci. 2020, 10, 8490. [Google Scholar] [CrossRef]
- Tešić, P.; Jovanović, S.; Dick, M. Analysis of vehicle/track interaction measurement data using the V/TI Monitor system. Gradevinar 2018, 70, 105–119. [Google Scholar] [CrossRef] [Green Version]
- Wei, D.; Wei, X.; Jia, L. Automatic Defect Description of Railway Track Line Image Based on Dense Captioning. Sensors 2022, 22, 6419. [Google Scholar] [CrossRef]
- Costa, J.N.; Ambrósio, J.; Andrade, A.R.; Frey, D. Safety assessment using computer experiments and surrogate modeling: Railway vehicle safety and track quality indices. Reliab. Eng. Syst. Saf. 2023, 229, 108856. [Google Scholar] [CrossRef]
- Barbosa, R.S. Evaluation of Railway Track Safety with a New Method for Track Quality Identification. J. Transp. Eng. 2016, 142, 04016053. [Google Scholar] [CrossRef]
- Guerrieri, M.; Parla, G.; Celauro, C. Digital image analysis technique for measuring railway track defects and ballast gradation. Measurement 2018, 113, 137–147. [Google Scholar] [CrossRef]
- Bondarenko, I. Development of algorithm for calculating dynamic processes of railroad track deformability work. East. -Eur. J. Enterp. Technol. 2016, 6/7, 28–36. [Google Scholar] [CrossRef] [Green Version]
- Bondarenko, I.; Keršys, R.; Neduzha, L. Studying of Dynamic Parameters Impulse Impact of the Vehicle Taking into Account the Track Stiffness Variations. In Proceedings of the 25th International Conference Transport Means, Kaunas, Lithuania, 6–8 October 2021; pp. 684–689. [Google Scholar]
- Bondarenko, I.; Keršys, A.; Neduzha, L. Assessment of the Railway Track Deformability Behaviour as the Parameter of Operational Availability Function. In Proceedings of the 25th International Conference Transport Means, Kaunas, Lithuania, 6–8 October 2021; pp. 644–648. [Google Scholar]
- Kalivoda, J.; Neduzha, L. Running Dynamics of Rail Vehicles. Energies 2022, 15, 5843. [Google Scholar] [CrossRef]
- Eklöf, K.; Nwichi-Holdsworth, A.; Eklöf, J. Novel Algorithm for Mutual Alignment of Railway Track Geometry Measurements. Transp. Res. Rec. 2021, 2675, 995–1004. [Google Scholar] [CrossRef]
- de Melo, A.L.O.; Kaewunruen, S.; Papaelias, M.; Li, T. A Novel Hybrid Method for Predicting Vertical Levelling Loss of Railway Track Geometry Under Dynamic Cyclic Loadings. Int. J. Struct. Stab. Dyn. 2022, 22, 2250162. [Google Scholar] [CrossRef]
- Wang, H.; Berkers, J.; Hurk, N.V.D.; Layegh, N.F. Study of loaded versus unloaded measurements in railway track inspection. Measurement 2020, 169, 108556. [Google Scholar] [CrossRef]
- Majstorović, I.; Ahac, M.; Lakušić, S. Track gauge monitoring scope optimization on small urban railway systems. In Proceedings of the 6th International Conference on Road and Rail Infrastructure CETRA 2020, Zagreb, Croatia, 20–21 May 2020. [Google Scholar] [CrossRef]
- Balouchi, F.; Bevan, A.; Formston, R. Development of railway track condition monitoring from multi-train in-service vehicles. Veh. Syst. Dyn. 2021, 59, 1397–1417. [Google Scholar] [CrossRef] [Green Version]
- Yang, Y.B.; Wang, Z.-L.; Shi, K.; Xu, H.; Wu, Y.T. State-of-the-Art of the Vehicle-Based Methods for Detecting the Various Properties of Highway Bridges and Railway Tracks. Int. J. Struct. Stab. Dyn. 2020, 20, 20410047. [Google Scholar] [CrossRef]
- Xiao, X.; Xu, X.; Shen, W. Identification of Frequencies and Track Irregularities of Railway Bridges Using Vehicle Responses: A Recursive Bayesian Kalman Filter Algorithm. J. Eng. Mech. 2022, 148, 04022051. [Google Scholar] [CrossRef]
- Vidovic, I.; Marschnig, S. Optical Fibres for Condition Monitoring of Railway Infrastructure—Encouraging Data Source or Errant Effort? Appl. Sci. 2020, 10, 6016. [Google Scholar] [CrossRef]
- Komorski, P.; Kominowski, J.; Motyl, M. A proposal for a mobile system of vehicle and rail track diagnostics. Transp. Probl. 2022, 17, 45–56. [Google Scholar] [CrossRef]
- Ma, S.; Gao, L.; Liu, X.; Lin, J. Deep Learning for Track Quality Evaluation of High-Speed Railway Based on Vehicle-Body Vibration Prediction. IEEE Access 2019, 7, 185099–185107. [Google Scholar] [CrossRef]
- Kulkarni, R.; Rosa, A.D.; Qazizadeh, A.; Berg, M.; Gialleonardo, E.D.; Facchinetti, A.; Bruni, S. Monitoring of Alignment Level (AL)and Cross Level (CL) track geometry irregularities from onboard vehicle dynamics measurements using probabilistic fault classifier. In Advances in Dynamics of Vehicles on Roads and Tracks II; Springer International Publishing: Berlin/Heidelberg, Germany, 2022; pp. 479–487. [Google Scholar] [CrossRef]
- Krishna, V.V.; Hossein-Nia, S.; Stichel, S. New methodology to estimate costs caused by rail wear and RCF depending on the type of running gear. In Advances in Dynamics of Vehicles on Roads and Tracks; Springer International Publishing: Cham, Switzerland, 2020; pp. 727–734. [Google Scholar] [CrossRef]
- Vlachospyros, G.; Iliopoulos, I.A.; Kritikakos, K.; Kaliorakis, N.; Fassois, S.D.; Sakellariou, J.S.; Deloukas, A.; Leoutsakos, G.; Giannakis, C.; Chronopoulos, E.; et al. The Maiandros system for random-vibration-based on-board railway vehicle and track monitoring. In ASME 2021 International Design Engineering Technical DETC2021-70166, V001T01A014; American Society of Mechanical Engineers: New York, NY, USA, 2021; pp. 1–10. [Google Scholar] [CrossRef]
- Licciardello, R.; Malavasi, G.; Tieri, A. Reference Values for Railway Sidings Track Geometry. Transp. Res. Procedia 2016, 14, 1996–2005. [Google Scholar] [CrossRef] [Green Version]
- Jönsson, J.; Khouy, I.A.; Lundberg, J.; Rantatalo, M.; Nissen, A. Measurement of vertical geometry variations in railway turnouts exposed to different operating conditions. Proc. Inst. Mech. Eng. Part F: J. Rail Rapid Transit 2016, 230, 486–501. [Google Scholar] [CrossRef]
- Morais, J.; Santos, C.; Morais, P.; Paixão, A.; Fortunato, E.; Asseiceiro, F.; Alvarenga, P.; Gomes, L. Continuous Monitoring and Evaluation of Railway Tracks: System Description and Assessment. Procedia Struct. Integr. 2019, 17, 448–455. [Google Scholar] [CrossRef]
- Berggren, E.G.; Nissen, A.; Paulsson, B.S. Track deflection and stiffness measurements from a track recording car. Proc. Inst. Mech. Eng. Part F J. Rail Rapid Transit 2014, 228, 570–580. [Google Scholar] [CrossRef]
- Zheng, S.; Zhong, Q.; Chen, X.; Peng, L.; Cui, G. The Rail Surface Defects Recognition via Operating Service Rail Vehicle Vibrations. Machines 2022, 10, 796. [Google Scholar] [CrossRef]
- de Souza, E.F.; Bittencourt, T.N.; Ribeiro, D.; Carvalho, H. Feasibility of Applying Mel-Frequency Cepstral Coefficients in a Drive-by Damage Detection Methodology for High-Speed Railway Bridges. Sustainability 2022, 14, 13290. [Google Scholar] [CrossRef]
- Lu, J.; Liang, B.; Lei, Q.; Li, X.; Liu, J.; Liu, J.; Xu, J.; Wang, W. SCueU-Net: Efficient Damage Detection Method for Railway Rail. IEEE Access 2020, 8, 125109–125120. [Google Scholar] [CrossRef]
- Firlik, B.; Tabaszewski, M. Monitoring of the technical condition of tracks based on machine learning. Proc. Inst. Mech. Eng. Part F: J. Rail Rapid Transit 2020, 234, 702–708. [Google Scholar] [CrossRef]
- Yuan, Z.; Zhu, S.; Chang, C.; Yuan, X.; Zhang, Q.; Zhai, W. An unsupervised method based on convolutional variational auto-encoder and anomaly detection algorithms for light rail squat localization. Constr. Build. Mater. 2021, 313, 125563. [Google Scholar] [CrossRef]
- DSTU 7571:2014; Railway Rolling Stock Permissible Exposure Norms to the Railway Track Width 1520 mm. Minekonomrozvitku: Kyiv, Ukraine, 2015.
- Li, Y.; Zhang, X.; Chen, Z.; Yang, Y.; Geng, C.; Zuo, M.J. Time-frequency ridge estimation: An effective tool for gear and bearing fault diagnosis at time-varying speeds. Mech. Syst. Signal Process. 2023, 189, 110108. [Google Scholar] [CrossRef]
- Farkas, A. Measurement of Railway Track Geometry: A State-of-the-Art Review. Period. Polytech. Transp. Eng. 2019, 48, 76–88. [Google Scholar] [CrossRef] [Green Version]
- Hur, H.M.; Shin, Y.J.; Seo, J.W.; Moon, K.H. Performance Evaluation of Track Curvature Sensor for Curvature Estimation in a Curved Section of Railway Tracks. Appl. Sci. 2022, 12, 5398. [Google Scholar] [CrossRef]
- Kulkarni, R.; Qazizadeh, A.; Berg, M.; Stichel, S. Fault Detection and Isolation (FDI) method for Vehicle Running Instability from Vehicle Dynamic Response using Machine Learning. In Proceedings of the 11th International Conference on Railway Bogies and Running Gears (BOGIE’19), Budapest, Hungary, 9–12 September 2019. [Google Scholar]
- Spiroiu, M.A.; Nicolescu, M. On the estimation of the reliability probabilistic model of railway wheelset. IOP Conf. Ser. Mater. Sci. Eng. 2019, 682, 012001. [Google Scholar] [CrossRef]
- Zhao, Q.; Wang, L.; Zhao, K.; Yang, H. Development of a Novel Piezoelectric Sensing System for Pavement Dynamic Load Identification. Sensors 2019, 19, 4668. [Google Scholar] [CrossRef] [PubMed] [Green Version]
- Wang, H.; Berkers, J.; Hurk, N.V.D. Study of an innovative method for track geometry inspection using a mobile inspection system. In Proceedings of the Transportation Research Board 99th Annual Meeting, Washington, DC, USA, 12–16 January 2020. [Google Scholar]
- Sowinski, B.; Stelmach, A.; Chudzikiewicz, A. Simulation Analysis of the Influence of Changes in Track Parameters on Running Safety of a Rail Vehicle. Energies 2021, 14, 5882. [Google Scholar] [CrossRef]
- Sun, J.; Meli, E.; Song, X.; Chi, M.; Jiao, W.; Jiang, Y. A novel measuring system for high-speed railway vehicles hunting monitoring able to predict wheelset motion and wheel/rail contact characteristics. Veh. Syst. Dyn. 2022, 1–23. [Google Scholar] [CrossRef]
- Du, C.; Dutta, S.A.; Kurup, P.; Yu, T.; Wang, X. A Review of Railway Infrastructure Monitoring using Fiber Optic Sensors. Sens. Actuators 2020, 303, 111728. [Google Scholar] [CrossRef]
- Gonzalo, A.P.; Horridge, R.; Steele, H.; Stewart, E.; Entezami, M. Review of Data Analytics for Condition Monitoring of Railway Track Geometry. IEEE Trans. Intell. Transp. Syst. 2022, 23, 22737–22754. [Google Scholar] [CrossRef]
- Magalhães, K.M.M.; Brasil, R.M.L.R.F.; Wahrhaftig, A.M.; Siqueira, G.H.; Bondarenko, I.; Neduzha, L. Influence of Atmospheric Humidity on the Critical Buckling Load of Reinforced Concrete Columns. Int. J. Struct. Stab. Dyn. 2022, 22, 2250011. [Google Scholar] [CrossRef]
- Louis, L.P.; Milne, D.R.M.; Thompson, D.; Powrie, W. Evaluating railway track support stiffness from trackside measurements in the absence of wheel load data. Can. Geotech. J. 2016, 53, 1156–1166. [Google Scholar] [CrossRef]
- Quirke, P.; Cantero, D.; OBrien, E.J.; Bowe, C. Drive-by detection of railway track stiffness variation using in-service vehicles. Proc. Inst. Mech. Eng. Part F J. Rail Rapid Transit 2016, 231, 498–514. [Google Scholar] [CrossRef] [Green Version]
- Do, N.T.; Gül, M.; Nafari, S.F. Continuous Evaluation of Track Modulus from a Moving Railcar Using ANN-Based Techniques. Vibration 2020, 3, 149–161. [Google Scholar] [CrossRef]
- Wang, P.; Wang, L.; Chen, R.; Xu, J.; Xu, J.; Gao, M. Overview and outlook on railway track stiffness measurement. J. Mod. Transp. 2016, 24, 89–102. [Google Scholar] [CrossRef] [Green Version]
- Lee, S.-J.; Ahn, D.; You, I.; Yoo, D.-Y.; Kang, Y.-S. Wireless cement-based sensor for self-monitoring of railway concrete infrastructures. Autom. Constr. 2020, 119, 103323. [Google Scholar] [CrossRef]
- Castillo-Mingorance, J.M.; Sol-Sánchez, M.; Moreno-Navarro, F.; Rubio-Gámez, M.C. A Critical Review of Sensors for the Continuous Monitoring of Smart and Sustainable Railway Infrastructures. Sustainability 2020, 12, 9428. [Google Scholar] [CrossRef]
- Ferreira, P.M.; Machado, M.A.; Carvalho, M.S.; Vidal, C. Embedded Sensors for Structural Health Monitoring: Methodologies and Applications Review. Sensors 2022, 22, 8320. [Google Scholar] [CrossRef]
- Gonzalo, A.P.; Entezami, M.; Roberts, C.; Weston, P.; Stewart, E.; Hayward, M.; Hsu, S.S. Railway track location estimation using onboard inertial sensors. Veh. Syst. Dyn. 2022, 60, 3631–3649. [Google Scholar] [CrossRef]
- Odziemczyk, W.; Woźniak, M. Analysis of railway track geometry measurement methods usability. Transp. Overv. -Prz. Komun. 2018, 8, 40–50. [Google Scholar] [CrossRef]
- Pas, J.; Rosinski, A.; Wetoszka, P.; Białek, K.; Klimczak, T.; Siergiejczyk, M. Assessment of the Impact of Emitted Radiated Interference Generated by a Selected Rail Traction Unit on the Operating Process of Trackside Video Monitoring Systems. Electronics 2022, 11, 2554. [Google Scholar] [CrossRef]
- Wang, P.; Wang, Y.; Tang, H.; Gao, M.; Chen, R.; Xum, J. Error Theory of Chord-based Measurement System regarding Track Geometry and Improvement by High Frequency Sampling. Measurement 2017, 115, 204–216. [Google Scholar] [CrossRef]
- Malekjafarian, A.; OBrien, E.; Quirke, P.; Bowe, C. Railway Track Monitoring Using Train Measurements: An Experimental Case Study. Appl. Sci. 2019, 9, 4859. [Google Scholar] [CrossRef] [Green Version]
- Sol-Sánchez, M.; Castillo-Mingorance, J.M.; Moreno-Navarro, F.; Mattinzioli, T.; Rubio-Gámez, M.C. Piezoelectric-sensored sustainable pads for smart railway traffic and track state monitoring: Full-scale laboratory tests. Constr. Build. Mater. 2021, 301, 124324. [Google Scholar] [CrossRef]
- Jiao, P.; Egbe, K.-J.I.; Xie, Y.; Nazar, A.M.; Alavi, A.H. Piezoelectric Sensing Techniques in Structural Health Monitoring: A State-of-the-Art Review. Sensors 2020, 20, 3730. [Google Scholar] [CrossRef] [PubMed]
- Zhang, S.L.; Koh, C.G.; Kuang, K.S.C. . Proposed rail pad sensor for wheel-rail contact force monitoring. Smart Mater. Struct. 2018, 27, 115041. [Google Scholar] [CrossRef]
- Li, P.; Lan, C.; Liu, Z.; Li, J.; Wu, W.; Wang, J.; Wang, X.; Qiu, J.; Liu, D. A bi-block sleeper dynamic strain monitoring method based on embedded FRP-OF sensor. Constr. Build. Mater. 2022, 330, 127271. [Google Scholar] [CrossRef]
- Pavković, D.; Cipek, M.; Kljaic, Z.; Mlinarić, T.J. A fuzzy logic-based classifier for railway track condition estimation and tractive effort conditioning using data from remote sensors. In Proceedings of the XXIV International Conference on Material Handling, Constructions and Logistics—MHCL ’22, Belgrade, Serbia, 21–23 September 2022. [Google Scholar]
- Noguchi, Y. Method for Measuring Wheel/Rail Contact Positions Using Strain Gauges. IEEJ Trans. Ind. Appl. 2021, 141, 241–248. [Google Scholar] [CrossRef]
- Bondarenko, I.; Campisi, T.; Tesoriere, G.; Neduzha, L. Using Detailing Concept to Assess Railway Functional Safety. Sustainability 2023, 15, 18. [Google Scholar] [CrossRef]
Figure 1.
Resistance strain gauge layout (a) and connection scheme (b) for vertical force measurement. Points a, c—measurement diagonals; d, b—bridge feed; 1, 2, 3, 4, 5—reference numbers of the resistance strain gauges; P—vertical load.
Figure 1.
Resistance strain gauge layout (a) and connection scheme (b) for vertical force measurement. Points a, c—measurement diagonals; d, b—bridge feed; 1, 2, 3, 4, 5—reference numbers of the resistance strain gauges; P—vertical load.

Figure 2.
Resistance strain gauge layout for lateral force measurement with Method 1. Y—lateral force; 1, 2, 3—reference numbers of the strain gauges.
Figure 2.
Resistance strain gauge layout for lateral force measurement with Method 1. Y—lateral force; 1, 2, 3—reference numbers of the strain gauges.
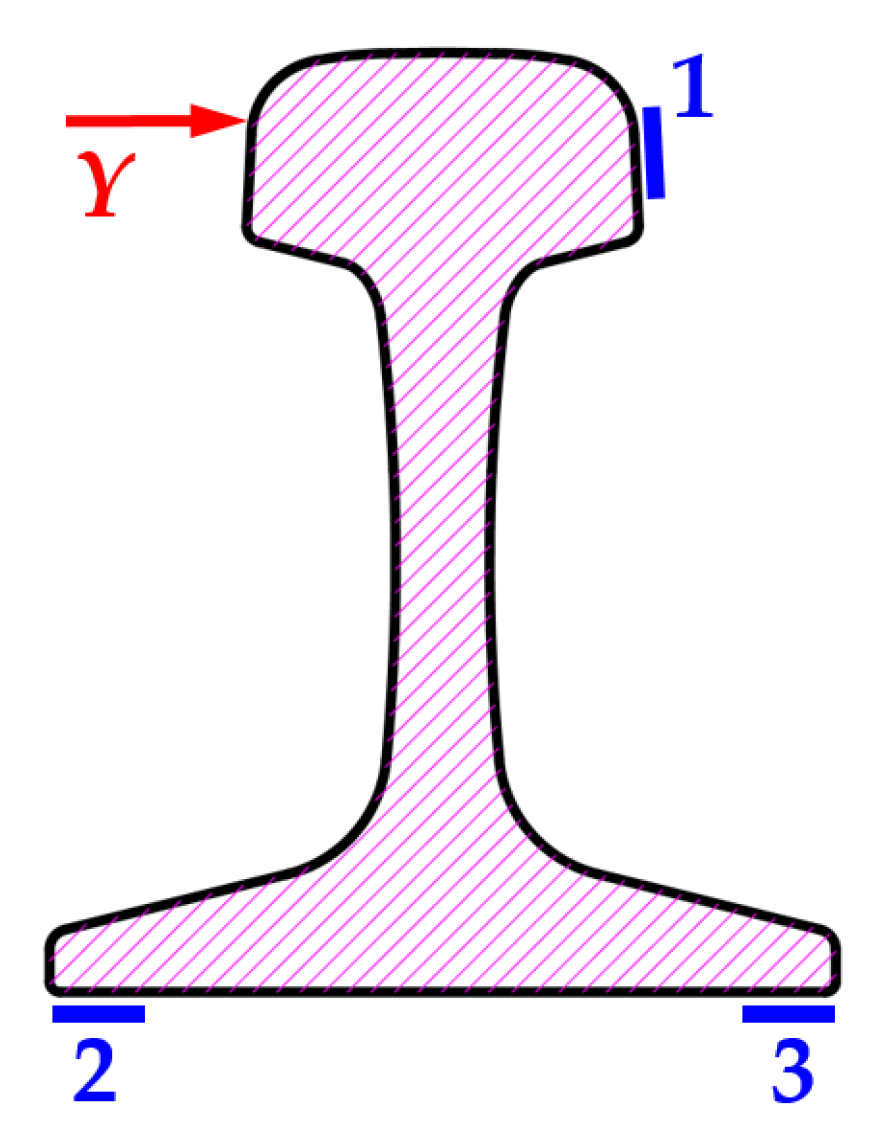
Figure 3.
Resistance strain gauge layout (a) and connection scheme (b) for lateral force measurement using the Schlumpf method. Points a, c—measurement diagonals; d, b—bridge feed; 1, 2, 3, 4—reference numbers of the resistance strain gauges in sections p and q.
Figure 3.
Resistance strain gauge layout (a) and connection scheme (b) for lateral force measurement using the Schlumpf method. Points a, c—measurement diagonals; d, b—bridge feed; 1, 2, 3, 4—reference numbers of the resistance strain gauges in sections p and q.
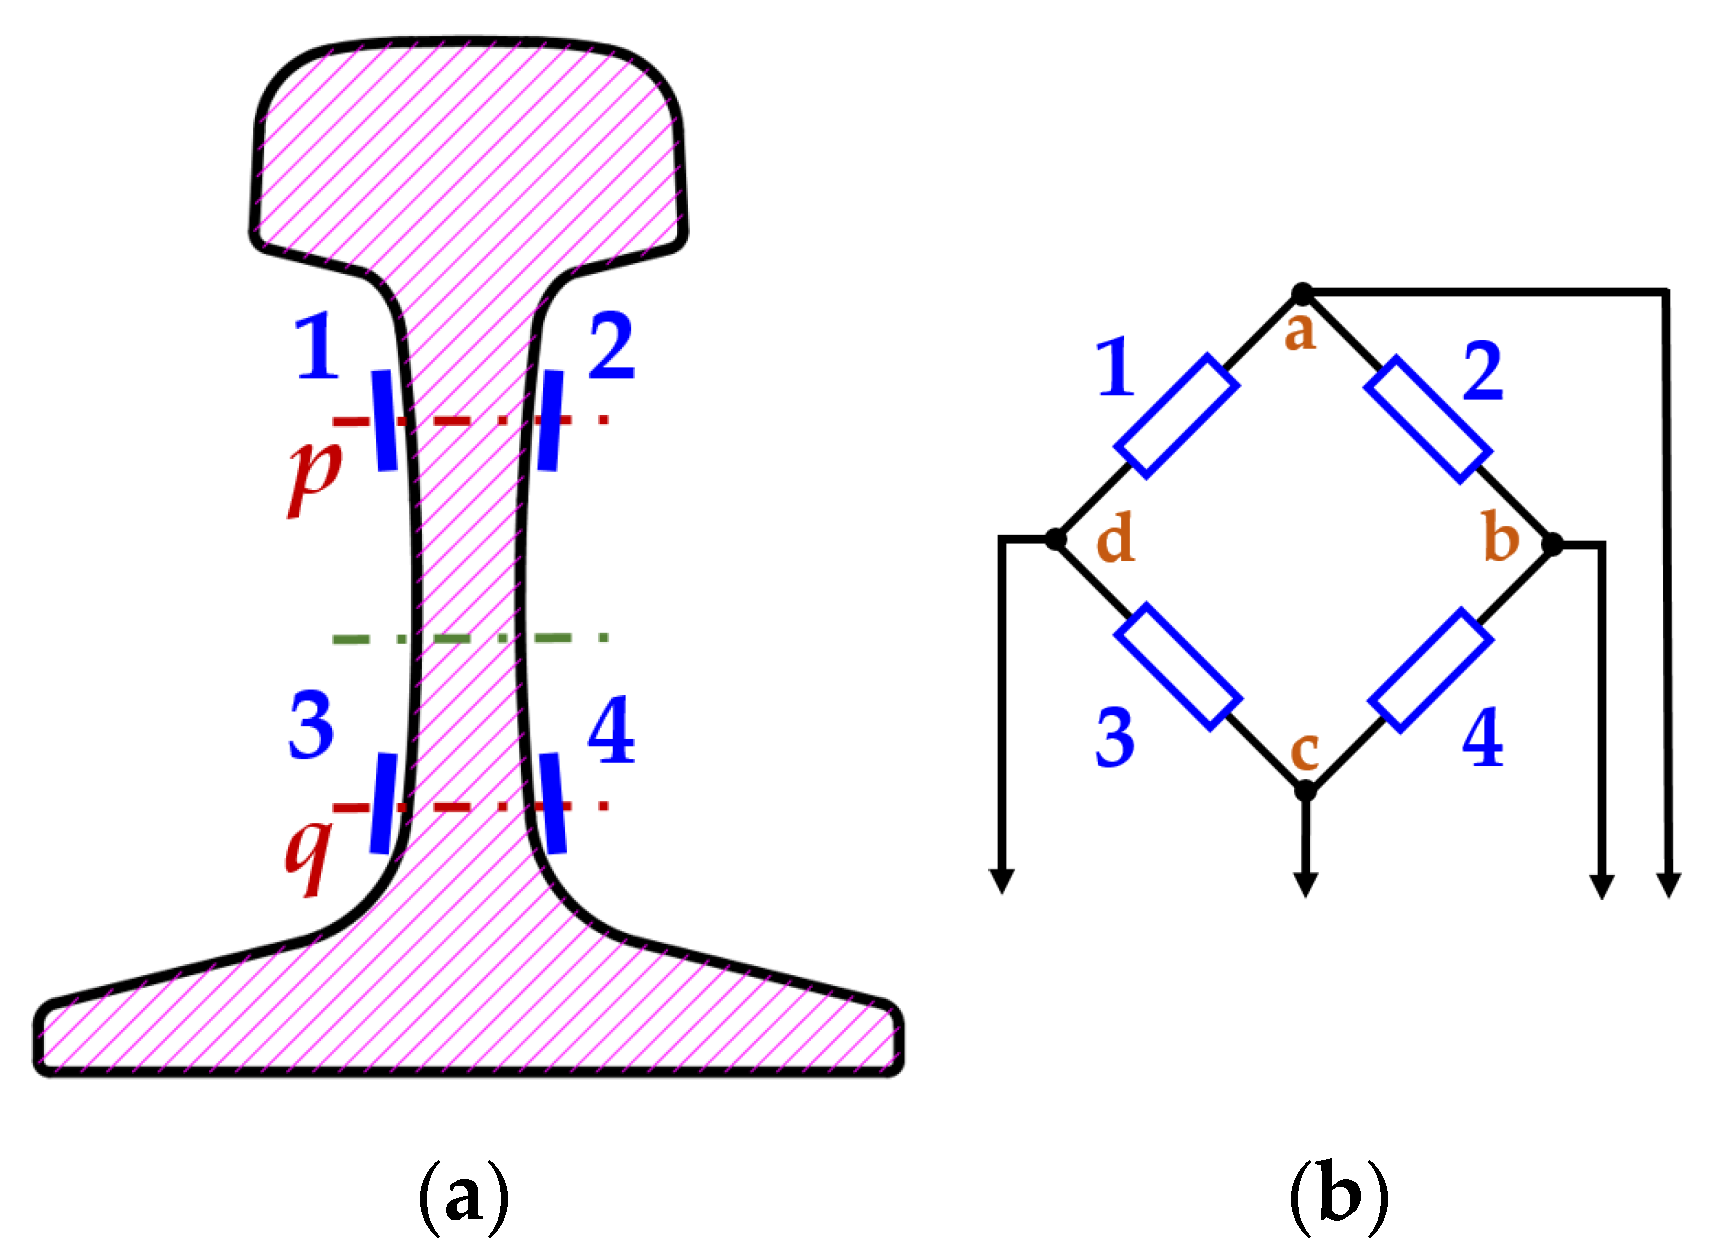
Figure 4.
Schematic sensors on the track and a diagram of rolling stock: E—sensors for measuring stresses at the edges of the rail foot; P—sensors for measuring vertical forces; Y—sensors for measuring lateral forces according to the three-point method; S—sensors for measuring lateral forces under the Schlumpf method; L—sensors for measuring longitudinal forces; blue points—the determined positions of the wheels of the rolling stock.
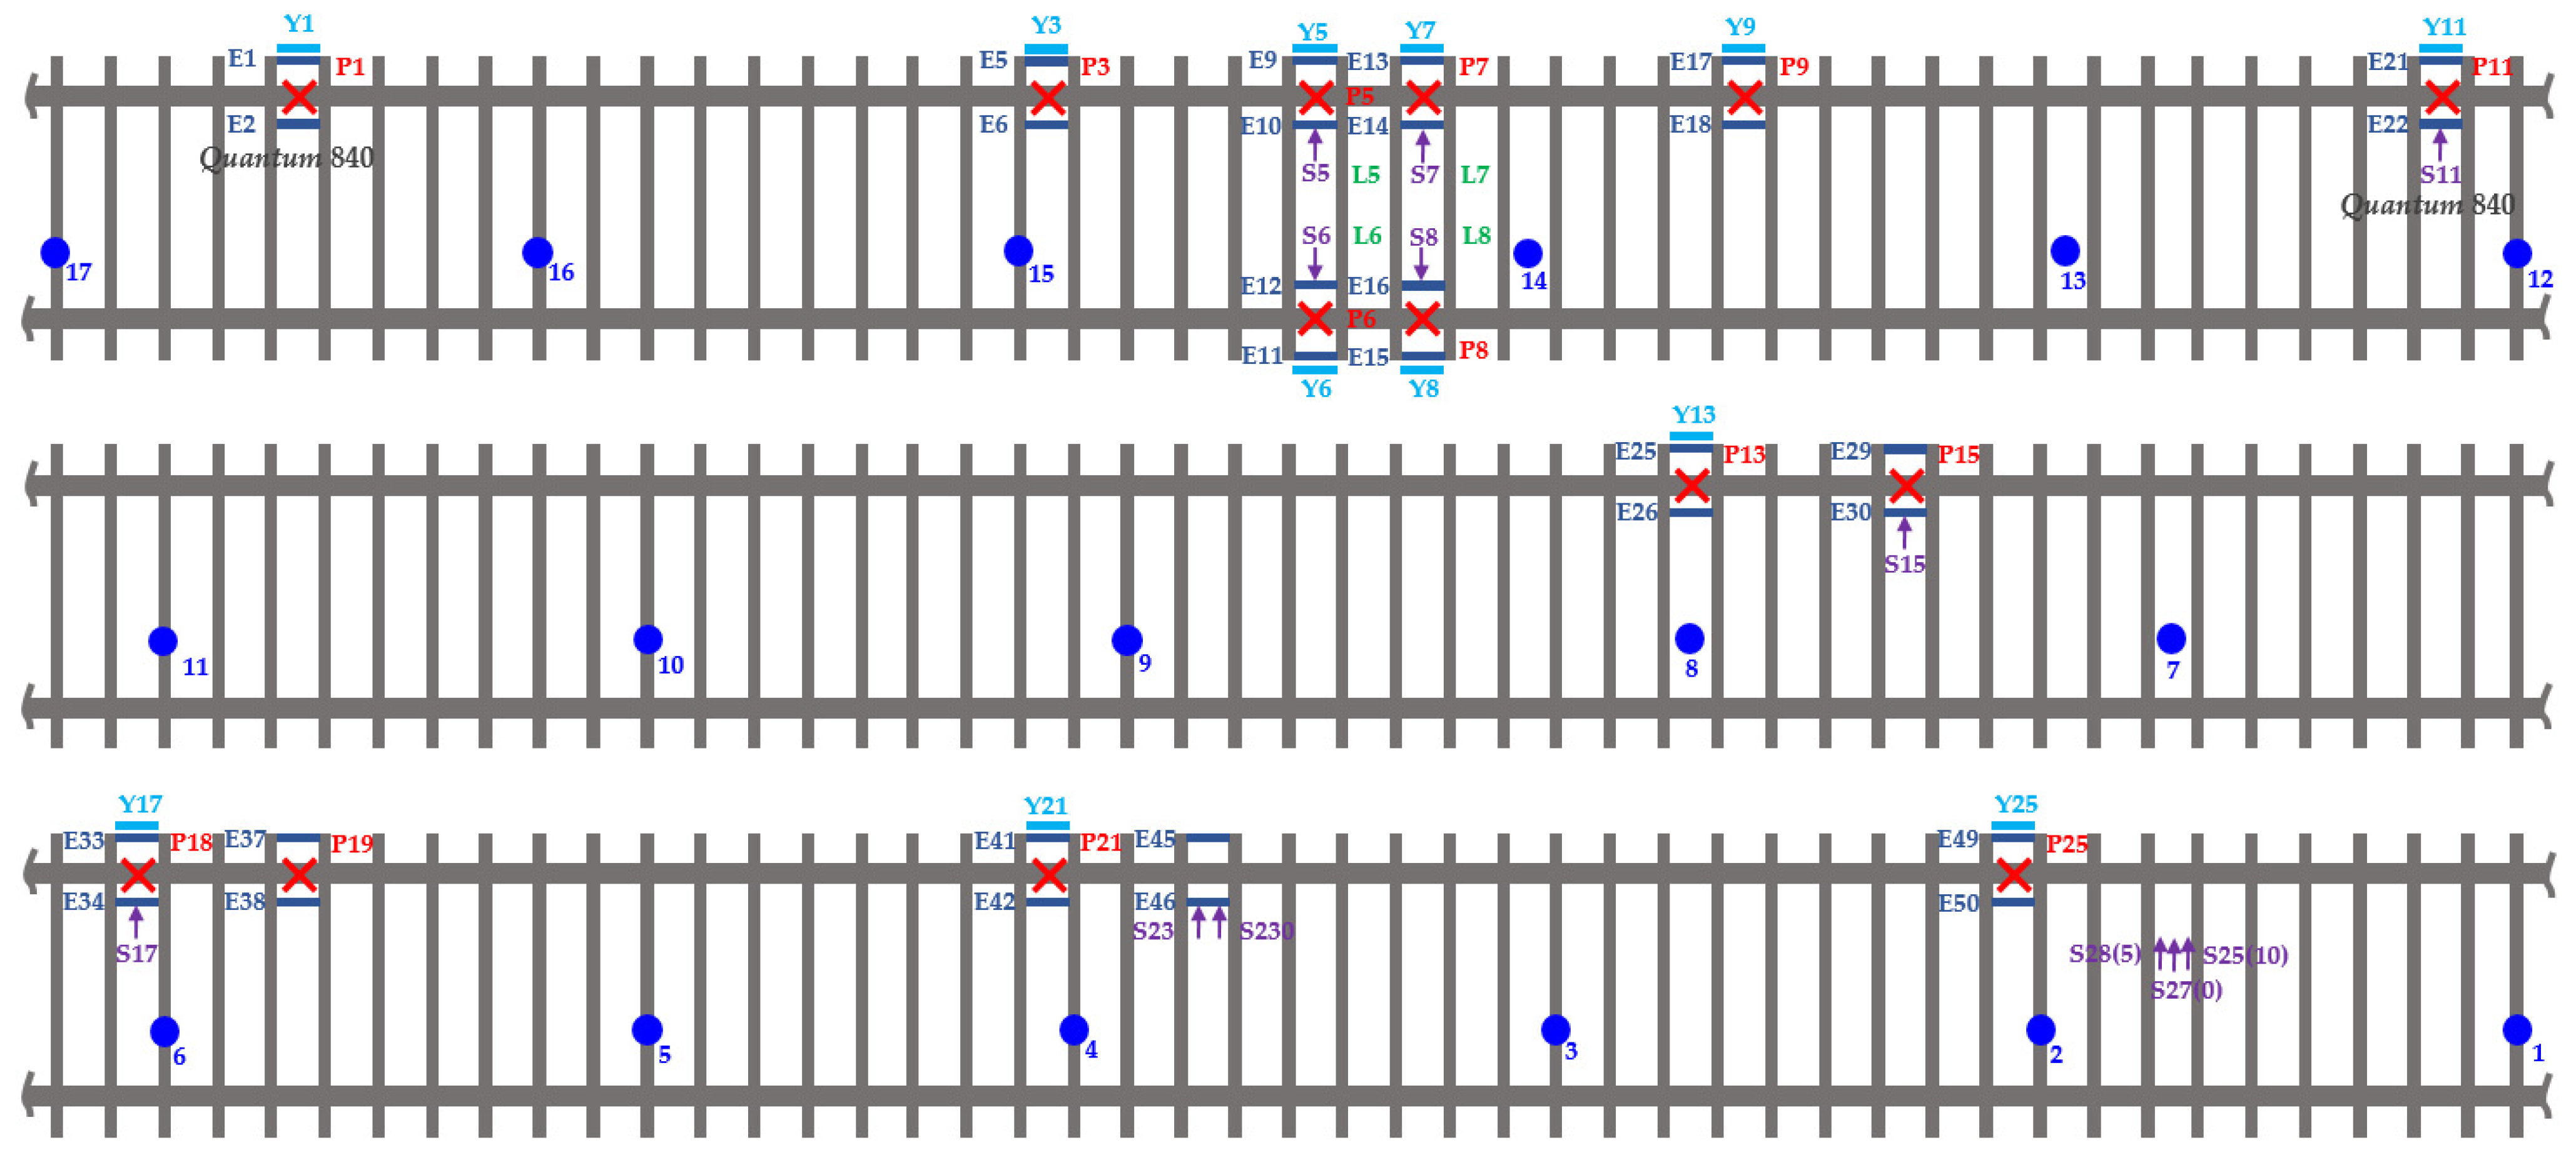
Figure 5.
Sensor layout (photograph taken by the authors).
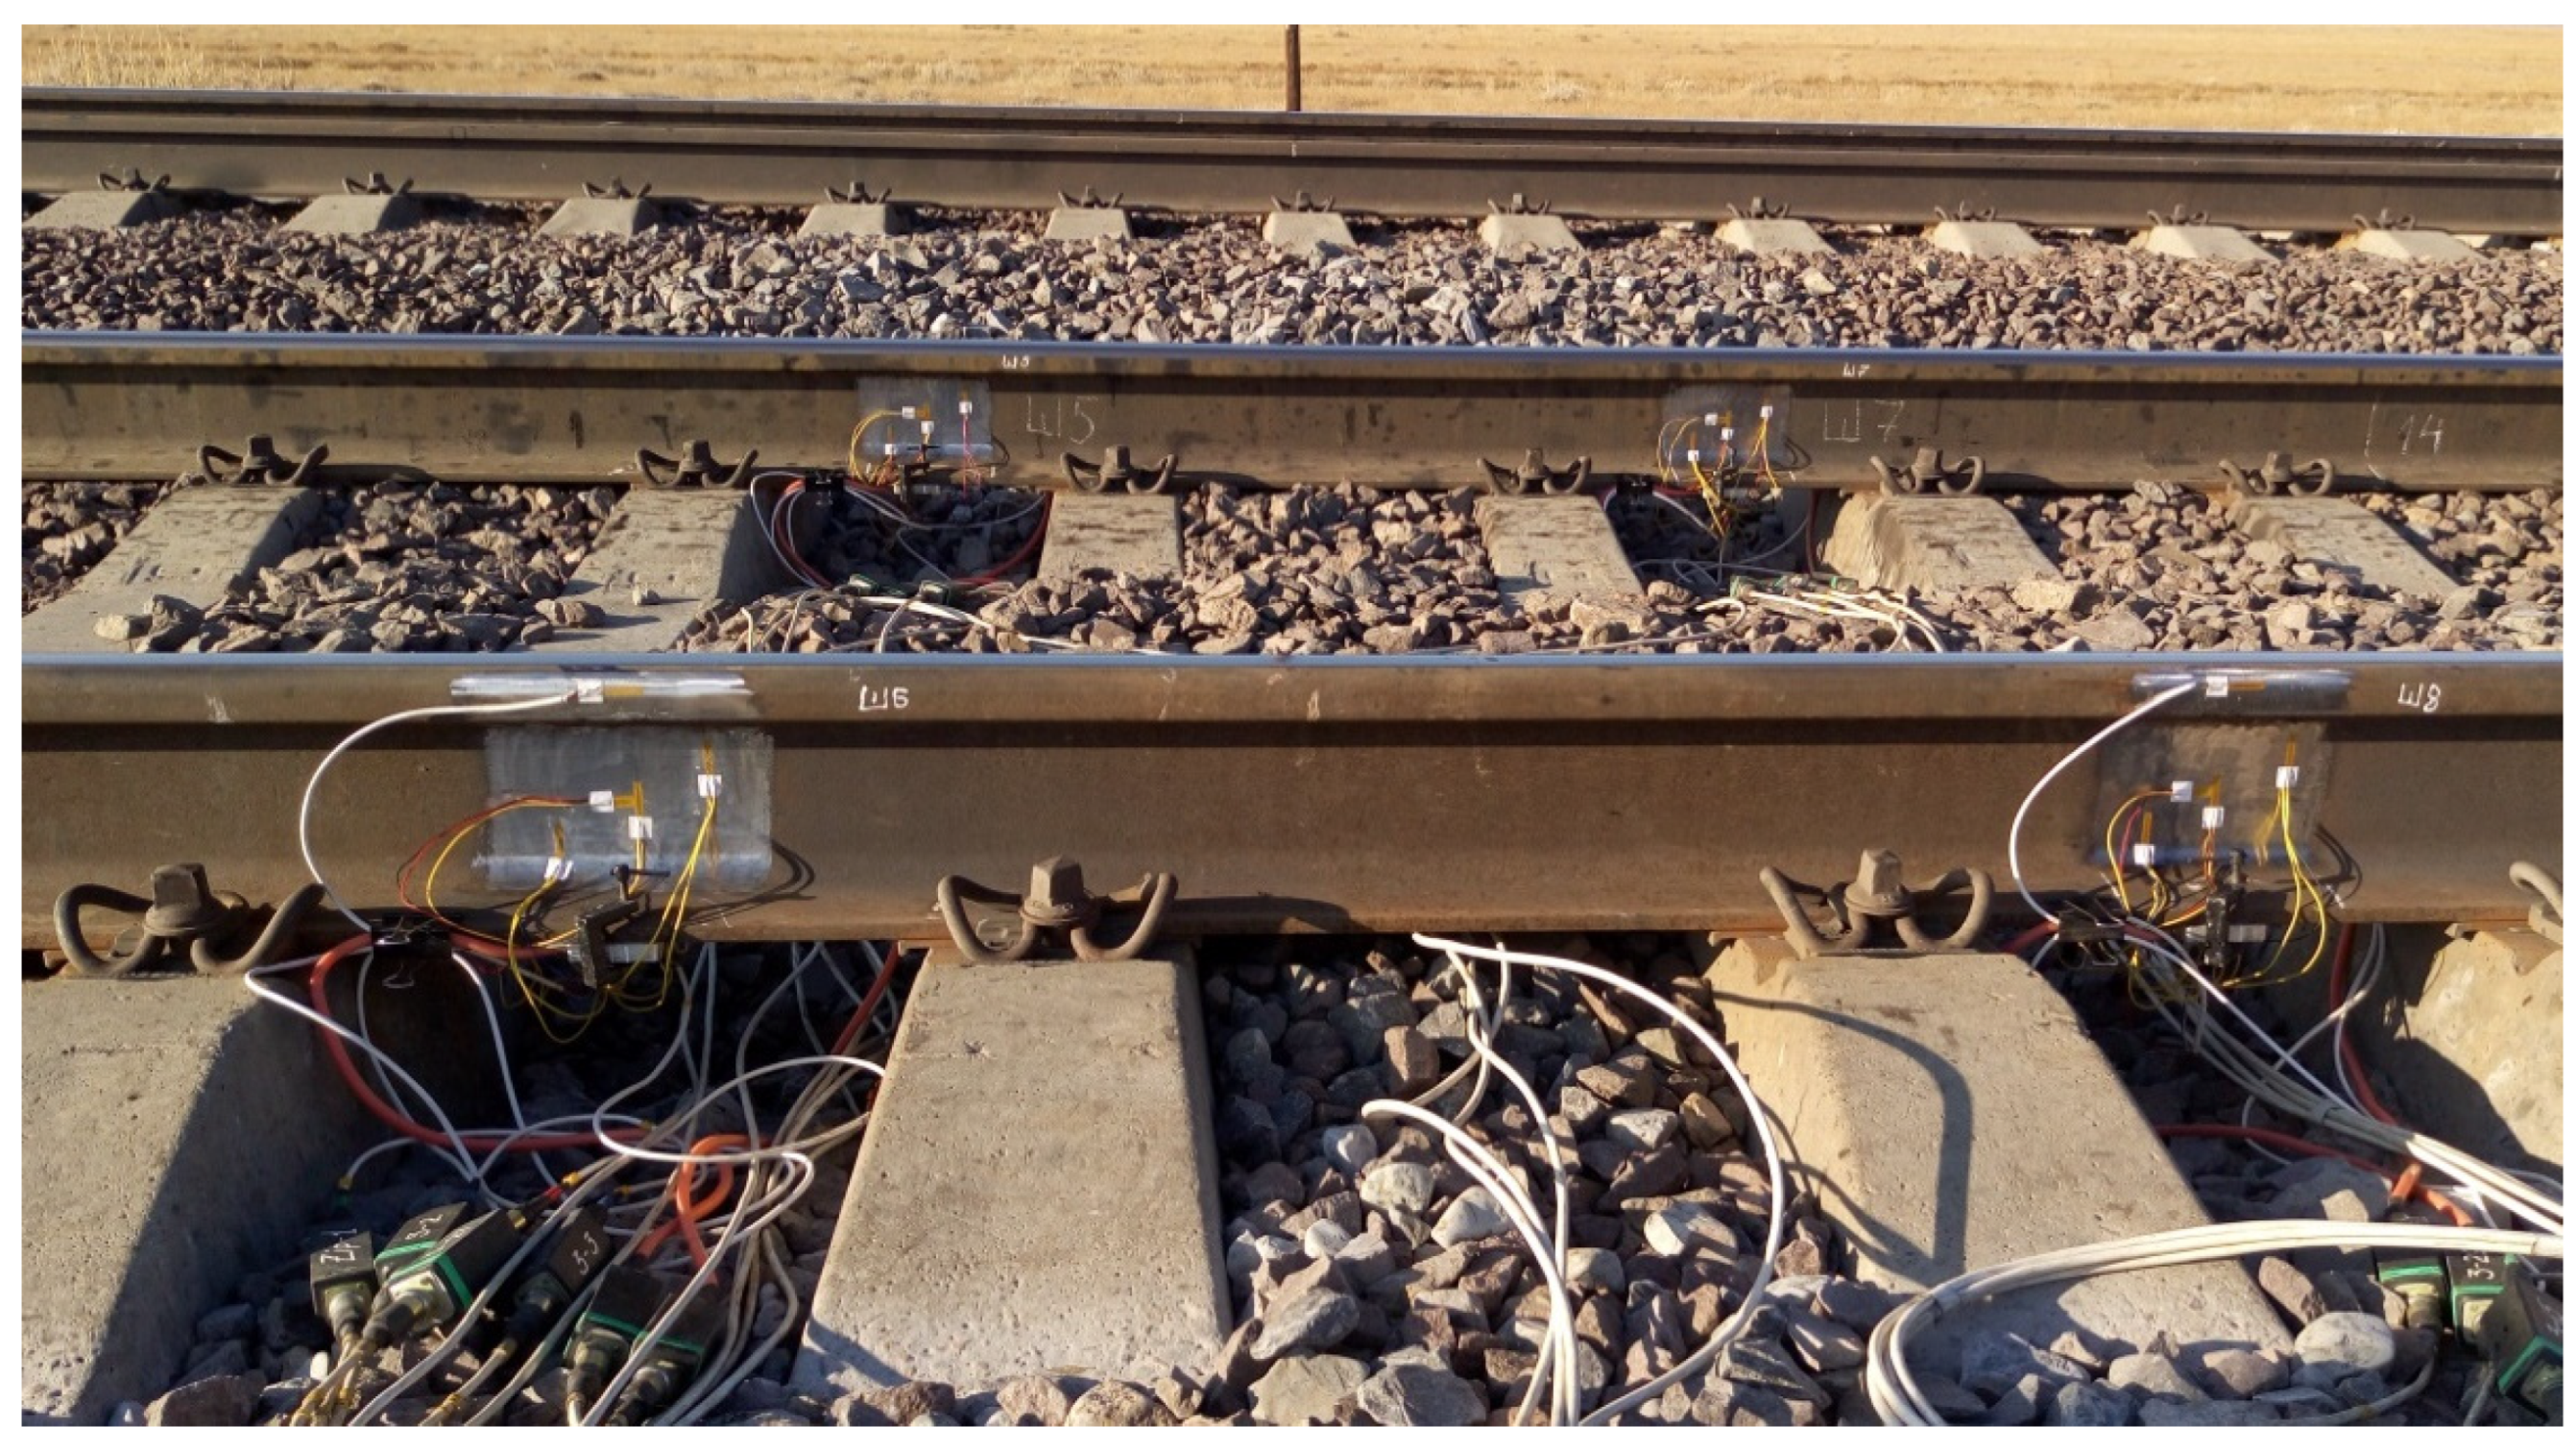
Figure 6.
Wagon truck (photograph taken by the authors).
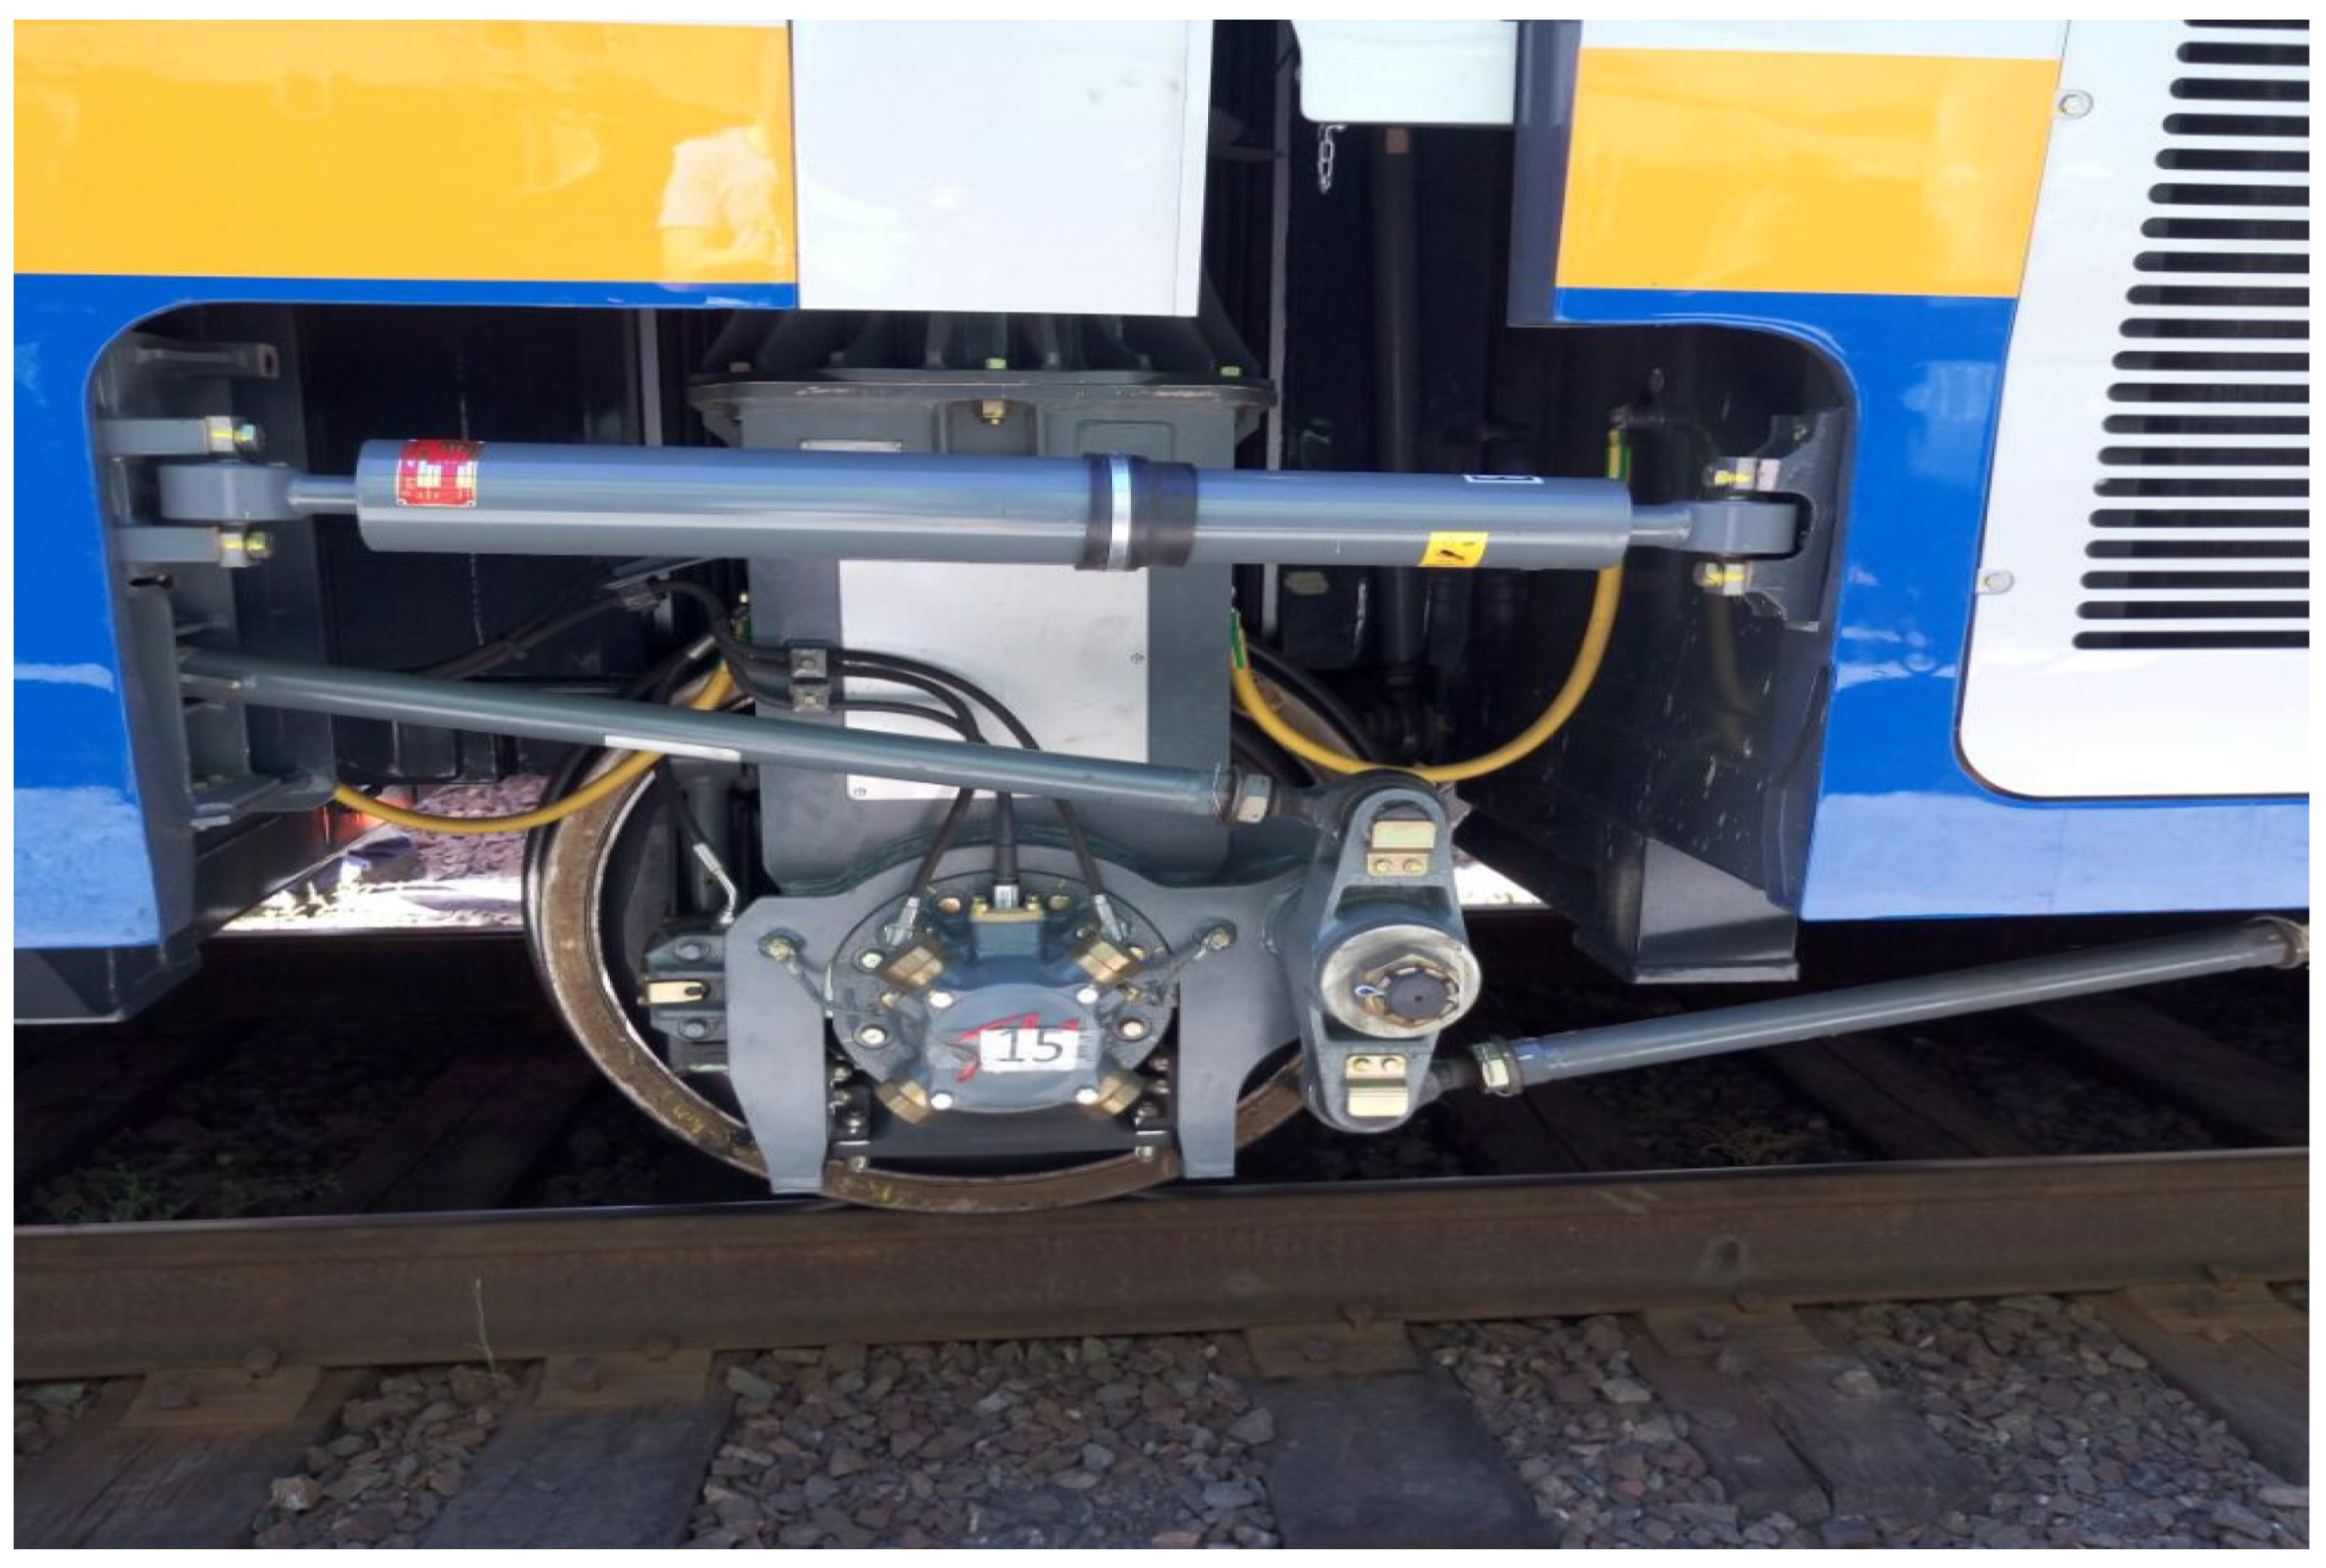
Figure 7.
Results of the experimental values of vertical forces.
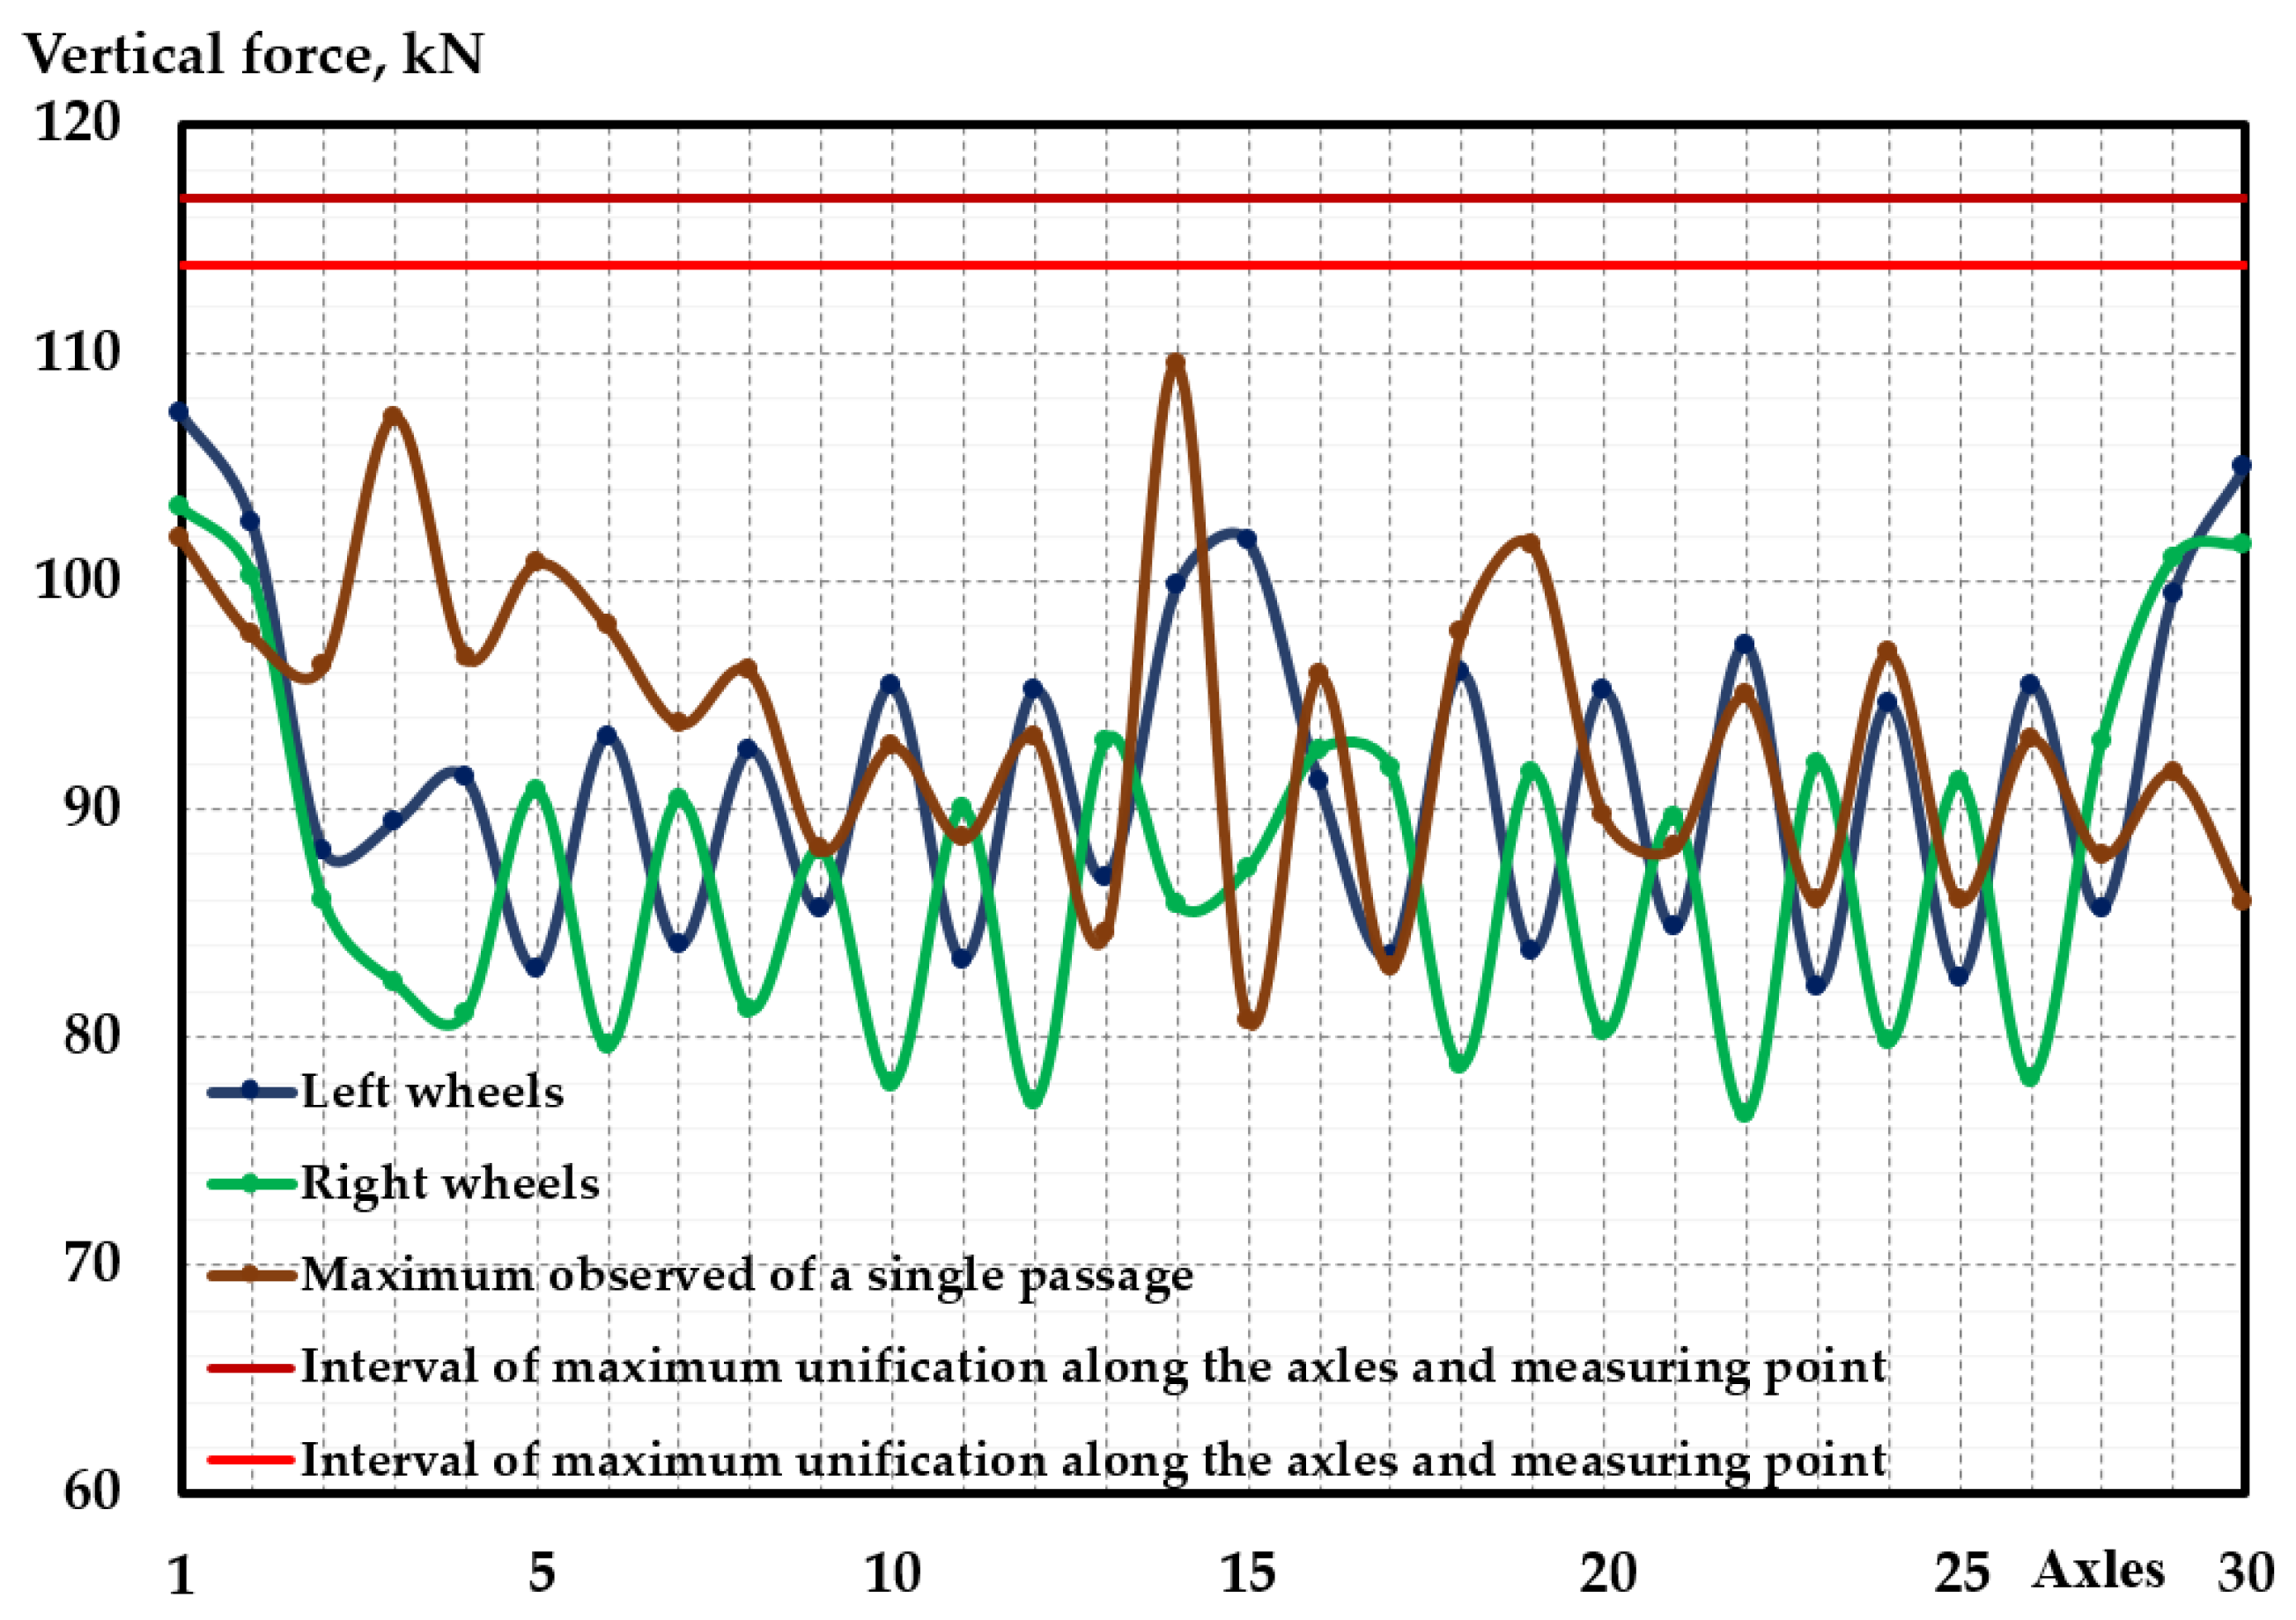
Figure 8.
Measurement of lateral forces using the Schlumpf method (photograph taken by the authors).
Figure 8.
Measurement of lateral forces using the Schlumpf method (photograph taken by the authors).
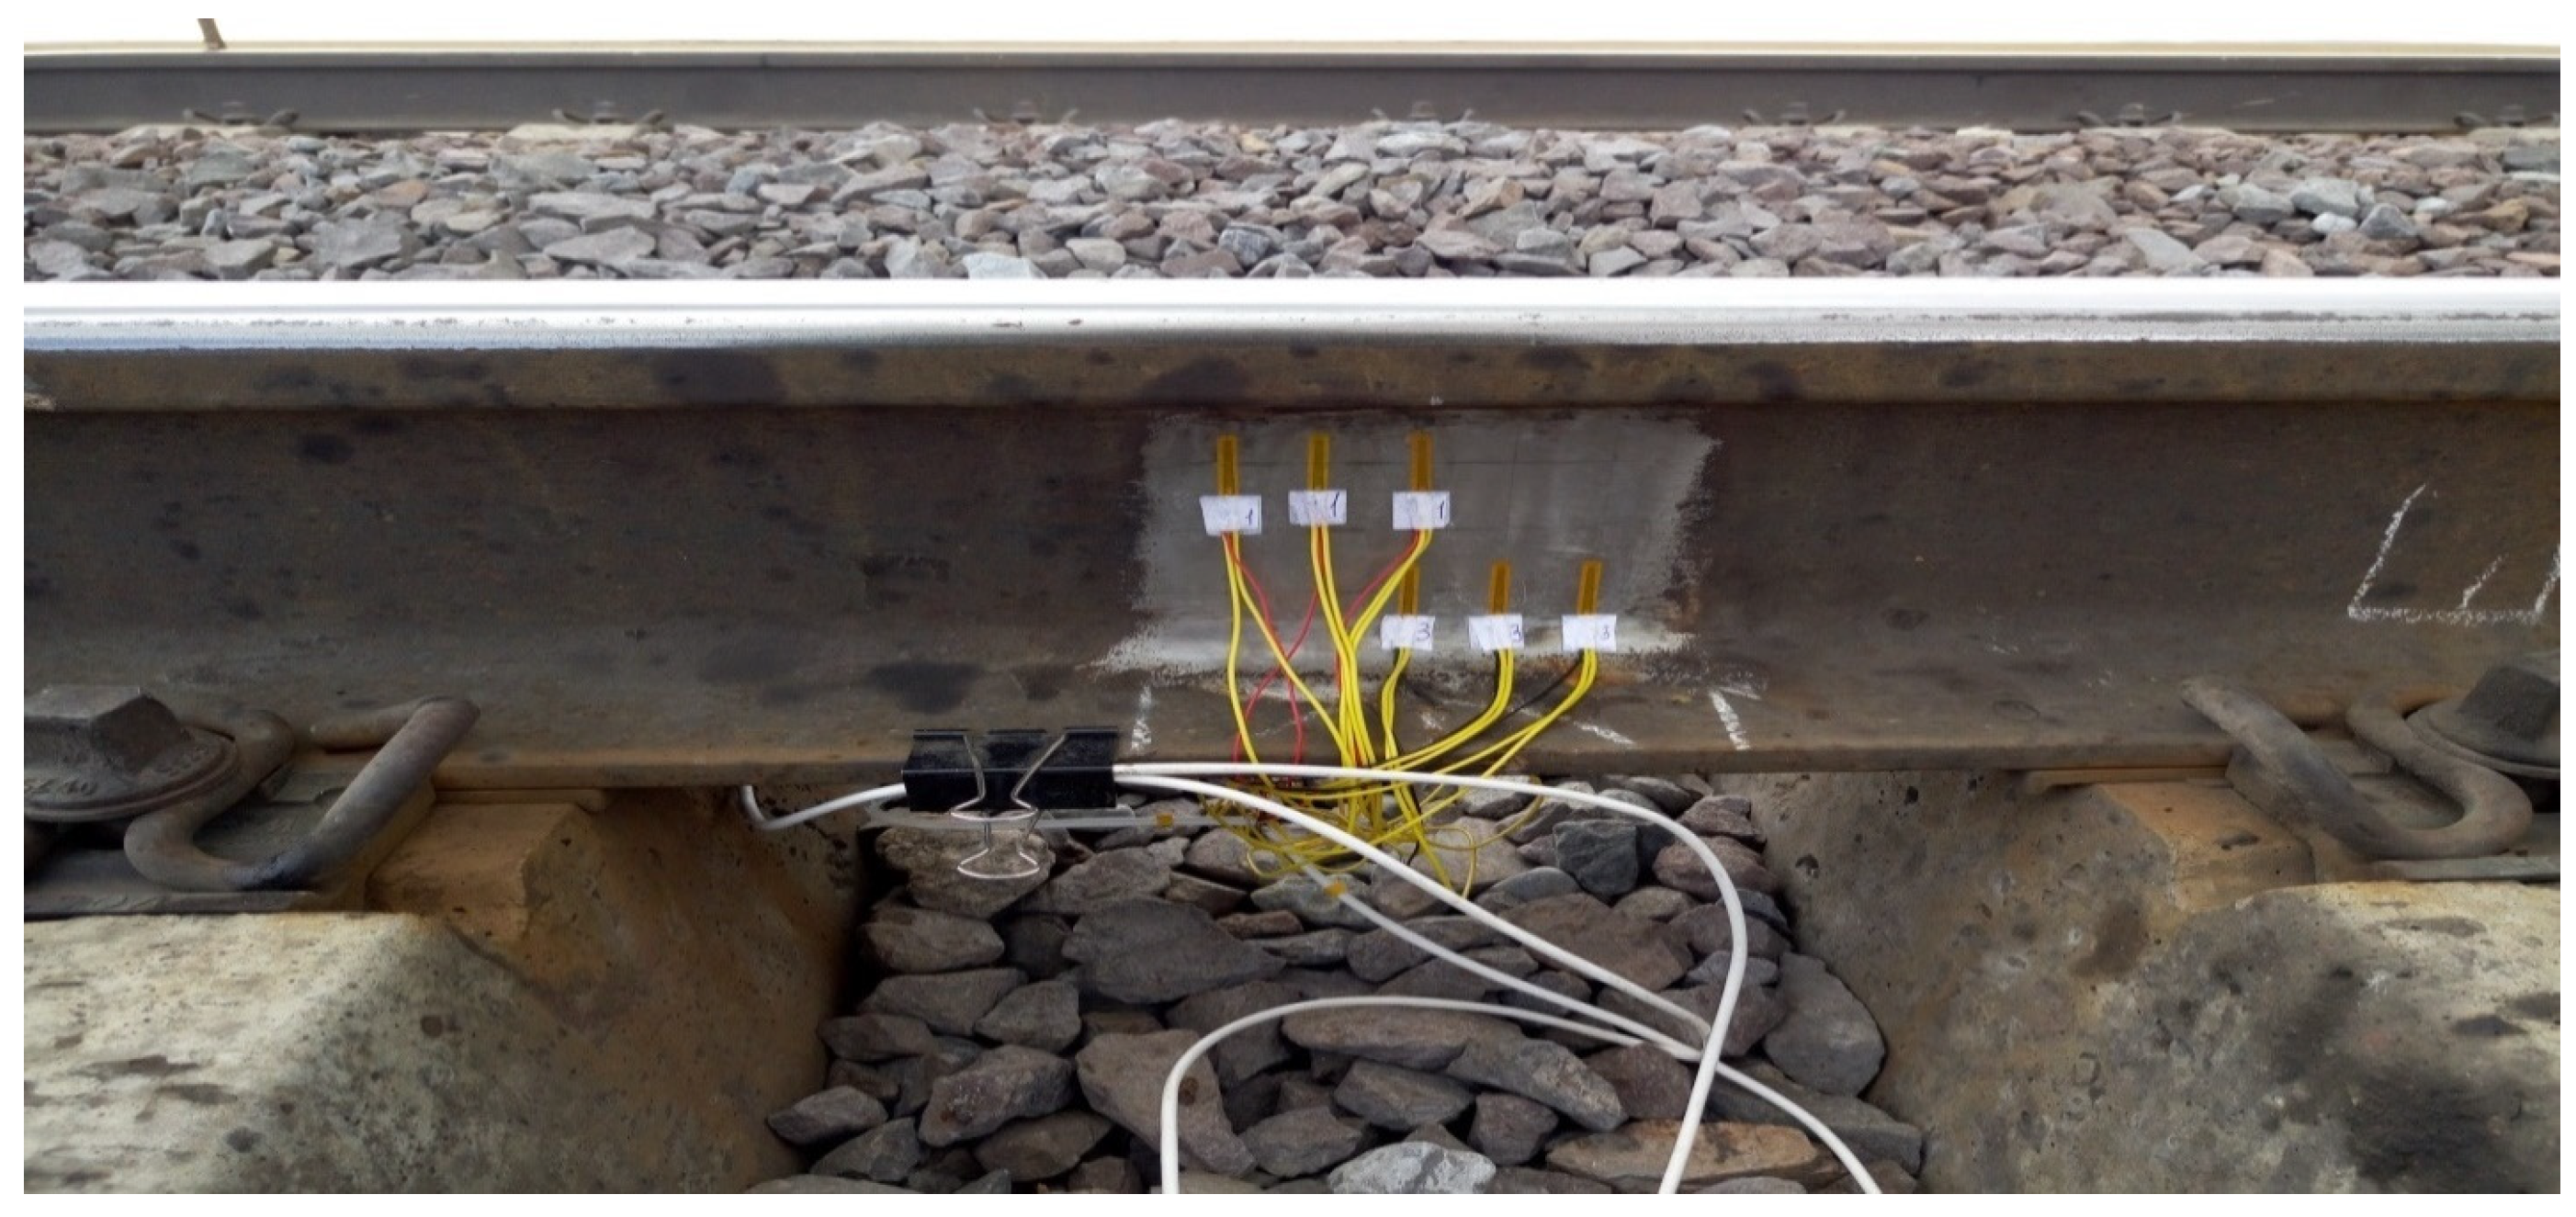
Figure 9.
Variants of the propagation of force inside the rail (1–rail base, 2–rail web, 3–rail head).
Figure 9.
Variants of the propagation of force inside the rail (1–rail base, 2–rail web, 3–rail head).

Table 1.
Rolling stock weighing data results.
| Type of Wagons | Axle | Axle Weight, kN | Average | Left Wheel, kN | Right Wheel, kN | Difference between Wheels, % |
|---|---|---|---|---|---|---|
| A | 1 | 210.6 | 206.7 | 107.4 | 103.2 | 3.9 |
| 2 | 202.8 | 102.6 | 100.2 | 2.3 | ||
| 30 | 206.6 | 105.0 | 101.6 | 3.2 | ||
| B | 29 | 200.4 | 200.4 | 99.4 | 101.0 | −1.6 |
| C | 3 | 168.8 | 170.3 | 88.2 | 80.6 | 2.5 |
| 4 | 171.8 | 89.4 | 82.4 | 7.8 | ||
| D | 15 | 185.6 | 185.6 | 99.8 | 85.8 | 14.0 |
| E | 16 | 189.2 | 189.2 | 101.8 | 87.4 | 14.1 |
| F | 5 | 172.4 | 174.3 | 91.4 | 81.0 | 11.4 |
| 6 | 173.8 | 83.0 | 90.8 | −9.4 | ||
| 7 | 172.8 | 93.2 | 79.6 | 14.6 | ||
| 8 | 174.4 | 84.0 | 90.4 | −7.6 | ||
| 9 | 173.8 | 92.6 | 81.2 | 12.3 | ||
| 10 | 173.8 | 85.6 | 88.2 | −3.0 | ||
| 11 | 173.4 | 95.4 | 78.0 | 18.2 | ||
| 12 | 173.4 | 83.4 | 90.0 | −7.9 | ||
| 18 | 175.4 | 83.6 | 91.8 | −9.8 | ||
| 19 | 174.8 | 96.0 | 78.8 | 17.9 | ||
| 20 | 175.4 | 83.8 | 91.6 | −9.3 | ||
| 21 | 175.4 | 95.2 | 80.2 | 15.8 | ||
| 22 | 174.4 | 84.8 | 89.6 | −5.7 | ||
| 23 | 173.8 | 97.2 | 76.6 | 21.2 | ||
| 24 | 174.2 | 82.2 | 92.0 | −11.9 | ||
| 25 | 174.4 | 94.6 | 79.8 | 15.6 | ||
| 26 | 173.8 | 82.6 | 91.2 | −10.4 | ||
| 27 | 173.6 | 95.4 | 78.2 | 18.0 | ||
| 28 | 178.6 | 85.6 | 93.0 | −8.6 | ||
| G | 13 | 172.4 | 176.2 | 95.2 | 77.2 | 18.9 |
| 14 | 180.0 | 87.0 | 93.0 | −6.9 | ||
| I | 17 | 183.8 | 183.8 | 91.2 | 92.6 | −1.5 |
Table 2.
Width of the wheel-to-rail contact zone depending on the rail wear.
| Vertical Wear, mm | Horizontal Wear, mm | Contact Zones, mm | Clearance between Rail and Wheel Flange, mm |
|---|---|---|---|
| 0.1 | – | 20.00 | 0 < δ < 22 |
| 1.7 | – | 49.10 | 0 < δ < 6.5 |
| 2 | – | 51.50 | 0 < δ < 6 |
| 7 | 39.63 | 0 < δ < 17.9 | |
| 15 | 31.58 | 0 < δ < 25.9 | |
| 18 | 28.58 | 0 < δ < 28.9 | |
| 3 | – | 56.55 | 0 < δ < 4.5 |
| 7 | 42.16 | 0 < δ < 18.9 | |
| 15 | 34.17 | 0 < δ < 26.9 | |
| 18 | 31.17 | 0 < δ < 29.9 | |
| 4 | – | 59.94 | 0 < δ < 2.0 |
| 7 | 43.85 | 0 < δ < 18.1 | |
| 15 | 35.86 | 0 < δ < 26.1 | |
| 18 | 32.86 | 0 < δ < 29.1 |
Disclaimer/Publisher’s Note: The statements, opinions and data contained in all publications are solely those of the individual author(s) and contributor(s) and not of MDPI and/or the editor(s). MDPI and/or the editor(s) disclaim responsibility for any injury to people or property resulting from any ideas, methods, instructions or products referred to in the content. |
© 2023 by the authors. Licensee MDPI, Basel, Switzerland. This article is an open access article distributed under the terms and conditions of the Creative Commons Attribution (CC BY) license (https://creativecommons.org/licenses/by/4.0/).
Share and Cite
MDPI and ACS Style
Bondarenko, I.; Lukoševičius, V.; Keršys, R.; Neduzha, L. Investigation of Dynamic Processes of Rolling Stock–Track Interaction: Experimental Realization. Sustainability 2023, 15, 5356. https://doi.org/10.3390/su15065356
AMA Style
Bondarenko I, Lukoševičius V, Keršys R, Neduzha L. Investigation of Dynamic Processes of Rolling Stock–Track Interaction: Experimental Realization. Sustainability. 2023; 15(6):5356. https://doi.org/10.3390/su15065356
Chicago/Turabian StyleBondarenko, Iryna, Vaidas Lukoševičius, Robertas Keršys, and Larysa Neduzha. 2023. "Investigation of Dynamic Processes of Rolling Stock–Track Interaction: Experimental Realization" Sustainability 15, no. 6: 5356. https://doi.org/10.3390/su15065356
Note that from the first issue of 2016, this journal uses article numbers instead of page numbers. See further details here.