
Redesigning a Solar PV Kiosk in High-Temperature Environments of Burundi, Africa

UNICEF East and Southern Africa Regional Office (ESARO), Nairobi P.O. Box 44145, Kenya
Sustainability 2023, 15(6), 5514; https://doi.org/10.3390/su15065514
Submission received: 15 November 2022
/
Revised: 3 March 2023
/
Accepted: 6 March 2023
/
Published: 21 March 2023
Abstract
:Solar PV systems in Africa are installed in high-temperature environments ranging from 25 °C to 40 °C. Experience and the literature note that these systems frequently fail a few years after installation and require the replacement of essential components such as PV panels, inverters, or batteries. In Burundi, batteries operating in high-temperature environments with a designed shelf life of 15 years are being replaced every 4 years due to thermal runaway. The motivation of this paper was to redesign a 45 kWh/day multi-use solar PV kiosk in Ruhoro, Burundi, Africa, so as to improve its sustainability. Using original primary field data, the project calculated a mean energy demand at the Ruhoro PV kiosk of 14.50 kWh/day in 2022 and a forecasted demand of 16.50 kWh/day in 2025. The kiosk is designed to supply 20.25 kWh/day after losses, which is sufficient for the current and future demand. The paper reviewed the impact of high-temperature environments on both solar PV panels and batteries. Results indicated only a 13% reduction in power output in the solar PV panels and a 60% reduction in the shelf life of acid gel batteries from 15 years to 6 years when exposed to temperatures of between 25 °C to 40 °C. To improve the shelf life of the batteries, the paper researched different cooling technologies for batteries. These included water cooling, fan cooling, and refrigeration cooling. Using engineering modelling formulae, the paper observed that the application of a fan cooling system resulted in an improvement in the product life of the batteries by 4 years and a refrigeration cooling system by 9 years. The paper concluded that using a refrigeration cooling system in the Ruhoro solar PV kiosk was appropriate and requires an additional 5.28 kWh/day. Factoring in this additional demand, the refrigeration cooling still reduced the lifecycle CAPEX cost from USD 94,625 to USD 72,875 over a 15-year period. The inclusion of a refrigeration cooling system also improved the net present value (NPV) cost effectiveness over a 15-year period from USD—62,481 to USD 4893. This is a net profit of almost USD 5000 if a refrigeration unit is installed. The paper therefore recommends the use of refrigeration cooling systems as appropriate for high-temperature environments such as the Ruhoro solar kiosk. It concludes that the refrigeration system is a cost-effective option for long-term sustainable use for communities in Africa living in high-temperature environments.
1. Introduction
Eleven (11%) percent of Burundi has access to the national grid electricity and twenty-nine (29%) percent of the population use off-grid solar PV kiosks [1]. In addition to supplying areas with low or lacking grid system connections, solar energy as renewable resource can contribute to energy requirements for social and economic growth in developing economies, with minimal negative environmental impact compared to non-renewable resources such as fossil fuels. However, solar energy generation is intermittent as it is limited to daylight hours and affected by weather conditions, which vary across the year [2]. As such, there is a mismatch between the energy supply generated and demand. Energy storage systems (ESS) are fundamental in balancing power demand and supply by reducing and ultimately eliminating intermittencies [2]. Battery energy storage systems are also increasingly being used to integrate solar energy into the grid [3] and can counter downtimes or load shedding in the national electrical grid. Solar kiosks are the predominant energy source for remote rural communities in Burundi. EES provides reliability in availability of power in such areas and an environmentally preferred alternative to other hybrid systems with harmful emissions, such as diesel generators [4].
Figure 1 shows the quantum of energy demand in East and Southern Africa, within health and education institutions [5], illustrating the energy demands in the region. Burundi’s power demand for these two facilities is estimated at 15,842 kWp [5]. However, despite the demand, many solar PV systems are unsustainable and break down within a few years of installation. Evidence from the literature show that 70% of solar PV systems in East Africa are non-operational within 5 years of installation [6]. USAID [6] notes that this is due to a range of institutional, social, and technological factors. One of the key technical factors noted is the impact of high-temperature operating environments on the sustainability of the PV panels, inverters, and batteries (the energy storage system, ESS) which are often installed in 25–40 °C temperatures.
The effect of temperature on solar PV and ESS has been widely published in the academic literature [7,8,9,10,11]. Regarding PV panels and modules, the temperature of the PV cell is a crucial parameter affecting the power output of the PV and longevity of the PV module system performance. Location characteristics such as ambient temperature are also key aspects that are identified in the literature and that influence PV module temperature [12]. Alshawaf et al. [7] studied the impact of two variables, including ambient temperature on the performance of solar PV in Kuwait, observing a decrease in solar power output in summer and winter seasons, depicting an impact from both low and high temperatures on battery performance. While the study modelled the multi-variable effects, it provides evidence on the power output reduction effect of high temperatures on solar PV panels. Aldihani et al. [8] supports this through their study on the effect of cooling solar PVs within the same context, displaying the result of a water-cooled panel (20 K reduction) enhancing power output at midday from 150 W to 170 W. The studies, in addition to examining the temperature effect, point towards two important considerations: the combined effect of temperature and other ambient factors such as dust or soil conditions on PV performance [7,9] and, secondly, the options for cooling solar PV components [8,10]. The latter falls within the scope of this study, albeit focusing on cooling mechanisms for batteries.
The academic literature further supports the USAID study [6] and indicates that high-temperature environments result in reduced battery life and potential thermal runaway. High ambient temperatures increase battery temperature, accelerating electrochemical and chemical reactions within the battery [13]. Though not a direct focus of this study, heat generated within the battery significantly impacts solar PV battery performance. Studies on this bear findings relevant to this discourse on temperature versus battery performance. A review of the effect on temperatures and thermal impact on lithium ion batteries (LIB) [14,15] describes the impact of high temperatures on LIB as including heat generation, aging, and thermal runaway, which can lead to huge financial losses if machines operating on these batteries are damaged, in addition to iterating the challenges of high temperatures on aqueous zinc ion batteries, including material (cathode) dissolution, side reactions, and the accumulation of heat within the battery, all of which could degrade battery life and performance. Chen et al. [16] further explored strategies to counter these effects including electrolyte modification, cathode modification, zinc-anode modification and the modification of the electrode separator. While gel electrolytes can also help prevent thermal runaway as the electrolyte’s thermal capacity response to high temperatures is improved [16,17], gel batteries are still susceptible to effects from high temperatures. Reducing the effects of high temperatures in batteries is complex, requiring an understanding of the behavior of heat generated within the battery [14]. This study, while acknowledging this complexity, focusses on the impact and mitigation of ambient temperatures on battery shelf life and invites continued study of the interaction of internal and environmental temperatures on batteries.
Based on the literature, it is noted to model the current impact of high ambient temperatures on the operating efficiency of solar PV systems. Using engineering formulae from Koko [18] and Das and Mandal [19], the percentage reductions in the operational efficiency of the solar PV and battery components have been calculated when operating at 25 °C, 30 °C, 35 °C and 40 °C. Similarly, there is significant evidence of the impact of high-temperature environments on battery life and their impact on the overall energy/power output [20] as similarly observed in the Ruhuro solar PV kiosk. Previous studies [15,21,22,23] have estimated the impact of different cooling systems on the batteries.
Suitable temperatures for battery operation are prescribed as 10–20 °C, and a 10 K increase in temperature can reduce battery lifetime by up to 50% [13,17]. From a cost perspective, while it is desirable for solar PV batteries to be low-cost, they significantly affect the cost of a PV system and can become the highest-cost PV component when the battery lifetime is curtailed [17]. Hence, battery operating temperature is a functionality and cost issue. The NPV (net present value) of the battery and cooling system, which forms the focus of this study, can be calculated using Jankowiak et al. [24]. However, it is worth noting that previous studies on solar PV and EES have also detailed the economic viability of EES [2,25] including cost analysis using metrics of levelized cost of electricity (LCOE) and levelized cost of delivery (LCOD) that accounts for the cost of energy generation [25]. Salim et al. [26] additionally draw attention to the consideration of social and environmental costs in the end-of-life (EoL) management of PV panels and battery ESS.
2. Materials and Methods
The data collection for this project was undertaken in Ruhoro, Burundi (Figure 2). Ruhoro is located in Ruyigi area, on the eastern side of Burundi. Burundi’s access to electricity is one of the lowest in Africa, with only 11% of the population connected to the grid. Only 3.5% of the rural population has access to grid electricity [1]. This prompts the reliance on alternative sources such as solar powered kiosks in these areas.
The Ruhoro Solar PV system produces 20.25 kWh/day for 1500 people from 6 monocrystalline PV panels (360 Watts, Wp SCHR 5BB, 4 kW inverter and 4 batteries (Battery 12 V 250 A C10 Gel)). The energy produced from the solar PV system is used for an internet café and community center.
This paper follows a 3-step methodology as shown in Figure 3. The impacts of high temperature on two of the three components of the ESS, that is, the solar panels and battery, were analyzed. Subsequently, technological options for battery cooling were modelled to determine the net present value (NPV) of the solar PV system cooling options.
2.1. Impact of High Temperature on Solar PV
The mean kWh/day data were used from the Ruhoro site and modelled to estimate the impact of high temperatures on the solar PV efficiency. This was undertaken using the data on efficiency change that were calculated versus temperature and then applied using the formula for determining power generated from a solar PV array [18,27]. That is:
where:
Power Ppv (t) = Apv × ηpv × G(t)
Apv is the PV array surface area m2
ηpv is panel efficiency in different temperatures
G(t) is solar plane of array irradiance perpendicular in kW/m2 *
* The author used the G(t) from the EU-JRC GIS plane of array solar irradiance spreadsheet panels between 20 °C and 40 °C.
2.2. Impact of High Temperature on Ultracel Gel Battery (12 v 250 A C10 Gel)
2.2.1. Efficiency Changes in the Battery
To estimate the impact of high temperatures on the power efficiency of the battery, the project used the Nernst equation, which establishes a relationship between voltage and temperature in a battery [28].
where:
E is the actual voltage at a certain temperature
EØ is the voltage under standard temperature conditions of the battery
R, n and F are constants
T is the thermodynamic temperature
Q denotes the equation , such that Q < 1 when the battery is in discharge state and lnQ < 0.
2.2.2. Temperature Impact on Battery Life
The formula below was adapted from [29] to determine the impact of high-temperature environments on the battery life:
* Where 0.7 is the safety factor.
The calculations will confirm the impact of high-temperature environments on voltage output from the batteries and the impact on the shelf life of the batteries when exposed to temperatures between 20 °C and 40 °C.
2.3. Step 3—Battery Cooling Technology Options
A comprehensive literature review was undertaken and options of cooling the batteries using water, air, and refrigeration were considered. From the literature, the following three calculations were performed using data on the specification of the batteries:
- Battery without any cooling method
- Battery with DC fan cooling
- Battery with refrigeration cooling
The formula used by Abdullah et al. [8] to calculate the thermal efficiency and to determine the impact of cooling on the energy demand of that cooling is:
where:
Cfan is a constant 0.0006 J/m3 from Abdullah et al. [11]
Ibattery is the battery radiation intensity W/m2
APV is the battery coverage area (m2)
Vair is the energy requirement
The final step of the project analyses the capital expenditure costs (CAPEX) based on evidence in Luerssen et al. [23] That is:
where:
are the PV system, diesel generator, thermal energy, specific battery cost per unit energy, and specific battery cost per unit power capital costs, respectively.
ETES represents thermal energy storage capacity
Ebattery is the battery capacity
Using the options from the CAPEX model, data will then be entered into the spreadsheets from [29] for net present value (NPV) calculated using:
where
C0 is CAPEX
N is the number of years
I is the discount rate
R is the yearly revenue
3. Results
3.1. Demand and Sizing
Demand was calculated using data for a specific monthly mean demand of 14.48 kWh/day. The future development demand indicates an increase of 0.5 kWh/day. By 1 January 2025, the future demand (based on future development) will therefore be 16.5 kWh/day. The graph in Figure 4 shows the energy demand projected to 2025.
A comparison of the calculated energy demand using standard test conditions (STC against actual supply (Table 1) shows that there is sufficient energy supply to meet the current and future demand of the system.
The energy is generated from six mono crystalline PV panels with a Watt power installation of 45.6 kWh/day. The panels are type Sunlink 360/375 Wp SCHR BB MC4 GRADE TV PerC M+, with the maximum optimum operating temperature being 44 ± 2 °C. The solar PV panels convert sunlight into energy. There are 10% losses through the hybrid inverter.
However as noted in Table 1, the energy supplied outstrips the energy demand. Hence, subsequent calculations will consider the 2025 re-design estimate of the mean energy demand of 16.5 kWh/day to reach future energy requirements.
3.2. Solar PV vs. Temperature. Calculation
The solar PV output was modelled against temperature using the formula in Equation (1) from Markvart and applied in Koko [18,27]. Table 2 summarizes the results of solar PV against temperature.
Results indicate a reduction in energy from 3.8 kWh/m2 to 3.3 kWh/m2 between 20 °C to 40 °C (Figure 5), which is a 13% reduction in power output.
Results also indicate a change in panel efficiency with temperature (Table 3). There is a reduction in panel efficiency from 0.025 to 0.016, which is a 36% reduction in panel efficiency between 25 °C and 40 °C. The specifications of standard operating conditions for the SCHR 5BB MC4 A Grade TUV PerC M+ monocrystalline panels indicate a 15-year lifespan if operated within the 44 °C temperature.
3.3. Batteries vs. Temperature
The Ruhoro solar kiosk project uses an Ultracel Gel Battery (12 v 250 A C10 Gel) installed in Burundi. The battery manufacturer specifications [30] indicate a nominal operating temperature range of 25 ± 3 °C.
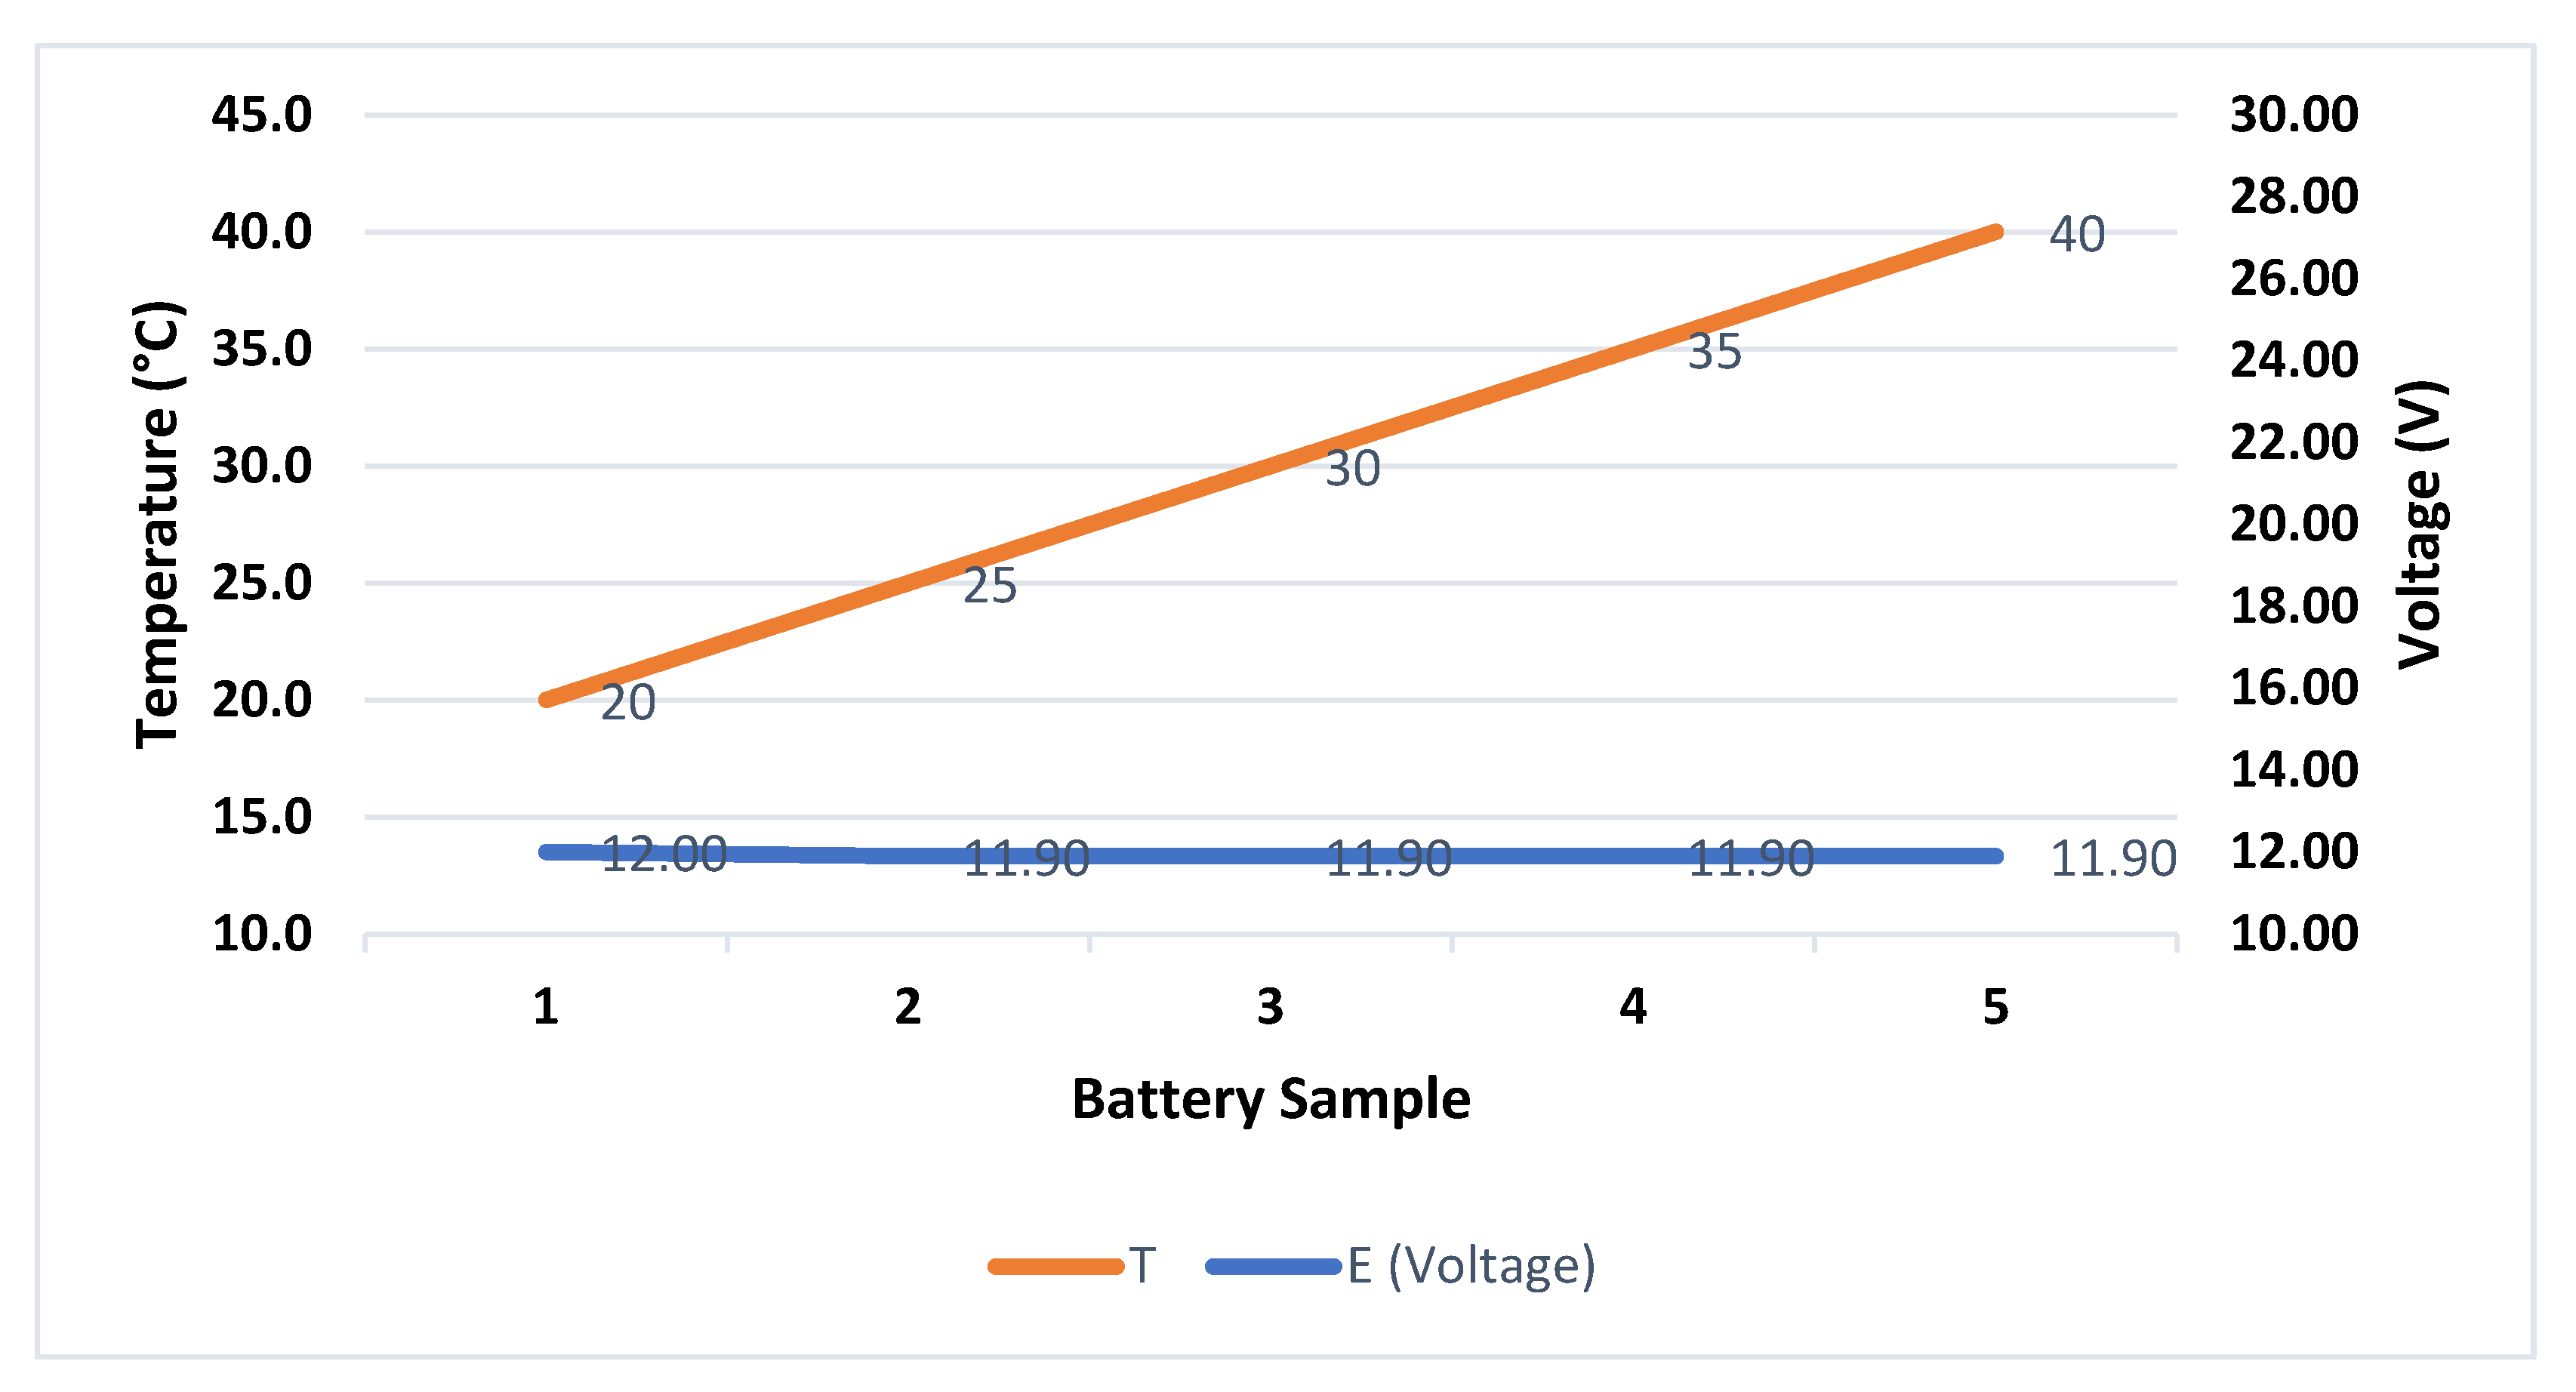
Using the Nernst formula [28] indicated in Equation (2), the battery voltage output was determined; results are shown in Figure 6. The results show a minimal reduction from 12 to 11.9 volts between 20 °C and 40 °C. This is a nominal < 1% reduction in voltage output.
The reduced shelf life of the battery can then be calculated using the formula in Equation (4) [29,31]. The following applies:
- A factor of safety of 0.7 allows for gaining an optimum temperature. It will vary with increased temperature. The formula is applied, reducing the factor of safety as temperature increases.
- The battery capacity of 250 Ah (see appendix) is 250,000 mAh.
- The load current is 12,000 mA
Thus, at 20 °C, the battery life is:
The battery life against temperature was calculated and results summarized in Table 4.
The battery manufacturer specifications [30] indicate for the Ultracel Battery (12 v 250 A C10 Gel) that there is a reduction from 3000 cycles to 1600 cycles when the battery operates at 40 °C. The results above verify the manufacturer’s literature, which notes that the optimum operating temperature for the batteries is 25 ± 5 °C to ensure a 15-year shelf life of the battery at 20 °C. This reduces to 6.2 years when operated in high-temperature environments of up to 40 °C.
3.4. Battery Cooling Options
Cooling options to keep the battery at the optimum temperature of 25 ± 5 °C were researched. These included (a) water cooling, (b) fan cooling, and (c) refrigeration cooling.
For the study, water cooling was discarded due to the health and safety risks outlined in the Discussion section. The study hence focused on the use of DC fan and refrigeration as a means of cooling the battery to within the 25 °C operating environment. Referencing the formula from Abdullah et al. [11] in Equation (4), the parameters applied and results for energy requirements for each cooling system are shown in Table 5. The additional ratios for the kWh requirement for the system with fan or refrigeration cooling are also determined as shown in the table.
The project concludes that the additional energy requirements for fan cooling and refrigeration cooling are 0.28 kWh/day and 5.28 kWh/day, respectively. Thus, energy demand against supply with the cooling options modelled is shown in Table 6.
The demand with fan cooling is within the specification of the existing solar PV and battery supply (in kWh/day). This increases with the use of refrigeration cooling to 21.78 kWh/day, which will require additional batteries and solar PV panels to match demand (Table 6).
3.5. Cooling System Costings
To calculate the additional costs (Table 7), the project used field cost data from the Ruhoro Solar PV kiosk.
From the results as shown in Table 7, the most expensive option for the Ruhoro solar PV kiosk is the current model with no cooling. This is due to the replacement costs of the batteries over the 15-year period. The fan-cooled system is the second most expensive system, and the most cost-effective system is the refrigeration cooling system.
The Ruhoro Solar kiosk has an annual revenue of 5760 USD that is broken down as:
- Rent of electric sockets for phone charging and barbers at 200 USD per month = USD 2400 per annum
- Rent of 250 lamps at 1 USD per lamp per month = USD 3000 per annum
- Computer printer of 16,000 pages per month at 15 USD per month = 180
- 1 canal+ rent at 15 USD per month = USD180
Following the CAPEX and revenue cost, the net present value (NPV) was calculated using the formula (Equation (6)) from the spreadsheets [24]. Table 8 summarizes the results of the NPV of each cooling system.
Based on the net present value (NPV) analysis, the number of years that the solar PV kiosk can optimally operate without battery replacement are 6 years with no fan, 10 years with a fan, and 15 years with refrigeration. The analysis indicates that the use of refrigeration cooling therefore provides the most efficient NPV with a positive net value of USD 4893.
4. Discussion
The findings from this project concluded that there is minimal impact of high-temperature environments on Solar PV panels. The research noted a 6% reduction in power output from 20 °C to 40 °C. To further reduce the impact of high temperatures on the solar PV, careful mounting and installation is required to ensure a flow of air between the panels and the roof. Solar PV panels should not be installed directly on the metal roofing sheets in Burundi to minimize any impact.
The findings also noted a high impact of temperature on battery shelf life and productivity. This is in line with the literature that notes high-temperature environments accelerate the chemical and acidic processing cycling speed in the battery cells and result in reduced battery shelf life [31]. In their lifecycle analysis of batteries, Pederson et al. [31] also stated that the gel or water in the electrolyte volatizes in high-temperature environments. This results in a precipitation of salts, increased pressure, and reduced battery shelf life. Other battery types, such as lithium ion batteries, were not explored due to the high cost.
This project observed a similar reduced battery life from 14.6 years when installed at 20 °C compared to 6.2 years when installed at 40 °C. To maintain a constant temperature of 20 °C to 25 °C, the project reviewed water cooling and noted the risk of standing or stagnant water, which attracted mosquitoes, which can result in increased prevalence of malaria [32]. Additionally, the use of water to cool the batteries would require a larger surface area of water to absorb the heat around the battery. This is a health and safety risk and can be mitigated using reticulated water which requires further energy to pump and circulate the water. It was therefore concluded that water is not an appropriate cooling method for high-temperature environments in Burundi.
Further investigation was undertaken into fan and refrigeration cooling. It was found that 12-volt DC fans will circulate the ambient temperature within the storage room of the batteries. This will therefore have minimal impact on the cooling of the batteries. The project noted a high ambient energy requirement for the fans with one fan per battery needing to run for 24 h consistently. In comparison, the use of a refrigeration cooling is a more effective means of maintaining the battery temperature below 25 °C. This will provide a positive NPV of USD 4893 over a 15-year period. However, there are health and safety risks associated with using refrigeration technologies with acid-based batteries. Firstly, the refrigeration unit will need to maintain its temperature at 20 °C to ensure the acid-based batteries are not vulnerable to double cycling speeds. Ice formation on the battery also needs to be prevented. Secondly, there will be a need for a 300-litre chest fridge which can store the 1.4 m2 C10 gel batteries. The larger dimensions of the fridge will need to accommodate four C10 gel batteries. Further research will, however, be required to size and fit the wiring in the chest fridge. Thirdly, to reduce the power needs for the refrigeration from 5.28 kWh/day, the unit could be in a cool room that is not in direct sunlight.
5. Conclusions
The project concluded that using a refrigeration cooling system reduced the Ruhoro Solar PV kiosk lifecycle cost from USD 94,625 to USD 72,875 over a 15-year period due to the need to replace the batteries every 6 years. In systems with no cooling, the batteries must be replaced twice, with fan cooling once and with refrigeration cooling zero times. The inclusion of a refrigeration cooling system also improved the net present value (NPV) cost effectiveness over a 15-year period from USD −62,481 to USD 4893. This is a net profit of almost USD 5000 for the Solar PV kiosk if a refrigeration unit is installed. There is, however, a need for further research into the installation methods and wiring to ensure access for operation and maintenance of the batteries inside the refrigeration cooling system.
The project recommends the use of refrigeration cooling for high-temperature environments such as the Ruhoro solar PV kiosk. It notes that the refrigeration system is the most cost-effective option for the long-term sustainable use of the community. The NPV revenue that can be generated over a 15-year period will be USD 5000, which is sufficient to invest in future CAPEX, OPEX, and other externalities.
This project provides a model and recommendations for redesigning solar PV systems in high-temperature environments and is a relevant example for investments to achieve Sustainable Development Goal (SDG) Seven on Affordable and Clean Energy in Africa.
Funding
This research paper was funded by the author.
Acknowledgments
The author would like to acknowledge Mary Wambugu for editing support, Bruce Heil for his academic support from the Open University, and the UNICEF Burundi team.
Conflicts of Interest
The author declares no conflict of interest.
References
- World Bank. Access to Electricity Report 2022. Available online: https://data.worldbank.org/indicator/EG.ELC.ACCS.ZS?locations=BI (accessed on 1 February 2021).
- Hoppmann, J.; Volland, J.; Schmidt, T.S.; Hoffmann, V.H. The Economic Viability of Battery Storage for Residential Solar Photovoltaic Systems—A Review and a Simulation Model. Renew. Sustain. Energy Rev. 2014, 39, 1101–1118. [Google Scholar] [CrossRef]
- Hill, C.A.; Such, M.C.; Chen, D.; Gonzalez, J.; Grady, W.M. Battery Energy Storage for Enabling Integration of Distributed Solar Power Generation. IEEE Trans Smart Grid 2012, 3, 850–857. [Google Scholar] [CrossRef]
- Madziga, M.; Rahil, A.; Mansoor, R. Comparison between Three Off-Grid Hybrid Systems (Solar Photovoltaic, Diesel Generator and Battery Storage System) for Electrification for Gwakwani Village, South Africa. Environments 2018, 5, 57. [Google Scholar] [CrossRef] [Green Version]
- UNICEF ESARO. Regional Report on Renewable Energy for Health and Education in the East and Southern Africa Region; UNICEF ESARO: Nairobi, Kenya, 2022. [Google Scholar]
- USAID. Cost-Benefit Analysis of Off-Grid Solar Investments in East Africa; USAID, 2017, Unpublished. Available online: https://www.usaid.gov/sites/default/files/documents/1865/Cost-Benefit-Analysis-Off-Grid-Solar-Investments-East-Africa.pdf (accessed on 3 September 2022).
- Alshawaf, M.; Poudineh, R.; Alhajeri, N.S. Solar PV in Kuwait: The Effect of Ambient Temperature and Sandstorms on Output Variability and Uncertainty. Renew. Sustain. Energy Rev. 2020, 134, 110346. [Google Scholar] [CrossRef]
- Aldihani, A.; Aldossary, A.; Mahmoud, S.; Al-Dadaha, R.K. The Effect of Cooling on the Performance of Photovoltaic Cells under Dusty Environmental Conditions. In Proceedings of the 6th International Conference on Applied Energy, Taipei, Taiwan, 30 May–2 June 2014. [Google Scholar]
- Charfi, W.; Chaabane, M.; Mhiri, H.; Bournot, P. Performance Evaluation of a Solar Photovoltaic System. Energy Rep. 2018, 4, 400–406. [Google Scholar] [CrossRef]
- Siecker, J.; Kusakana, K.; Numbi, B.P. A Review of Solar Photovoltaic Systems Cooling Technologies. Renew. Sustain. Energy Rev. 2017, 79, 192–203. [Google Scholar] [CrossRef]
- Abdullah, A.A.; Attulla, F.S.; Ahmed, O.K.; Algburi, S. Effect of Cooling Method on the Performance of PV/Trombe Wall: Experimental Assessment. Therm. Sci. Eng. Prog. 2022, 30, 101273. [Google Scholar] [CrossRef]
- Muzathik, A.M. Photovoltaic Modules Operating Temperature Using a Simple Correlation. Int. J. Energy Eng. 2014, 4, 151–158. [Google Scholar]
- Jossen, A.; Garche, J.; Sauer, D.U. Operation Conditions of Batteries in PV Applications. Sol. Energy 2004, 76, 759–769. [Google Scholar] [CrossRef]
- Ma, S.; Jiang, M.; Tao, P.; Song, C.; Wu, J.; Wang, J.; Deng, T.; Shang, W. Temperature Effect and Thermal Impact in Lithium-Ion Batteries: A Review. Prog. Nat. Sci. Mater. Int. 2018, 28, 653–666. [Google Scholar] [CrossRef]
- Ouyang, D.; Weng, J.; Chen, M.; Wang, J. Impact of High-Temperature Environment on the Optimal Cycle Rate of Lithium-Ion Battery. J. Energy Storage 2020, 28, 101242. [Google Scholar] [CrossRef]
- Chen, M.; Xie, S.; Zhao, X.; Zhou, W.; Li, Y.; Zhang, J.; Chen, Z.; Chao, D. Aqueous Zinc-Ion Batteries at Extreme Temperature: Mechanisms, Challenges, and Strategies. Energy Storage Mater. 2022, 51, 683–718. [Google Scholar] [CrossRef]
- Ponnusamy, M.; Manimekalai, P.; Harikumar, R.; Raghavan, S. An Overview of Batteries for Photovoltaic (PV) Systems. Int. J. Comput. Appl. 2013, 82, 975–8887. [Google Scholar]
- Koko, S.P. Optimal Battery Sizing for a Grid-Tied Solar Photovoltaic System Supplying a Residential Load: A Case Study under South African Solar Irradiance. Energy Rep. 2022, 8, 410–418. [Google Scholar] [CrossRef]
- Das, M.; Mandal, R. Effect of Solar Radiation and Operating Factor of the PV Module on the Loss of Load Probability of a PV-Battery System. Mater. Today Proc. 2022, 56, 2767–2773. [Google Scholar] [CrossRef]
- Gul, E.; Baldinelli, G.; Bartocci, P.; Bianchi, F.; Domenighini, P.; Cotana, F.; Wang, J. A Techno-Economic Analysis of a Solar PV and DC Battery Storage System for a Community Energy Sharing. Energy 2022, 244, 123191. [Google Scholar] [CrossRef]
- Salameh, T.; Zhang, D.; Juaidi, A.; Alami, A.H.; Al-Hinti, I.; Olabi, A.G. Review of Solar Photovoltaic Cooling Systems Technologies with Environmental and Economical Assessment. J. Clean. Prod. 2021, 326, 129421. [Google Scholar] [CrossRef]
- Muruganantham, B.; Gnanadass, R.; Padhy, N.P. Challenges with Renewable Energy Sources and Storage in Practical Distribution Systems. Renew. Sustain. Energy Rev. 2017, 73, 125–134. [Google Scholar] [CrossRef]
- Luerssen, C.; Gandhi, O.; Reindl, T.; Sekhar, C.; Cheong, D. Life Cycle Cost Analysis (LCCA) of PV-Powered Cooling Systems with Thermal Energy and Battery Storage for off-Grid Applications. Appl. Energy 2020, 273, 115145. [Google Scholar] [CrossRef]
- Jankowiak, C.; Zacharopoulos, A.; Brandoni, C.; Keatley, P.; MacArtain, P.; Hewitt, N. Assessing the Benefits of Decentralised Residential Batteries for Load Peak Shaving. J. Energy Storage 2020, 32, 101779. [Google Scholar] [CrossRef]
- Lai, C.S.; McCulloch, M.D. Levelized Cost of Electricity for Solar Photovoltaic and Electrical Energy Storage. Appl. Energy 2017, 190, 191–203. [Google Scholar] [CrossRef]
- Salim, H.K.; Stewart, R.A.; Sahin, O.; Dudley, M. Drivers, Barriers and Enablers to End-of-Life Management of Solar Photovoltaic and Battery Energy Storage Systems: A Systematic Literature Review. J. Clean Prod. 2019, 211, 537–554. [Google Scholar] [CrossRef]
- Markvart, T. (Ed.) Solar Electricity; John Wiley & Sons: Hoboken, NJ, USA, 2000; Volume 6. [Google Scholar]
- Nian, Q.; Sun, T.; Liu, S.; Du, H.; Ren, X.; Tao, Z. Issues and Opportunities on Low-Temperature Aqueous Batteries. Chem. Eng. J. 2021, 423, 130253. [Google Scholar] [CrossRef]
- The Open University. T313 Renewable Energy Unpublished; Open University Press: London, UK, 2020. [Google Scholar]
- Solar, J.A. JA Solar Manufacturer’s Literature 2022. Available online: https://www.jasolar.com/uploadfile/2018/0807/20180807045422860.pdf (accessed on 1 February 2021).
- Pedersen, D.; Lybbert, M.; Warren, R. Life Cycle Analysis of LiCoO2/ Graphite Batteries with Cooling Using Combined Electrochemical-Thermal Modeling. Resour. Conserv. Recycl. 2022, 180, 106204. [Google Scholar] [CrossRef]
- Yang, D.; He, Y.; Wu, B.; Deng, Y.; Li, M.; Yang, Q.; Huang, L.; Cao, Y.; Liu, Y. Drinking Water and Sanitation Conditions Are Associated with the Risk of Malaria among Children under Five Years Old in Sub-Saharan Africa: A Logistic Regression Model Analysis of National Survey Data. J. Adv. Res. 2019, 21, 1–13. [Google Scholar] [CrossRef]
Figure 1.
Power requirements for health and education facilities in East and Southern Africa region [2].
Figure 1.
Power requirements for health and education facilities in East and Southern Africa region [2].

Figure 2.
Project location—Solar PV kiosk in Ruhoro, Burundi.
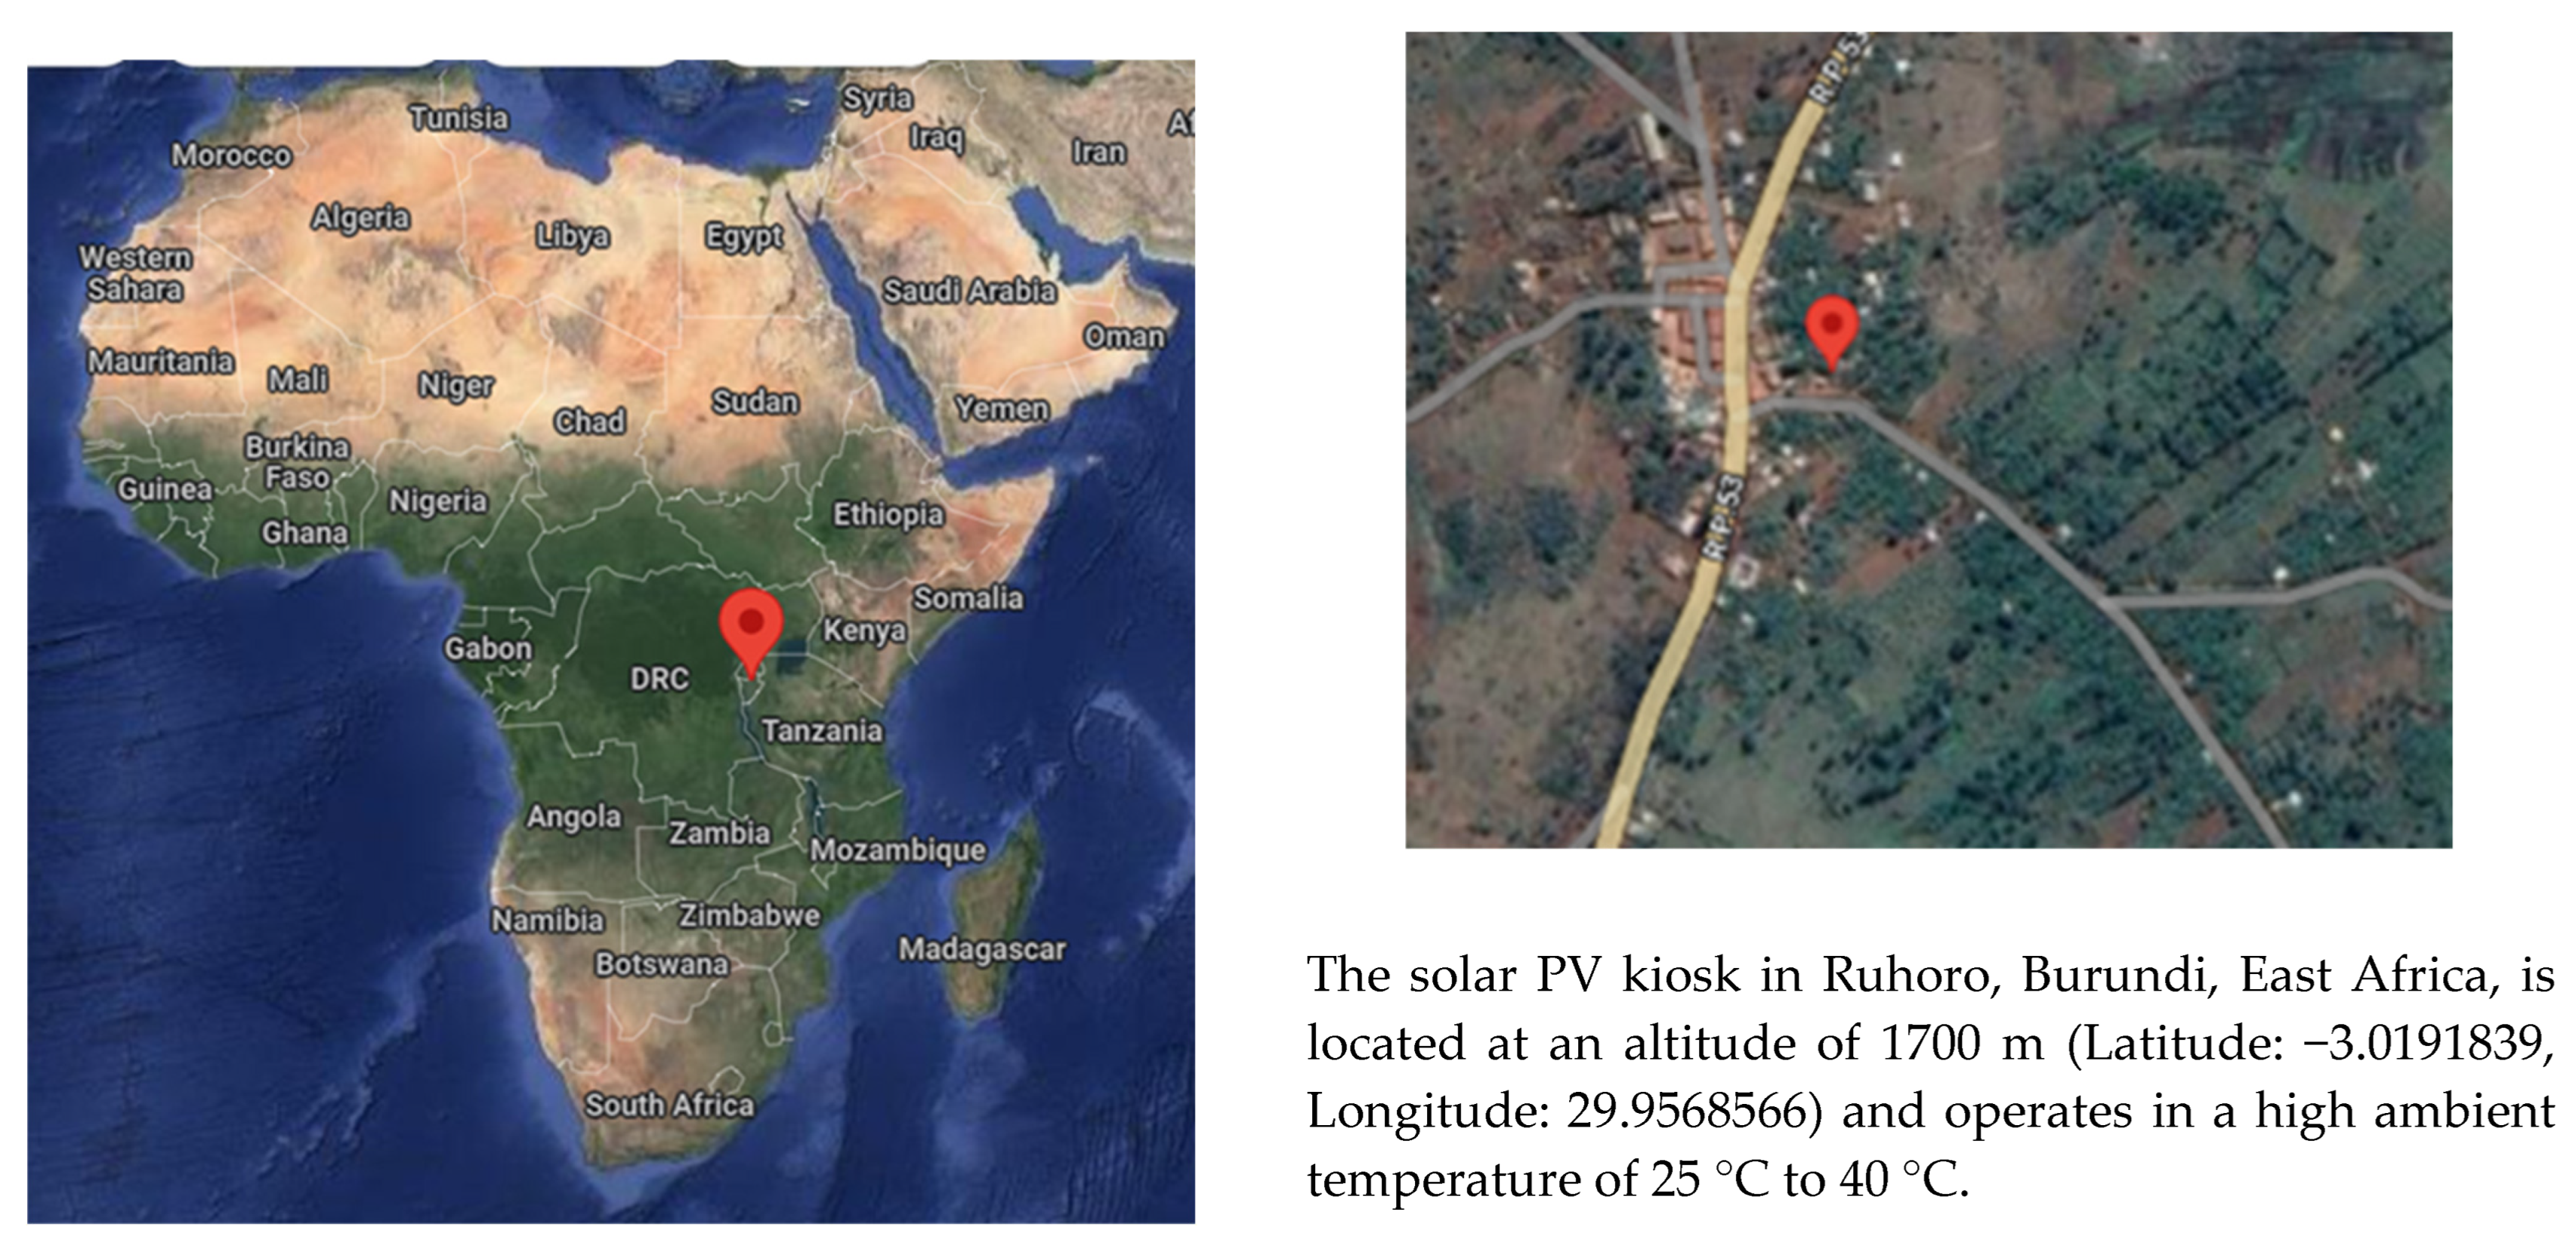
Figure 3.
Methodology for high-temperature impact on solar PV study.
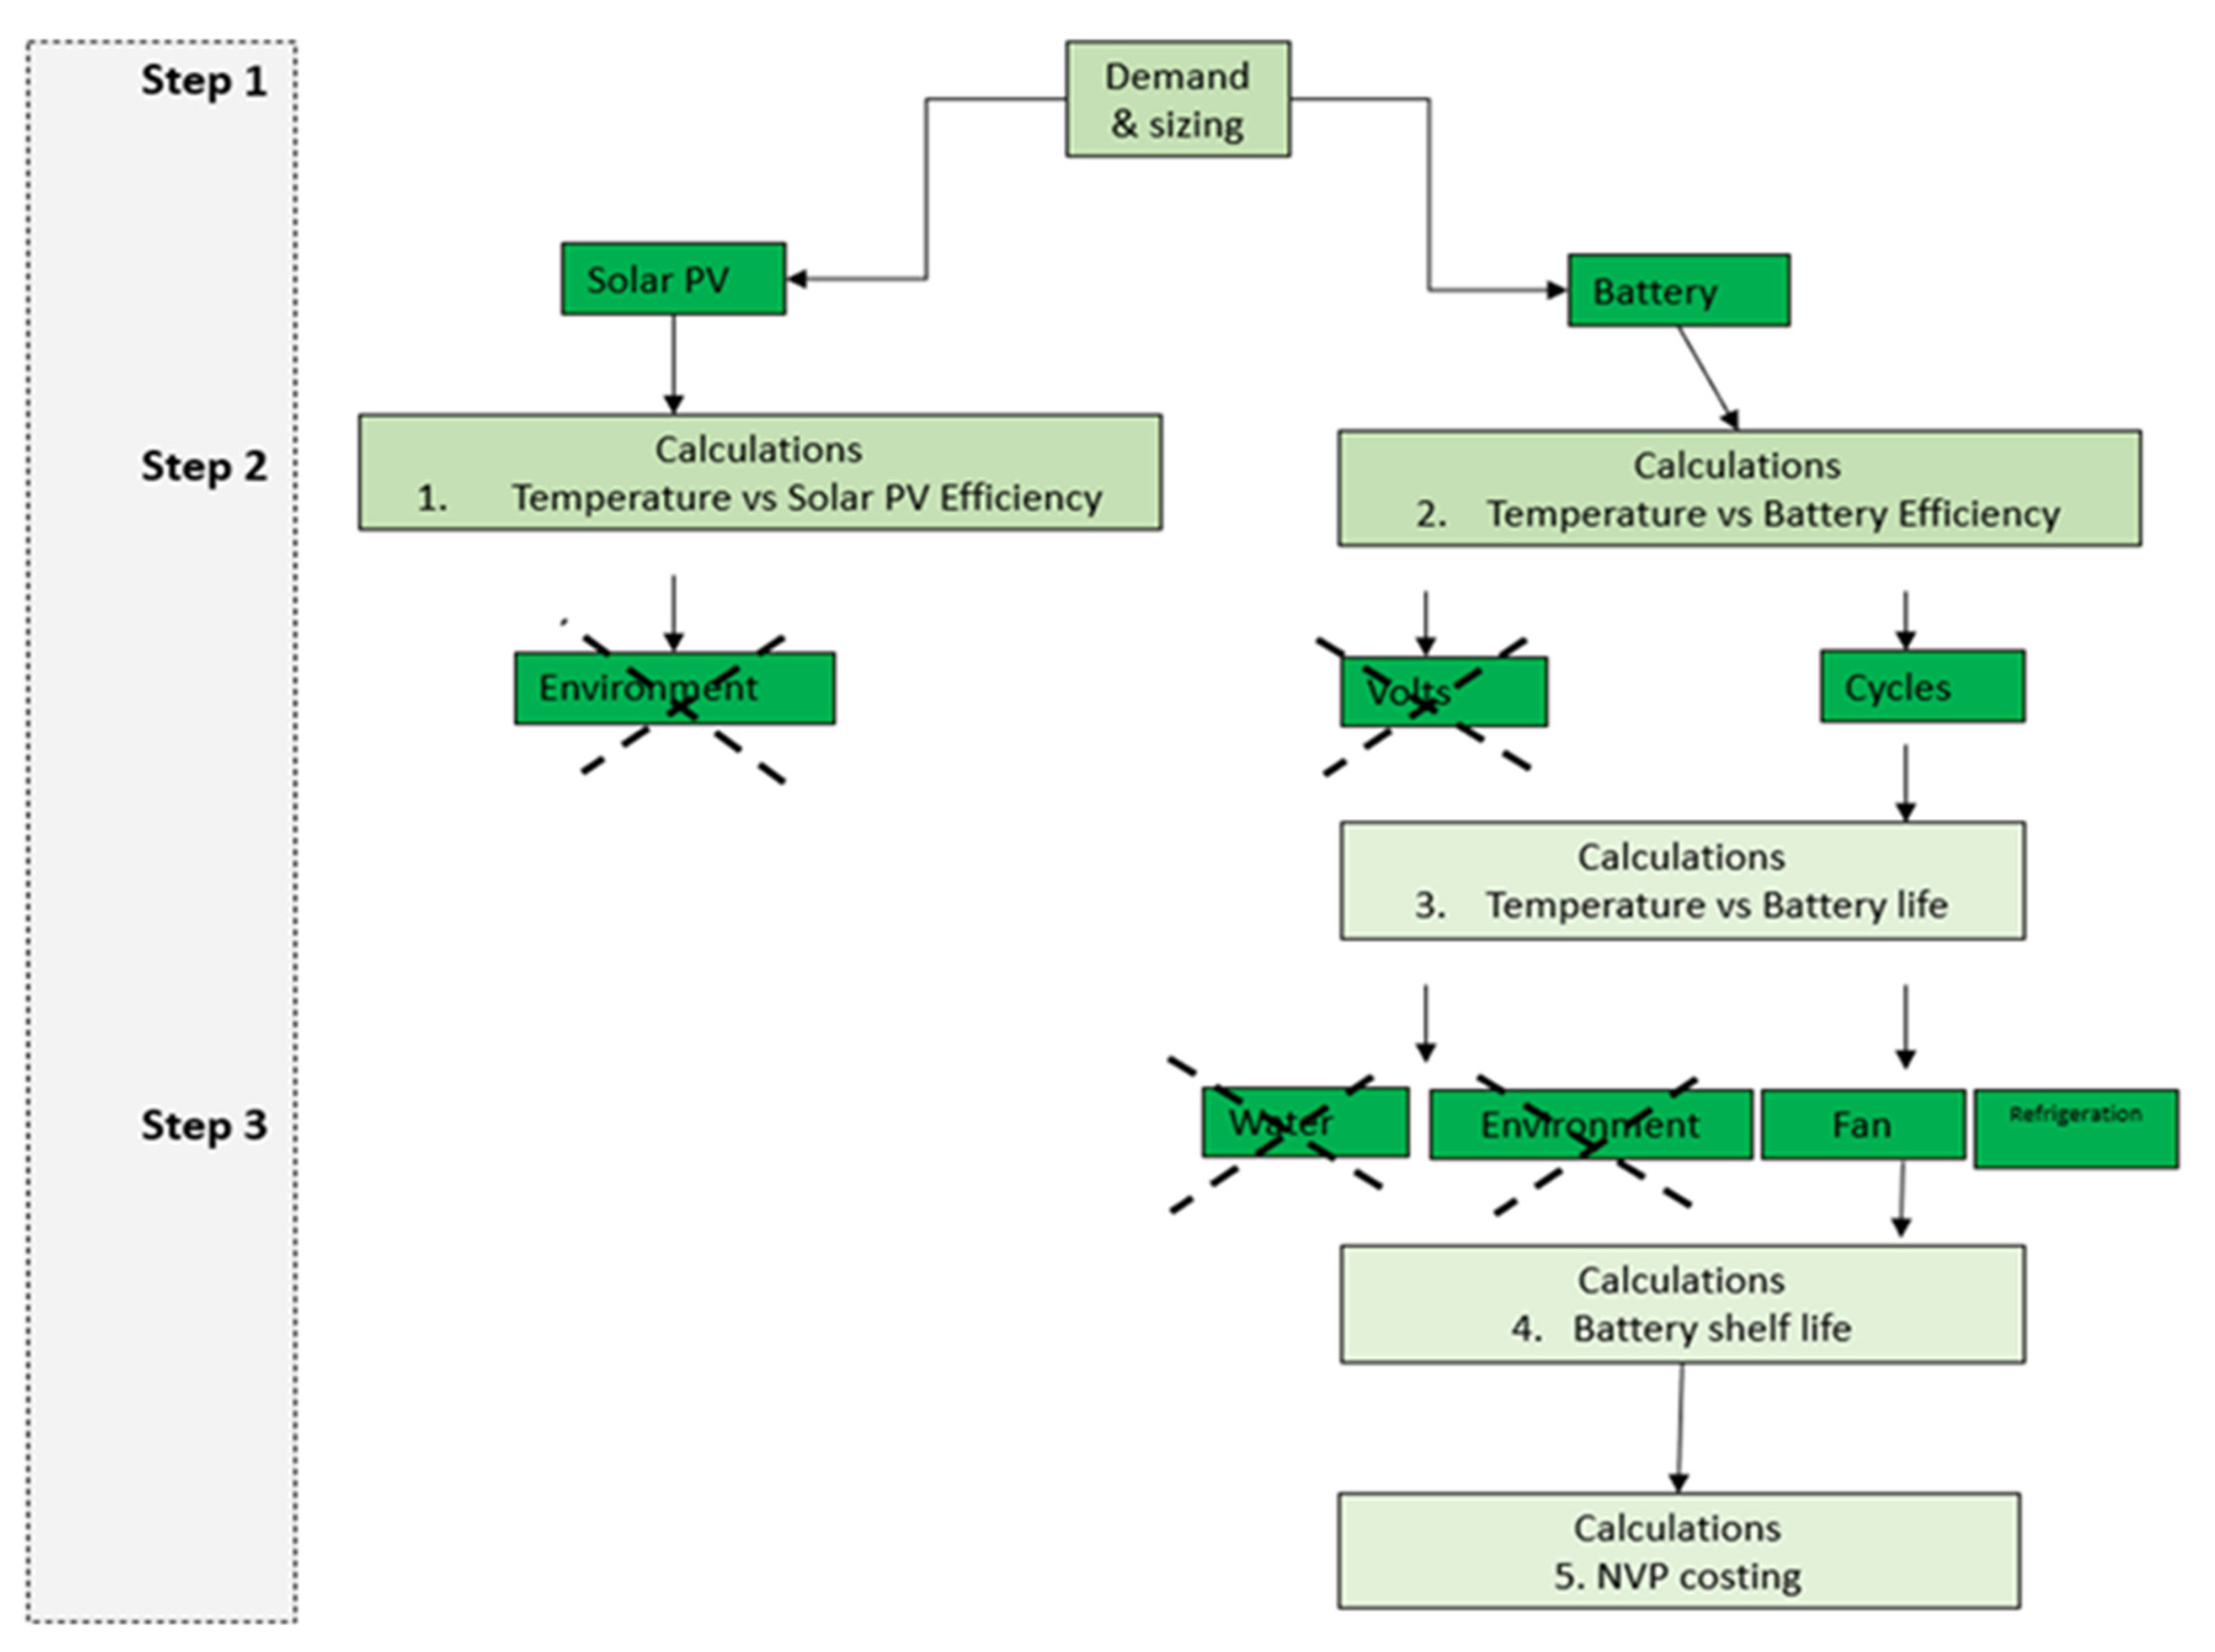
Figure 4.
Energy demand projection for Ruhoro kiosk.

Figure 5.
(a) Solar panel efficiency % per panel vs. temperature (b) of solar PV vs. temperature.

Figure 6.
Voltage output of battery with temperature.

Table 1.
Ruhoro system energy supply and demand (kWh/day) using STC.
| 2022 | 2025 | ||
|---|---|---|---|
| Demand | Uses includes internet café and community center | 15.06 kWh/day | 16.5 kWh/day |
| Supply | Solar PV (6 panels × 2.25 kWp × 10 h) 2775 kWh per year per panel | 45.6 kWh/day | 45.6 kWh/day |
| 90% efficiency of the solar panels due to losses through the hybrid inverter (90%) |
Table 2.
Solar PV vs. temperature.
| Temperature (°C) | Energy (kWh/m2) | * PV Array Surface Area m2 | Panel Efficiency (% Per Panel) | Solar Irradiance (kwh/day/m2) |
|---|---|---|---|---|
| 20 | 3.8 | 1.9 | 30 | 64.7 |
| 25 | 3.6 | 1.9 | 29 | 64.7 |
| 30 | 3.5 | 1.9 | 28 | 64.7 |
| 35 | 3.4 | 1.9 | 27 | 64.7 |
| 40 | 3.3 | 1.9 | 26 | 64.7 |
* The PV array is calculated from Appendix 4 and PV array surface area is 1792 mm × 1052 mm = 1.885 m2 (1.9 m2).
Table 3.
Solar PV panel efficiency vs. temperature.
| Temperature (°C) | Panel Efficiency | Efficiency Change |
|---|---|---|
| 20 | 30 | 2.5 |
| 25 | 25 | 1.5 |
| 30 | 20 | 1 |
| 35 | 18 | 0.0 |
| 40 | 16 | 0.2 |
Table 4.
Temperature vs. battery life.
| Temperature (°C) | Safety Factor | Battery Life (Years) |
|---|---|---|
| 20 | 0.7 | 14.6 |
| 25 | 0.6 | 12.5 |
| 30 | 0.5 | 10.4 |
| 35 | 0.4 | 8.3 |
| 40 | 0.3 | 6.2 |
Table 5.
Energy requirement for cooling options.
| Cooling Option | Cfan J/m3 | Ibattery (W/m2) | Apv (m2) | Vair (Watts) | Additional Annual Energy Requirement (kWh/day) |
|---|---|---|---|---|---|
| No cooling | 0.0006 | 64.7 | 1.4 | 0.05 | 0.0006 |
| Fan cooling | 1,008,000 | 64.7 | 1.4 | 91,304,640 | 0.28 |
| Refrigeration cooling | 19,008,000 | 64.7 | 1.4 | 1,721,744,640 | 5.28 |
60,000 J/m3 = 1 kWh/m3. Thus, applying the formula from Abdullah et al. [8]:
| |||||
Table 6.
System requirements.
| No Cooling | Fan Cooling | Refrigeration Cooling | |
|---|---|---|---|
| Demand Annual energy requirement in 2025 (kWh/day) | 16.5006 kWh/day (16.5 + 0.0006) | 16.78 kWh/day (16.5 + 0.28) | 21.78 kWh/day (16.5 + 5.28) |
| Supply | 20.25 kWh/day | 20.25 kWh/day | 23.63 kWh/day |
| Solar PV |
Table 7.
CAPEX costs over a 15-year period.
| Component | CAPEX Costs (USD) | ||
|---|---|---|---|
| No Cooling | Fan Cooling | Refrigeration Cooling | |
| PV CAPEX | 12,000 | 12,000 | 14,000 |
| Inverter (5 kvA for 23 kWh system) | 9000 | 9000 | 9000 |
| Batteries 1 | 15,000 | 15,000 | 18,750 |
| Replacement batteries (after 6 years) | 30,000 | 15,000 | 0 |
| Wiring kit | 7000 | 7000 | 8000 |
| Labor | 2600 | 2600 | 2600 |
| Construction | 17,000 | 17,000 | 17,000 |
| Fan | 500 | ||
| Fridge | 1500 | ||
| USD 94,625 | USD 80,125 | USD 72,875 | |
1 The batteries will need to be replaced after 6 years and therefore they will be replaced twice with no fan and once with a fan. There will be no replacement of the batteries if a refrigeration cooling system is used.
Table 8.
NPV analysis.
| No Cooling | Fan Cooling | Refrigeration Cooling | |
|---|---|---|---|
| CAPEX C0 (USD) | 94,625 | 80,125 | 72,875 |
| N (Number of Years) | 6.2 | 10 | 15 |
| I (Discount Rate) | 0.111 | 0.111 | 0.111 |
| R (Yearly Revenue in USD) | 5760 | 5760 | 5760 |
| NPV (USD) | USD −62,481 | USD −28,279 | USD 4893 |
Disclaimer/Publisher’s Note: The statements, opinions and data contained in all publications are solely those of the individual author(s) and contributor(s) and not of MDPI and/or the editor(s). MDPI and/or the editor(s) disclaim responsibility for any injury to people or property resulting from any ideas, methods, instructions or products referred to in the content. |
© 2023 by the author. Licensee MDPI, Basel, Switzerland. This article is an open access article distributed under the terms and conditions of the Creative Commons Attribution (CC BY) license (https://creativecommons.org/licenses/by/4.0/).
Share and Cite
MDPI and ACS Style
Godfrey, S. Redesigning a Solar PV Kiosk in High-Temperature Environments of Burundi, Africa. Sustainability 2023, 15, 5514. https://doi.org/10.3390/su15065514
AMA Style
Godfrey S. Redesigning a Solar PV Kiosk in High-Temperature Environments of Burundi, Africa. Sustainability. 2023; 15(6):5514. https://doi.org/10.3390/su15065514
Chicago/Turabian StyleGodfrey, Samuel. 2023. "Redesigning a Solar PV Kiosk in High-Temperature Environments of Burundi, Africa" Sustainability 15, no. 6: 5514. https://doi.org/10.3390/su15065514
Note that from the first issue of 2016, this journal uses article numbers instead of page numbers. See further details here.