Article

Evaluation and Analysis of Development Status of Yellow River Beach Area Based on Multi-Source Data and Coordination Degree Model

1
School of Civil and Architectural Engineering, Shandong University of Technology, Zibo 255049, China
2
State Key Laboratory of Resources and Environmental Information System, Institute of Geographical Sciences and Natural Resources Research, Chinese Academy of Sciences, Beijing 100101, China
3
Hunan Provincial Key Laboratory of Geo-Information Engineering in Surveying, Mapping and Remote Sensing, Hunan University of Science and Technology, Xiangtan 411201, China
4
Haikou Marine Geological Survey Center, China Geological Survey, Haikou 570100, China
*
Authors to whom correspondence should be addressed.
These authors contributed equally to this work.
Sustainability 2023, 15(7), 6086; https://doi.org/10.3390/su15076086
Submission received: 4 February 2023 / Revised: 29 March 2023 / Accepted: 29 March 2023 / Published: 31 March 2023

Abstract

:
The Yellow River beach area is the basic component of the Yellow River Basin. Promoting the comprehensive improvement and high-quality development of the Yellow River beach area is an important guarantee of the long-term stability of the Yellow River and an important part of promoting the high-quality development and ecological protection of the Yellow River Basin. In this paper, four new indexes (flood risk intensity index, accessibility index, biological abundance index, and remote sensing ecological index) were extracted from geospatial data and remote sensing images, and a quantitative evaluation model (Ecology-Economy -Society-Flood, EESF) for the development of the Yellow River beach area were constructed based on social statistics, such as flood control and control in the beach area. The coordinated development level of the Yellow River beach area was evaluated by combining the “CRITIC–entropy weight method” and “‘single index quantification–multi-index synthesis–multi-criteria integration’ (SMI-P)—coordination degree model” methods. The spatial autocorrelation model was used to analyze the spatial distribution characteristics of the coordinated development level, and the global sensitivity and uncertainty analysis (GSUA) was carried out for the sensitivity and uncertainty of the parameters. Taking the Yellow River beach area in Shandong Province in 2009 and 2019 as the study object, the research results showed that during this period, the coordinated development level of the Yellow River beach area in Shandong Province showed a gradual upward trend, from 0.344 to 0.580, reaching a basic coordinated state; the overall coordinated development level of the beach area showed significant autocorrelation and small spatial heterogeneity. Grain production was the most sensitive parameter in the coordinated development model of the beach area. The beach area should rationally develop and utilize agricultural resources and promote the integration of ecological industries.

1. Introduction

The Yellow River Basin, the birthplace of Chinese civilization, is a special geographical unit with rich land resources and energy supplies, as well as distinct cultural resources. At the same time, as an important “ecological corridor” connecting the eastern and western parts of China, it requires ecological protection, wind and sand control, and green development, and its ecological protection and high-quality development have important strategic significance [1,2]. In September 2019, at the symposium on the ecological protection and high-quality development of the Yellow River Basin, General Secretary Xi Jinping pointed out that “the Yellow River Basin is an important ecological barrier and an important economic zone in China. It is an important area to win the battle against poverty and has a very important position in China’s economic and social development and ecological security”; this forwarded the ecological protection and high-quality development of the Yellow River Basin as a major national strategy [3].
As an important part of the Yellow River channel, the lower reaches of the Shandong Yellow River beach area are an important area for sediment deposition, flooding, and flood water storage, as well as the home on which millions of people in the beach area depend for their survival [4]. However, due to the threat of flood inundation and other factors, the economic and social development of the beach area is relatively backward, which is not in line with the ambitious goal of building a moderately prosperous society in China. In order to promote the sustainable economic and social development of the Shandong Yellow River beach area, the state has put forward the development strategy of “re-creation of the lower Yellow River beach area and ecological management”. It is urgent to improve the economic development of the Shandong Yellow River beach area, to free the people in the beach area from poverty, and to achieve social development and natural harmony. The development strategy relates the management of the beach area to the overall national situation of regional economic and social development, as well as the overall national situation of ecological civilization construction, so that the beach area can better serve the needs of regional economic and social and ecological development, and also so that a green water beach area can be created, the regional ecological environment can be improved, the people living in the beach area and along the Yellow River can benefit better, and the harmonious coexistence of people and water can be realized in the beach area. Furthermore, beach and cross-strait economic and social green, coordinated and sustainable development can be realized [5,6]. Therefore, regarding the high-quality development of the Yellow River beach area, it has become an important approach in geographical research to organically combine ecological environment protection with the high-quality economic development of the beach area and to coordinate an interaction and win–win relationship between high-quality development and ecological environment protection.
In the face of new challenges, many scholars in China have carried out a series of studies on the management mode [7,8,9] and compensation policy [10], the relationship between water and sediment [11], embankment security [12], flooding [13], and the ecological environment [14,15] of the lower beach area of the Yellow River, and under the organization of the Yellow River Water Conservancy Commission of the Ministry of Water Resources, the “Expert Seminar on the Management Strategy of the Lower Yellow River” was promoted [16]. Jiang et al. [17] put forward relatively perfect suggestions for management and operation based on the results of the physical model test series of medium and high sediment concentration floods in the lower reaches of the Yellow River and the river regime characteristics of different reaches of the lower reaches of the Yellow River. Yue Yusu et al. [18] constructed a system dynamics model with the goal of the coordinated development of nature, economy, and society and simulated the future development and changes of economic and social systems under the governance scheme of the lower reaches of the Yellow River. Qiang Haiyang et al. [19] analyzed the outstanding problems and contradictions faced by the Yellow River beach area and put forward suggestions for high-quality management and protection of water and soil resources in the Yellow River beach area from the aspects of safety construction standards and rational planning of the “three living” spaces in the beach area. However, most of the current research perspectives are relatively single, without considering flood control and ecological, economic, and social development as a whole, and the results obtained also have certain limitations.
The Yellow River beach area is a basic component of the Yellow River Basin and an important area for the country to promote the strategic deployment of ecological protection and high-quality development in the Yellow River Basin. As a complex system engineering project, the development of the beach area in the lower reaches of the Yellow River involves the need for regional social and economic development, ecological environment protection, and flood control, and there are multiple direct or indirect linkages [20,21,22]. However, most of the existing research was on the overall analysis of the Yellow River Basin, and there are few measurement methods and quantitative standards for the development of the beach area. Therefore, on the basis of an in-depth analysis of the social and economic development needs of the lower reaches of the Yellow River in Shandong Province, this paper comprehensively considered the influencing factors, such as flood control, agricultural development, policy support, and infrastructure construction, and aimed at the coordinated development of ecological environment health, high-quality economic development, social livelihood security, and flood control construction. The coordinated development evaluation model of the Yellow River beach area was constructed, and the coordinated development level of the Yellow River beach area was evaluated and analyzed in order to provide a scientific basis for the high-quality development of the Yellow River beach area.

2. Study Area and Data

2.1. Study Area

The Yellow River beach area is the area between the main channel of the Yellow River and the flood control embankment, where the Yellow River beach area in Shandong starts from Dongming County, Heze City in the west to Kenli District, Dongying City in the east (34° N–40° N, 114° E–119° E). Along the course of the Yellow River from southwest to northeast, the total area of the beach is 1702 km2 [23]. The study area was located in the lower reaches of the Yellow River, which plays a vital role in preventing floods from breaking the Yellow River levee, further management of floods and sediments, and adjusting the Yellow River channel. More than 600,000 people live in the beach area [24]. However, due to various factors, such as its special geographical location, flood discharge function, and ecological environment, as well as laws and regulations, large-scale industrial production cannot be carried out in the area, resulting in it becoming a contiguous area with a low level of economic development. The study area of this paper was based on the GF-2 satellite image, with the dam line and the Yellow River water level line used to extract the Yellow River beach area. The extraction area was 1671.81 km2, and the extraction area was verified by a field investigation. The overall accuracy was 98.22%. See Figure 1 for an illustration.

2.2. Study Data

This paper selected data from 25 counties in 9 urban areas of the Shandong Yellow River beach area in 2009 and 2019, including remote sensing images, geospatial data, vector data, and statistical data (seen in Table 1). The Landsat5 TM and Landsat8 OLI used in this paper were derived from the geospatial data cloud platform (https://www.gscloud.cn/, accessed on 23 April 2022); land use data from the resource and environmental science data platform of the Chinese Academy of Sciences (http://www.resdc.cn, accessed on 4 May 2022), with the data resolution being 30 m; precipitation data from the annual values of the China meteorological data network data set (http://data.cma.cn/data/, accessed on 7 May 2022); CO2 emissions data from China meteorological historical data; NDVI data from the National Ecological Science Data Center (http://www.nesdc.org.cn, accessed on 18 May 2022), with the spatial resolution being 30 m; population density data from WorldPop (http://www.worldpop.org, accessed on 21 May 2022); GDP raster data from the geographic remote sensing ecological network (http://www.gisrs.cn, accessed on 3 June 2022), with the spatial resolution being 30 m; socio-economic data from the Shandong Statistical Yearbook, with the Yellow River beach area being involved in the 25 county statistical yearbook. The social statistical data of the beach area were interpolated using the Kriging interpolation method, and the interpolation model was cross-validated to evaluate interpolation accuracy. The flood control index data were obtained from the vector data of village-level administrative divisions in 2009 and 2019, the official website data of the provincial statistical bureaus in the Yellow River Basin and some periodical literature.

3. Calculation of Indicators

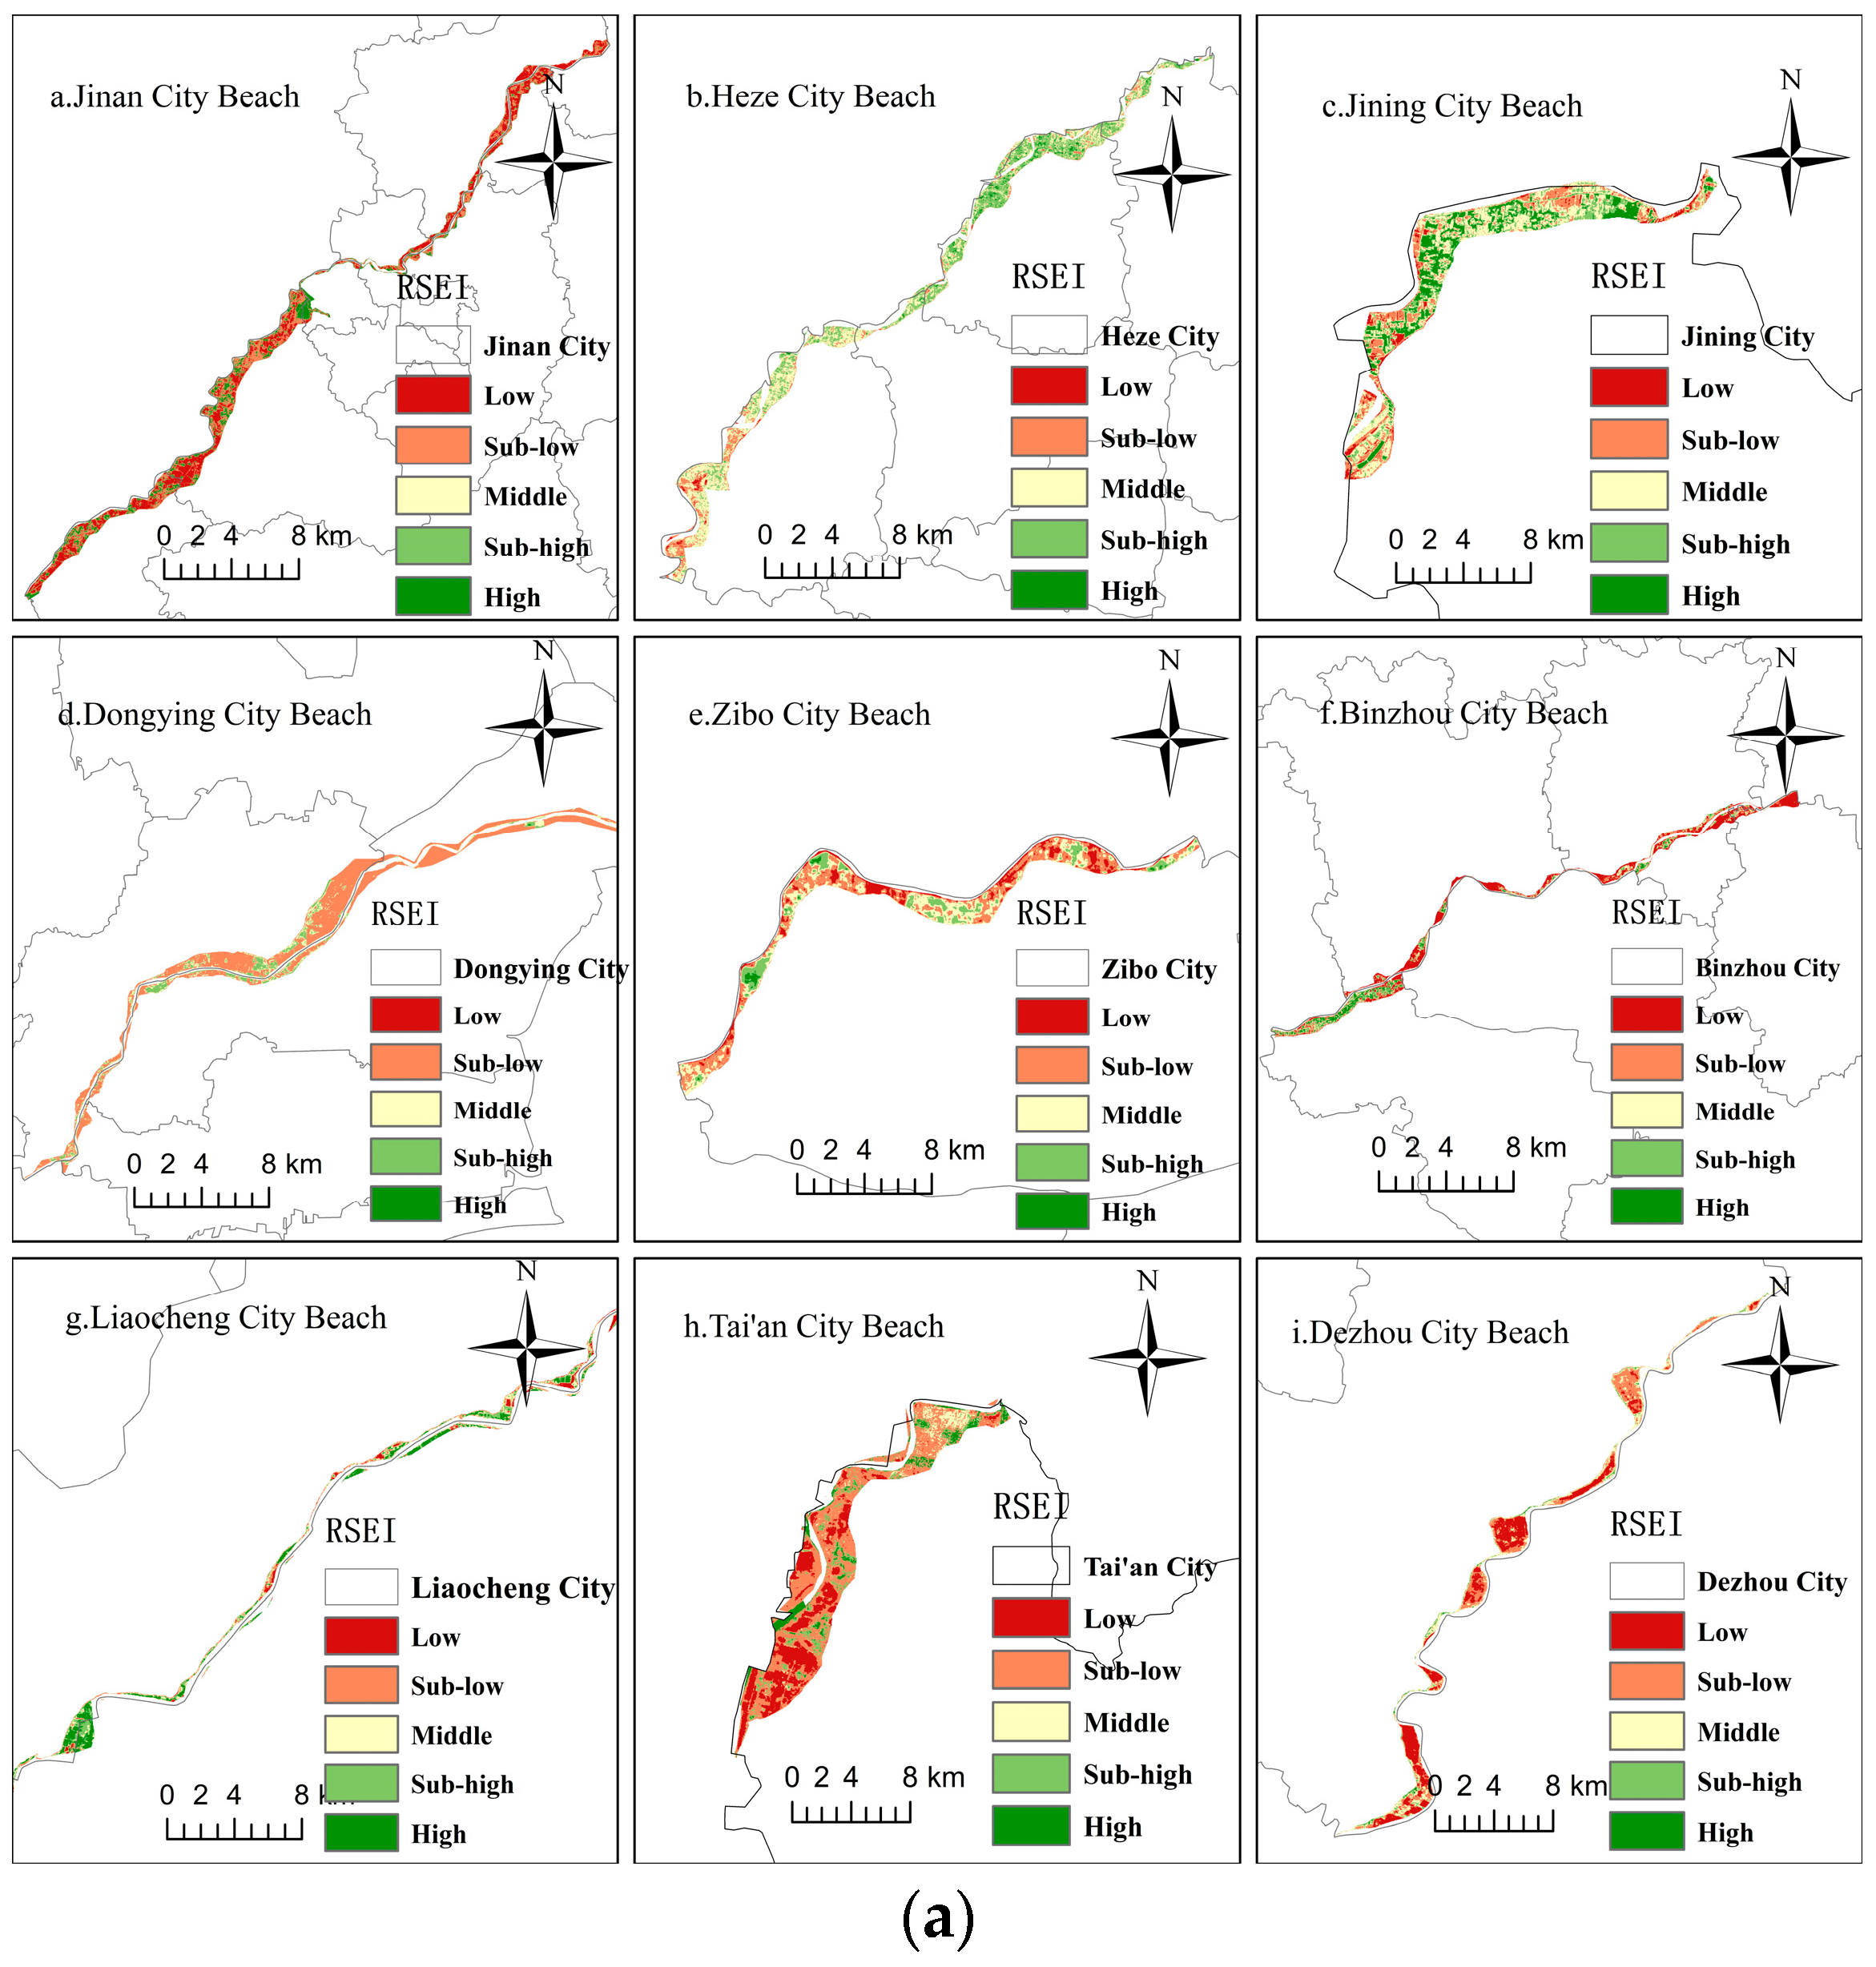
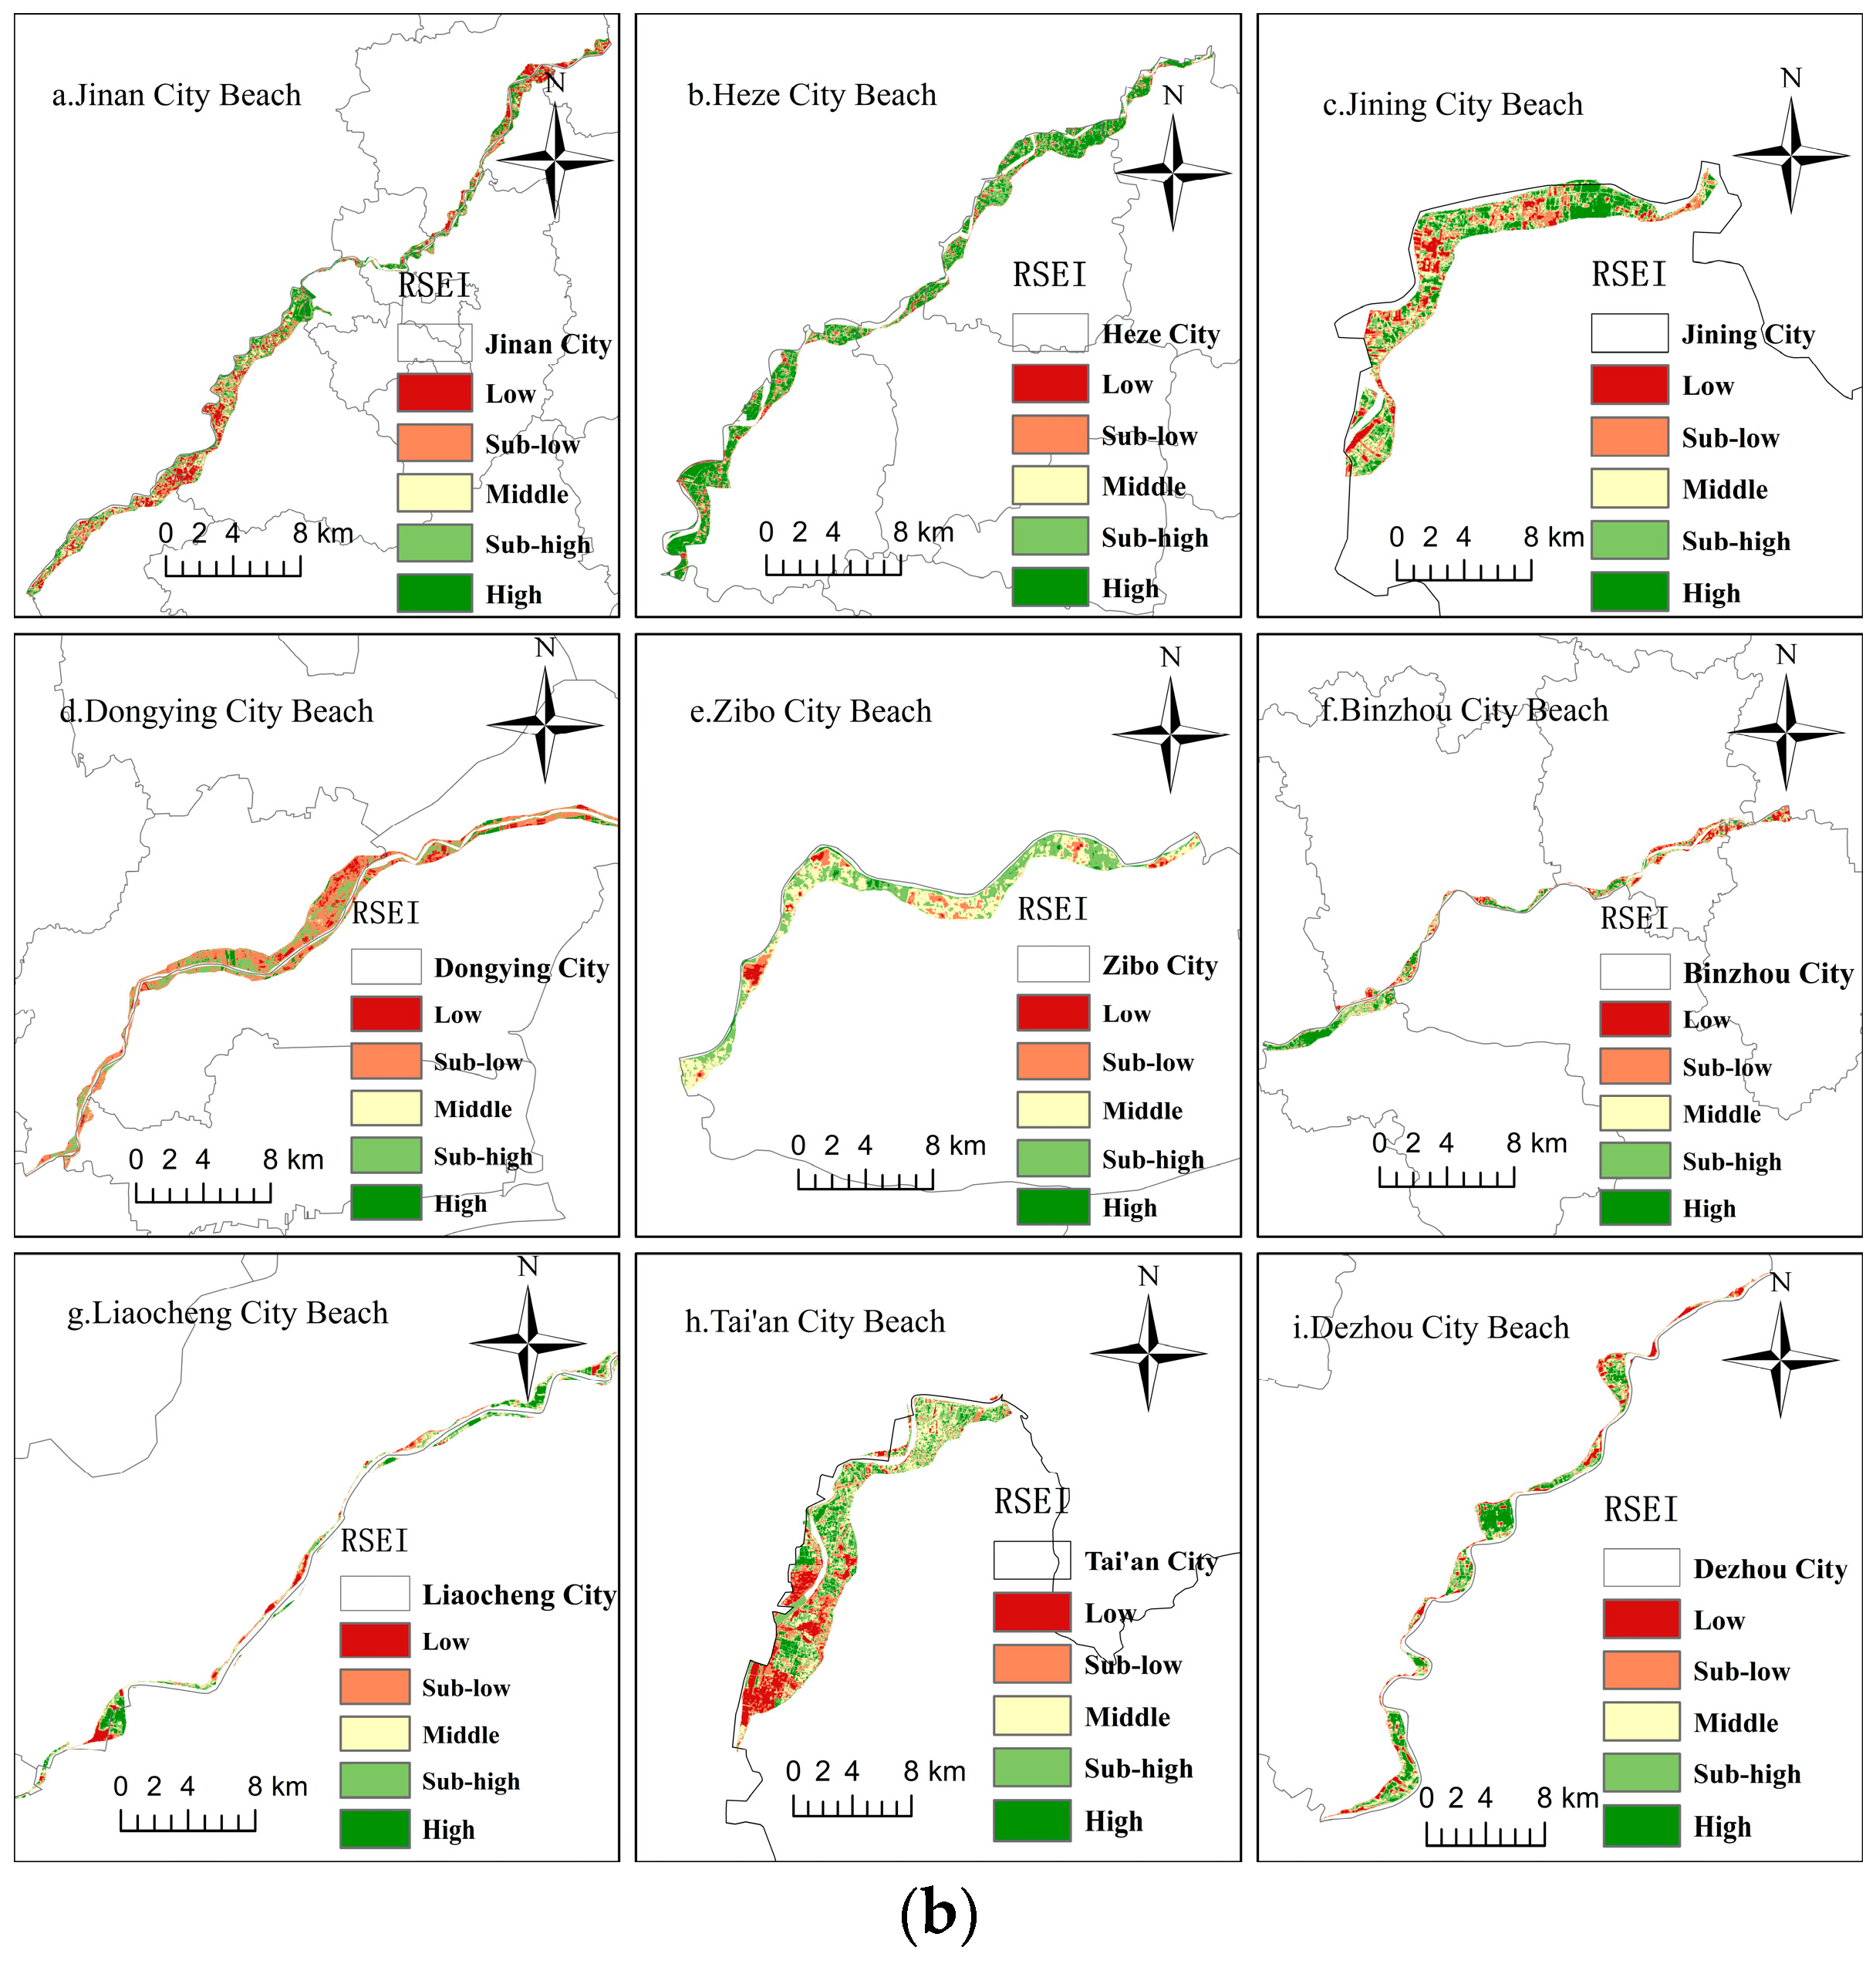
3.1. Indicator Calculation Based on Remote Sensing Images

Remote Sensing Ecological Index

The remote sensing ecological index (RSEI) is a comprehensive ecological evaluation method used for the quantitative, objective, and rapid evaluation of regional ecological quality based on natural factors [25]. In this paper, Landsat5 TM in 2009 and Landsat8 OLI in 2019 were selected, and four ecological factors, namely the normalized difference vegetation index (NDVI), wetness index (WET), normalized difference built-up and soil index (NDBSI), and land surface temperature index (LST), were coupled. The relevant indicators were calculated using ENVI 5.3 software, and the ecological quality of the beach areas in each prefecture-level city was analyzed by principal component analysis.
(1)
Normalized Difference Vegetation Index (NDVI)
The normalized difference vegetation index is the most widely used vegetation index, which is closely related to plant biomass, leaf area index, and vegetation coverage [26]. Therefore, the NDVI was selected to represent the greenness index; the formula is as follows:
NDVI = ( ρ N I R ρ R e d ) / ( ρ N I R + ρ R e d )
where ρ i is the reflectance of Landsat TM/OLI in the corresponding i-band;
(2)
Wetness Index (WET)
The wetness index is closely related to the humidity of vegetation and soil. Extracting the humidity of vegetation and soil by tasseled cap transformation is an important indicator of habitat change in ecological research [27]. In this study, WET was used to represent the humidity index. The expression formulas of the different sensors differed. The expressions of TM data and OLI data are shown in Formula (2):
W e t T M = 0.0315 ρ B l u e +   0.2021 ρ G r e e n + 0.3102 ρ R e d + 0.1594 ρ N I R 0.6806 ρ S W I R 1 0.6109 ρ S W I R 2 W e t O L I = 0.1511 ρ B l u e + 0.1972 ρ G r e e n + 3283 ρ R e d + 0.3407 ρ N I R 0.0 . 7117 ρ S W I R 1 0.4559 ρ S W I R 2
where ρ i is the reflectance of Landsat TM/OLI in the corresponding i-band;
(3)
Normalized Difference Built-up and Soil Index (NDBSI)
The normalized difference between the built-up and soil index was represented by the building index and the soil index. Because a considerable part of the beach bare land in the study area will cause surface drying, it is necessary to synthesize the two indexes. The formula is as follows [28].
SI = ρ S W I R 1 + ρ R e d ρ B l u e + ρ N I R ρ S W I R 1 + ρ R e d + ρ B l u e + ρ N I R IBI = 2 ρ S W I R 1 ρ S W I R 1 + ρ N I R ρ N I R ρ N I R + ρ R e d + ρ G r e e n ρ G r e e n + ρ S W I R 1 2 ρ S W I R 1 ρ S W I R 1 + ρ N I R + ρ N I R ρ N I R + ρ R e d + ρ G r e e n ρ G r e e n + ρ S W I R 1 NDBSI = ( SI + IBI ) / 2
where ρ i is the reflectance of Landsat TM/OLI in the corresponding i-band;
(4)
Land Surface Temperature Index (LST)
The heat index is represented by the surface temperature, and the atmospheric correction method is used to invert the land surface temperature (LST). The formula is as follows [29]:
L 6 / 10 = gain ×   DN + bias F V = ( NDVI N D V I S ) / ( N D V I V N D V I S ) ε s u r f a c e = 0.9625 + 0.0614 F V 0.0461 F V 2 ε b u i l d i n g = 0.9589 + 0.0860 F V 0.0671 F V 2 T = L 6 / 10 L τ 1 ε L / τ ε LST = K 2 / ln ( K 1 / T + 1 )
where L 6 / 10 is the radiation value in the thermal infrared band; DN denotes the grayscale value of the image element; gain and bias denote the band gain and bias values, respectively;   F V is the vegetation coverage; N D V I S and N D V I V denote the NDVI values of vegetation-free and vegetation-only pixels, respectively; ε s u r f a c e and ε b u i l d i n g denotes the surface specific emissivity of natural surface and urban area respectively; T denotes the blackbody radiance value; L and   L are the upward and downward atmospheric radiance values, respectively; τ is the thermal infrared transmittance; K1 and K2 are the calibration parameters of the sensor.
(5)
Principal Component Analysis (PCA)
After extracting the four indicators, in order to avoid the influence of extreme values and dimensions, 2~98% was selected as the confidence interval to normalize the above indicators. The four normalized indicators were coupled, and the principal component analysis method was used to linearly transform the indicators. Then, according to the contribution of each principal component, the weight of the transformed statistical data was determined objectively and automatically [30]. This method avoids human interference and makes the results more accurate. The specific formula is as follows:
I n d e x i = I i I m i n / I m a x I m i n
R S E I 0   =   1     P C 1
R S E I = R S E I 0 R S E I 0 m i n / R S E I 0 m a x R S E I 0 m i n
where I n d e x i is the normalized indicator value;   I i is the value of the indicator; I m i n , I m a x are the minimum and maximum values of the indicators, respectively; PC1 is the eigenvector of the first principal component; R S E I 0 is the initial ecological indicator; R S E I is the remote sensing ecological indicator; the closer the value is to 1, the better the ecological quality of the study area.

3.2. Indicator Calculation Based on Geospatial Data

3.2.1. Flood Risk Intensity (FRI)

The intensity of flood risk can reflect the risk of flood disasters in a region. This paper used precipitation and DEM data for a weighted comprehensive evaluation. The calculation formula is shown in formula (8), where the indicator weights were obtained from the hierarchical analysis method [31,32,33].
FRI = W P × P + W D × D
where FRI is the flood risk intensity, and W P is the weighting of the precipitation factor, and W D is the proportion of topographic relief, P is the amount of precipitation, and D is the DEM.

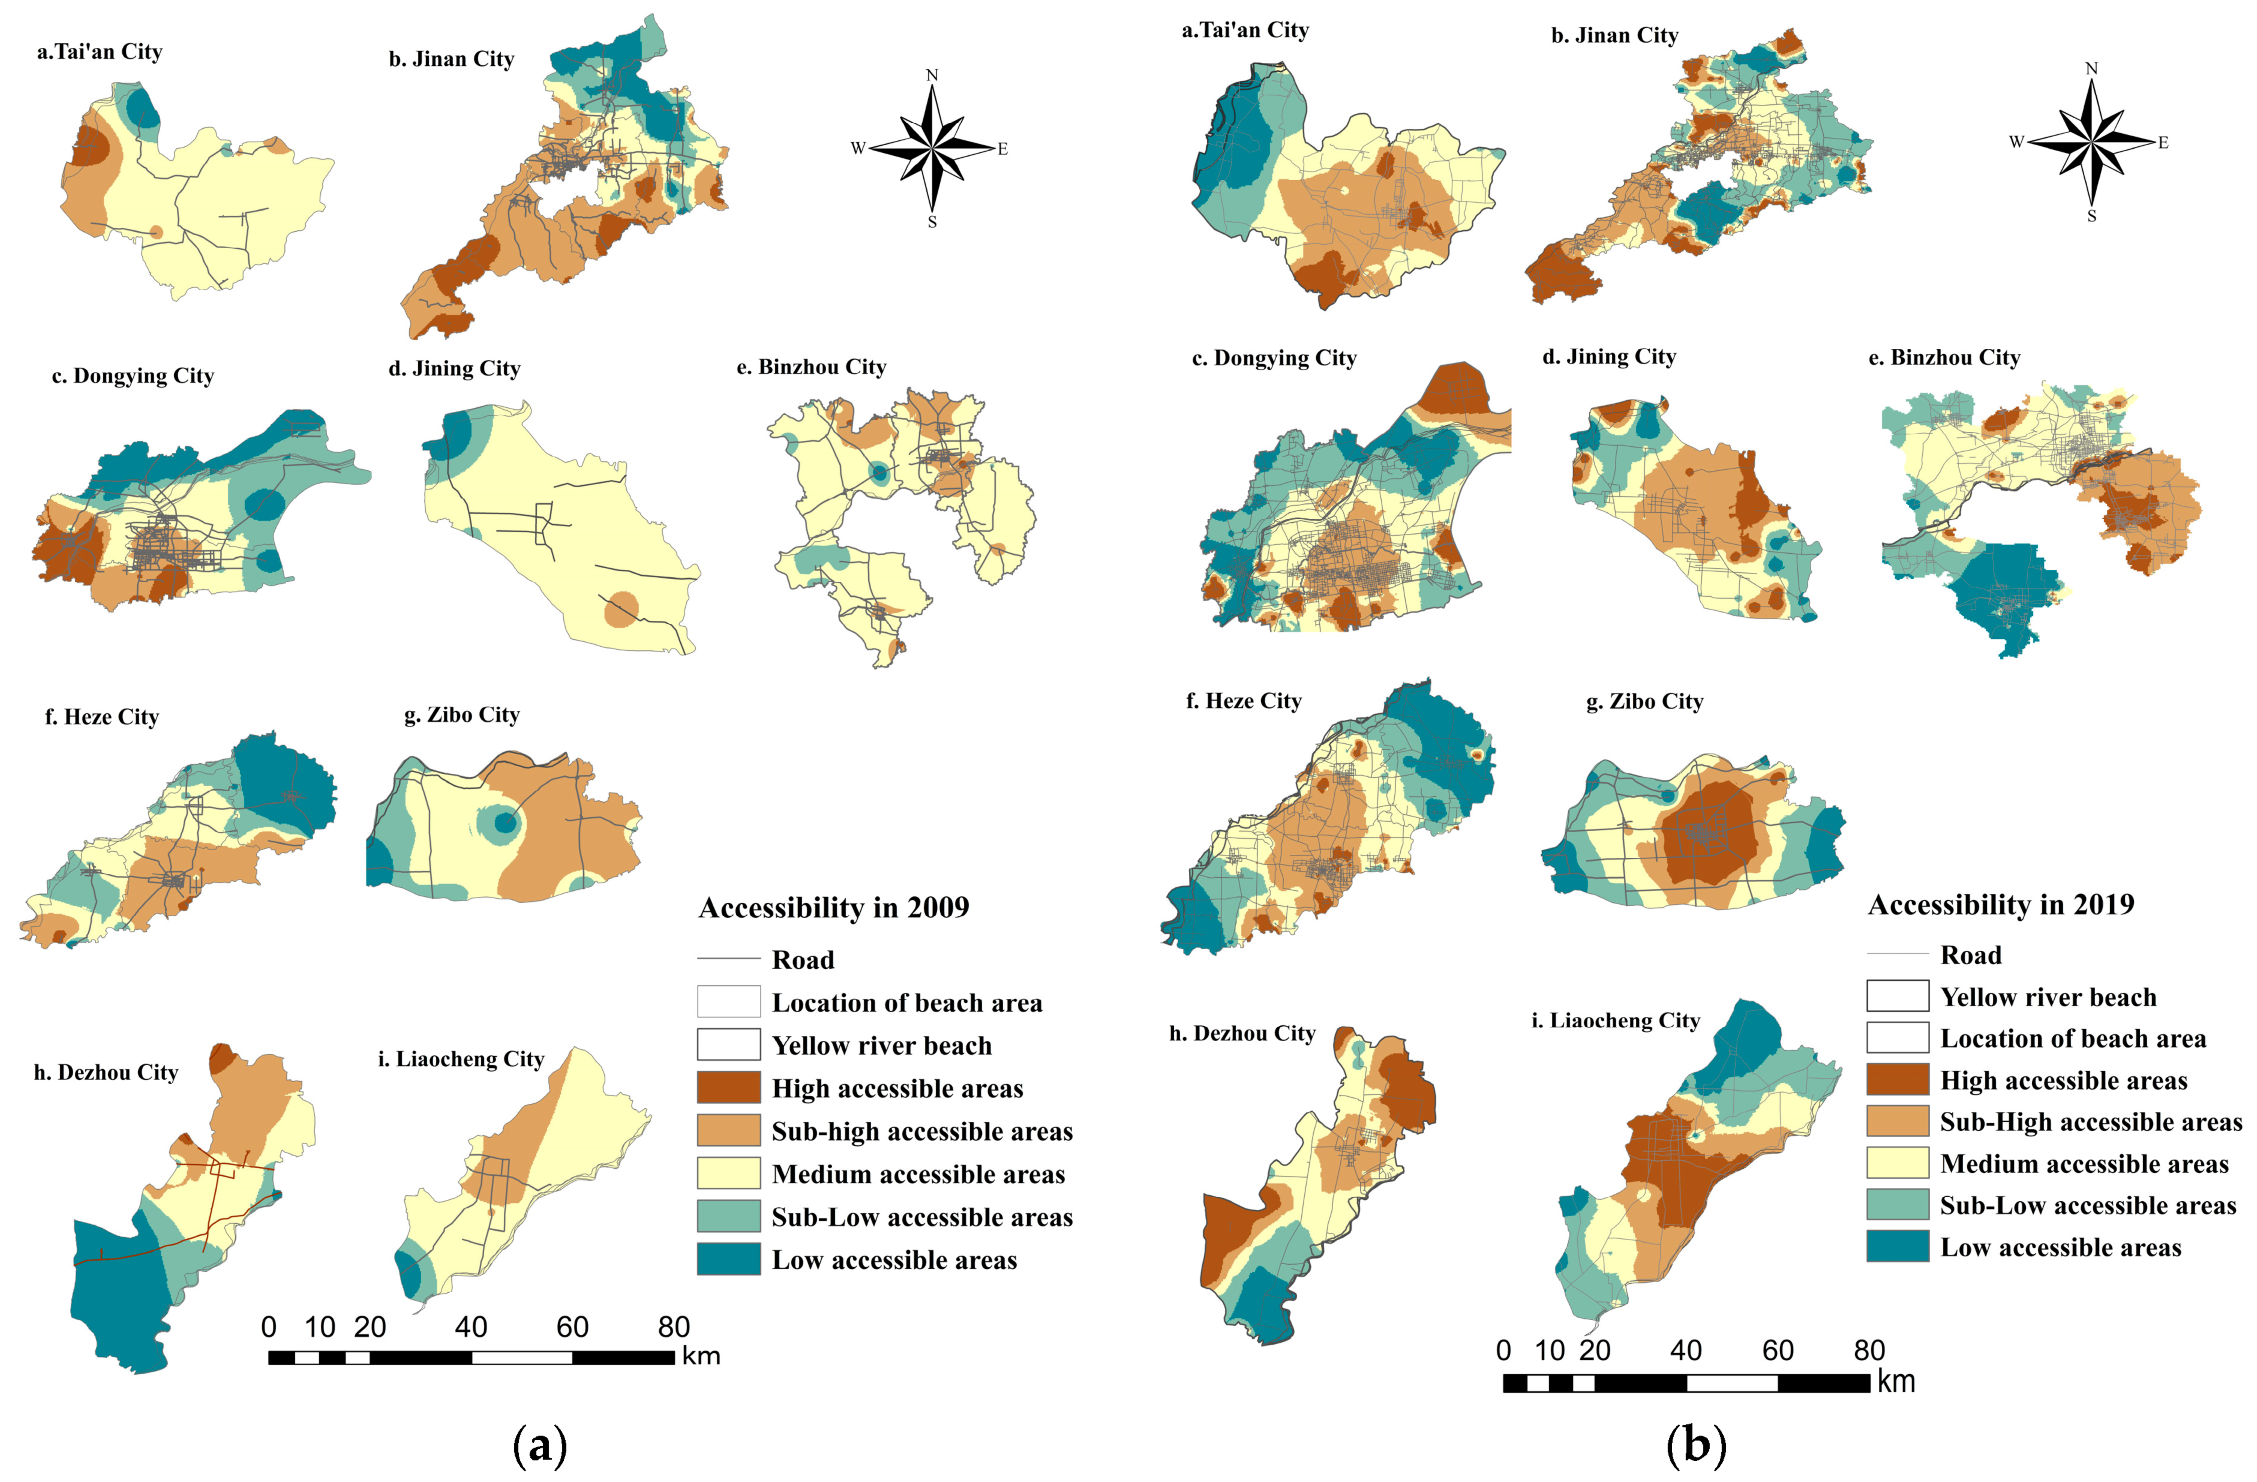
3.2.2. Accessibility Index (AI)

Roads are the main driving factor of regional accessibility [34]. Traffic accessibility refers to the convenience of transportation system interconnection between two regions, which reflects the opportunity for interaction between such regions [35]. This paper used the network analysis method to establish a traffic network data model based on a road network data set of the study region and used the minimum travel time as the accessibility impedance to establish an accessibility evaluation model based on the minimum impedance.

3.2.3. Biological Abundance Index (BAI)

The biological abundance index refers to differences in the number of biological species in different ecosystem types per unit area, which indirectly reflects the abundance of organisms in the evaluated area. Based on the calculation model of the biological abundance index, this paper calculated the biological abundance index values for 2009 and 2019 using spatial analysis tools. The model is as follows [36].
BAI = A b i o   ×   ( 0.35   ×   forest land + 0.21   ×   grassland + 0.28   ×   watershed wetland + 0.11   ×   cropland + 0.04   ×   building land + 0.01   ×   unused land ) / area
A b i o = 100 / A m a x
where A b i o denotes the normalized index of biological abundance, and A m a x   denotes the maximum value of the index of biological abundance before normalization treatment.

4. Establishment of Index System

The framework of coordination quantitative standards and the spatial differences and key issues in different regions of the beach area were combined in order to select representative indicators to measure the coordination of ecological protection and high-quality development in the beach area. At the same time, according to the principles of scientificity, comprehensiveness, applicability, operability, and independence, a quantitative index system composed of a “target layer, criterion layer and index layer” was constructed [37].
According to the quantitative standard analysis, whether the high-quality development and ecological protection of the Yellow River beach area can be coordinated was measured according to four aspects: ecological environment health, high-quality economic development, social livelihood security, and flood control construction. Therefore, these aspects were taken as four subsystems in order to measure their harmonious development levels and coupling coordination degrees.
(1)
The ecological environment quality subsystem considers the two factors of ecological protection and environmental monitoring. According to the characteristics of the Yellow River beach area, four indexes, namely vegetation coverage, flood risk intensity, CO2 emission and beach area, were selected to measure the ecological environment protection factor, and two indexes, namely the biological abundance index and biological environment condition index, were selected to measure the ecological environment monitoring factor.
(2)
The economic development level subsystem considered the economic foundation and agricultural development of the beach area, which were measured by three indicators, namely GDP, per capital disposable income, and grain output.
(3)
The social livelihood security subsystem considered the population characteristics, public services, and life and education quality of the study area. The population characteristics were measured by the regional population density; the public services were measured according to their accessibility; the quality of life and education were measured by the employment rate, Engel coefficient, and education level.
(4)
The flood control construction subsystem considers the flood control degree and infrastructure construction. The degree of flood control was measured using four aspects: the construction rates of rivers and dams, the resettlement rate, the improvement rates of old village platforms, and the rates of building nearby village platforms. The construction of the infrastructure was measured by the construction rate of evacuation roads.
The evaluation index system of the coordinated development level of ecological protection and the high-quality development system in the Yellow River flood plain is shown in Table 2.

5. Methods

5.1. Weight Allocation

Before the weight distribution was carried out, the range standardization method was used to non-dimensionalize the single index, and each index was then mapped to the interval [0, 1]. According to the relationships between the indicators and the development level, the development level was divided into positive indicators and negative indicators [38].
Positive indicator: Xij = (Xij − Xi min)/(Xi max − Xi min)
Negative indicator: Xij = (Xi max − Xij)/(Xi max − Xi min)
where Xij is the standardized value; i is the indicator number and takes values from 1, 2, …, n; j is the year of the study and takes values from 1, 2, …, m; Xij is the original value; Xi max and Xi min represent the maximum and minimum values of the ith indicator, respectively.
The CRITIC method, an objective weighting method proposed by Diakoulaki et al., uses the contrast strength and conflict of evaluation indicators to determine the objective weight of indicators [39]. Although this method comprehensively considers data fluctuation and the correlation between indicators, it cannot measure the degree of dispersion between indicators. The entropy weight method determines the index weight according to the degree of variation of each index value. It has high accuracy and adaptability, but it relies too much on sample data [40]. Therefore, this paper used the CRITIC method and the entropy method to reflect the weight of indicators more objectively.
(1)
CRITIC method
χ j ¯ , S j , R j , and C j denote the indicator variability, standard deviation, conflict, and information of the jth item, respectively, and the weight of each indicator is w 1 . The calculation formula is shown in Equations (13)–(17).
χ j ¯ = 1 n i = 1 n χ i j
where χ j ¯ is the variability of the indicator, and χ i j is the standardized value.
S j = i = 1 n χ i j χ j ¯ 2 n 1
where S j is the standard deviation of the jth indicator.
R j = i = 1 p 1 r i j
where R j is indicator conflict; r i j is the linear correlation coefficient between indicators i and j.
C j = S j i = 1 p 1 r i j = S j × R j
w 1 = C j i = 1 p C j
(2)
Entropy method
P i j ,   e i j , d j denote the weight of the value of each sample indicator i under the jth indicator, the entropy value of the jth indicator, and the information entropy redundancy. The weight of the jth indicator is calculated using the information entropy as w 2 . The calculation formula is shown in Equations (18)–(21).
P i j = χ i j / i = 1 n χ i j ,   i = 1 ,   2 , ,   n ,   j = 1 ,   2 , ,   m
where P i j is the weight of the sample, and χ i j is the standardized value.
e i j = k / i = 1 n P i j ln P i j ,   j = 1 ,   2 , ,   m
where k = 1/ ln n , satisfies 1 ≥   e j ≥ 0.
d j = 1 e j ,   j = 1 ,   2 , ,   m
w 2 = d j / i = 1 d j d j ,   j = 1 ,   2 , ,   m
Combining the combination weights of the jth indicator:
  w j = ( w 1 + w 2 ) / 2

5.2. Evaluation Models

Among the multi-indicator evaluation models, the gray correlation evaluation method, fuzzy comprehensive evaluation, and coupled coordination method are widely used. Based on an analysis of the principles of each evaluation model and combining the advantages of such models, this paper used a combination of the “SMI-P” and coordination coupling model to quantitatively analyze the harmony and coupling coordination degree of the system. The specific steps were as follows:
(1)
The fuzzy membership method was used to quantify the single index [41]. This method eliminates the influence of different dimensions and the positive and negative types between the indicators in the evaluation. After processing each indicator, all indicators were uniformly mapped to the [0, 1] interval. According to the relationships between the indicators and the development level, the development level was divided into positive indicators and reverse indicators. The calculation formulae are shown in Equations (23) and (24). The index function was divided into five sections, with each index having five characteristic values: the worst value, poor value, pass value, better value, and optimal value. The corresponding harmony values were 0, 0.3, 0.6, 0.8, and 1. The single index coordination degree (harmony) calculation formula is:
μ i = 0 , χ i a i 0.3 χ i a i b i a i , a i < χ i b i 0.3 + 0.3 χ i b i c i b i , b i < χ i c i 0.6 + 0.2 χ i c i d i c i , c i < χ i d i 0.8 + 0.2 χ i d i e i d i , d i < χ i e i 1 , e i χ i
μ i = 1 , χ i e i 0.8 + 0.2 d i χ i d i e i , e i < χ i d i 0.6 + 0.2 c i χ i c i d i , d i < χ i c i 0.3 + 0.3 b i χ i b i c i , c i < χ i b i 0.3 a i χ i a i b i , b i < χ i a i 0 , a i χ i
where μ i is the quantitative value of the ith indicator; χ i ,     a i , b i , c i , d i and   e i are the value, the worst value, the worse value, the passing value, the better value and the best value of the ith indicator, respectively.
(2)
The criterion layer contained a number of indicators that were able to reflect the degree of coordination between ecological protection and high-quality development in the Yellow River beach area. In order to comprehensively consider the impact of the indicators on the development level of the Yellow River beach area, based on the calculation of the single-index harmony degree, the weighted summation was used to calculate the harmony degrees of the four subsystems. The specific formula is as follows:
E E S F j = i = 1 n w i μ i
(3)
The harmonious development levels of the four subsystems, namely the ecological environment quality, economic development level, social livelihood security, and flood control construction subsystems, were quantitatively studied using Formula (26).
EESF = j = 1 n w j E E S F j
After calculating the level of harmonious development, the following seven levels were classified according to the values, as shown in Table 3.
(4)
By combining the “multi-criteria integrated calculation” model with the coordination coupling model, an overall coordination degree model of the ecological protection and high-quality development system of the Yellow River beach area was constructed. The specific formula is as follows:
D = S 1 × S 2 ÷ S 1 + S 2 2 × E E S F 1 / 2
where E E S F j denotes the value of each criterion level; w i denotes the weight of each indicator; EESF is the level of harmonious development; D is the degree of overall coupling and coordination; S 1 is the development index of high-quality development; S 2 is the development index of ecological protection; w j is the weight of the four criterion layers. The four criterion layers constructed in this paper had the same degree of importance, so their weights were 0.25.
After calculating the overall coupling synergy degree, it was divided into the following levels according to the values, as shown in Table 4.

5.3. Spatial Autocorrelation Model

Spatial autocorrelation is a spatial statistical method that is used to explore whether data have correlation and aggregation characteristics in spatial relations. The global Moran index (Moran’s I) can reflect the correlation between spatial elements and adjacent spatial elements in a study area and measure the degree of aggregation or dispersion of spatial element attribute values [42]. Therefore, this paper used the global Moran‘s I index to explore the spatial correlation degree of the coupling coordination of the Yellow River beach area in Shandong Province. The specific formula is as follows:
I = n × i = 1 n j 1 n W i j x i x ¯ x j x ¯ i = 1 n j = 1 n W i j × i = 1 n x i x ¯ 2
where I denotes the global Moran’s ; n denotes the number of spatial units; x i , x j denote the coupling coordination degrees of the ith and jth locations of the Yellow River beach area in each prefecture-level city, respectively; x ¯ denotes the mean value of the coupling coordination degree; W i j denotes the spatial weight matrix. The values of global Moran’s are in the range of [–1, 1]; I > 0 denotes a positive spatial correlation, I < 0 denotes a negative spatial correlation, and I = 0 denotes no correlation.
Local spatial autocorrelation (LISA) analysis refers to the degree of correlation between a certain element of a local space and its neighboring elements, revealing the spatial aggregation or dispersion characteristics of spatial elements in the local area [43]. According to the relationship between the Moran’s I index of the evaluation unit and the average value of the Moran’s I index of its adjacent units, it is divided into four types: HH (high-high), LL (low-low), HL (high-low), and LH (low-high). The specific formula is as follows:
I i = x i x ¯ j = 1 n W i j x j x ¯ 1 n j = 1 n x i   x ¯ 2
where x i , and x j denote the attribute values of i and j units respectively; W i j denotes the spatial adjacency matrix. I i is a positive value indicating that the attribute value of the spatial unit is similar to that of the adjacent unit, and a negative value indicates that the attribute value of the spatial unit is different from that of the adjacent unit.

5.4. Global Sensitivity and Uncertainty Analyses

Uncertainty analysis propagates uncertainty in the model input to its output, while sensitivity analysis determines the contribution of each input factor to the uncertainty of the output [44,45]. In this study, the EFAST (Extended Fourier Amplitude Sensitivity Test) method and Monte Carlo simulation are used to analyze global sensitivity and uncertainty.
The EFAST method is a global sensitivity analysis method based on the FAST method and the Sobol method. This method adopted the idea of model variance analysis to calculate the expected value and variance of model prediction to express the interaction between various input parameters [46]. Therefore, the contribution ratio of the interaction between the parameters to the total variance is obtained by the decomposition of the model variance, and then the sensitivity index of each parameter is obtained. The specific formula is as follows:
V Y   i = 1 n V i i < j n n V i , j V i , j =   V E Y | x i , x j ) V i V j S i     V i / V
where V denotes the total variance of the model; V i denotes the variance term of the action of the ith parameter; V i , j denotes the variance term of the joint action of the ith and jth parameters; S i denotes the sensitivity index of the ith parameter.
Monte Carlo simulation is a simulation method for uncertainty analysis based on a probability model [47]. In the random sampling process of the Monte Carlo simulation in this study, it is assumed that all input parameters obey a uniform distribution. Simlab2.2 software was used to simulate the uncertainty resulting from the coordinated development level of the Yellow River beach area (5000 iterations).

6. Results

6.1. Results of Indicators Based on Remote Sensing Images

Results of RSEI
Based on image extraction, Figure 2 shows the remote sensing ecological index (RSEI) distribution maps of the Yellow River beach region for each prefecture-level city. The RSEI values of each year were divided into five categories at a 0.2 interval in order to more accurately assess the representativeness of RSEI: [0, 0.2) was low, [0.2, 0.4) was sub-low, [0.4, 0.6) was medium, [0.6, 0.8) was sub-high, and [0.8, 1] was high. As shown in the graph, there was a variable degree of improvement in the ecological quality of Yellow River beach areas in different prefecture-level cities between 2009 and 2019.

6.2. Results of Indicators Based on Geospatial Data

6.2.1. Results of FRI

The distribution of the flood risk intensity (FRI) index in the Yellow River beach area for each prefecture-level city based on the precipitation and DEM spatial distribution data is shown in Figure 3. It can be seen from the figure that the high-risk areas in the study area in 2019 were significantly higher than those in 2009, especially in the central part of the Yellow River beach area, which is due to the difference caused by precipitation.

6.2.2. Results of AI

Figure 4 shows the accessibility index distribution map of the counties and districts where the Yellow River beach area of each prefecture-level city was based on road extraction. This paper used the natural breakpoint method to divide the results into five levels: low, sub-low, medium, high, and sub-high accessibility. The results showed that the accessibility was basically consistent with the road density distribution and showed the characteristics of decreasing outward from the main urban area.

6.2.3. Results of BAI

The distribution of the biological abundance index (BAI) in the Yellow River beach area for each prefecture-level city based on the land use data is shown in Figure 5. According to the diagram, with the continuous increase in construction land, the biological abundance index in the study area showed a downward trend.

6.3. Changes in the Harmonious Development Level of Ecological Protection and High-Quality Development Systems in the Yellow River Beach Area
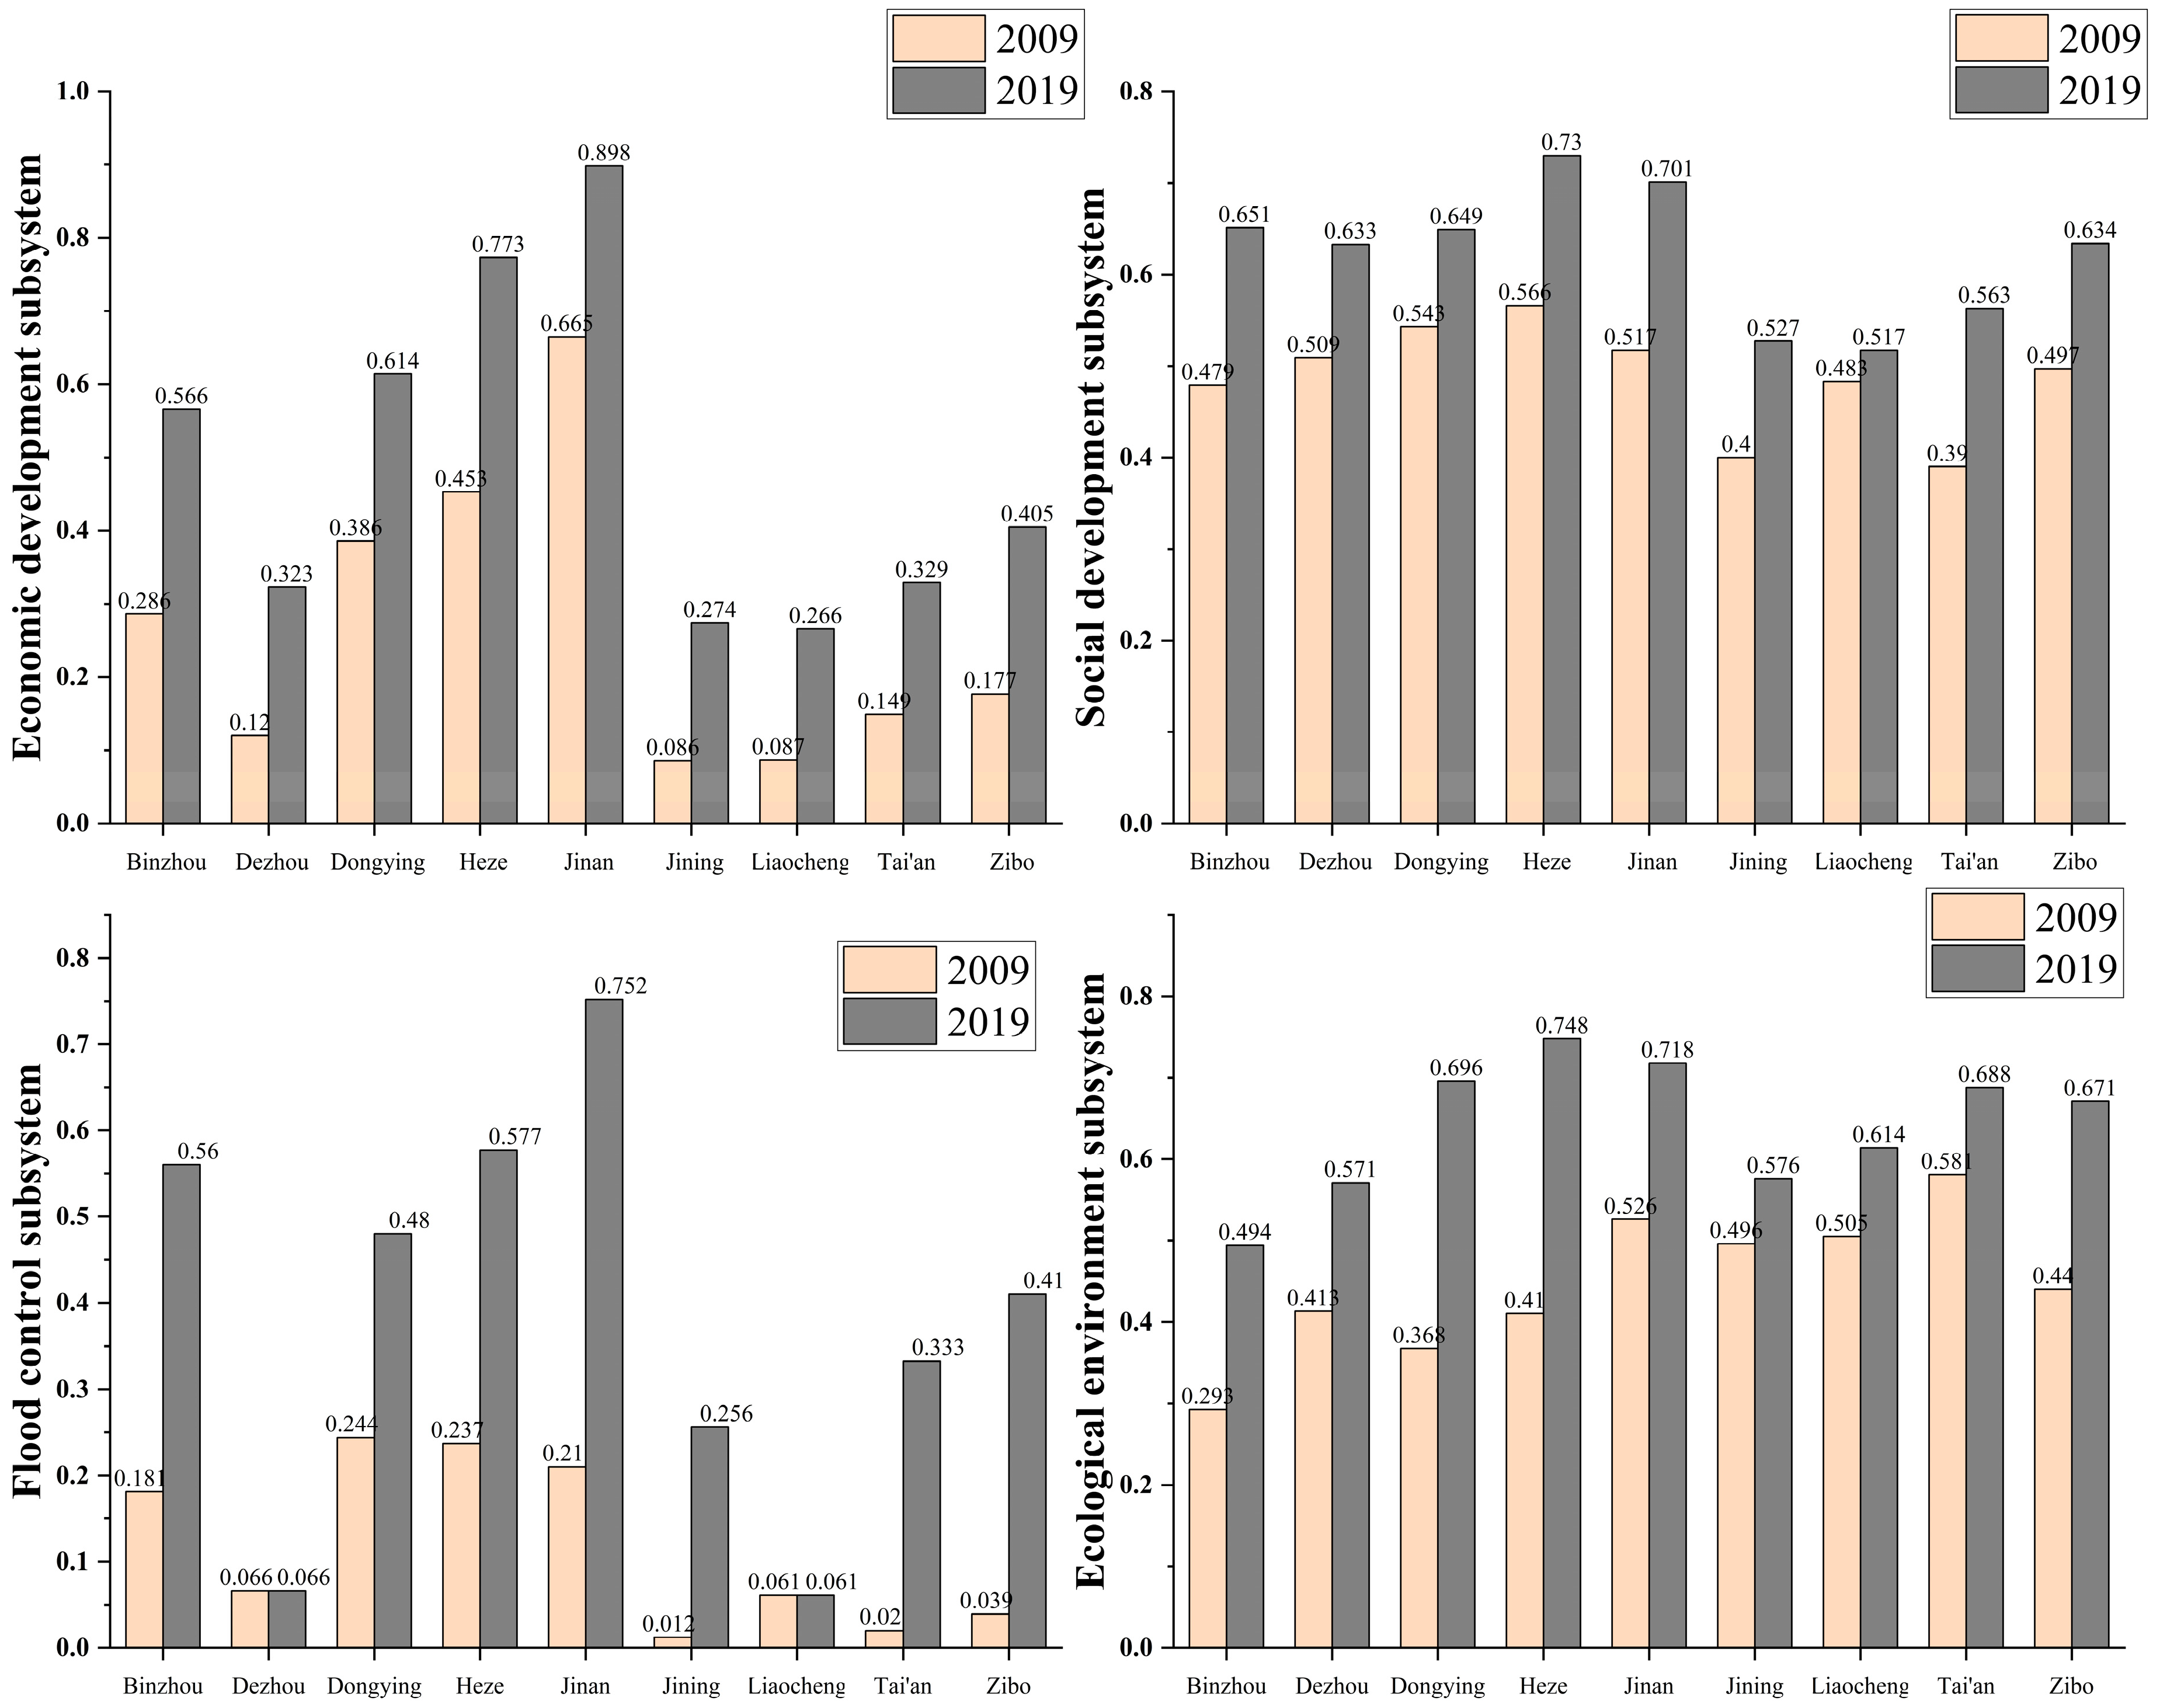
(1)
Changes in the development index of each subsystem at the city scale
According to the above formula, the development index of each subsystem in the Yellow River beach area for nine urban areas was calculated, as shown in Figure 6. It can be seen that in terms of the economic development subsystem, Jinan recorded the highest development index value (0.898), and maintained the highest values in 2009 and 2019, but its annual growth rate was the lowest among the nine cities (3.5%). Jining and Liaocheng were two cities with low development levels, but their annual average growth rates were the two highest. For the social development subsystem, Heze City recorded the highest development index value, while Jinan City had the most growth, recording an increase of 0.184. Furthermore, the average annual growth rates of Dongying City and Liaocheng City were the lowest. For the subsystem of flood control construction, 2009 was the starting point, so the flood control development index values of each city in the Yellow River floodplain area in 2009 were all 0. However, over the next 10 years, according to the “Relocation Planning of Residents in the Yellow River Floodplain Area of Shandong Province” issued by the Shandong Provincial Government, Shandong Province carried out various resident relocation tasks in the floodplain area. In 2019, Jinan City recorded the highest development index value (0.752), while Liaocheng City’s and Dezhou City’s development index values remained unchanged due to the lack of resident relocation in these floodplain areas. For the ecological environment subsystem, the development index values of Dongying City and Heze City were the two highest, recording average annual growth rates of 8.89% and 8.25%, respectively. Binzhou City recorded the most serious environmental pollution among the nine prefecture-level cities, and it was found to have had a low level of development. Overall, Jinan had the highest average development index value for the four aspects studied, namely the society, economy, flood control, and ecological environment aspects, which corresponds to the status of the provincial capital of Shandong Province.
(2)
Changes in the level of harmonious development of the overall system at the urban scale
Figure 7a shows the overall harmonious development trends for ecological protection and high-quality development in the Yellow River beach areas of cities in Shandong Province in 2009 and 2019 obtained using a radar map, which can directly show the changes in various regions each year. In 2009, only the Yellow River beach area of Jinan City was in the “medium level of harmony” stage, with the Yellow River beach areas of the remaining eight urban areas being in the “low level of harmony” stage. By 2019, Jinan City, Heze City, and Dongying City developed to the “sub-high level of harmony” stage, Jining City, Tai’an City, Zibo City, and Binzhou City entered the “medium level of harmony” stage, and the harmony between Liaocheng City and Dezhou City improved, but it was still in the “sub-low level of harmony” stage. Overall, the levels of harmonious development of the prefecture-level cities of the Yellow River beach areas to enhance the speed there was still a certain gap, but they nevertheless showed steady improvements.
Box plots can directly reflect the dispersion of data. Figure 7b shows the changes in the harmony of the Yellow River beach areas in various prefecture-level cities in 2009 and 2019. From 2009 to 2019, the span of the upper and lower lines of the box line map increased as a whole, indicating that the degree of harmony and difference of the Yellow River beach area of each prefecture-level city increased, and the levels of harmonious development in various places were not balanced. The main reason for this was that the degree of harmony in Jinan was large, which pulled up the maximum value, while the growth rates of Dezhou and Liaocheng were relatively slow, which pulled down the minimum value. According to the mean value line of the harmony degree, from 2009 to 2019, the Yellow River beach areas with low harmony degrees decreased, and their harmonious development levels gradually increased to higher levels.

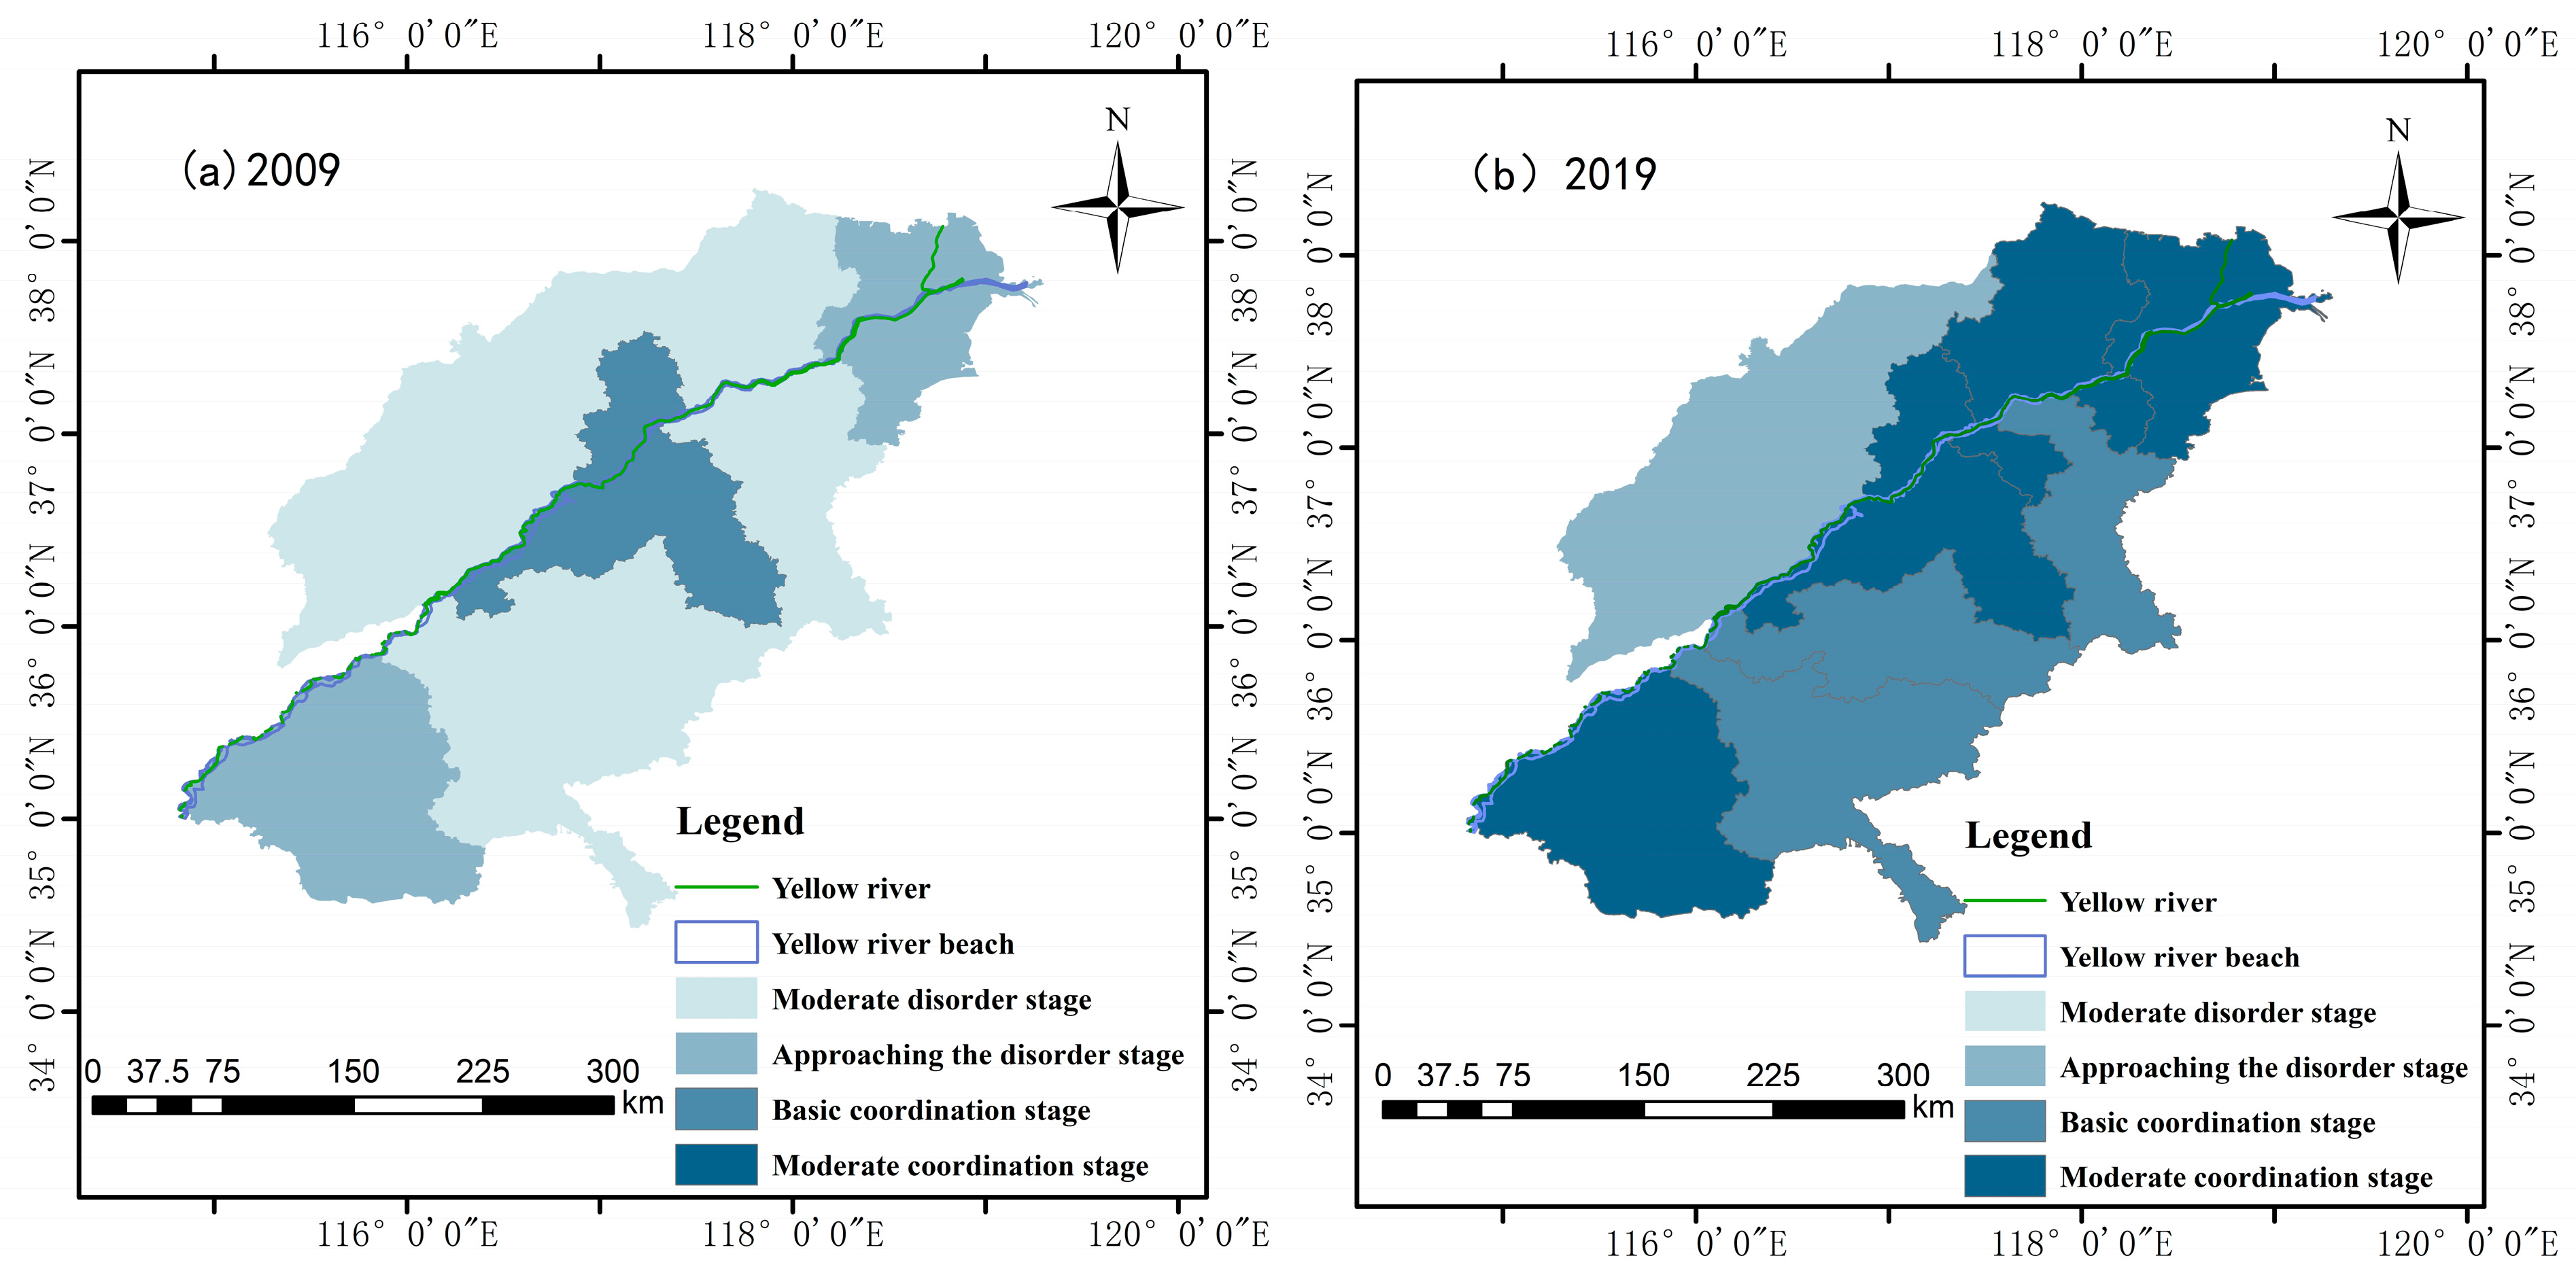
6.4. Spatial-Temporal Evolution Characteristics of Coupling and Coordinated Development of Ecological Protection and High-Quality Development System in Yellow River Beach Area

6.4.1. Analysis of Time Variation Characteristics

Table 5 shows that from the overall scale, the coupling and coordination of ecological protection and high-quality development in the Yellow River beach area of Shandong Province increased from 0.344 in 2009 to 0.580 in 2019, moving from the moderate imbalance stage to the basic coordination stage. From the perspective of the urban scale, the coupling coordination coefficient of each city was between 0.2 and 0.8. In 2009, only Jinan City was in the basic coordination stage; the remaining seven cities were in the imbalance stage. In 2019, Jinan City, Heze City, and Dongying City were found to have reached the moderate coordination stage, and the remaining prefecture-level cities, except Dezhou City and Liaocheng City, had entered the basic coordination stage. In 2019, Jinan City, Heze City, and Dongying City were found to have reached the moderate coordination stage, and the remaining prefecture-level cities, except Dezhou City and Liaocheng City, had entered the basic coordination stage. Although Dezhou City and Liaocheng City improved to a certain extent, they were still close to being in the imbalance stage. During the period from 2009 to 2019, the coordination degrees of the prefecture-level cities increased to varying degrees, with Tai’an City and Zibo City achieving the highest annual growth rates, indicating that both cities had begun to gradually implement a policy of ecological protection and high-quality coordinated development. The coupling coordination degree of Jinan City was the highest, mainly because Jinan City adheres to the concept of a green smart city with regard to urban development and because it pays more attention to the coordinated development of urban ecological protection and high-quality development than other cities.

6.4.2. Analysis of Spatial Distribution Characteristics

It can be seen from Figure 8 that the spatial distribution of the ecological protection and high-quality development system of the Yellow River beach area of each prefecture-level city presented a pattern of “the central region and the inflow and outflow regions of the Yellow River being superior, and the surrounding areas being inferior”, with there being significant differences among the regions. Overall, the regions with higher degrees of coordinated development were Jinan City, which is located in the central region; Dongying City, which is located at the estuary of the Yellow River; and Heze City, which is located in the inflow area of the Yellow River. Dongying City, as an ecological city located at the estuary of the lower reaches of the Yellow River, pays more attention to ecological protection than other cities. At the same time, as an important node of the Bohai Economic Circle, its economic development is also better than in other cities. Jinan is the capital of Shandong Province. Its economic and social development were both ranked first, while adhering to green development, and flood control and construction policy implementation of active Dongming County of Heze City focuses on the industrial layout of “North Industry and South Agriculture”, targets rural revitalization as a method to promote the development of beach areas, and steadily promotes the concentration of various resources and policies, from supporting poverty alleviation to comprehensively promoting rural revitalization. Its core goal is to accelerate the industrialization of agriculture in its beach area, which would alleviate farmers’ poverty and encourage their prosperity. To achieve this, it aims to focus on the relocation of residents and characteristic industries in its beach area as its starting point, and to focus on the improvement of comprehensive agricultural production capacity, market competitiveness, and sustainable development as its main direction. Furthermore, the region vigorously develops various green industries, such as efficient ecological agriculture, ecological circular breeding, selenium-rich crop planting, and tourism, including leisure tourism, and promote the integration of primary, secondary, and tertiary industries. The new pattern of rapid development of the “One Belt, One Road and Three Bases” has been formed, so in this study, the coupling and coordination degree between the ecological protection and high-quality development system of the Yellow River flood plain of Heze City was found to be high.

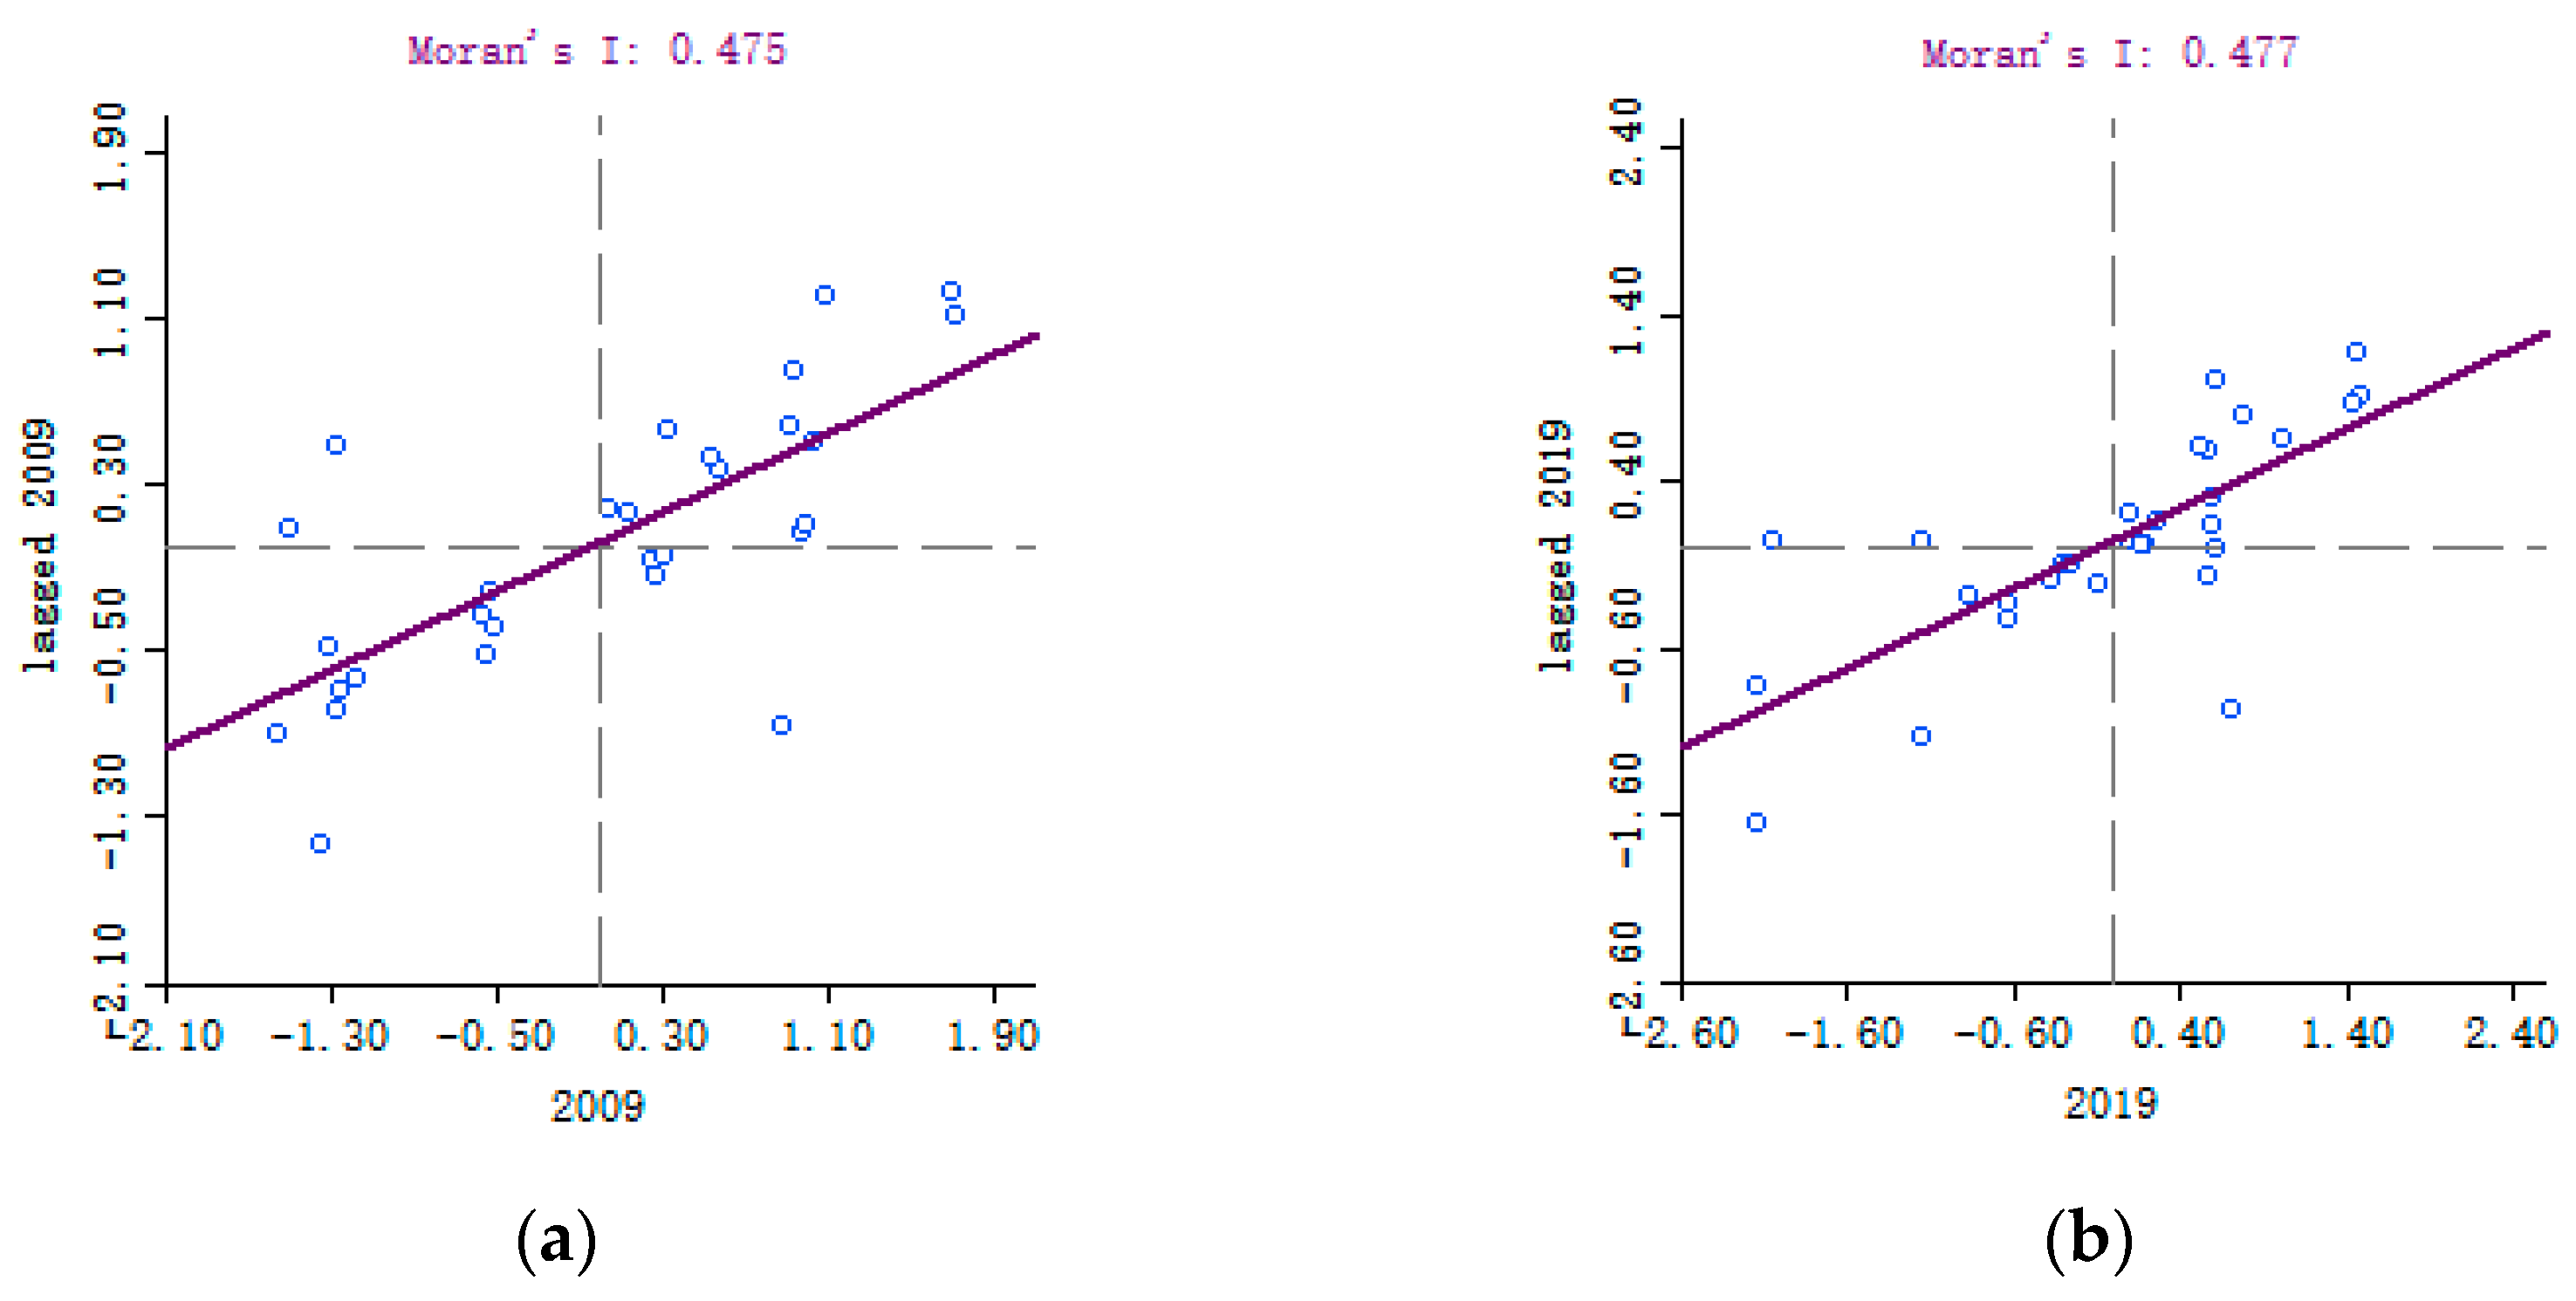
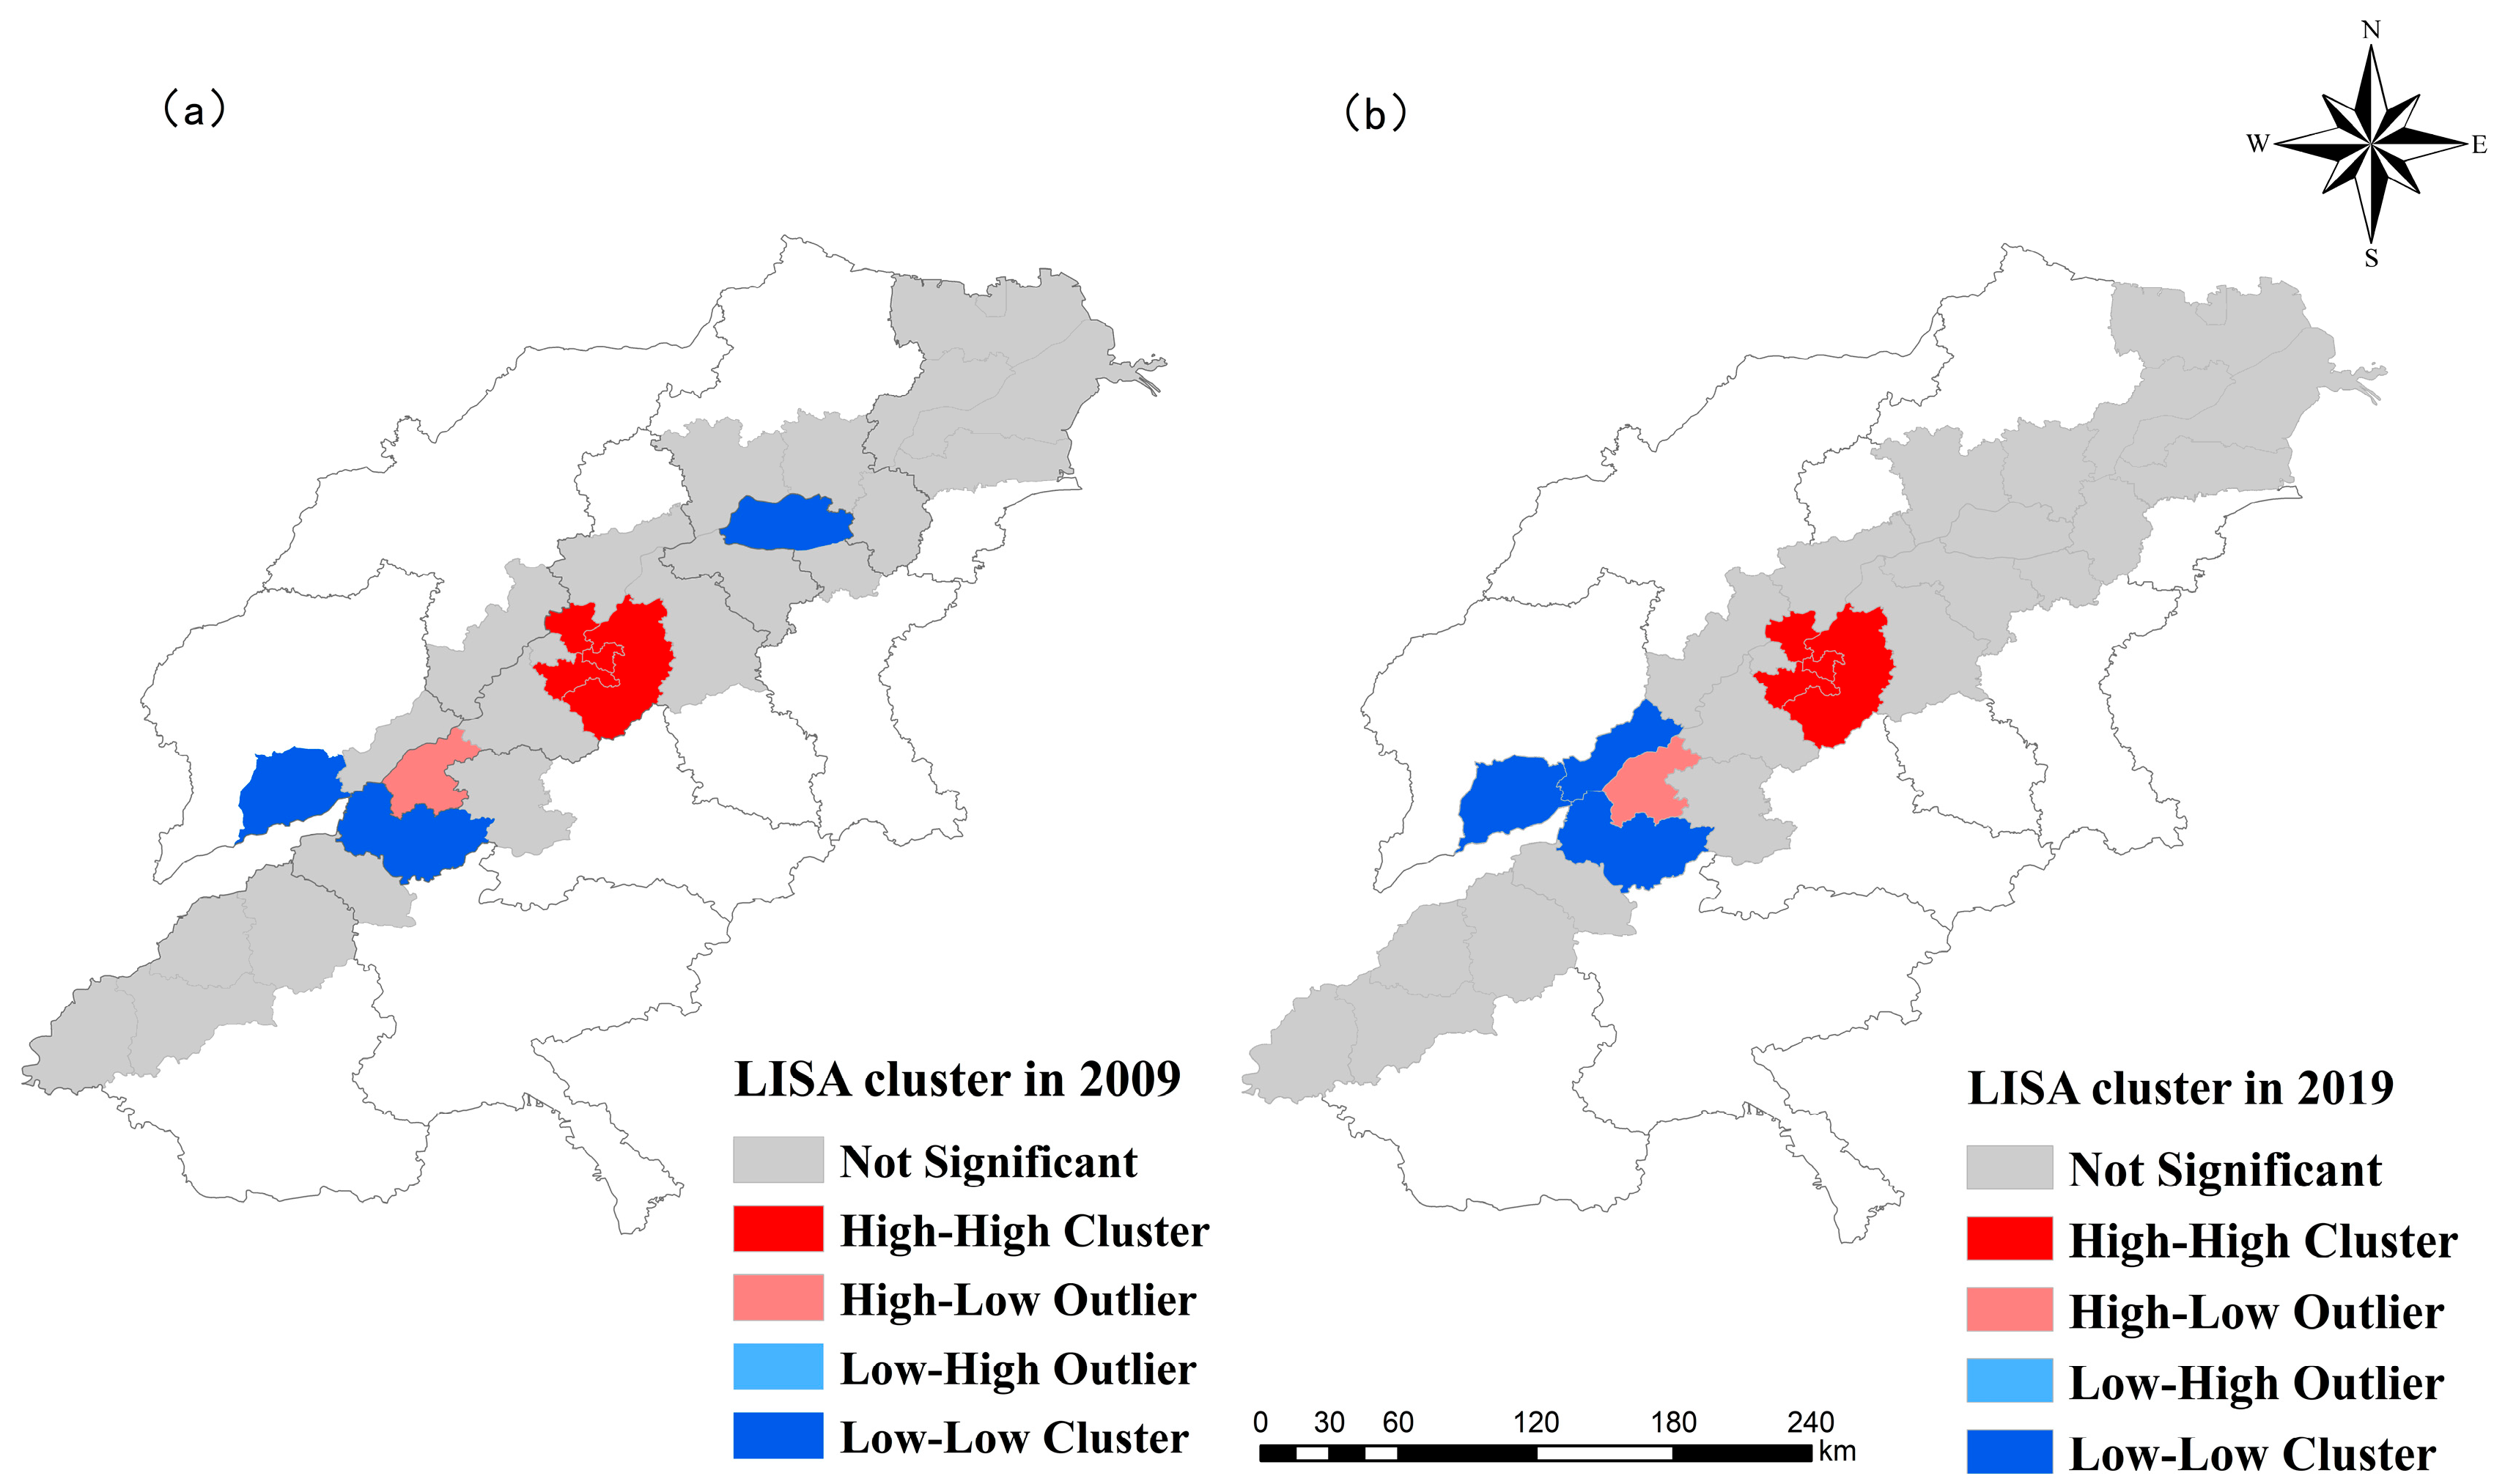
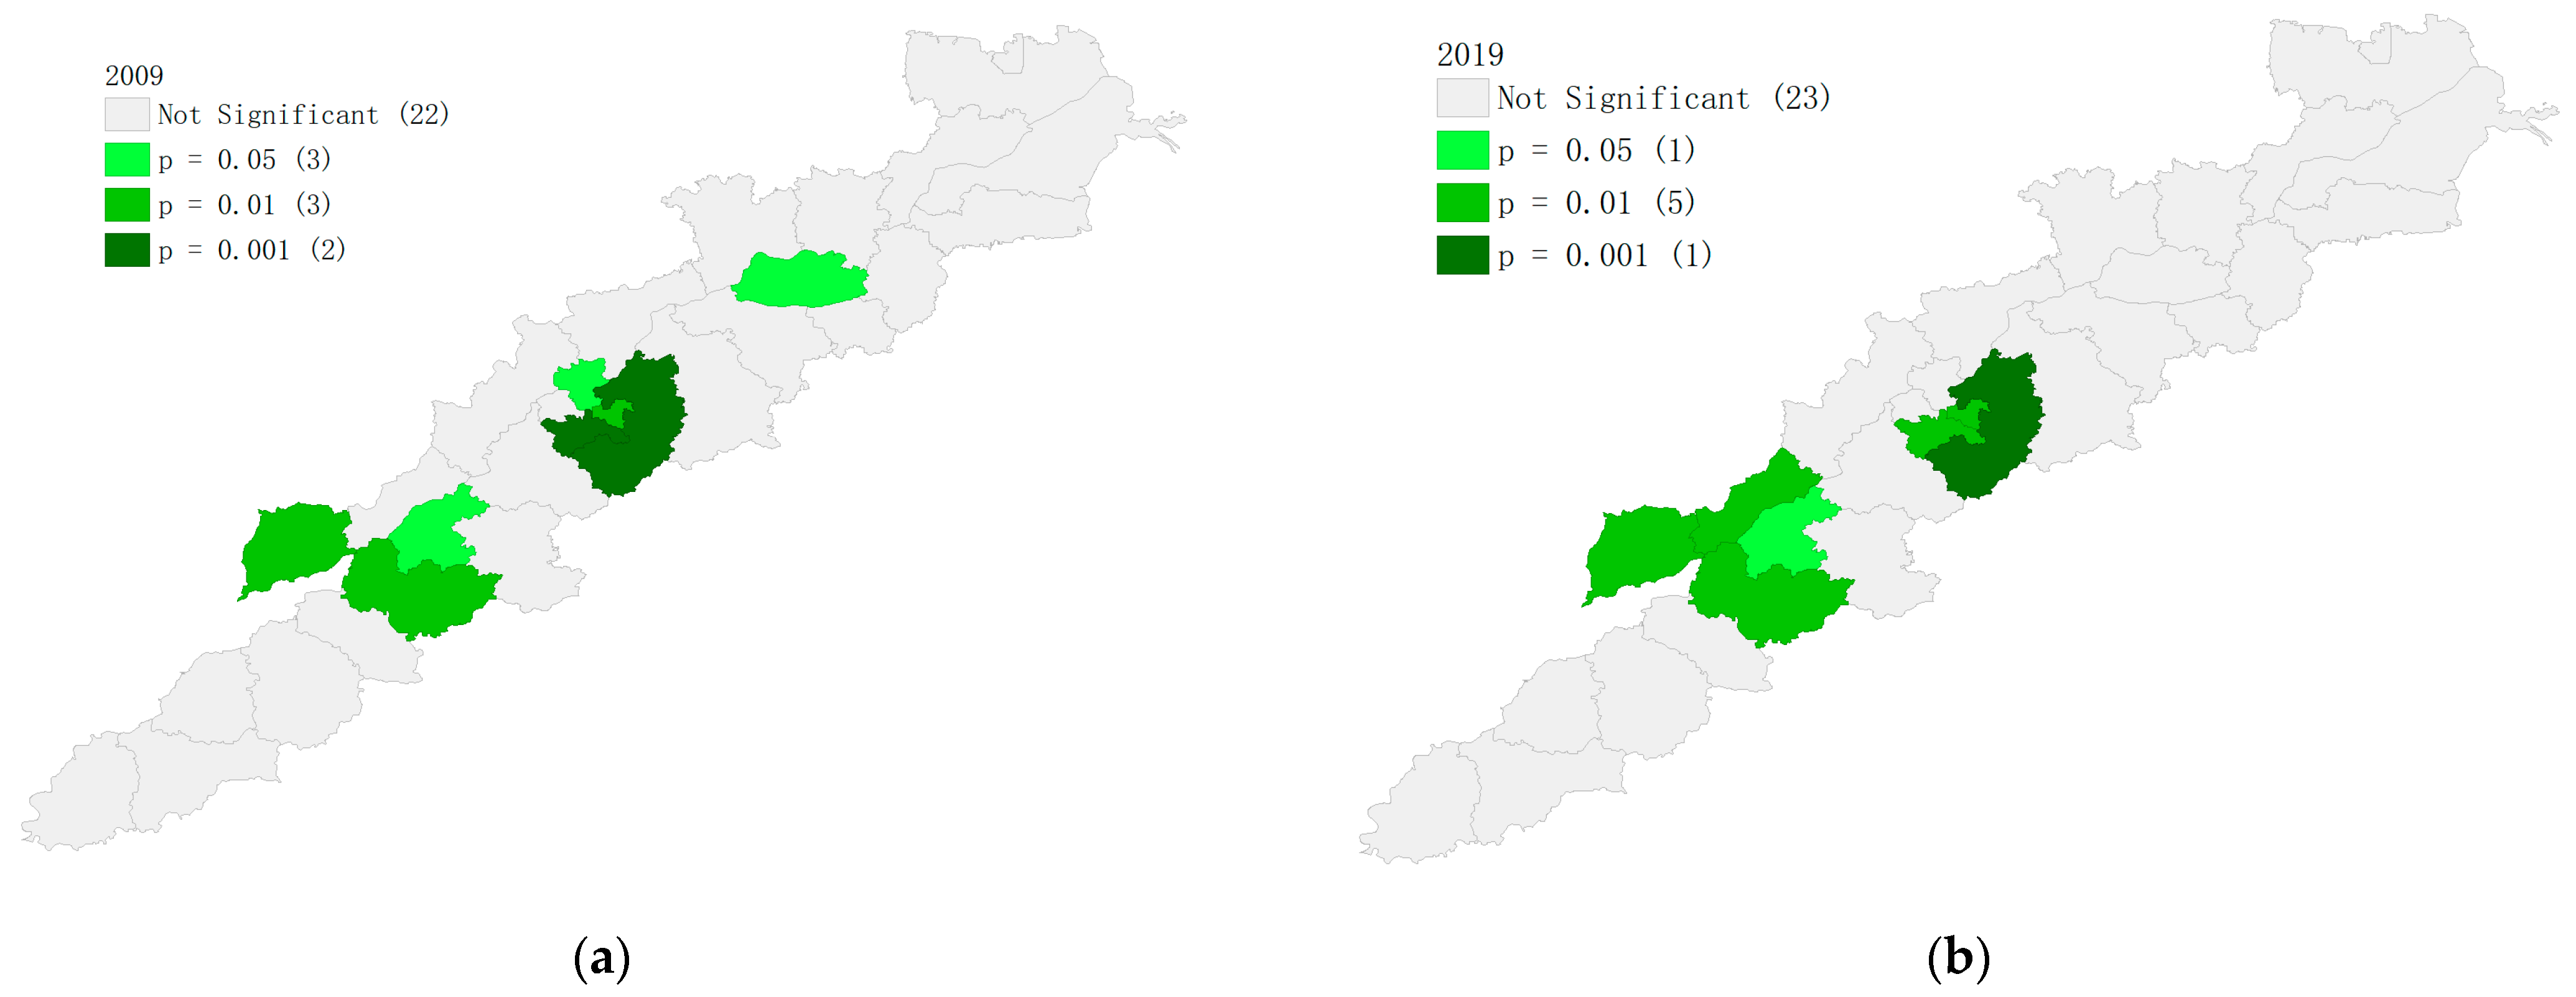
6.4.3. Analysis of Spatial Autocorrelation Results

In order to better reflect the correlation between ecological protection and high-quality development in the Yellow River beach area of Shandong Province based on the coordinated development index of counties and districts around the Yellow River beach area, this paper used the spatial autocorrelation model to analyze the spatial autocorrelation of the areas involved in the Yellow River beach area based on GeoDa and ArcGIS 10.6.1 software. The analysis results were as follows:
(1)
Analysis of global spatial autocorrelation results
Using the global autocorrelation model analysis, the Moran’s I values of the coordinated development index of the surrounding counties and districts of the Yellow River beach area in Shandong Province in 2009 and 2019 were 0.475 and 0.477, respectively. It showed that the coordinated development of the Yellow River Beach area has a positive correlation in space, and in the past ten years, the spatial correlation of coordinated development has increased, but the change range is small.
(2)
Analysis of local spatial autocorrelation results
Figure 9 shows the Moran’s I scatter plot of the coordination degree of the Yellow River beach area in 2009 and 2019. The local spatial autocorrelation Moran’s I values of the coordinated development index of the Yellow River beach area in 2009 and 2019 were all greater than 0. Combined with the significance test results, the coordinated development index in 2009 and 2019 showed H-H (high-high) outliers, H-L (high-low) outliers, and L-L (low-low) outliers in the local spatial distribution. From Figure 10 and Figure 11, it can be seen that the spatial autocorrelation type was H-H and was concentrated in the districts and counties in Jinan. As the capital of Shandong Province, Jinan ranks first in economic and social development, adheres to green development, and is more active in policy implementation. Therefore, the coordination index between the region and the surrounding counties was high, and the spatial difference was small. The aggregation area of H-L outliers was mainly in Pingyin County, Jinan City, which was mainly manifested in the high coordinated development index of the current county, but the coordinated development index of adjacent areas was low. The L-L abnormal value aggregation areas in 2009 were mainly concentrated in counties and districts in Liaocheng City, Tai’an City, and Zibo City, and the L-L abnormal value aggregation areas in 2019 were mainly concentrated in counties and districts in Liaocheng City and Tai’an City.

6.4.4. Global Sensitivity and Uncertainty Analysis Results

(1)
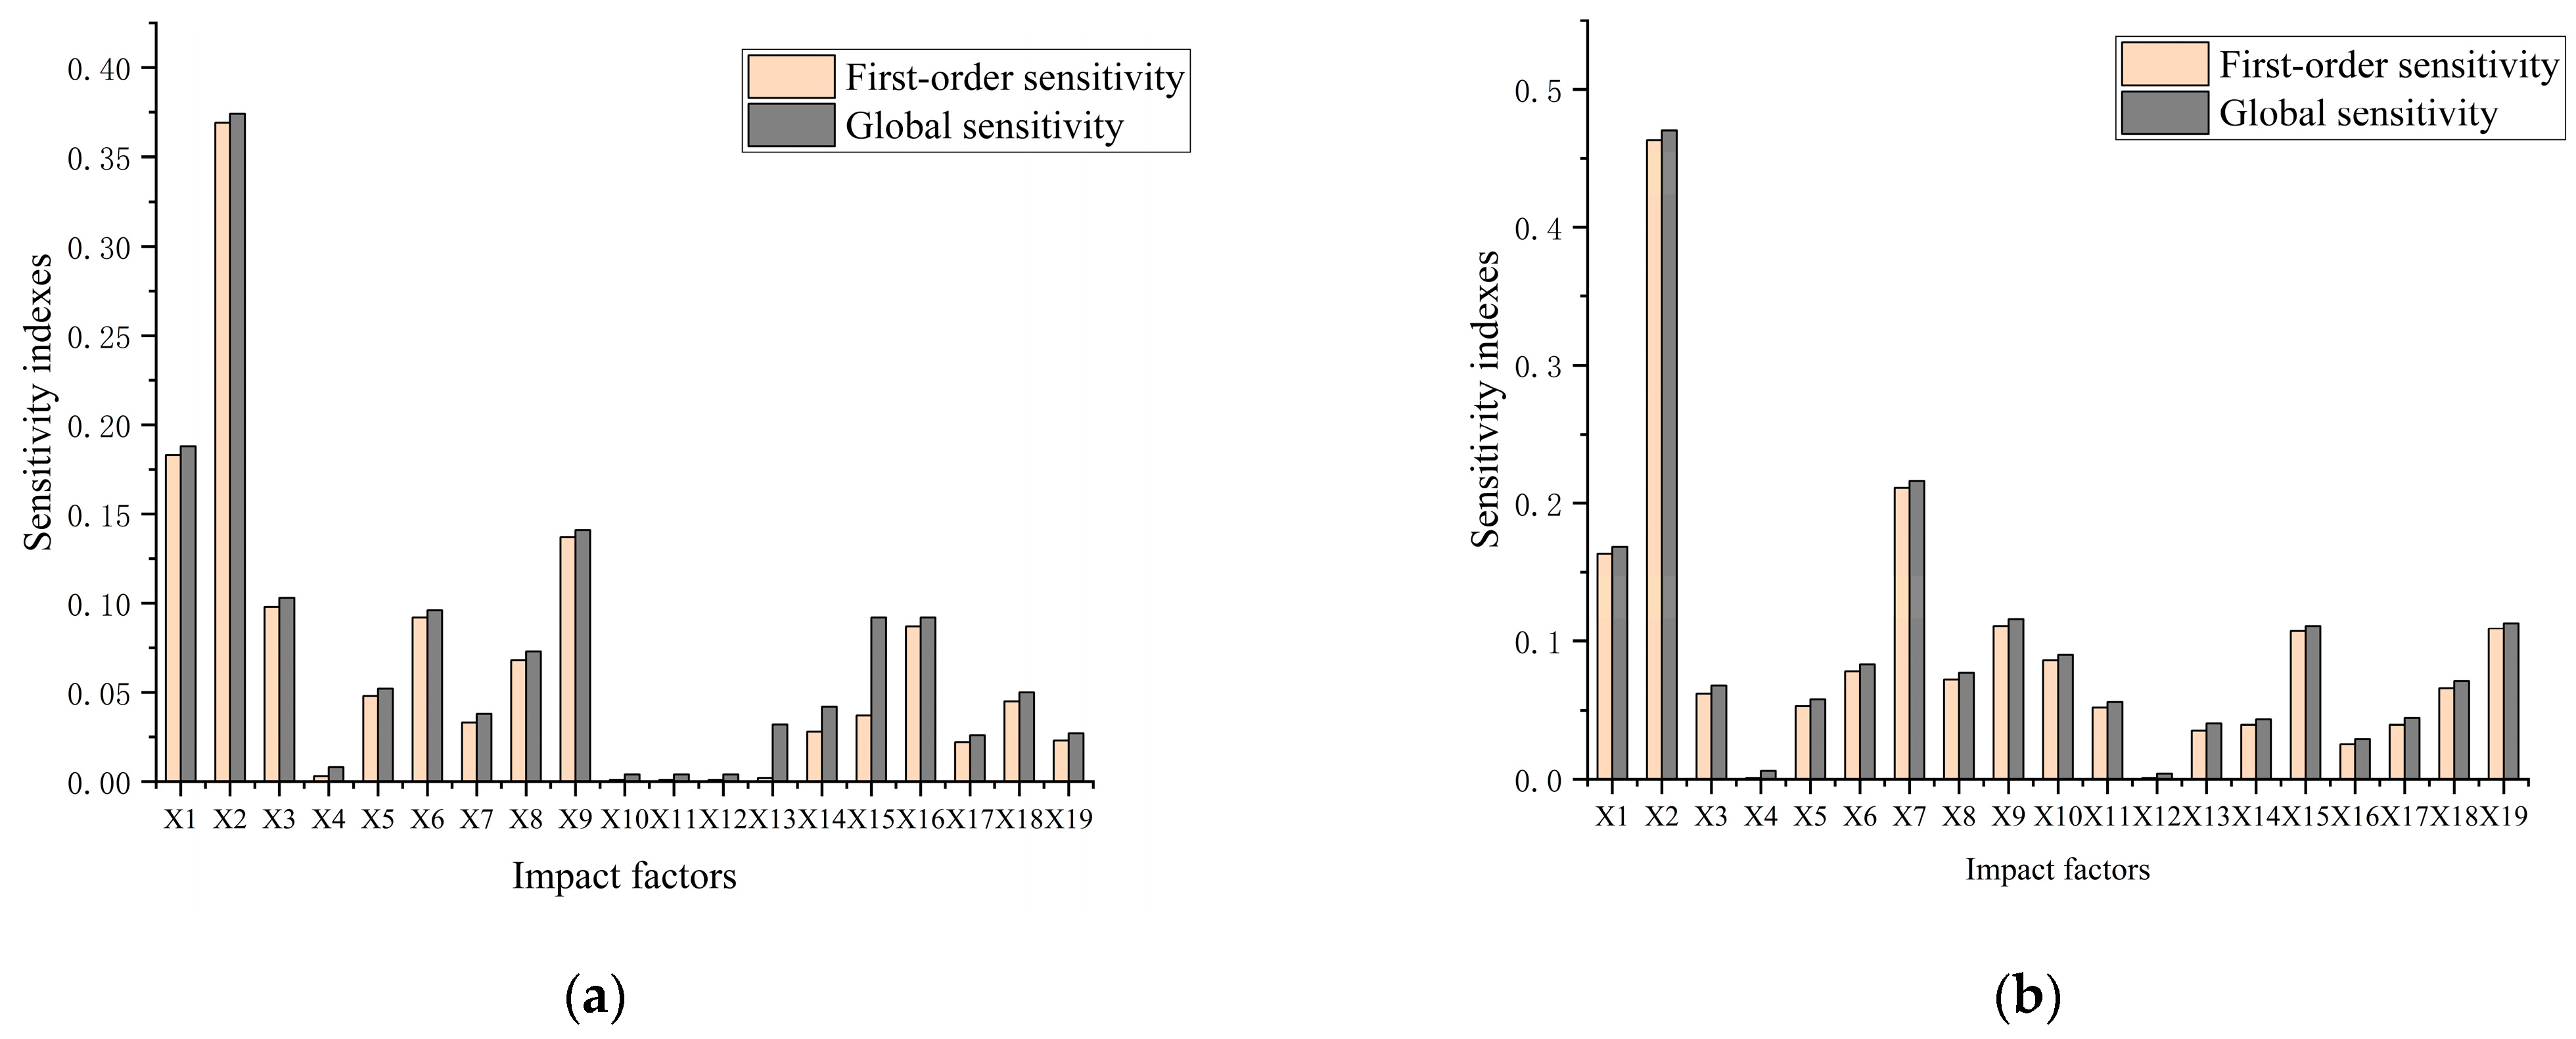
Global sensitivity analysis results
This paper used the EFAST method to study the influence of different factors in the EESF model on the coordinated development index of the Yellow River Beach area, as shown in Figure 12. The results showed that the first-order sensitivity of the 19 factors in the EESF model to the coordinated development index was basically consistent with the overall trend of the total sensitivity analysis results. For 19 input factors, grain production (X2) was the most sensitive, followed by GDP (X1) and embankment protection rate (X9). The global sensitivity index of grain production (X2) in 2019 was 0.470, which was due to the fact that the cultivated land area in the Yellow River beach area accounted for about 78%; thus, grain production was an important factor affecting the development of the beach area.
(2)
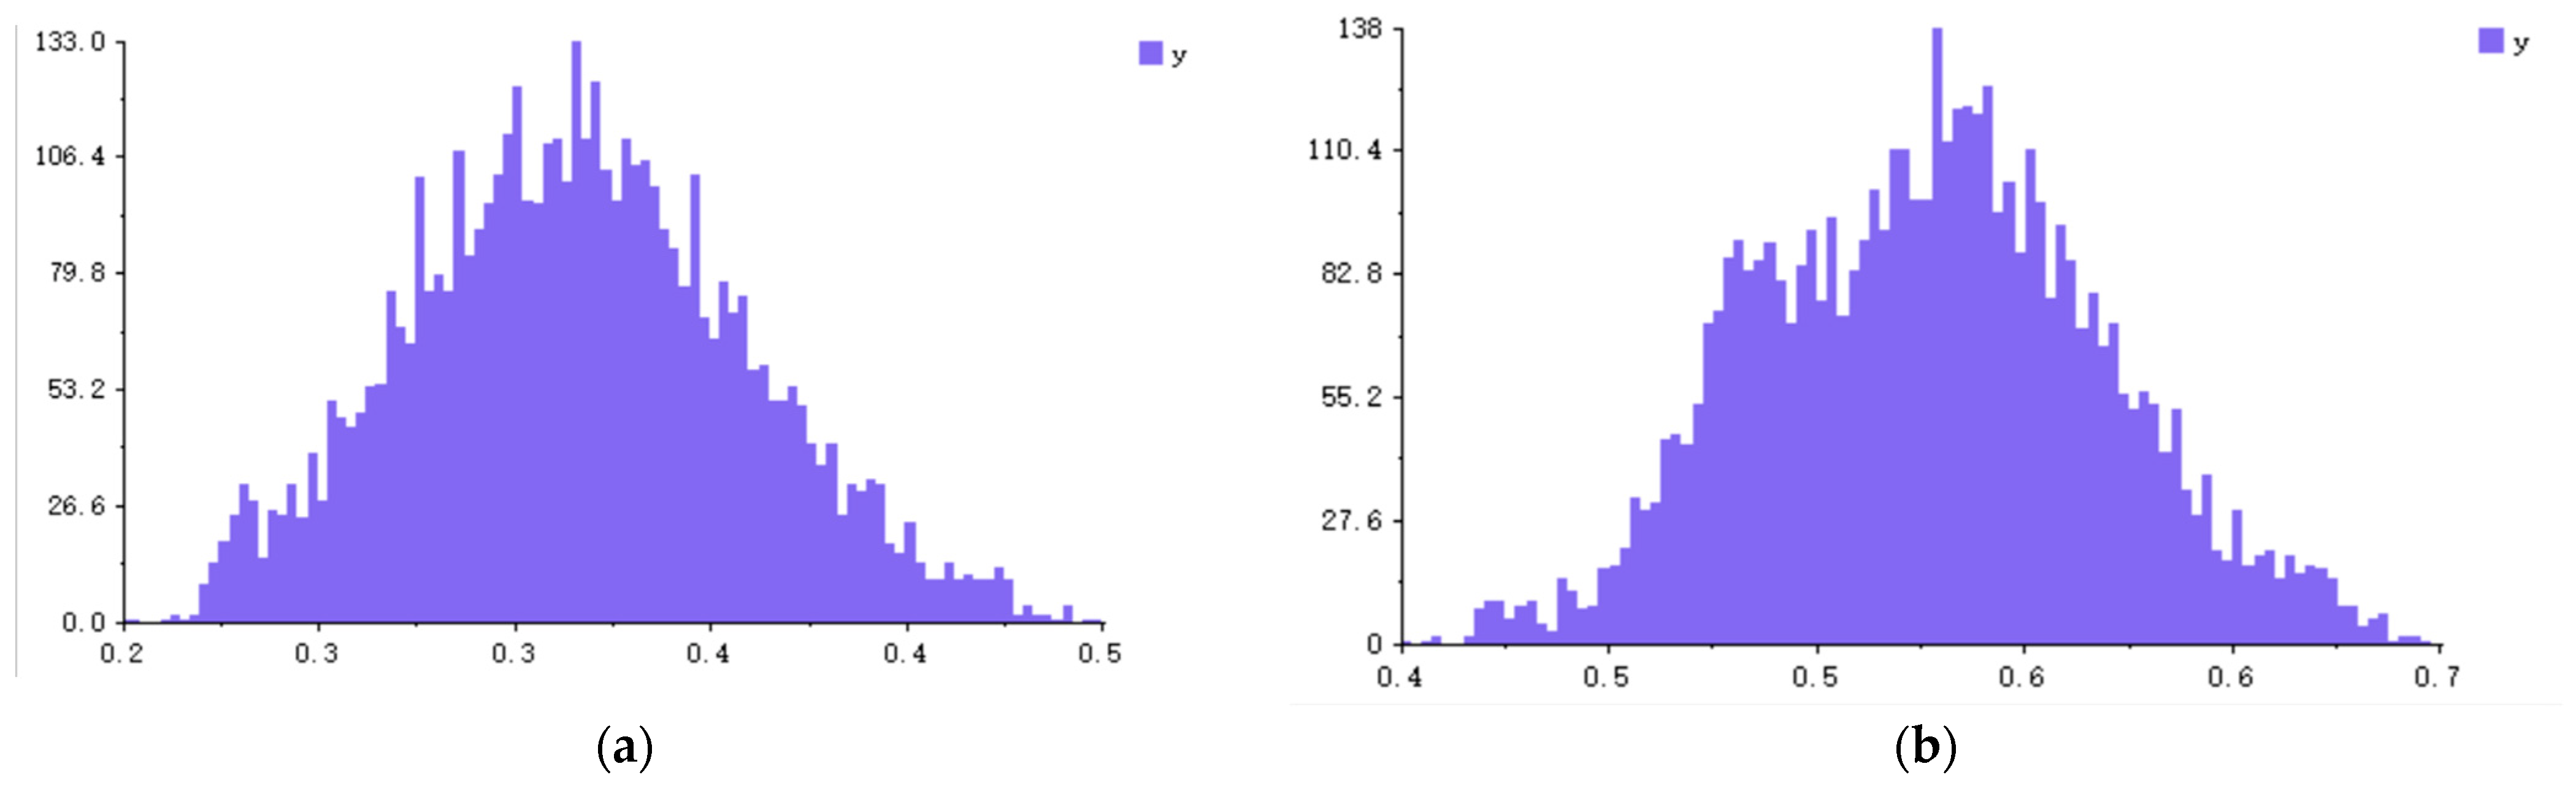
Uncertainty analysis results
The results of the uncertainty analysis (Figure 13 and Table 6) showed that the average coordinated development index of the Yellow River beach area in Shandong Province in 2009 and 2019 was 0.355 and 0.556, and the coefficient of variation was 9.58% and 7.91%, respectively. When the coefficient of variation was less than 10%, it had a weak variation, which indicated that the uncertainty of the calculation results of the coordinated development index of the Yellow River beach area in this study was low.

7. Discussion and Conclusions

Based on the remote sensing image data, geospatial data, and socio-economic statistical data of each prefecture-level city in 2009 and 2019, this study proposed a quantitative evaluation model (EESF) for the development of the Yellow River beach area. The coordinated development level of the Yellow River beach area was quantified by combining the “CRITIC-entropy weight method” and the “‘single index quantification–multi-index synthesis–multi-criteria integration’ (SMI-P)—coordination degree model”. The spatial autocorrelation model was used to analyze the spatial distribution characteristics of the coordinated development level, and the global sensitivity and uncertainty analysis (GSUA) was carried out for the sensitivity and uncertainty of the parameters. The following results were drawn:
(1)
In the past 10 years, the coordinated development level of the Yellow River beach area in Shandong Province has generally shown an upward trend, from 0.344 in 2009 to 0.580 in 2019.
(2)
Spatial autocorrelation analysis showed that the spatial distribution of the coordinated development level of the Yellow River beach area had a significant autocorrelation and a certain degree of increase in ten years; the ‘not significant’ type was dominant, and only one county showed ‘H-L’ clustering, indicating that the spatial heterogeneity of the coordinated development level of the Yellow River beach area was small.
(3)
Global sensitivity and uncertainty analysis showed that 2009 and 2019 were the most sensitive to grain yield (X2), followed by beach GDP (X1) and embankment protection rate (X9). The coefficients of variation were 9.58% and 7.91%, respectively, which belonged to weak variation and low uncertainty.
This study provided a ‘localized’ quantitative model for the coordinated development of the Yellow River beach area in Shandong Province and explored the spatial distribution characteristics of the coordinated development of the Yellow River beach area and the sensitivity and uncertainty of each parameter to the coordinated development index, which provided a new perspective and theoretical basis for exploring the high-quality development of the Yellow River beach area. The study found that agricultural resources and embankment projects have a great impact on the coordinated development of the beach area. The beach area should rationally develop and utilize agricultural resources, promote the integration of ecological industries, comprehensively build embankment projects, and ensure the production of land and living land. However, in order to realize the coordinated development of river basin management and regional society, further research is needed in the future, including combining land use with flood control safety, social and economic development, and ecological environment protection in the lower reaches of the Yellow River, and rationally planning and managing land resources in high-risk areas to improve the sustainability of beach development.

Author Contributions

Conceptualization, Y.L. (Yuefeng Lu); Data curation, J.L., Y.S., Y.L. (Yanru Liu), and K.Y.; Methodology, Y.L. (Yuefeng Lu) and J.L.; Project administration, Y.L. (Yuefeng Lu) and X.L.; Supervision, Y.L. (Yuefeng Lu) and X.L.; Writing—original draft, J.L. and R.W.; Writing—review and editing, Y.L. (Yuefeng Lu), X.L. and R.W. All authors have read and agreed to the published version of the manuscript.

Funding

This research was funded by the Major Project of High Resolution Earth Observation System of China (No. GFZX0404130304); the Open Fund of Hunan Provincial Key Laboratory of Geo-Information Engineering in Surveying, Mapping and Remote Sensing, Hunan University of Science and Technology (No. E22201); a grant from State Key Laboratory of Resources and Environmental Information System; and the Innovation Capability Improvement Project of Scientific and Technological Small and Medium-sized Enterprises in Shandong Province of China (No. 2021TSGC1056).

Institutional Review Board Statement

Not applicable.

Informed Consent Statement

Not applicable.

Data Availability Statement

Restrictions apply to the availability of these data. Data were obtained from a third party and are available from the authors with the permission of the third party. For the third parties, see acknowledgments.

Acknowledgments

The authors thank the providers of the data used in this article, including the Geospatial Data Cloud (http://www.gscloud.cn/, accessed on 23 April 2022); land use data was derived from the resource and environmental science data platform of the Chinese Academy of Sciences (http://www.resdc.cn, accessed on 4 May 2022); precipitation data were obtained from the annual value of China meteorological data network data set (http://data.cma.cn/data/, accessed on 7 May 2022); NDVI data were obtained from the National Ecological Science Data Center (http://www.nesdc.org.cn, accessed on 18 May 2022); population density data were obtained from WorldPop (http://www.worldpop.org, accessed on 21 May 2022); GDP raster data were obtained from the geographic remote sensing ecological network (http://www.gisrs.cn, accessed on 3 June 2022); socio-economic data were obtained from the Shandong Statistical Yearbook, with the Yellow River beach area being involved in the 25 county statistical yearbook.

Conflicts of Interest

The authors declare no conflict of interest.

References

  1. Guo, H.; Ren, B. Spatial governance of high-quality development in the Yellow River Basin: Mechanism interpretation and realistic strategy. Reform 2020, 4, 74–85. [Google Scholar]
  2. Wang, J.; Liu, J.; Song, Z.; Huang, L.; Fang, Y.; Li, Z. Ecological protection and land space utilization strategies for high-quality development in the Yellow River Basin. J. Nat. Resour. 2022, 37, 2930–2945. [Google Scholar]
  3. Wang, T.; Xu, Z.; Kong, K.; Zhao, Z.; Zhang, L.; Qi, Z. Countermeasures for sustainable development of Yellow River beach area in Shandong. China Water Conserv. 2016, 10, 15–17. [Google Scholar]
  4. The theoretical study group of the Ministry of Water Resources studied and discussed the important speech of General Secretary Xi Jinping at the symposium on promoting the ecological protection and high-quality development of the Yellow River Basin. China Water Resour. 2021, 21, 5.
  5. Zuo, Q. Key issues of floodplain management in the lower reaches of the Yellow River and construction of collaborative governance system. Technol. Bull. 2020, 38, 23–32. [Google Scholar]
  6. Zhang, J. Reconstruction and ecological management of the lower reaches of the Yellow River. People’s Yellow River 2017, 39, 24–27+33. [Google Scholar]
  7. Tian, Y.; Sun, Y.; Li, Y.; Ma, J. Research on the direction of floodplain management in the lower reaches of the Yellow River in the new period. People’s Yellow River 2019, 41, 16–20+35. [Google Scholar]
  8. Geng, M.; Yao, X. Discussion on ecological protection and high-quality development of wide channel in the lower Yellow River. Water Conserv. Constr. Manag. 2019, 39, 6–11+84. [Google Scholar]
  9. Zhang, H.; Li, Z.; An, Z.; Fang, H.; Huang, H.; Dai, W. Trends and progress of research on river channel and beach area governance in the lower reaches of the Yellow River. Yellow River 2016, 38, 1–10+23. [Google Scholar]
  10. Teng, X.; Wu, Q.; Huang, S. Study on the application of compensation policy in the lower reaches of the Yellow River. People’s Yellow River 2012, 34, 10–11+14. [Google Scholar]
  11. Li, G. Theory and practice of temporal air conditioning of water and sand in the middle and lower reaches of the Yellow River. J. Hydraul. Eng. 2004, 8, 1–7. [Google Scholar]
  12. Zhang, X.; He, N. Comprehensive safety evaluation of embankment project in the lower reaches of the Yellow River. J. Hydraul. Eng. 2007, S1, 135–140+154. [Google Scholar]
  13. Wang, Z.; Xia, J.; Zhou, M.; Deng, S.; Li, T. Modelling hyperconcentrated floods in the Middle Yellow River using an improved river network model. Catena 2020, 190, 104544. [Google Scholar] [CrossRef]
  14. Song, J.; Hou, C.; Liu, Q.; Wu, X.; Wang, Y.; Yi, Y. Spatial and temporal variations in the plankton community because of water and sediment regulation in the lower reaches of Yellow River. J. Clean. Prod. 2020, 261, 120972. [Google Scholar] [CrossRef]
  15. Zhang, J.; Liu, S.; Storm, C.; Zhang, R. Ecological governance model and effect evaluation of the lower Yellow River beach area- “Research on ecological regeneration and governance in the lower Yellow River beach area” No.5. People’s Yellow River 2018, 40, 1–4+33. [Google Scholar]
  16. Yellow River Water Conservancy Commission, Ministry of Water Resources. Expert Forum on Lower Yellow River Management Strategy; Yellow River Water Conservancy Publishing House: Zhengzhou, China, 2004.
  17. Jiang, E. Research on Flood Detention and Sediment Deposition Function and Floodplain Disaster Reduction Technology in the Wide Beach Area of the Lower Yellow River; Yellow River Water Conservancy Commission Yellow River Water Conservancy Science Research Institute: Kaifeng, China, 2016. [Google Scholar]
  18. Yue, Y.; Wang, H.; Jiang, E.; Peng, X.; Shi, F. Sustainable development model of natural-economic-social coordination in floodplain. J. Water Resour. 2020, 51, 1131–1137+1148. [Google Scholar]
  19. Strong, O.; Cui, Y. Research on comprehensive management and high-quality management and protection of the Yellow River beach area. China’s Land Resour. Econ. 2020, 33, 39–43. [Google Scholar]
  20. Zhao, L.; Han, S.; Xiao, Q.; Wang, T. The effect of water and sediment regulation in the Yellow River and the idea of comprehensive management of downstream beaches in the future. Sediment Res. 2022, 47, 51–56. [Google Scholar]
  21. Jiang, L.; Bai, L.; Wu, Y. An Analysis of the Coordination of Provincial Economy, Resources and Environment in China—Also on the Coupling Formula of Three Systems and Its Extended Form. Nat. Resour. J. 2017, 32, 788–799. [Google Scholar]
  22. Han, S.; Tan, G.; Zhao, L.; Fu, X.; Wang, J. Analysis of the change of sediment situation in the Yellow River. Rural. Water Conserv. Hydropower China 2022, 2, 1–5+19. [Google Scholar]
  23. Wang, Q.; Zhai, L. Analysis on flood control improvement project of old village platform in Yellow River beach area of Shandong Province. Water Conserv. Plan. Des. 2019, 7, 103–105. [Google Scholar]
  24. Dong, C. Interpreting ‘Relocation Planning of Residents in Yellow River Beach Area of Shandong Province’-New Life of 600,000 People. Qilu Weekly, 1 September 1999. [Google Scholar]
  25. Wang, L.; Jiao, L.; Lai, F.; Zhang, N. Evaluation of ecological changes in the wetlands of Manas Lake, Xinjiang based on remote sensing ecological index. J. Ecol. 2019, 39, 2963–2972. [Google Scholar]
  26. Liu, S.; Zhang, F.; Zhao, X.; Huang, J.; Gao, P. Improvement of remote sensing ecological index for oases in arid areas. Surv. Mapp. Sci. 2022, 47, 143–151+203. [Google Scholar]
  27. He, L.; Du, Q.; Cui, L.; Guan, L.; Guo, S.; Jiang, L. Evaluation of ecological environment quality in Tarim Reclamation Area based on remote sensing ecological index. Hunan J. Ecol. Sci. 2022, 9, 27–33. [Google Scholar]
  28. Ke, L.; Xu, J.; Wang, N.; Hou, J.; Han, X.; Yin, S. Evaluation of ecological quality changes in coastal wetlands based on remote sensing ecological indices: An example from the northern part of Liaodong Bay. J. Ecol. Environ. 2022, 31, 1417–1424. [Google Scholar]
  29. Qin, Z.; Li, W.; Xu, B.; Chen, Z.; Liu, J. Estimation of surface specific emissivity in the TM6 band range of terrestrial satellites. Remote Sens. Land Resour. 2004, 3, 28–32+36–41+74. [Google Scholar]
  30. Zhang, Y.; She, J.; Long, X.; Zhang, M. Spatio-temporal evolution and driving factors of eco-environmental quality based on RSEI in Chang-Zhu-Tan metropolitan circle, central China. Ecol. Indic. 2022, 144, 109436. [Google Scholar] [CrossRef]
  31. Cheng, P.; Huang, Y. Flood risk assessment of Nanchang City based on AHP-entropy weight method. People’s Yangtze River 2021, 52, 18–25. [Google Scholar]
  32. Zhou, Y.; Dong, M.; Liu, W.; Li, H. Dynamic risk assessment of flood disaster in Minjiang River Basin based on GIS. People’s Yangtze River 2022, 53, 20–27. [Google Scholar]
  33. Fan, H.; Lu, Y.; Hu, Y.; Fang, J.; Lv, C.; Xu, C.; Liu, Y. A landslide susceptibility evaluation of highway disasters based on the frequency ratio coupling model. Sustainability 2022, 14, 7740. [Google Scholar] [CrossRef]
  34. Weiss, D.J.; Nelson, A.; Gibson, H.S.; Temperley, W.; Peedell, S.; Lieber, A.; Hancher, M.; Poyart, E.; Belchior, S.; Fullman, N.; et al. A global map of travel time to cities to assess inequalities in accessibility in 2015. Nature 2018, 553, 333–336. [Google Scholar] [CrossRef] [PubMed]
  35. Wan, S.; Fan, Z.; Deng, S.; Bian, A. Study on the accessibility of park green space in the main urban area of Zhangzhou based on network analysis. Jiangxi Sci. 2022, 40, 965–970+1040. [Google Scholar]
  36. Guo, C.; Zhu, Y.; Sun, W.; Song, J. China 1km Bioabundance Index Dataset. J. Glob. Change Data 2017, 1, 60–65+183–188. [Google Scholar]
  37. Ji, J.; Wang, S.; Zhou, Y. Spatiotemporal Change and Coordinated Development Analysis of “Population-Society-Economy-Resource-Ecology-Environment” in the Jing-Jin-Ji Urban Agglomeration from 2000 to 2015. Sustainability 2021, 13, 4075. [Google Scholar] [CrossRef]
  38. Wang, Y.; Wang, R.; Jia, Y. Sustainability evaluation of plain rural ecological space based on SDGs-Taking Heishan County, Liaoning Province as an example. Garden 2022, 39, 4–12. [Google Scholar]
  39. Diakoulaki, D.; Mavrotas, G.; Papayannakis, L. Determining objective weights in multiple criteria problems: The critic method. Comput. Oper. Res. 1995, 22, 763–770. [Google Scholar] [CrossRef]
  40. Fan, W.; Chen, B.; Li, Q. Evaluation of new development pattern construction in each province-coupling coordination degree model based on improved CRITIC-entropy method combined weight. China Bus. Rev. 2023, 4, 37–41. [Google Scholar]
  41. Gao, H.; Zhang, H. Study on coordination and quantification of ecological protection and high quality development in the Yellow River Basin. IOP Conf. Ser. Earth Environ. Sci. 2021, 647, 012168. [Google Scholar]
  42. Zhang, Y.; Qu, J.; Wang, Q.; Li, D. Global autocorrelation analysis of landscape pattern combined with evenness theory and Moran’s I index and generalized G index. Mapp. Bull. 2018, 11, 36–39. [Google Scholar]
  43. Li, Z.; Wang, R.; Shen, X. Cultivated land protection zoning based on quality index and spatial autocorrelation analysis. Soil Bull. 2021, 52, 785–792. [Google Scholar]
  44. Chu-Agor, M.L.; Muñoz-Carpena, R.; Kiker, G.; Emanuelsson, A.; Linkov, I. Exploring vulnerability of coastal habitats to sea level rise through global sensitivity and uncertainty analyses. Environ. Model. Softw. 2011, 26, 593–604. [Google Scholar] [CrossRef]
  45. Servadio, J.L.; Convertino, M. Optimal information networks: Application for data-driven integrated health in populations. Sci. Adv. 2018, 4, e1701088. [Google Scholar] [CrossRef] [Green Version]
  46. He, W.; Yang, H. EFAST method for global sensitivity analysis of model parameters. Remote Sens. Technol. Appl. 2013, 28, 836–843. [Google Scholar]
  47. Jiao, J.; Li, J.; Bai, Y. Uncertainty analysis in the life cycle assessment of cassava ethanol in China. J. Clean. Prod. 2019, 206, 438–451. [Google Scholar] [CrossRef]
Figure 1. The location and scope of the study area.
Sustainability 15 06086 g001
Figure 2. (a) Distribution diagram of RSEI in 2009; (b) Distribution diagram of RSEI in 2019.
Sustainability 15 06086 g002aSustainability 15 06086 g002b
Figure 3. (a) DEM; (b) Precipitation distribution in 2009; (c) Precipitation distribution in 2019; (d) Flood risk intensity distribution in 2009; (e) Flood risk intensity distribution in 2019.
Sustainability 15 06086 g003
Figure 4. (a) Distribution diagram of accessibility indicators in 2009; (b) Distribution diagram of accessibility indicators in 2019.
Sustainability 15 06086 g004
Figure 5. (a) Land use status map in 2009; (b) Land use status map in 2019; (c) Distribution of biological abundance index in 2009; (d) Distribution of biological abundance index in 2019.
Sustainability 15 06086 g005
Figure 6. Development index of each subsystem in the Yellow River beach area of each city in 2009 and 2019.
Sustainability 15 06086 g006
Figure 7. (a) Radar map of the overall harmony of the Yellow River beach area in each city; (b) Box line diagram of harmony change in the Yellow River beach area of each city.
Sustainability 15 06086 g007
Figure 8. Spatial distribution map of coupling and coordination of the Yellow River beach area in each city in 2009 and 2019.
Sustainability 15 06086 g008
Figure 9. (a) Moran’s I scatter plot in 2009; (b) Moran’s I scatter plot in 2019.
Sustainability 15 06086 g009
Figure 10. (a) LISA cluster diagram in 2009; (b) LISA cluster diagram in 2019.
Sustainability 15 06086 g010
Figure 11. (a) LISA significance diagram in 2009; (b) LISA significance diagram in 2019.
Sustainability 15 06086 g011
Figure 12. (a) Sensitivity index in 2009; (b) Sensitivity index in 2019.
Sustainability 15 06086 g012
Figure 13. (a) Monte Carlo simulation results frequency diagram in 2009; (b) Monte Carlo simulation results frequency diagram in 2019.
Sustainability 15 06086 g013
Table 1. Data summary table of the beach area.
Data TypeDataTimeData Format
Remote Sensing Image MapLandsat5 TM2009Raster
Landsat8 OLI2019Raster
Geospatial dataLand use data2009, 2019Raster
Precipitation data2009, 2019Raster
CO2 Emissions2009, 2019Raster
NDVI2009, 2019Raster
GDP raster data2009, 2019Raster
Population density data2009, 2019Raster
Vector data2009, 2019Vector
Social statisticsShandong Provincial Statistical Yearbookdatadata
Statistical Yearbook for the 25 counties covered by the Yellow River Tractdatadata
Statistical bulletin on the development of citiesdatadata
Table 2. Index system of ecological protection and high-quality development in the Yellow River beach area.
Target LevelGuideline LevelIndex LayerCharacteristicCRITIC WeightsEntropy Method WeightsCombined Weights
High quality developmentLevel of economic developmentBeach GDP (X1)+0.05070.07240.0616
Grain production (X2)+0.06760.06030.0640
Disposable income (X3)+0.05890.06790.0634
Social securityEmployment rate (X4)+0.05770.06830.0630
Population density (X5)-0.05470.05630.0555
Accessibility (X6)+0.04410.05770.0509
Level of poverty (X7)-0.05410.06160.0579
Education level (X8)+0.05250.06260.0576
Flood control constructionRate of river and dam construction (X9)+0.03760.02780.0327
Out-migration resettlement rate (X10)+0.04980.03990.0449
Local and local village platform rate (X11)+0.03520.02780.0315
Old Village Terrace renovation and upgrading rate (X12)+0.04620.04060.0434
Evacuation road construction rate (X13)+0.02570.02100.0335
Ecological protectionEcological qualityVegetation cover (X14)+0.05430.06560.0600
Flood risk intensity (X15)-0.07310.05910.0661
CO2 Emissions (X16)-0.07470.04320.0590
Beach area (X17)-0.03930.04700.0432
Index of biological abundance (X18)+0.05460.06260.0586
Ecological Condition Index (X19)+0.06920.05830.0638
Table 3. Hierarchy of harmonious development levels.
Harmony Development Level RatingEESF Value Range
No Harmony Level0
Low Harmony Level 0 < E E S F < 0 . 2
Sub-low Harmony Level 0.2 E E S F < 0 . 4
Medium Harmony Level 0.4 E E S F < 0 . 6
Sub-high level of harmony 0.6 E E S F < 0 . 8
High level of harmony 0.8 E E S F < 1.0
Ideal state1
Table 4. Grading criteria for the coupling coordination degree of ecological protection systems and high-quality development.
Coupling Coordination LevelRange of Coupling Coordination
Severe disorder stage 0 D < 0.2
Moderate disorder stage 0.2 D < 0.4
Approaching the disorder stage 0.4 D < 0.5
Basic coordination phase 0.5 D < 0.6
Moderate coordination phase 0.6 D < 0.8
Highly coordinated phase 0.8 D 1
Table 5. The coupling and coordination degree of the overall Yellow River beach area and the Yellow River beach area of various cities in 2009 and 2019.
Region2009 Coordinated Coupling2019 Coordination CouplingDegree of Annual Variation in Coupling Coordination
Shandong Province Yellow River Beach Area0.3440.5806.49%
Heze City0.4540.7366.22%
Jining City0.2860.5427.73%
Tai’an City0.2520.51110.32%
Liaocheng City0.2720.4034.82%
Dezhou City0.2780.4154.93%
Jinan City0.5040.7915.69%
Zibo City0.2780.56610.33%
Binzhou City0.3480.6087.46%
Dongying City0.4260.6465.16%
Table 6. Monte Carlo simulation results parameter table.
Parameter20092019
Mean0.3550.556
Variance0.00120.0019
Standard deviation0.0340.044
Coefficient of variation9.58%7.91%
Skewness0.0780.049
Kurtosis−0.288−0.297
Tchebycheff test0.00120.0013
T test0.00040.0004
Disclaimer/Publisher’s Note: The statements, opinions and data contained in all publications are solely those of the individual author(s) and contributor(s) and not of MDPI and/or the editor(s). MDPI and/or the editor(s) disclaim responsibility for any injury to people or property resulting from any ideas, methods, instructions or products referred to in the content.

