


Recovery Assessment of Permanent Housing after the 2004 Tsunami in Thailand toward Sustainable Planning
by

Daroonwan Kamthonkiat
1,*,
Thanawan Leelawatthanaphong
2,
Kessinee Unapumnuk
3 and
Tuong Thuy Vu
4 1
Department of Geography, Faculty of Liberal Arts, Thammasat University, Rangsit Campus, Klong Luang 12120, Pathumthani, Thailand
2
Small and Medium Enterprise Development Bank of Thailand, 310 SME Bank Tower Phahonyothin Rd., Phayathai, Bangkok 10400, Thailand
3
Pollution Control Department, Ministry of Natural Resources and Environment, 92 Soi Phoholyothin 7, Phayathai, Bangkok 10400, Thailand
4
Faculty of Engineering and Science, Curtin University Malaysia, CDT 250, Miri Sarawak 98009, Malaysia
*
Author to whom correspondence should be addressed.
Sustainability 2023, 15(5), 4627; https://doi.org/10.3390/su15054627
Submission received: 31 January 2023
/
Revised: 1 March 2023
/
Accepted: 3 March 2023
/
Published: 5 March 2023
(This article belongs to the Special Issue Applications of GIS and Remote Sensing for Sustainable Spatial Planning)
Abstract
:In this study, a recovery assessment of the permanent housing and living conditions in the aftermath of the 2004 Tsunami in Phang-nga Province, Thailand, was conducted using geoinformatics technologies, field observations, and living-related parameters from basic minimum need (BMN) data retrieved from the Ministry of Interior. In the results, 29 permanent housing projects were mapped, classified into five sizes (very small, small, medium, large, and very large), and overlaid with the tsunami-inundated zone visually interpreted from satellite images. Thirteen out of twenty-nine projects were reconstructed in the inundation zone (in situ), while the rest were relocated to higher ground. Permanent houses were rebuilt in 18 communities in three patterns: single-story or one-story houses (511 houses), single-story and raised-basement houses (58 houses), and two-story houses (712 houses). The selected BMN’s living-related parameters, such as sufficient water for household consumption (dimension: dwelling), employment of people between 15 and 60 years old (dimension: economy), and participation in communities’ activities (dimension: participation), which covered 2002–2015 at the community-based level, were compared annually to its criterion and indicated as passing or not passing the standard. The reconstructed communities recovered (passing the requirements) within four years of transferring to the reconstructed houses.
1. Introduction
In the past 20 years, significant tsunamis triggered by earthquakes and volcanic activities (volcanic eruptions, undersea quakes, and landslides) have led to the loss of lives and extensive damage to property in many places around the world. In addition to the Indian Ocean Tsunami that occurred in 2004 (called “the 2004 Tsunami” in this study), examples include Samoa, American Samoa, and Tonga in 2009; Chile, Haiti, and Sumatra, Indonesia, in 2010; Tohoku, Japan, in 2011, Sunda Strait and Sulawesi, Indonesia, in 2018; and Tonga in 2022 [1,2,3]. In the aftermath of these tsunamis, many guidebooks for disaster recovery were developed or revised by disaster-related organizations, such as Lessons Learned from Tsunami Recovery: Key Propositions for Building Back Better [4]; After the Tsunami: Sustainable Building Guidelines for South-East Asia [5]; Safer Homes, Stronger Communities: A Handbook for Reconstruction After Natural Disasters [6]; Sendai Framework for Disaster Risk Reduction 2015–2030 [7]; Disaster Recovery Framework Guide: Revised Version March 2020 [8]; Planning Considerations: Disaster Housing: Guidance for State, Local, Tribal and Territorial Partners [9]; etc. Most of the guidebooks provide key planning and decision-making processes for developing recovery policies and programs applicable to various types of disasters. The detailed frameworks or parameters of disaster recovery, especially permanent housing reconstruction, in those guidebooks vary, depending on the experiences from previous cases in different impacted areas. There is no framework or set of practical indicators to fit with all affected areas, as each community has a unique context [10,11,12,13,14]. Consequently, monitoring and measuring successive or non-successive tasks in the housing-reconstruction processes conducted in disaster-impacted areas would result in lessons that can be learned by all related authorities, so that they can better handle their active and future cases [15,16,17,18,19,20,21,22,23].
Based on the aforementioned guidebooks and related studies, permanent housing reconstruction as a part of the long-term recovery process involves many factors, cultural, economic, environmental, and political, as well as the social characteristics of an impacted area. Thus, recovery outcomes are not easily measured. The data used for measuring include volunteered geographic information (VGI), ground surveys and observations, social audits, household surveys, official publications and statistics, insurance data, and satellite imagery analyses [10]. A geographical information system (GIS) was mentioned in the handbook of the Federal Emergency Management Agency (FEMA) as a supportive technology for analyzing hazard-prone areas and for identifying safe or risk zones and is a crucial technique for housing recovery [9]. In addition, indicators (related data available in a consistent form and at constant levels of reliability across jurisdictions and time frames) should be used together with other forms of qualitative and quantitative information to develop better understandings of recovery outcomes, trajectories, and processes [24]. Many more case studies from various tsunami-impacted locations, using different tools and recovery access parameters still need to be learned by disaster-related authorities to develop the best practical and sustainable solutions for their projects.
Geoinformatics technology consisting of Geographic Information System (GIS), Remote Sensing (RS), Global navigation satellite system (GNSS), and including Database Management System (DBMS) or information technology, etc., have been applied broadly in disaster research for many aspects of disaster-related studies. For disaster management, this group of technologies plays essential roles in early warning, monitoring, risk modeling, etc., in the pre-disaster stage. After that, the developed studies or systems are valuable for public warning, emergency operations, evacuation, and rescue planning in the disaster stage. In the aftermath of a disaster, geoinformatics technology is powerful for damage mapping or assessment, temporary shelters, permanent housing reconstruction, and other tasks related to recovery planning in the disaster-impacted area [25,26,27,28]. Although some disaster handbooks or related studies have mentioned geoinformatics technologies for practical usage of the permanent housing recovery issues, a link with parameters to measure the success at community level has been limited.
In this study, we aim to map the permanent housing reconstruction in Phang-nga Province, Thailand, which had the highest loss of human life and a massive impact on its local residences after the 2004 Tsunami, using geoinformatics. The second objective is to measure the recovery level of the reconstructed communities using parameters related to living conditions (quality of life). These parameters are collected annually under the cooperation between some representatives from the targeted communities and government officers. An analysis of the recovery levels is presented in maps that are linked to the created geospatial data. Consequently, the question of “how long should the tsunami victims be settled or reach the standard of living after transferring to permanent houses or into the reconstructed communities?” is answered based on our observed parameters. In succession, this case study presents guidelines or lessons for policymakers and disaster planning project managers, especially those who are engaged in post-disaster reconstruction programs in tsunami- or flood-prone areas, to move toward sustainable recovery planning.
2. Materials and Methods
Materials used in this study consist of software, hardware, and data, as listed in Table 1.
The BMN or family profile data are collected annually by a co-operative committee between the representatives of the community and government, hosted by the Ministry of Interior, Thailand. The authorized committee and data collectors were trained to use questionnaires and interviews to record information from every family without bias. The data-collection process starts at the beginning of each year and finishes before the end of the year. BMN data present the status of households in various dimensions, such as health, dwelling, education, economy, and participation. Each dimension consists of related parameters measuring whether or not the interviewed households in each community have reached the basic minimum need or criterion. A result of passing or not passing indicates the living conditions (quality of life) of each household and community (summarized from the results of every household in the community) under the measured dimension. Therefore, BMN data play an important role as supportive information, indicator, goal, and procedure for the Thai government in prioritizing their budget for improving living quality in places where the parameters of BMN present are lower than the criteria [29].
Measuring the recovery success in this study was focused on the community level using parameters from three dimensions of BMN.
- -
- Sufficient water for household consumption (dimension: dwelling): an essential parameter for living that indicates the water available for household consumption in a year. At least 95% of households in the community should have enough water to consume in a year thoroughly (at least 45 L/day/person). Otherwise, the community is indicated as not passing the basic minimum need or standard of this parameter.
- -
- Employment of people between 15 and 60 years old (dimension: economy): a parameter that indicates the employment situation of people at labor age (between 15 and 60 years) in the community. At least 95% of people between 15 and 60 years old are fully employed.
- -
- Participation in the community’s activities (dimension: participation): a parameter that indicates the unity or cooperative level of members in the community. Since 100% of households should participate in community activities, this parameter is used to imply the level of cooperation or relationship between former and newly settled villagers (mixing between non-impacted and tsunami-impacted people). With strong participation, good relationships, or low-conflict communities, the rate of leaving or abandoning houses should, therefore, be less.
The living conditions of the targeted communities between the before and after of the 2004 Tsunami were compared, using long-term BMN data during 2002–2015 at community level. For example, the targeted community had not passed the criteria before facing the 2004 Tsunami. In that case, it is not implied that the failing behind the event was absolutely affected by the tsunami. Data after 2015 were not included in this study because they were more than a decade away from the 2004 Tsunami and were not significantly affected by this event. It should be noted that the BMN data for 2004 were collected before the 2004 Tsunami occurred in the last week of December. Thus, the data did not indicate any effects from this event.
Figure 1 presents the methodological framework of this study. Geospatial data were created by integrating geoinformatics technologies and field surveys (objective 1). Consequently, the selected parameters of BMN data during 2002–2015 were summarized as the level of recoveries and organized as database files. These are linked with the spatial data of the reconstructed communities (objective 2).
From 2005 to 2019, field observations were taken five times (2005, 2008, 2010, 2015, and 2019) in Takua Pa District, Khura Buri District, and Thai Muang District, where the permanent housing projects of Phang-nga Province were located. In this study, reconstruction sites with fewer than five houses, partial renovations, and unclear donor information or source of funding were omitted. At least 80% of the permanent houses for the 2004 Tsunami-impacted residents in Phang-nga were observed and mapped. The spatial information of each permanent housing project and impacted communities, such as geographic locations and extent of housing projects (captured by handheld GPS), were mapped. Additional supportive non-spatial information for sustainable planning and management, name of the permanent housing project, source of financial support (only major donors), number of houses/units (size of the project), patterns of houses, not-to-scale drawings of the layout of houses, and other related information were also assembled. Number of houses or sizes of the reconstruction projects, especially in the relocated projects, and its effect on the sufficiency of infrastructure and the participation of residents in the community’s activities were considered. The patterns and layout of housing affected residents’ satisfaction and how suitable it was for their living nature.
Subsequently, ASTER data acquired within a week after the 2004 Tsunami was visually interpreted to extract the tsunami-inundated zone along the west coast of Khura Buri District, Thai Muang District, and Takua Pa District. The interpreted result was validated using information on the flooded height and impacted communities from the Department of Disaster Prevention and Mitigation (DDPM), Ministry of Interior. The interpreted accuracy was higher than 70% and was overlaid with the permanent housing projects classified by size. The projects with a risk of flooding from tsunami waves that may have an unexpected recurrence were identified. This is crucial information for disaster planning.
Parameters from three dimensions of BMN, dwelling or living (sufficient water for household consumption), economic (employment of people between 15 and 60 years old), and social (participation of household members in the community’s activities), were selected. They were considered as a tool for measuring the recovery levels of the reconstructed communities. The long-term BMN data covering before and after the 2004 Tsunami (2002–2015) were analyzed in three periods: pre-tsunami during 2002–2004; the resettlement period in this study covering 2005–2008; the post-resettlement period during 2009–2015, subsequently linked to the geospatial data in a GIS. The recovery assessment using three parameters during the resettlement period was presented on maps to better understand the recovery situations in the study area. Finally, the recovery period in the reconstructed communities after the permanent housing transfer is estimated.
3. Results
The notable tsunami on 26 December 2004 caused by two strong earthquakes (9.3 and 7.3 on the Richter scale) near Sumatra, Indonesia, swept the Andaman Coast in southern Thailand, countries along the Andaman Coast, and some African countries, killing nearly 230,000 people. It was the first catastrophic tsunami that Thai people had ever experienced. After the disaster, permanent houses in Phang-nga Province were reconstructed with various sources of funding/donors and by construction teams from the government, volunteers, and the private sector. The pattern of the houses, size of the reconstruction projects, locations, facilities, etc., were decided by the donors, construction teams, and government administrators based on the budgets, number of targeted families, and limited time frame. However, many projects were extended due to insufficient workers, building materials, other resources, etc. Therefore, the resettlement period in Phang-nga lasted from 2005 to 2008. Many families stayed in temporary houses or shelters for a few years after the tsunami. Based on our field observations and analysis of the BMN data, the results from this study consist of two parts: (1) geospatial data of the permanent housing reconstruction and (2) long-term recovery measurement of the reconstructed communities in Phang-nga Province. The study results are presented in the following subsections.
3.1. Geospatial Data of Permanent Housing Reconstruction
The created geospatial data of the permanent housing projects that were reconstructed in the study area and the patterns of houses are listed and presented in Section 3.1.1, and the sizes and locations of houses are summarized in Section 3.1.2.
3.1.1. Permanent Housing Projects and Patterns of Houses
Based on our surveys, 29 projects were reconstructed in three districts of Phang-nga; 20 projects with 1115 houses in Takua Pa District; six projects with 440 houses in Khura Buri District; and three projects with 119 houses in Thai Muang District. The reconstructed areas covered 65 ha (around 647,000 square meters) in 18 communities/villages; 12 in Takua Pa District; four in Khura Buri District; and two in Thai Muang District. The name of each housing project and the number of houses were recorded as listed in Table 2.
In this study, the created geospatial data were integrated with the locations of the permanent housing reconstruction projects, patterns of houses, not-to-scale layouts, and basic information about the projects. The patterns of permanent houses reconstructed for the 2004 Tsunami victims in Phang-nga Province were categorized into three primary styles: single-story or one-story houses, single-story and raised-basement houses, and two-story houses.
- Single-Story or One-Story House
There were 511 one-story houses reconstructed in 12 projects: 125 units under five projects (Tub Tawan 1, Ruamsuk Tawee Sup Munkong, Lam Prakarang, Muang Mai, and Town House Ban Thung Ong) were reconstructed in the exact same locations, while 386 units under seven projects (Pui Pornthip, Krung Sri Bang–Pun In-see, Kachad-Pru Teow, Por Tek Tueng, Ruam Mue Ruam Jai, Ruam Jai–Surat Thani, and Thepparat) were built in new locations. Some patterns of the one-story house are presented in Figure 2.
Figure 3 presents the patterns of one-story houses and the layout reconstructed for the project, namely, Tub Tawan 1.
- Single-Story and Raised-Basement House
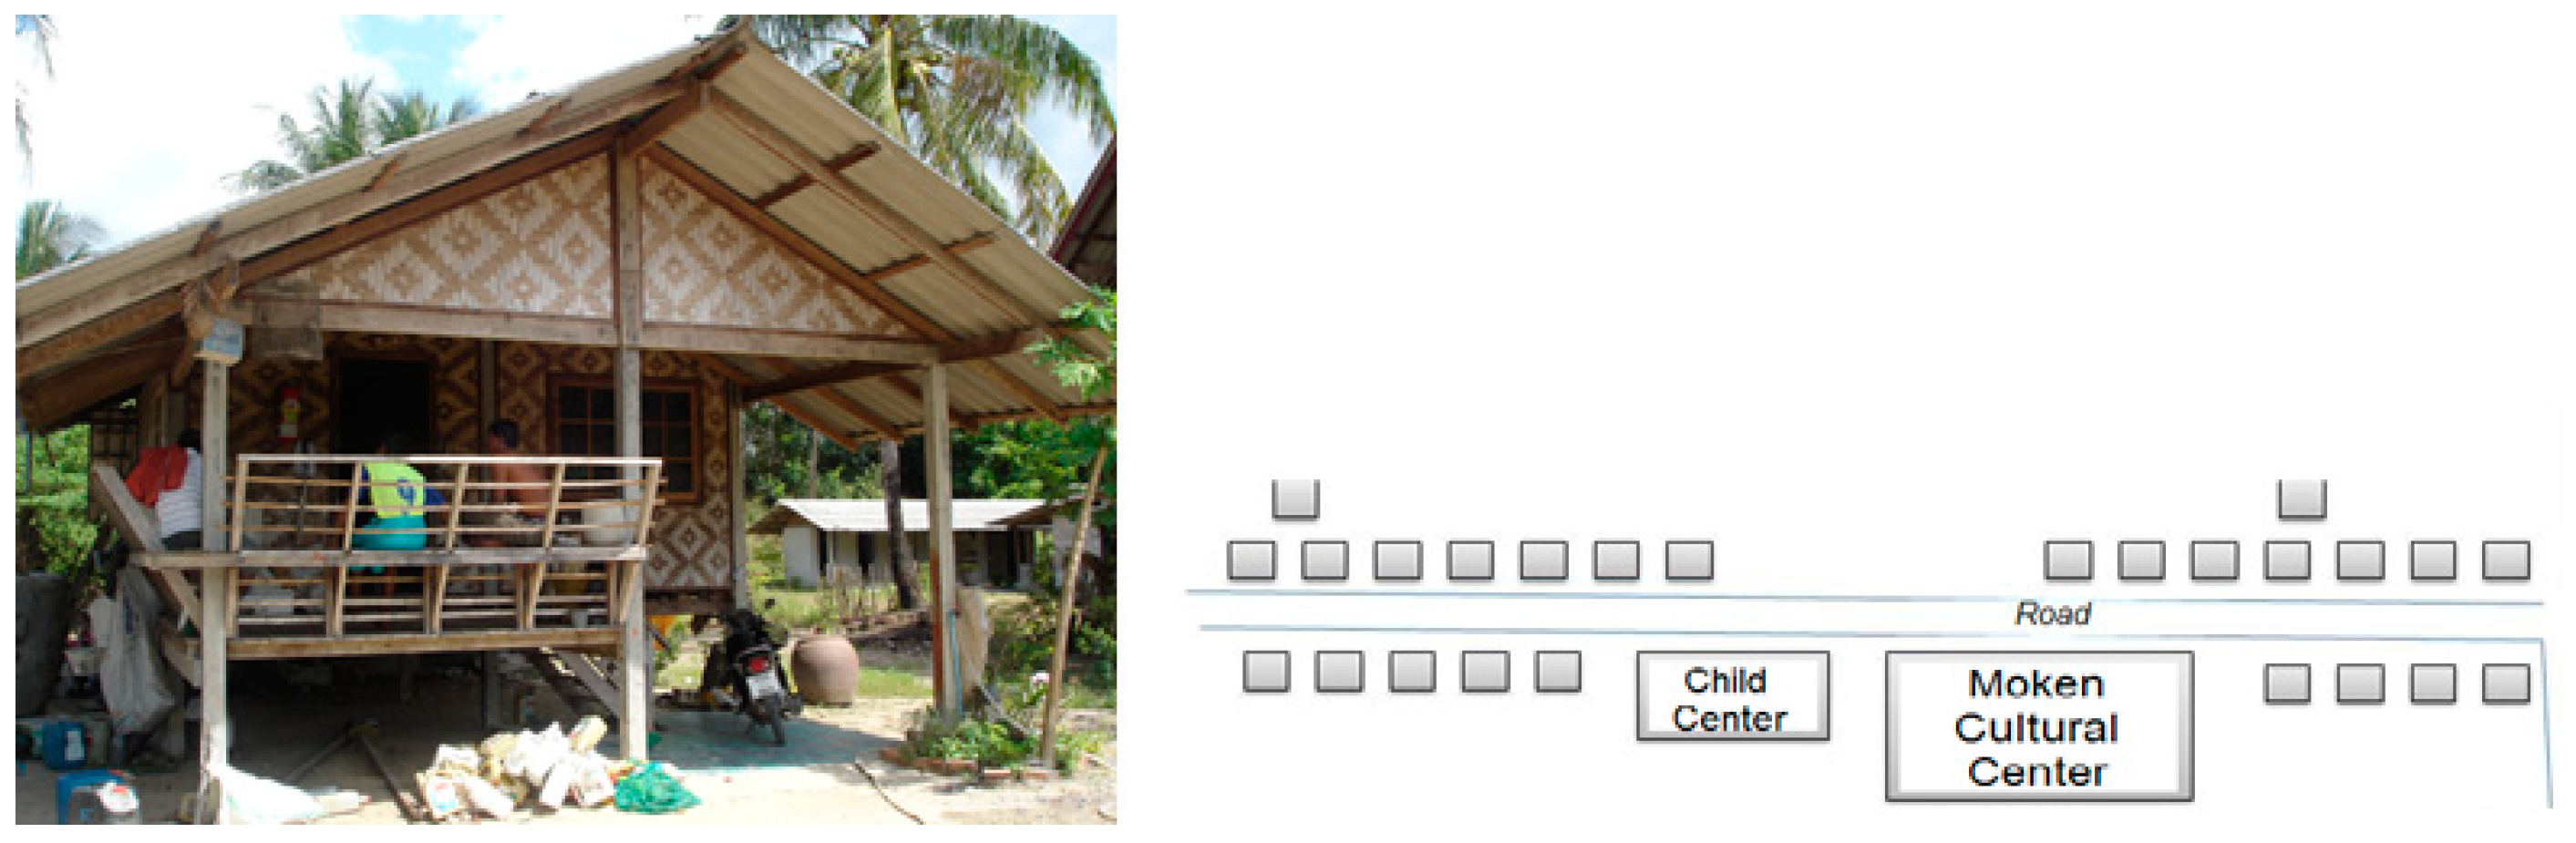
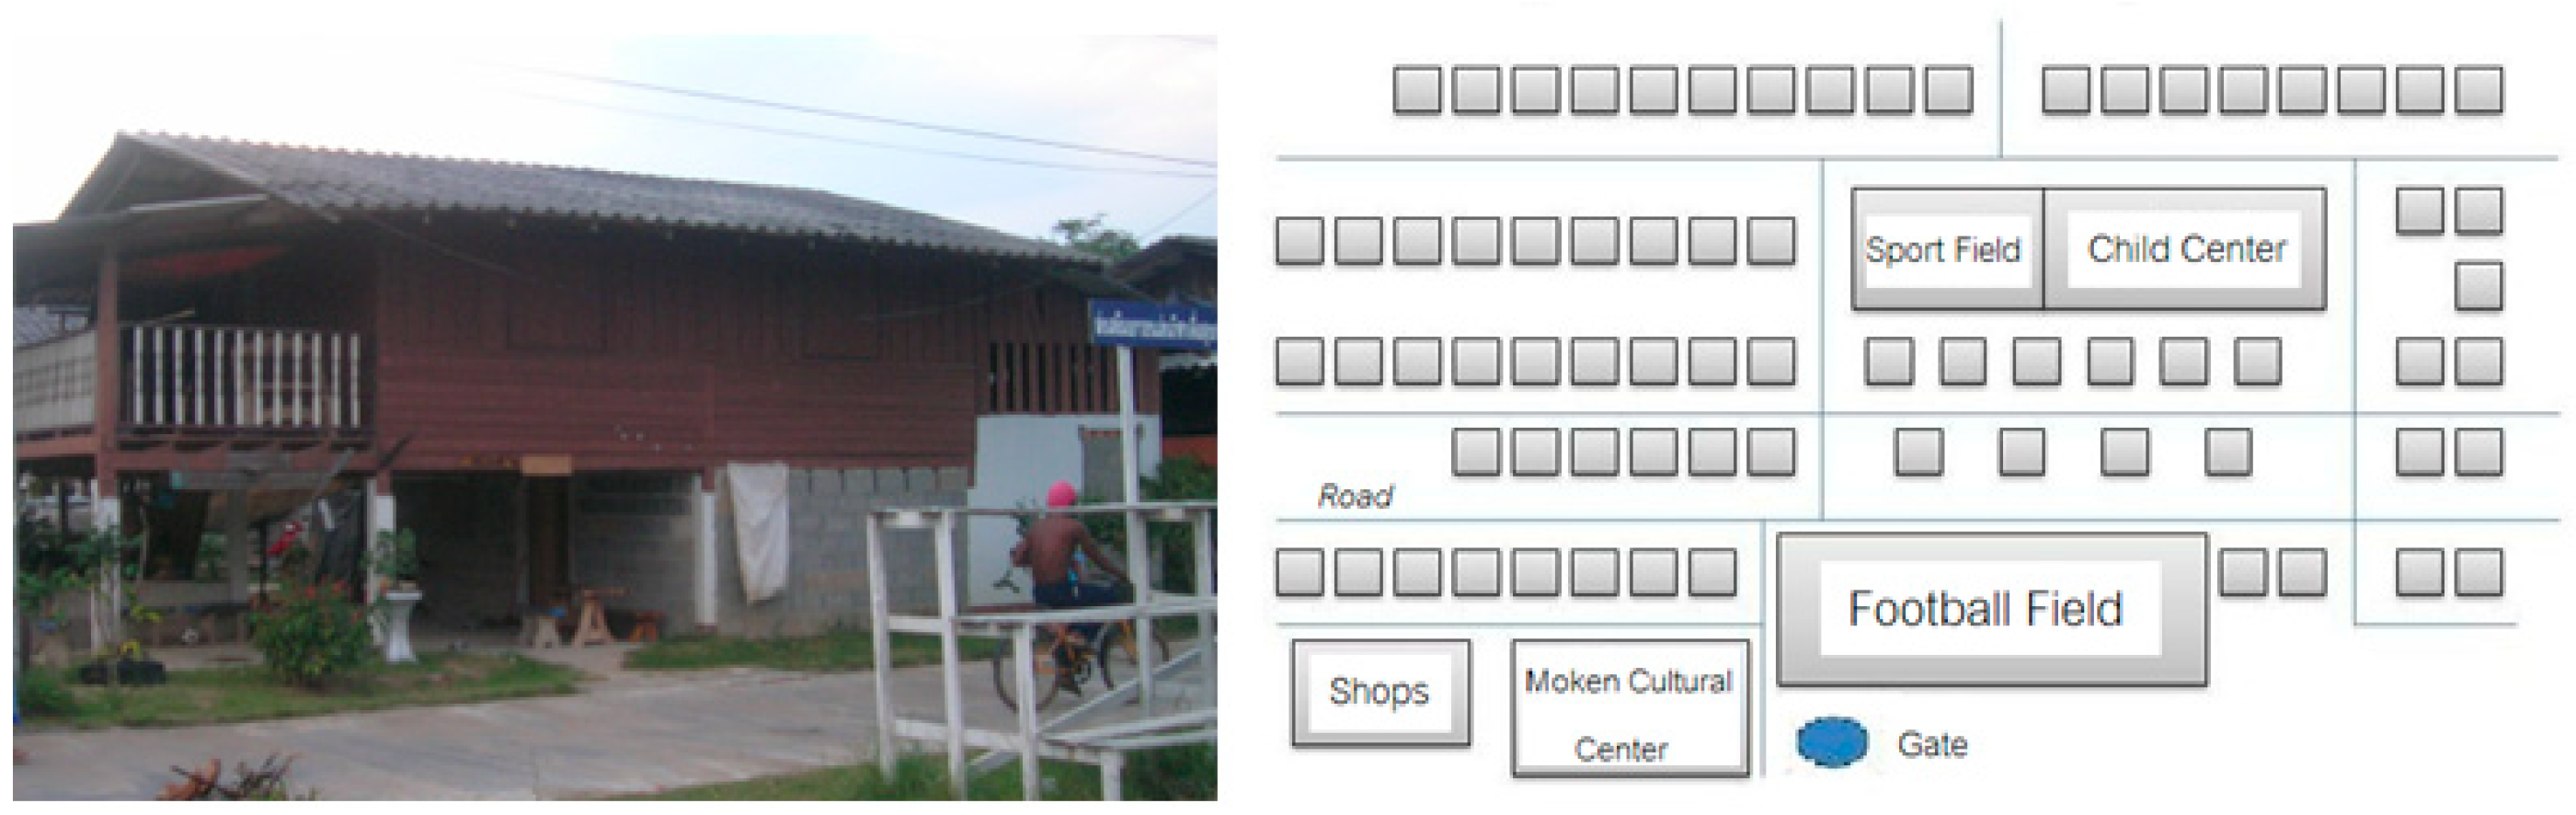
We found four projects (Tub Tawan 2, Koh Kor Khao Pier 1, Koh Kor Khao Pier 2, and Thung Tuek) that reconstructed 58 raised-basement houses in the same locations for most of the Moklen or local tribes along the Phang-nga coast. Figure 4 presents the patterns of the raised-basement houses built for tsunami victims.
In Figure 5, new houses in Tub Tawan 2 were reconstructed in a parallel-lines layout. The pattern of houses was adopted from the destroyed houses, after consulting with the Moklen in this area. Single-story and raised-basement houses were also reconstructed in Thung Tuek, Koh Kor Khao Pier 1, and Koh Kor Khao Pier 2. No single-story or raised-basement houses were reconstructed in any other reallocated areas.
Based on our observations, the single-story and raised-basement houses reconstructed projects in Tub Tawan 2 and Thung Tuek have a narrow gap between the ground and the first floor, so adjustments or modifications to the basement in these locations was limited. Unlike the single-story and raised-basement houses reconstructed near Koh Kor Khao Pier, which have a higher space between the ground and the first floor, some houses had their basements modified to create a larger living space, as shown in Figure 6.
- Two-Story House
There were 712 two-story houses reconstructed in 13 projects; 166 houses were reconstructed in the same locations under four projects (Mitrapab Patthana, Tub Tawan 3, Moklen Ban Thung Wah, and Ban Lion), while 546 houses under nine projects (Rotary Pre Teow, Rotary Pak Wip, Bang Kaya, Moolanithi Chaipatana–Kachad–Suppanimitre, Sutthachon, Moolanithi Chaipattana–Kachad, Rotary Lam Pee, Rotary Tub Pla, and Nam Sai) were reconstructed in new locations. Figure 7 presents some patterns of the two-story houses built in the study area.
Figure 8 presents the patterns of two-story houses and the layout reconstructed for the project, namely, Rotary Pru Teow.
A similar pattern for houses in Bang Kaya was found in other projects, such as Rotary Pak Wip, Sutthachon, Rotary Lam Pee, Rotary Tub Pla, and Nam Sai (with a larger front porch and more space than the others). The pattern of the houses in Moolanithi Chaipaana–Kachad–Suppanimitre and Moolanithi Chaipattana–Kachad looked similar. The houses reconstructed in these projects had a larger living space than the others. However, the new pattern of two-story houses built in parallel lines (see Figure 9) was not familiar to nor did it fit with the lifestyle of Moklen Ban Thung Wah. The layout of the houses was not conducive for people to manage their usual cooking space and lifestyle and did not consider the natural environment for comfortable living. In addition, the arrangement of dwellings had blocked the wind flow in summer [30].
3.1.2. Sizes and Locations of the Permanent Housing Projects
The number of houses in each reconstruction project was classified into five sizes: very small (<30 houses), small (31–60 houses), medium (61–100), large (101–200), and very large (>200 houses). Ten projects were classified as very small: six in Takua Pa District, three in Khura Buri District, and one in Thai Muang District. Nine projects were classified as small: six in Takua Pa District, one in Khura Buri District, and two in Thai Muang District. Six medium-sized projects were reconstructed in Takua Pa District. Two large-sized projects were built in Khura Buri District. One very large project, namely, Ruam Mue Ruam Jai, was built in Takua Pa District. The sizes and locations of these projects were analyzed using the flooded area or tsunami-inundated zone extracted from the ASTER image, as presented in Table 3 and Figure 10.
In Table 3, the reconstruction sites of 29 projects were summarized as being inside or outside of the tsunami-inundated zone. Overall, 13 out of 29 projects (size of the projects: 7 very small, 3 small, 2 medium, and 1 large) were reconstructed in the tsunami-inundation zone or on the same ground (in situ) where tsunami waves destroyed the houses.
While 16 out of 29 projects (size of the projects: 3 very small, 7 small, 4 medium, 1 large, and 1 very large) were relocated outside the inundated zones (to new locations), which used to be rubber/orchard plantations and abandoned lands.
In the inundated zone, 464 houses (around 18 ha or 176,000 square meters) were reconstructed along the coastal area occupied by the Moklen or fishing communities before the catastrophic tsunami in 2004, while 1169 houses (around 47 ha or 470,000 square meters) were reconstructed outside the inundated zone. Members of the affected fishing communities were offered to stay in the newly reconstructed houses on the higher ground far from the coast. However, some household members returned to the beach for fishing. The pre-tsunami problems about land conflicts were seriously addressed among the Moklen, fishing communities, and landlords from both the private and government sectors. Without identification cards and title deeds, Moklen families have been seriously engaged in land-conflict problems in many locations since the 2004 Tsunami. The prohibition on entering the pre-tsunami settlement of the Moklen and fishing communities in Tab Tawan, Ban Nam Khem, Takua Pa District, was announced by the new landlord or private investors who held the title deed covering the expired mining concession and local residential areas. There is a conflict between the fishing community in Ban Nai Rai, Thai Muang District, and the investors from higher ground and another province over developing this land for tourism, and there is a conflict between Thung Wah community and the local administrative officers in Takua Pa District about the plan to develop this land to be a hospital, etc. [31]. The Moklen and some fishing communities, the prior residents without any land certificates or deeds, proposed to prove their right to continue living there by using related historical documentaries and reports, aerial photographs, satellite images (using remote sensing techniques), and field surveys.
Most of the in situ reconstruction projects built about the same number of houses that were destroyed by the tsunami waves. An exception was Ban Lion in Pak Chok Community, Khura Buri District (inside the red circle in Figure 10), where more than twice (165 units) the number of permanent houses were reconstructed compared to those that were swept away or damaged by the tsunami waves (85 units) for the homeless villagers in Pak Chok and areas in its vicinity. Within a few years of living in the newly built houses in Ban Lion, many residents moved to other inland communities for a variety of reasons. Around 75% of local inhabitants died in the 2004 Tsunami. Moreover, insufficient infrastructure, a lack of jobs or difficulty to earn a living, fear of future tsunamis hitting this area (too afraid to stay), unhappiness with the pattern of houses built without local needs being considered or culture consultation, etc., were raised by the majority of residents as the reasons for leaving Ban Lion unoccupied [32,33]. Moreover, stronger waves and erosion were found in some locations along the beach after the 2004 Tsunami. The permanent houses at Koh Kor Khao Pier 1 and Koh Kor Khao Pier 2, reconstructed in the same area near the beach, suffered from sunken basements and damaged floors.
The relocated projects outside the tsunami-inundated zone were built on higher ground and far from the beach. Most of these projects had larger or more housing units than those in the inundated zone.
3.2. Long-Term Recovery Measurement of the Reconstructed Communities
Long-term recoveries in 18 communities associated with the permanent housing projects for tsunami victims were measured using the BMN data during 2002–2015. The selected BMN’s parameters were sufficient water volume for household consumption (dimension: dwelling), employment of people between 15 and 60 years old (dimension: economy), and participation of household members in the community’s activities (dimension: participation). The selected parameters were measured in three periods: (1) before the tsunami (2002–2004); (2) the resettlement period (living in reconstructed houses during 2005–2008); (3) after the resettlement period (2009–2015). The result of the resettlement period was presented in maps of five classes, counting the number of failed years; 1 (failed = 1 year), 2 (failed = 2 years), 3 (failed = 3 years), 4 (failed = 4 years or every year), and 0 (passed: no failed years or passed every year during 2005–2008). The analysis of the long-term recovery using BMN’s parameters was presented in the following tables and maps.
3.2.1. Dwelling Recovery–Sufficient Water for Household Consumption
Based on the criterion standard, 95% of households in the community should have enough water (at least 45 L/per day/per person) to consume in a year; otherwise, the community is indicated as not passing or failing. The percentage of households in the community that had enough water to consume from 2002 to 2015 are listed and highlighted as the failed years in Table 4.
Before the 2004 Tsunami, about half of the observed communities were failing according to the standard because of the limitation of the volume of fresh water in the coastal area of Phang-nga. Both natural and artificial reservoirs and pits were the primary sources for supporting the community’s plumbing system. However, the limited volume and brackish water, especially in the dry season, affected household water consumption volume each year. During 2002–2004, insufficient water volume for household consumption occurred in the fishing communities along the coast of Phang-nga, Pak Koh, Thung La-ong, and Khao Lak, where some very small projects were reconstructed. The scarcity of water volume had also been found in 2 out of 3 years of the observation period before the 2004 Tsunami in six communities: Bang Sak 7, Bang Sak 8, Muang Mai, Thung Tuek, Triam, and Thung Rak. These communities with small- and medium-sized projects that failed the criterion in 1 out of 3 years during 2002–2004 are Nam Khem, Pak Wip, Bang Kaya, Bang Niang 5, and Pak Chok. On the other hand, sufficient water volume during 2002–2004 was found in various sizes of projects in four communities: Pru Teow, Bang Lud, Khuk Khak, and Lam Pee. Only Lam Pee did not pass the criterion during the recovery period 2005–2008, while the other three communities passed the criterion every year of the observation years (2002–2015).
Figure 11 presents the recovery assessment of water for households’ consumption in each community after transferring to the reconstructed houses during 2005–2008. The number of criterion failings were counted and named together with the location (N = new location, outside the inundated zone; in situ = same location, inundated zone) and size information (VS = very small; S = small; M = medium, L = large, VL = very large; for example, N/VS1 = one very small project reconstructed in a new location). Six communities (indicated by blue stars), Pru Teow, Nam Khem, Bang Lud, Bang Sak 7, Bang Sak 8, and Khuk Khak, which are located near the city center of the subdistricts in the central part of Takua Pa, passed the criterion every year. However, Nam Khem, Bang Sak 7, and Bang Sak 8 did not pass this criterion before the 2004 Tsunami. During the recovery period, water consumption scarcity did not occur in Bang Lud, which had a very large permanent housing project reconstructed in a new location, Takua Pa District (passed in all 4 years). While a large project reconstructed in the same area of Pak Chok in Khura Buri District failed the standards in 3 out of 4 years. This implies that the situation of water consumption in Khura Buri had poorer management than in Takua Pa District. Before the catastrophic tsunami in 2004, most coastal communities failed the criterion of sufficient water for household consumption. For example, Pak Koh, Thung La-ong, Thung Tuek, Muang Mai, Triam, Thung Tuek, and Thung Rak still faced the worst situation in some years during the resettlement period. Nam Khem, Bang Sak 7, Bang Sak 8, and Khao Lak, which failed the standard before the tsunami, improved to the standard during the resettlement period.
Two-thirds (12 communities) of the observed communities (18 communities) did not pass this parameter’s criterion. Three communities (Bang Niang 5 in Khuk Khak Subdistrict, Muang Mai in Koh Kor Khao Subdistrict of Takua Pa District, and Pak Chok in Koh Phra Thong Subdistrict of Khura Buri District) failed the criterion 3 out of 4 years. Six communities (Pak Wip, Bang Kaya, Pak Koh, Thung Tuek, Thung Rak, and Lam Pee) failed 2 out of 4 years. Only Lam Pee passed this criterion before the 2004 Tsunami. During the resettlement period, the relocated projects, including those that were very small to medium in size, had 1–2 years where they failed the criterion. Reconstruction projects that were very small to large in the same locations had 3–4 years where they failed the standard.
During 2009–2015, most communities passed this criterion, except for four communities where water scarcity repeatedly occurred. Thung Tuek failed in four out of seven years, and Bang Sak 8 failed in three out of seven years. Only in one out of seven years did Triam and Thung Rak pass this criterion.
3.2.2. Economy Recovery–Employment of People between 15 and 60 Years Old
For measuring the recovery using this parameter, 95% of people between 15 and 60 years old in the community should be fully employed; otherwise, the community is indicated as failed. The percentage of fully employed people 15–60 years old in the community from 2002 to 2015 listed and highlighted as the failed years is presented in Table 5.
During 2002–2004, only Lam Pee passed this criterion every year, since 95% of people 15–60 years old in this community were fully employed, while Bang Lud did not pass during this period. Nine communities had 1 out of 3 years where they failed the criterion. Seven communities had 2 out of 3 years where they failed the criterion. This situation reflects the professions of people in the study area, who depended on daily wages from the agricultural, fishery, and tourism sectors. Many people were employed during the high season and jobless during the low season. Therefore, unemployment in some periods of the year was the reason for failing the standard.
After the tsunami, Lam Pee, where very small and small permanent housing projects were reconstructed in new locations, passed the criterion during 2005–2008 but failed 4 of 7 years during 2009–2015. People who live in Nam Khem, with two in situ reconstruction projects, and people who live in Thung Rak, with two projects reconstructed in new locations, had more than 95% of their entire households employed from 2005 to 2015. The employment situation was better than before the tsunami. Khuk Khak, with a very small project of permanent housing reconstructed on the same ground, passed the criterion during the recovery period of 2005–2008, but it was slightly lower than the standard for one year during 2009–2015. In total, 14 communities failed the criterion in some years during 2005–2008. Thung La-ong, with a very small housing project reconstructed on the same ground; Pak Chok, with a large housing project reconstructed on the same ground; and Khao Lak, with a small housing project reconstructed in the new location, passed the standard during 2009–2015. The rest of the communities still had 1–2 years under the standard. As shown in Figure 12, the coastal communities that failed for 1–3 years during 2005–2008 earned their living from fishery. Some communities were located in the tourism hot spots in Phang-nga, such as Khao Lak, Bang Sak, Bang Niang, Pak Wip, and Pak Chok (Koh Phra Thong). Some of the failed communities were located a bit farther from the beach or on the higher ground in the agricultural areas. Once four years had passed, the communities shown by the blue points in Figure 12 were also well-known as being near one of the beautiful beaches in Phang-nga, such as Khuk Khak and Lam Pee. Thung Tuek (the red diamond in Figure 12), a community that failed the criterion of employment every year during 2005–2008, is located in Koh Kor Khao in Takua Pa.
Many members of the fishermen’s families had to become wage earners or take unfamiliar jobs to earn their living after relocating far away on the higher ground, away from their destroyed houses in the inundated zone. Some fishermen were jobless for more than a year after relocation because of their lack of skills relating to other jobs. This also increased competition for limited vacancies, and the fishermen’s families had no capital to start their own small business. Finally, many families returned to their old settlements to continue fishing.
3.2.3. Social Recovery–Participation in the Community’s Activities
For measuring the recovery using this parameter, 100% of households in the community should participate in their community’s activities; otherwise, the community is indicated as failed. The percentage of household members participating in the activities arranged by their communities from 2002 to 2015 was observed. The failed years are highlighted in Table 6.
During 2002–2004, Pak Koh and Khao Lak had 100% of their households participating in the activities arranged in their communities for all three years. Muang Mai failed one year, in 2002, and Pak Wip and Pak Chok each failed two years. Thirteen communities failed the standard of participation during this entire period.
During 2005–2008, Thung Tuek and Khao Lak failed the criterion every year; eight communities (Pru Teow, Pak Wip, Bang Niang 5, Triam, Thung La-ong, Pak Chok, Thung Rak, and Lam Pee) failed 3 years; three communities (Nam Khem, Bang Sak 7, and Bang Kaya) failed 2 years; and Muang Mai failed 1 year. Khao Lak failed the standard during 2005–2008 but passed the standard during other periods (2002–2004 and 2009–2015). On the other hand, four communities, Bang Lud, Bang Sak 8, Khuk Khak, and Pak Koh, passed the criterion during this resettlement period. Pak Koh continuously reached the standard since 2002, while Bang Lud, Bang Sak 8, and Khuk Khak were below the standard before the disastrous event.
In Figure 13, the communities in Khura Buri similarly failed the standard for 3 years (orange stars). Two communities in Thai Muang failed the standard for 3–4 years (orange and red stars). Four communities that passed the standard (blue spots) during 2005–2008 were in Takua Pa District, where other communities that failed 1–4 years also existed.
After 2008, Triam, Pak Chok, Thung Rak, and Lam Pee continuously failed the standard; Triam and Pak Chok failed 3 years; Lam Pee failed 2 years; and Thung Rak failed 1 year. One-year failure of the standard in 2011 was found in Bang Lud, Bang Sak 7, and Thung La-ong. In 2015, eight communities failed the criterion (Bang Sak 8, Pak Wip, Bang Kaya, Khuk Khak, Bang Niang 5, Muang Mai, Pak Koh, and Thung Tuek), about a decade after the disastrous tsunami.
Based on the observation of BMN data from three periods, Bang Sak 8 and Khuk Khak, which failed during 2002–2004, continuously passed this criterion from 2005 to 2014. Three very small (2) and small (1) permanent housing projects were reconstructed on the same ground in these communities. Thung Tuek, where only a very small project was reconstructed on the same ground, had the highest frequency of failing the standard of this criterion, from 2002 to 2008, and again from 2011 to 2015 (12 of the 14 observation years). On the other hand, Pak Koh, where two very small projects were reconstructed in the same locations, presented perfect participation in the community and passed this criterion during 2002–2014. After 2008, Triam, Thung Rak, and Lam Pee, where the very small, small, and medium sizes of permanent housing projects were reconstructed in new locations, did not pass the criterion for participation in all the activities arranged by their communities. The main reason for failing this criterion was the occupations in the fishery, agricultural, and tourism sectors that required people to work away from home. Some problems related to mingling between the relocated newcomers from the fishing communities and prior residents who work in the agricultural sector were observed during the resettlement periods in Pru Teow, Bang Niang 5, Bang Kaya, and Triam. In addition, unequal donations among the impacted people who relocated to the community induced the problem of unity, which occurred in Ban Thung Wah in Khao Lak and Nam Khem, where a surplus of fishing equipment was contributed to some of the relocated villagers.
Failure to pass the parameters’ standard after the resettlement period was considered beyond the impact of the 2004 Tsunami.
4. Discussions
In this study, the geospatial data of the permanent houses reconstructed in the study area were created and linked at the community level to the long-term recovery measurement using three parameters from the BMN data. The results are discussed in the following subsections.
4.1. Patterns, Sizes, and Locations of the Permanent Housing Reconstruction in Phang-nga
The geospatial data of the 29 permanent housing reconstruction projects in Phang-nga were created and integrated with the information about the patterns of houses, the number of houses under the reconstruction projects classified into five sizes (very small, small, medium, large, and very large), locations of the projects (in situ or the inundated zone and outside the inundated zone), etc. The patterns of the permanent houses in the study area were reconstructed in three styles: single-story or one-story houses (12 projects and 511 houses), single-story and raised-basement houses (4 projects and 58 houses), and two-story houses (13 projects and 712 houses). More than 50% of the single-story or one-story houses were built in the same locations under the very small and the small projects in the coastal areas. The rest of the projects were reconstructed in new places, especially in Pru Teow Community. The single-story and raised-basement houses were, in situ, reconstructed under the very small projects for the Moklen or local tribes along the coast of Phang-nga. The primary pattern of the houses reconstructed in the study area was two-story houses that were mostly built in new locations under the very small to very large projects (all sizes). In June 2022, the two-story house was designed by the Department of Public Works and Town & Country Planning, Ministry of Interior, as the suitable pattern for reconstruction in the tsunami-impacted areas. The design was more concerned with safety from a flooding disaster than the traditional lifestyle.
It was found that the houses’ pattern reconstructed in the study area were not to the satisfaction of every group of tsunami-impacted residents. The design and use of space of the single-story or one-story house were not convenient for households with more than three adults in the same unit. After transferring, the renovation was challenged because of the limited space and budget. In addition, the pattern of houses decided by third parties or non-residents did not fit with the traditional lifestyle of the Moklen or local fishermen who live in the coastal area. One of the requirements from the tsunami impacted people was participating in housing-reconstruction processes, such as selecting the patterns of the house, materials, layout, location, etc. Moreover, supporting the construction works would be much better than waiting for more than one year in a temporary shelter. Although they relocated to higher ground, outside the inundated zone, many fishermen or Moklen families returned to where they lived before the tsunami to resume their careers. Some communities (such as Tub Tawan, Thung Wah, etc.) were found to have a problem with land rights, as there were new landlords who held the title deeds. This conflict took many years to prove for those with a long history of living in the area, with former generations who settled there, before the issuing of title deeds to the new landlords.
Some studies related to the permanent-housing recovery in the tsunami-impacted areas and similar concerns about the pattern, location, and participation in the housing reconstruction by the tsunami-impacted villagers were also discussed in our study. Ref. [23] found that the level of involvement of the villagers in the design and physical reconstruction of the houses varied by donor or organization. The Thai government did not include the impacted villagers in either the design or construction process. In addition, organizations relocated some villages due to safety (outside of the tsunami-inundation zone) and there were land ownership issues. Their findings were in the same direction as our study. Ref. [21] conducted their study over four years across five tsunami-affected areas of Sri Lanka and southern India. They summarized that inappropriate planning for the location of resettlement and the size and style of housing units made it difficult for the tsunami survivors to continue with traditions such as sharing food preparation. This also happened with the Moklen or fishery villages in Thailand. Ref. [19] highlighted the inappropriate reconstruction by a donor who failed to consult with local people or the Moklen regarding the house design, location, and usability. This led to spatial dysfunction for the local community, which occurred for the Ban Lion Project, Pak Chok Community, on Koh Phra Thong Island. There was a similar finding in our study. Ref. [17] conducted their survey in Thung Wah Community, Phang-nga Province, and found that three aspects affect living conditions: village layout, housing space, and building materials. The rebuilding process changed the housing types from single-story in the pre-tsunami period to houses with high stilts post-tsunami. This was not suitable for the Moklen lifestyle, especially because of the design’s use of stairs and the limited space was not friendly to the elderly. The layout of housing in rows affected air ventilation, as they blocked each other’s wind flow. Some building materials were not durable enough under various climate conditions. Based on our survey, the two-story houses were reconstructed to replace damaged single-story houses. We agreed with [17] that the new pattern and layout of the new houses impacted the Moklen’s lifestyle.
The climate adaptability and cultural appropriateness of the houses were also mentioned by [12] as the acceptance/rejection factors in resettlement schemes, including the legal issues relating to ownership and the availability and affordability of the social and physical infrastructure that determine the adaptability to the new environment after the resettlement. These factors were also obtained by our study relating to the land ownership problems that occurred when the Moklen, who had occupied the fishing communities along the Andaman coast for a long time without identification cards and title deeds, had conflicts with the government authorities and legal landlords. We also had concerns about the availability of infrastructure, especially water for households’ consumption and social participation in the reconstructed communities. Similar concerns about permanent housing reconstructions relating to the 2004 Tsunami were highlighted. In particular, the patterns and locations of housing, state-community participation, and a lifeline reconstruction process considering community-based planning, which empowers the impacted communities, families, and individuals to rebuild their housing, their lives, and their livelihoods. These points were also mentioned in [5,6,14,20,22]. For disaster risk reduction, to facilitate beneficiary community recovery and ensure the long-term sustainability and effectiveness of the housing program, the construction of resilient and acceptable housing is one of the key measures for housing-reconstruction program efficiency, which was summarized by [16].
Understanding the local conditions gained from the community consultants and participatory processes allowed a degree of success with the permanent housing recovery. The familiar pattern and location of housing, such as a single-story house in the tsunami-inundated zone of Moklen communities along the coastal areas of Phang-nga, were not safe or suitable for responding to unexpected tsunami waves in the future. The Thai government suggested the two-story house for safer living in the disaster risk area, when relocation to the safe zone was rejected. In addition, the pattern and number of houses in each project are helpful for supporting disaster recovery in the long term or the sustainability of disaster management and planning.
4.2. Recovery Measurement in the Houses’ Reconstructed Areas at Community Level
Ref. [10] summarized the significant advantages related to Build Back Better (BBB) research during 2006–2019 (13 years), from the journal articles obtained from the database search to identify several essential themes related to BBB research. For BBB success measurement, it may be easier to quantify physical metrics such as the number of rebuilt houses or restored jobs and economic benefits. Social and psychological recovery is more difficult to analyze and measure. A set of practical indicators that is widely accepted still does not exist. So, as mentioned in [11], a wide-ranging, inclusive, and well-accepted method of measuring recovery at the community scale is currently unavailable.
As mentioned in [24], recovery outcomes are not easily captured by a few accessible metrics, so there is a need for the measure to be applicable across many communities and a relatively long-time frame. It is recognized that indicators should be used together with other forms of qualitative and quantitative information to develop a better understanding of the recovery outcomes, trajectories, and processes. It is, therefore, challenging for this study to apply a set of indicators selected from the basic minimum need (BMN) data that are annually gathered and used by the Thai government to measure the quality of life of Thai households across the country, specifically for a long-term recovery assessment of the 18 communities where the permanent housing reconstruction projects were located. The selected parameters, sufficient water volume for household consumption (dimension: dwelling), employment of people 15–60 years old (dimension: economy), and participation in their community (dimension: participation), were observed in three periods: before the tsunami (2002–2004), the resettlement period when the tsunami victims had transferred to the reconstructed houses in the same areas or new locations (2005–2008), and after the resettlement period (2009–2015).
4.2.1. Sufficient Water Volume for Household Consumption
Water scarcity is a periodic problem found in the communities situated along the coastal area of Phang-nga. In summer, water resources in this area, such as natural and artificial reservoirs, pits of underground water, and local plumbing systems, have limited volume and turn to salty water. In the initial phase of resettlement, ref. [12] mentioned that the availability of infrastructure according to the amount of population increase was one of the factors affecting adaptability. This corresponded to the case of well-prepared infrastructure, especially the water volume for household consumption of the households that relocated to their new permanent houses in Pru Teow, Bang Lud, Bang Sak 7, Bang Sak 8, Khuk Khak, Nam Khem, and Khao Lak, which passed the criterion. Pru Teow is situated near the city of Takua Pa and easily connected to the city’s basic infrastructure, while the other communities are located in the business or tourism zone.
The fishing communities along the coast failed the criterion of having sufficient water volume for household consumption before the tsunami, such as Pak Koh, Thung La-ong, Thung Tuek, Muang Mai, Triam, Thung Tuek, and Thung Rak. They faced a worse situation during the resettlement period. The unequal or fragmented recovery was mentioned by [13], since the inhabitants in the coastal areas, far from the tourist regions, were still struggling to make a living, while tourist areas were found to be re-established and had resumed with the same or even better infrastructure and services than before the disastrous 2004 Tsunami. The sufficient amount of water for household consumption in the study area is, therefore, related to the locations but is not related to the size of the reconstruction projects or patterns of houses. Based on the analysis of this study, the recovery of water for households’ consumption should take a few more years after transferring to the reconstructed houses or around four years after the disastrous event (2005–2008), before a sufficient volume of water for all the households in the community became stable.
4.2.2. Employment of People between 15 and 60 Years Old
The income of most of the residents in the coastal communities in Phang-nga comes from fishing, agriculture (oil palm, rubber, orchards plantations, etc.), tourism, and trade. However, many workers were unemployed in the low season, especially during the monsoon season from May to October. At the same time, many of the daily wage workers in the agricultural section were busy only during the harvesting season. Therefore, the periodical employment in the study area was the reason for failing the standard of employment measurement in these communities. During the resettlement period, employment recovery in the fishing communities such as Thung La-ong, Nam Khem, Thunk Rak, etc., recovered faster than in the tourism areas such as Khao Lak and Pak Chok, where a lot of tourism facilities were destroyed. In addition, many organizations donated fishing boats and related equipment. Therefore, the recovery in fishing communities was faster than that in agriculture-based communities such as Bang Kaya, Pru Toew, and Triam.
The situations in the study area corresponded to the information gathered by [13,30,31,33]. Infrastructure recovered faster than other impacted areas, while employment recovered the fastest in fishing communities compared to other occupations. Based on the recovery measurement in this study, employment in the reconstructed communities took around four years (2005–2008) after the disaster to again reach the standard of this parameter.
4.2.3. Participation in the Community’s Activities
With the high expected standard of this parameter, that 100% of households in the community should participate in the significant events arranged in their community, 16 out of 18 observed communities in the study area failed the standard before the 2004 Tsunami. Their occupations are the main reason for people to fail to participate in the main activities in their communities. Working in fishery, agricultural, and tourism sectors that require working away from home for some periods of time was the main obstacle to people participating in the activities arranged in their communities. After a few years of relocation, most of the reconstructed communities failed the participation standard more than ever. The lack of mixing between the lifestyles of the newcomers from the fishing communities from the coastal area and the residents, farmers, or workers in the agricultural sector was the main reason to fail this standard. In addition, the unequal donations among the impacted people who relocated to the community induced the problems of unity and participation. However, most of these communities took 3–4 years after the resettlement to adapt and then pass the standard.
Disaster recovery relates to various dimensions; our parameters were, however, reflected in only a small part of the long-term recovery. Many of the parameters/dimensions related to long-term recovery during the phase of permanent housing should be considered. However, the complete long-term community-based recorded data was limited. Eleven indicators affecting the long-term satisfaction regarding the permanent housing of two tsunami-affected resettled communities in Sri Lanka was presented by [18]. The indicators were summarized from the literature review and interviews with relevant experts and communities. Although interviews with the impacted people from many communities is a crucial method used in many studies related to post-disaster recovery, it is rather complicated to capture and imply various perceptions and attitudes about the level of healing. Therefore, a better methodology or framework for disaster recovery and how to shift the emphasis from relief to sustainable recovery still need to be learned from tsunami-recovery cases. Recently, a framework for evaluating the sustainable recovery level of families and communities in China was proposed by [15]. Ref. [9] mentioned that disaster-recovery-related authorities should examine the lessons learned and the best practices of other communities and incorporate relevant considerations into their plans. In the disaster-recovery phase, permanent housing reconstruction is one of the complex processes that needs to be concerned with the different characteristics of a region. Cultural, economic, environmental, political, and social factors were mentioned by [13] to ensure disaster risk reduction, facilitate beneficiary community recovery, and ensure the long-term sustainability and effectiveness of the housing program [16].
5. Conclusions
In this study, the geospatial data of the 29 permanent housing reconstruction projects in Phang-nga were created and integrated with the information on the patterns of houses using geoinformatics technologies. The pattern and number of houses in each project, including the recovery assessment using living-related parameters from BMN data, is a valuable support tool in dealing with disaster recovery in the long term or the sustainability of disaster planning and management. Based on the geospatial data of permanent houses and the inundated zone defined from remote sensing data, the risk of flooding from large waves in the future was evaluated. The communities that consisted of single-story or one-story houses located in the inundated zone were considered at the highest risk compared to the two-story houses or houses relocated to the higher ground far away from the beach. The issue was that the two-story houses did not satisfy the lifestyle of the Moklen; this pattern is, however, suitable for reconstruction in flood-prone areas. For measuring recovery at the community scale, a set of practical indicators selected from the BMN data collected by the Ministry of Interior over a relatively long timeframe (2002–2015) was applied to the reconstructed communities due to the 2004 Tsunami in Phang-nga Province, Southern Thailand. The selected parameters consisted of sufficient water volume for household consumption (dimension: dwelling), employment of people 15–60 years old (dimension: economy), and participation in the community’s activities (dimension: participation). The optimum period of recovery support after resettlement acquired by this study was four years. For sustainable planning and management, more dimensions of disaster recovery in the study area should be updated at the community level.
Recently, the advancements in geoinformatics technologies have induced more sensor types equipped on different platforms: satellites and unmanned aerial vehicles (UAVs). The detailed geospatial data in our study and also in other disaster-impacted areas are of a better quality than in past decades. Some limitations in this study should be further developed: the non-scale layout of permanent housing should be captured from the high-resolution images acquired by UAV. Sequentially, the exact information of the geographic coordinates, shape, size, space between houses, etc., are more quickly achieved than when estimated from field works. The recovery of beaches, mangroves, infrastructures, and human activities (agriculture and land uses) should be monitored and extracted from multiple spatial, temporal, and spectral resolution data using challenging analysis methods such as machine learning or deep learning. By integrating the detailed geospatial data of disaster-impacted areas acquired by advanced geoinformatics technologies and field observations (interactions by researchers, sensors/equipment, and documentary report) and using new efficient analysis methods, the analysis on disaster impact, disaster vulnerability reduction, and sustainable recovery will be enhanced. Newly developed simulation models or techniques for the early warning of potential tsunamis should also be considered for community safety.
Author Contributions
Conceptualization, D.K., T.L., K.U. and T.T.V.; methodology, D.K. and T.T.V.; validation, D.K. and T.L.; formal analysis, D.K., T.L. and K.U.; data curation, D.K. and T.L.; writing—original draft preparation, D.K.; writing—review and editing, K.U. and T.T.V.; visualization, T.L.; supervision, K.U. and T.T.V.; project administration, D.K. All authors have read and agreed to the published version of the manuscript.
Funding
This research received no external funding.
Institutional Review Board Statement
Not applicable.
Informed Consent Statement
This research used statistical data collected by governmental agencies. Patient consent is not applicable.
Data Availability Statement
The data presented in this study are available on request from the corresponding author. The data are not publicly available due to privacy.
Conflicts of Interest
The authors declare no conflict of interest.
References
- World’s Worst Tsunamis. Available online: thoughtco.com/worlds-worst-tsunamis-3555041ThoughtCo (accessed on 1 February 2022).
- List of Tsunamis. Available online: http://itic.ioc-unesco.org/index.php?option=com_content&view=category&layout=blog&id=2290&Itemid=2814 (accessed on 10 August 2022).
- Tonga: Volcanic Eruption and Tsunami—January 2022. Available online: https://reliefweb.int/disaster/vo-2022-000005-ton (accessed on 20 February 2023).
- United Nations Secretary-General. Lesson Learned from Tsunami Recovery: Key Propositions for Building back Better; Clinton, W.J., Ed.; A Report by the United Nations Secretary-General’s Special Envoy for Tsunami Recovery; United Nations: New York, NY, USA, 2006; pp. 2–24. [Google Scholar]
- United Nations Environment Programme. After the Tsunami Sustainable Building: Guidelines for South-East Asia; United Nations Environment Programme: Nairobi, Kenya, 2007; pp. 9–47. [Google Scholar]
- Jha, A.K.; Barenstein, J.D.; Phelps, P.M.; Pittet, D.; Sena, S. Safer Homes, Stronger Communities: A Handbook for Reconstructing after Natural Disasters; World Bank: Washington, DC, USA, 2010; pp. 77–173. [Google Scholar]
- United Nations. Sendai Framework for Disaster Risk Reduction 2015–2030; United Nations Office for Disaster Risk Reduction: Geneva, Switzerland, 2015; pp. 9–27. [Google Scholar]
- Global Facility for Disaster Reduction and Recovery (GFDRR). Disaster Recovery Framework Guide: Revised Version March 2020; GFDRR: Washington, DC, USA, 2020; pp. 22–44. [Google Scholar]
- Federal Emergency Management Agency (FEMA). Planning Considerations: Disaster Housing—Guidance for State, Local, Tribal and Territorial Partners; Federal Emergency Management Agency: Washington, DC, USA, 2020; pp. 12–23.
- Fernandez, G.; Ahmed, I. “Build back better” approach to disaster recovery: Research trends since 2006. Prog. Disaster Sci. 2019, 1, 100003. [Google Scholar] [CrossRef]
- Hettigea, S.; Haighb, R.; Amaratunga, D. Community Level Indicators of Long Term Disaster Recovery. Procedia Eng. 2018, 212, 1287–1294. [Google Scholar] [CrossRef]
- Sridarran, P.; Keraminiyage, K.; Amaratunga, D. Enablers and barriers of adapting post-disaster resettlements. Procedia Eng. 2018, 212, 125–132. [Google Scholar] [CrossRef]
- Stephan, C.; Norf, C.; Fekete, A. How ‘‘Sustainable’’ are Post-disaster Measures? Lessons to Be Learned a Decade After the 2004 Tsunami in the Indian Ocean. Int. J. Disaster Risk Sci. 2017, 8, 33–45. [Google Scholar] [CrossRef] [Green Version]
- Ahmed, I. An Overview of Post-disaster Permanent Housing Reconstruction in Developing Countries. Int. J. Disaster Resil. Built. Environ. 2011, 2, 148–164. [Google Scholar] [CrossRef]
- Zhou, B.; Zhang, H.; Evans, R. Build back better: A framework for sustainable recovery assessment. Int. J. Disaster Risk Reduc. 2022, 76, 102998. [Google Scholar] [CrossRef]
- Bilau, A.A.; Witt, E.; Lill, I. Analysis of Measures for Managing Issues in Post-Disaster Housing Reconstruction. Buildings 2017, 7, 29. [Google Scholar] [CrossRef] [Green Version]
- Attavanich, M.; Kobayashi, H. Living conditions in post-tsunami houses: A case study of the moklen ethnic minority group in Tungwa village, Phang Nga province, Southern Thailand. Int. J. Disaster Risk Reduct. 2016, 19, 12–21. [Google Scholar] [CrossRef]
- Dias, N.T.; Keraminiyage, K.; DeSilva, K.K. Long-term satisfaction of post disaster resettled communities: The case of post tsunami—Sri Lanka. Disaster Prev. Manag. 2016, 25, 581–594. [Google Scholar] [CrossRef] [Green Version]
- McDuie-Ra, D.; Robinson, D.; Kaewmahanin, J. Spatial dysfunction in post-tsunami Baan Lion: Taking the Moken beyond vulnerability and tradition. Geoforum 2013, 48, 145–155. [Google Scholar] [CrossRef] [Green Version]
- Raju, E. Housing reconstruction in disaster recovery: A study of fishing communities post-tsunami in Chennai, India. PLoS Curr. 2013, 5, 1–10. [Google Scholar] [CrossRef] [PubMed]
- Mulligan, M.; Ahmed, I.; Shaw, J.; Mercer, D.; Nadarajah, Y. Lessons for long-term social recovery following the 2004 tsunami: Community, livelihoods, tourism and housing. Environ. Hazards 2012, 11, 38–51. [Google Scholar] [CrossRef]
- Kuwata, Y. Post-Tsunami Lifeline Restoration and Reconstruction. In Tsunami—A Growing Disaster; Mokhtari, M., Ed.; InTechOpen: London, UK, 2011; pp. 61–86. Available online: https://www.intechopen.com/chapters/24937 (accessed on 4 January 2023). [CrossRef] [Green Version]
- Angers, T.; Marien, A.; Rheaume, D. Analyzing Relationships between Reconstruction Approaches and Social Vulnerabilities in Tsunami-Affected Thailand. Bachelor’s Thesis, Worcester Polytechnic Institute, Worcester, MA, USA, 1 March 2007. [Google Scholar]
- Hettige, S.; Haigh, R. An integrated social response to disasters: The case of the Indian Ocean tsunami in Sri Lanka. Disaster Prev. Manag. 2016, 25, 595–610. [Google Scholar] [CrossRef] [Green Version]
- Tomaszewski, B. Geographic Information Systems (GIS) for Disaster Management; CRC Press Taylor & Francis Group: New York, NY, USA, 2015; pp. 111–250. [Google Scholar]
- Xu, W.; Zlatanova, S. Ontologies for Disaster Management Response. In Geomatics Solutions for Disaster Management; Li, J., Zlatanova, S., Fabbri, A., Eds.; Springer: Berlin/Heidelberg, Germany, 2007; pp. 185–200. [Google Scholar]
- Kaku, K. Satellite remote sensing for disaster management support: A holistic and staged approach based on case studies in Sentinel Asia. Int. J. Disaster Risk Reduct. 2019, 33, 417–432. [Google Scholar] [CrossRef]
- Wang, Y.; Imai, K.; Mulia, I.E.; Ariyoshi, K.; Takahashi, N.; Sasaki, K.; Kaneko, H.; Abe, H.; Sato, Y. Data assimilation using high-frequency radar for tsunami early warning: A case study of the 2022 Tonga volcanic tsunami. J. Geophys. Res. Solid Earth 2023, 128, e2022JB025153. [Google Scholar] [CrossRef]
- Basic Minimum Need Data. Available online: https://www.cdd.go.th/our-services/basic-minimum-needs-information (accessed on 25 June 2022).
- Community Organizations Development Institute (CODI). Combining Ideas, Experiences, and Rehabilitation of Lives and Communities Affected by the “Tsunami” Earthquake by Coordinators and Victims over the Past 1 Year; Community Organizations Development Institute (CODI): Bangkok, Thailand, 2006; pp. 116–127. (In Thai) [Google Scholar]
- The National Human Right Commission. Hope—Silence and Power after the Waves, a Case of Internally Displaced Persons from the 2004 Tsunami in Six Impacted Provinces, Southern Thailand; Fact Finding and Inception Report; The National Human Right Commission: Bangkok, Thailand, 2005; pp. 4–21. (In Thai) [Google Scholar]
- Explore the Abandoned Village Koh Phra Thong Tsunami Community. Available online: https://transbordernews.in.th/home/?p=6407 (accessed on 28 December 2020).
- Office of Natural Resources and Environment Pollicy and Planing (ONEP). 2 Years after Tsunami: Restoration of Thailand’s Natural Resources and Environment; Ministry of Natural Resources and Environment: Bangkok, Thailand, 2006; pp. 125–150. (In Thai)
Figure 1.
Methodology framework.

Figure 2.
One-story houses in the study area.

Figure 3.
One-story house and layout of the permanent houses in Tub Tawan 1.

Figure 4.
Single-story and raised-basement houses in the study area.

Figure 5.
Single-story and raised-basement houses and layout of the permanent houses in Tub Tawan 2.
Figure 5.
Single-story and raised-basement houses and layout of the permanent houses in Tub Tawan 2.

Figure 6.
Raised-basement houses and layout of the permanent houses in Koh Kor Khao Pier 1 and Kor Khao Pier 2.
Figure 6.
Raised-basement houses and layout of the permanent houses in Koh Kor Khao Pier 1 and Kor Khao Pier 2.

Figure 7.
Two-story houses in the study area.

Figure 8.
Two-story houses and layout of the permanent houses in Rotary Pru Teow.

Figure 9.
Two-story houses and layout of the permanent houses in Moklen Ban Thung Wah.

Figure 10.
Sizes and locations of the permanent housing projects in Phang-nga Province.

Figure 11.
Sufficient water for household consumption during 2005–2008.

Figure 12.
Employment of people between 15 and 60 years old during 2005–2008.

Figure 13.
Participation in the community’s activities during 2005–2008.


Table 1.
Materials used in this study.
| Materials | Details |
|---|---|
| Software | Environment for Visualizing Images (ENVI), ArcGIS, Microsoft Access, and Easy GPS (Global Positioning System) |
| Hardware | Handheld GPS, digital camera |
| Data |
|
Table 2.
The permanent housing projects in the study area.
| No. | Community Name | Project Name | No. of Houses | Subdistrict | District |
|---|---|---|---|---|---|
| 1 | Pru Teow | Pui Pornthip, Krung Sri Bang–Pun In-see, Kachad-Pru Teow, Rotary–Pru Teow, Por Tek Tueng | 362 | Bang Nai Si | Takua Pa |
| 2 | Nam Khem | Ruamsuk Tawee Sup Munkong, Mitrapab Patthana | 97 | Bang Muang | Takua Pa |
| 3 | Bang Lud | Ruam Mue Ruam Jai | 228 | Bang Muang | Takua Pa |
| 4 | Bang Sak 7 | Tub Tawan 1 | 43 | Bang Muang | Takua Pa |
| 5 | Bang Sak 8 | Tub Tawan 2, Tub Tawan 3 | 61 | Bang Muang | Takua Pa |
| 6 | Pak Wip | Rotary Pak Wip | 50 | Khuk Khak | Takua Pa |
| 7 | Bang Kaya | Ruam Jai–Surat Thani, Bang Kaya | 136 | Khuk Khak | Takua Pa |
| 8 | Khuk Khak | Lam Prakarang | 23 | Khuk Khak | Takua Pa |
| 9 | Bang Niang 5 | Moklen Ban Thung Wah | 71 | Khuk Khak | Takua Pa |
| 10 | Muang Mai | Muang Mai | 16 | Koh Kor Khao | Takua Pa |
| 11 | Pak Koh | Koh Kor Khao Pier 1, Koh Kor Khao Pier 2 | 17 | Koh Kor Khao | Takua Pa |
| 12 | Thung Tuek | Thung Tuek | 11 | Koh Kor Khao | Takua Pa |
| 13 | Triam | Moolanithi Chaipattana–Kachad–Suppanimitre, Sutthachon | 47 | Khura | Khura Buri |
| 14 | Thung La-ong | Town House Ban Thung Ong | 10 | Bang Wan | Khura Buri |
| 15 | Pak Chok | Ban Lion | 165 | Koh Phra Thong | Khura Buri |
| 16 | Thung Rak | Thepparat, Moolanithi Chaipattana–Kachad | 218 | Mae Nang Kao | Khura Buri |
| 17 | Lam Pee | Rotary Lam Pee, Rotary Tub Pla | 59 | Thai Muang | Thai Muang |
| 18 | Khao Lak | Nam Sai | 60 | Lam Kaen | Thai Muang |
Table 3.
Summary of sizes and locations of the permanent housing projects.
| Reconstruction Site | Size of the Project | ||||
|---|---|---|---|---|---|
| Very Small (<30 Houses) | Small (31–60 Houses) | Medium (61–100) | Large (101–200) | Very Large (>200 Houses) | |
| Inside tsunami-inundated zone (in situ) | Tub Tawan, Lam Prakarang, Muang Mai, Koh Kor Khao Pier 1, Koh Kor Khao Pier 2, Thung Tuek, Town House Ban Thung Ong | Ruamsuk Tawee Sup Munkong, Tub Tawan 1, Tub Tawan 3 | Mitrapab Patthana, Moklen Ban Thung Wah | Ban Lion | - |
| Outside tsunami-inundated zone | Moolanithi Chaipattana–Kachad–Suppanimitre, Sutthachon, Rotary Lam Pee | Krung Sri Bang–Pun In-see, Pui Pornthip, Rotry Pak Wip, Ruam Jai–Surat Thani, Thepparat, Rotary Tub Pla, Nam Sai | Kachad-Pru Teow, Rotary Pru Teow, Por Tek Tueng, Bang Kaya | Moolanithi Chaipattana–Kachad | Ruam Mue Ruam Jai |
Table 4.
Sufficient water to consume during 2002–2015.
| Year of Observation | ||||||||||||||
|---|---|---|---|---|---|---|---|---|---|---|---|---|---|---|
| Community | 2002 | 2003 | 2004 | 2005 | 2006 | 2007 | 2008 | 2009 | 2010 | 2011 | 2012 | 2013 | 2014 | 2015 |
| Pru Teow | 99.34 | 100.00 | 100.00 | 99.68 | 98.63 | 100.00 | 100.00 | 100.00 | 100.00 | 100.00 | 99.67 | 100.00 | 100.00 | 100.00 |
| Nam Khem | 89.33 | 98.77 | 100.00 | 100.00 | 100.00 | 98.94 | 99.34 | 100.00 | 100.00 | 100.00 | 100.00 | 99.87 | 100.00 | 100.00 |
| Bang Lud | 95.29 | 97.65 | 97.75 | 97.70 | 97.75 | 96.59 | 100.00 | 100.00 | 100.00 | 98.80 | 95.97 | 100.00 | 100.00 | 100.00 |
| Bang Sak 7 | 87.50 | 93.62 | 100.00 | 100.00 | 100.00 | 100.00 | 100.00 | 100.00 | 100.00 | 99.01 | 100.00 | 100.00 | 100.00 | 100.00 |
| Bang Sak 8 | 69.64 | 97.30 | 67.39 | 97.83 | 97.92 | 97.87 | 100.00 | 100.00 | 86.89 | 86.02 | 75.00 | 100.00 | 100.00 | 100.00 |
| Pak Wip | 50.00 | 98.21 | 100.00 | 42.20 | 49.07 | 100.00 | 100.00 | 100.00 | 100.00 | 100.00 | 99.31 | 100.00 | 100.00 | 100.00 |
| Bang Kaya | 78.13 | 98.13 | 97.70 | 49.43 | 55.68 | 100.00 | 100.00 | 100.00 | 100.00 | 100.00 | 100.00 | 99.36 | 100.00 | 100.00 |
| Khuk Khak | 95.77 | 99.02 | 98.59 | 98.76 | 97.55 | 100.00 | 97.76 | 100.00 | 100.00 | 100.00 | 100.00 | 100.00 | 100.00 | 100.00 |
| Bang Niang 5 | 74.39 | 100.00 | 98.32 | 48.15 | 82.87 | 90.72 | 97.18 | 100.00 | 100.00 | 100.00 | 99.12 | 100.00 | 100.00 | 100.00 |
| Muang Mai | 39.29 | 45.83 | 100.00 | 100.00 | 54.17 | 26.67 | 0.00 | 100.00 | 100.00 | 100.00 | 96.67 | 96.77 | 100.00 | 100.00 |
| Pak Koh | 22.22 | 7.50 | 36.59 | 32.43 | 100.00 | 97.37 | 91.67 | 100.00 | 100.00 | 100.00 | 100.00 | 100.00 | 100.00 | 100.00 |
| Thung Tuek | 100.00 | 88.00 | 90.00 | 100.00 | 95.83 | 75.00 | 70.00 | 100.00 | 89.47 | 94.74 | 96.00 | 88.00 | 96.00 | 92.31 |
| Triam | 93.30 | 93.42 | 96.73 | 96.67 | 81.94 | 77.03 | 65.31 | 100.00 | 93.01 | 98.08 | 99.41 | 100.00 | 100.00 | 99.55 |
| Thung La-ong | 44.76 | 73.53 | 71.30 | 71.03 | 71.03 | 72.16 | 81.25 | 96.85 | 100.00 | 98.71 | 100.00 | 100.00 | 97.64 | 100.00 |
| Pak Chok | 70.83 | 97.62 | 97.56 | 100.00 | 0.00 | 0.00 | 86.96 | 100.00 | 96.67 | 100.00 | 100.00 | 100.00 | 100.00 | 100.00 |
| Thung Rak | 92.54 | 92.13 | 100.00 | 100.00 | 79.61 | 82.56 | 99.59 | 93.15 | 100.00 | 98.76 | 100.00 | 99.19 | 100.00 | 99.22 |
| Lam Pee | 97.48 | 100.00 | 100.00 | 100.00 | 77.78 | 87.91 | 100.00 | 96.34 | 100.00 | 100.00 | 100.00 | 100.00 | 100.00 | 100.00 |
| Khao Lak | 94.92 | 93.10 | 92.19 | 98.39 | 98.51 | 98.28 | 89.74 | 100.00 | 100.00 | 100.00 | 100.00 | 100.00 | 100.00 | 100.00 |
Table 5.
Employment of people between 15 and 60 years old during 2002–2015.
| Year of Observation | ||||||||||||||
|---|---|---|---|---|---|---|---|---|---|---|---|---|---|---|
| Community | 2002 | 2003 | 2004 | 2005 | 2006 | 2007 | 2008 | 2009 | 2010 | 2011 | 2012 | 2013 | 2014 | 2015 |
| Pru Teow | 94.38 | 97.97 | 97.26 | 95.67 | 96.12 | 89.29 | 99.70 | 100.00 | 100.00 | 100.00 | 99.09 | 97.47 | 93.59 | 96.90 |
| Nam Khem | 93.94 | 99.52 | 99.91 | 100.00 | 100.00 | 98.63 | 100.00 | 100.00 | 100.00 | 100.00 | 99.86 | 100.00 | 100.00 | 100.00 |
| Bang Lud | 86.43 | 88.72 | 83.74 | 83.66 | 84.29 | 99.50 | 100.00 | 100.00 | 100.00 | 94.95 | 85.06 | 100.00 | 100.00 | 100.00 |
| Bang Sak 7 | 83.44 | 89.66 | 96.73 | 97.64 | 97.66 | 92.04 | 100.00 | 100.00 | 100.00 | 95.49 | 93.06 | 100.00 | 100.00 | 100.00 |
| Bang Sak 8 | 92.75 | 100.00 | 90.76 | 89.92 | 90.48 | 100.00 | 100.00 | 100.00 | 100.00 | 98.39 | 98.17 | 0.00 | 100.00 | 100.00 |
| Pak Wip | 78.21 | 95.44 | 100.00 | 64.37 | 64.05 | 96.98 | 100.00 | 99.75 | 100.00 | 100.00 | 95.96 | 94.81 | 94.00 | 96.80 |
| Bang Kaya | 87.02 | 99.59 | 100.00 | 99.05 | 99.52 | 80.99 | 98.26 | 100.00 | 100.00 | 99.38 | 97.25 | 96.23 | 90.30 | 95.56 |
| Khuk Khak | 94.97 | 98.65 | 94.92 | 99.57 | 99.57 | 98.70 | 100.00 | 99.69 | 100.00 | 99.62 | 98.82 | 98.12 | 94.80 | 95.74 |
| Bang Niang 5 | 90.83 | 99.40 | 96.61 | 66.39 | 87.12 | 91.34 | 100.00 | 98.96 | 100.00 | 100.00 | 97.01 | 98.46 | 94.27 | 96.09 |
| Muang Mai | 92.86 | 100.00 | 98.08 | 94.20 | 92.16 | 88.37 | 95.24 | 100.00 | 100.00 | 95.74 | 90.48 | 93.94 | 100.00 | 100.00 |
| Pak Koh | 71.95 | 100.00 | 93.41 | 67.74 | 78.82 | 95.45 | 88.62 | 100.00 | 100.00 | 86.76 | 82.61 | 100.00 | 100.00 | 100.00 |
| Thung Tuek | 87.23 | 97.92 | 92.98 | 69.23 | 83.05 | 75.56 | 90.79 | 100.00 | 100.00 | 97.96 | 91.43 | 96.67 | 96.88 | 96.55 |
| Triam | 94.30 | 95.77 | 97.08 | 97.29 | 89.23 | 84.70 | 94.18 | 91.62 | 95.05 | 81.67 | 99.11 | 100.00 | 100.00 | 98.21 |
| Thung La-ong | 94.79 | 96.74 | 95.77 | 95.75 | 95.75 | 95.26 | 90.57 | 95.45 | 100.00 | 96.55 | 98.71 | 100.00 | 100.00 | 100.00 |
| Pak Chok | 95.24 | 93.26 | 97.53 | 97.40 | 0.00 | 0.00 | 100.00 | 100.00 | 100.00 | 100.00 | 100.00 | 100.00 | 100.00 | 100.00 |
| Thung Rak | 93.28 | 94.74 | 98.73 | 98.71 | 97.64 | 97.71 | 98.26 | 100.00 | 100.00 | 100.00 | 98.67 | 98.05 | 100.00 | 99.78 |
| Lam Pee | 99.60 | 100.00 | 100.00 | 100.00 | 98.92 | 97.80 | 96.01 | 95.16 | 92.96 | 100.00 | 79.40 | 91.77 | 95.48 | 94.24 |
| Khao Lak | 95.08 | 92.06 | 92.36 | 95.04 | 83.33 | 82.84 | 73.98 | 100.00 | 97.20 | 100.00 | 99.47 | 97.06 | 97.34 | 99.49 |
Table 6.
Participation in the community’s activities during 2002–2015.
| Year of Observation | ||||||||||||||
|---|---|---|---|---|---|---|---|---|---|---|---|---|---|---|
| Community | 2002 | 2003 | 2004 | 2005 | 2006 | 2007 | 2008 | 2009 | 2010 | 2011 | 2012 | 2013 | 2014 | 2015 |
| Pru Teow | 90.70 | 97.68 | 93.22 | 95.89 | 97.09 | 95.49 | 100.00 | 100.00 | 100.00 | 100.00 | 100.00 | 100.00 | 100.00 | 100.00 |
| Nam Khem | 78.91 | 91.77 | 99.77 | 99.74 | 99.73 | 100.00 | 100.00 | 100.00 | 100.00 | 100.00 | 100.00 | 100.00 | 100.00 | 100.00 |
| Bang Lud | 78.82 | 81.18 | 75.28 | 100.00 | 100.00 | 100.00 | 100.00 | 100.00 | 100.00 | 96.41 | 100.00 | 100.00 | 100.00 | 100.00 |
| Bang Sak 7 | 88.24 | 92.55 | 96.00 | 95.88 | 95.92 | 100.00 | 100.00 | 100.00 | 100.00 | 96.04 | 100.00 | 100.00 | 100.00 | 100.00 |
| Bang Sak 8 | 96.30 | 96.00 | 90.00 | 100.00 | 100.00 | 100.00 | 100.00 | 100.00 | 100.00 | 100.00 | 100.00 | 100.00 | 100.00 | 94.87 |
| Pak Wip | 82.69 | 92.86 | 100.00 | 89.91 | 92.59 | 97.06 | 100.00 | 100.00 | 100.00 | 100.00 | 100.00 | 100.00 | 100.00 | 96.83 |
| Bang Kaya | 72.66 | 85.98 | 74.71 | 91.95 | 90.91 | 100.00 | 100.00 | 100.00 | 100.00 | 100.00 | 100.00 | 100.00 | 100.00 | 98.51 |
| Khuk Khak | 92.25 | 99.02 | 94.37 | 100.00 | 100.00 | 100.00 | 100.00 | 100.00 | 100.00 | 100.00 | 100.00 | 100.00 | 100.00 | 97.98 |
| Bang Niang 5 | 80.49 | 92.19 | 82.35 | 91.11 | 94.48 | 97.05 | 100.00 | 100.00 | 100.00 | 100.00 | 100.00 | 100.00 | 100.00 | 97.96 |
| Muang Mai | 96.43 | 100.00 | 100.00 | 100.00 | 95.83 | 100.00 | 100.00 | 100.00 | 100.00 | 100.00 | 100.00 | 100.00 | 100.00 | 91.94 |
| Pak Koh | 100.00 | 100.00 | 100.00 | 100.00 | 100.00 | 100.00 | 100.00 | 100.00 | 100.00 | 100.00 | 100.00 | 100.00 | 100.00 | 98.15 |
| Thung Tuek | 87.23 | 97.92 | 92.98 | 69.23 | 83.05 | 75.56 | 90.79 | 100.00 | 100.00 | 97.96 | 91.43 | 96.67 | 96.88 | 96.55 |
| Triam | 93.30 | 94.74 | 95.42 | 95.33 | 78.71 | 72.30 | 100.00 | 93.29 | 97.20 | 83.97 | 100.00 | 100.00 | 100.00 | 100.00 |
| Thung La-ong | 93.33 | 93.14 | 96.30 | 96.26 | 96.26 | 95.88 | 100.00 | 100.00 | 100.00 | 97.42 | 100.00 | 100.00 | 100.00 | 100.00 |
| Pak Chok | 54.17 | 100.00 | 97.56 | 97.56 | 0.00 | 0.00 | 100.00 | 91.30 | 96.67 | 93.75 | 100.00 | 100.00 | 100.00 | 100.00 |
| Thung Rak | 98.51 | 91.01 | 96.47 | 97.62 | 94.17 | 93.02 | 100.00 | 74.19 | 100.00 | 100.00 | 100.00 | 100.00 | 100.00 | 100.00 |
| Lam Pee | 94.96 | 99.17 | 90.67 | 100.00 | 92.59 | 96.70 | 94.01 | 92.68 | 93.42 | 100.00 | 100.00 | 100.00 | 96.82 | 100.00 |
| Khao Lak | 100.00 | 100.00 | 100.00 | 96.77 | 98.51 | 98.28 | 98.72 | 100.00 | 100.00 | 100.00 | 100.00 | 100.00 | 100.00 | 100.00 |
Disclaimer/Publisher’s Note: The statements, opinions and data contained in all publications are solely those of the individual author(s) and contributor(s) and not of MDPI and/or the editor(s). MDPI and/or the editor(s) disclaim responsibility for any injury to people or property resulting from any ideas, methods, instructions or products referred to in the content. |
© 2023 by the authors. Licensee MDPI, Basel, Switzerland. This article is an open access article distributed under the terms and conditions of the Creative Commons Attribution (CC BY) license (https://creativecommons.org/licenses/by/4.0/).
Share and Cite
MDPI and ACS Style
Kamthonkiat, D.; Leelawatthanaphong, T.; Unapumnuk, K.; Vu, T.T. Recovery Assessment of Permanent Housing after the 2004 Tsunami in Thailand toward Sustainable Planning. Sustainability 2023, 15, 4627. https://doi.org/10.3390/su15054627
AMA Style
Kamthonkiat D, Leelawatthanaphong T, Unapumnuk K, Vu TT. Recovery Assessment of Permanent Housing after the 2004 Tsunami in Thailand toward Sustainable Planning. Sustainability. 2023; 15(5):4627. https://doi.org/10.3390/su15054627
Chicago/Turabian StyleKamthonkiat, Daroonwan, Thanawan Leelawatthanaphong, Kessinee Unapumnuk, and Tuong Thuy Vu. 2023. "Recovery Assessment of Permanent Housing after the 2004 Tsunami in Thailand toward Sustainable Planning" Sustainability 15, no. 5: 4627. https://doi.org/10.3390/su15054627
Note that from the first issue of 2016, this journal uses article numbers instead of page numbers. See further details here.