
Evaluation and Analysis of the County-Level Sustainable Development Process in Guangxi, China in 2014–2020

1
School of Computer and Information Security, Guilin University of Electronic Technology, Huajiang Campus, Guilin 541004, China
2
International Research Center of Big Data for Sustainable Development Goals, Beijing 100094, China
3
China-ASEAN Regional Innovation Center for Big Earth Data, Nanning 530000, China
4
Key Laboratory of Digital Earth Science, Aerospace Information Research Institute, Chinese Academy of Sciences, Beijing 100094, China
*
Authors to whom correspondence should be addressed.
Sustainability 2024, 16(4), 1641; https://doi.org/10.3390/su16041641
Submission received: 20 December 2023
/
Revised: 27 January 2024
/
Accepted: 1 February 2024
/
Published: 16 February 2024
(This article belongs to the Topic Digital Environment Technology for Supporting Regional Sustainable Development)
Abstract
:Sustainable development has become a scientific and decision-making consensus in countries and regions around the world. The current research on sustainable development mainly focuses on urban areas with a high level of economic development and intensive land use. Small-scale research, especially for underdeveloped areas, is required to reveal the spatial patterns and differences within administrative units. This study focuses on 1241 towns in Guangxi to assess the sustainable development process and variations at the township scale from 2014 to 2020 by using the entropy method, the coupled coordination degree method, and cluster analysis. The results show that the average sustainable development goal composite index (SDGCI) of towns in Guangxi is around 0.12, and their overall sustainable development level is low. The SDGCI of towns in the central region shows an increasing trend, while that in the northern and southern regions shows a decreasing trend. Then, the SDGs are divided into three systems, namely people, planet, and prosperity. The prosperity system contributes the most to the overall SDGCI, and the low values of the people and planet systems are the reason for the low level of sustainable development in Guangxi. The coupling degree of the SDGCI among the three systems is at a high level, and the level of coupling coordination degree is good, which indicates high consistency and close linkage of the towns in Guangxi when pursuing the SDGs. The results of hierarchical cluster analysis show that towns in Guangxi can be divided into three categories to adapt to different features based on SDGCI values. The assessment of SDG process in towns in Guangxi could guide local governments to refine their development policy, formulate and adjust development strategies in a targeted manner, and promote balanced and sustainable development under townships.
1. Introduction
In order to address the imbalance of regional development in different parts of the world, the United Nations adopted the “Transforming our World: The 2030 Agenda for Sustainable Development” in 2015, which consists of 17 Sustainable Development Goals (SDGs) and 169 targets [1], providing the world with a global framework to tackle significant global challenges such as climate change, poverty, hunger, inequality, environmental damage, and social instability. Those have always been hot issues of widespread concern in the scientific community, i.e., (1) how to measure and analyze the process of global human social development by scientific methods and (2) how to reveal the spatial disparity of human social development in the world and its dynamic evolution characteristics. For example, Decancq et al. [2], McGillivray et al. [3], and Jordáet et al. [4] used the human development index (HDI) as the primary measure of the level of human social development and studied in depth the imbalance of human social development worldwide. Böhnke et al. [5] applied a combined objective–subjective evaluation model to evaluate the level of human welfare and analyze the factors influencing its inequality in various countries worldwide. Goff et al. [6] explored the main factors influencing the inequality of human social welfare based on a measure of life satisfaction data. Sustainable development, which emphasizes balance and coordination among the economy, society, and environment, provides a crucial theoretical basis for realizing sustainable prosperity for humankind. The concept of sustainability dates back to the environmental protection movement in the 1960s. Milestone events were the “The Limits to Growth” report by the Club of Rome [7] and the United Nations Conference on the Human Environment held in Stockholm in 1972. Then, the World Commission on Environment and Development (WCED) published the report “Our Common Future” to first define sustainable development as “meeting the needs of the present without compromising the ability of future generations to meet their own needs” [8]. The United Nations Conference “Earth Summit” held in 1992 was another breakthrough, which marked the formulation of Agenda 21 and the start of the United Nations Framework Convention on Climate Change [9]. The Commission on Sustainable Development was launched later. In 2000, specific goals and targets were proposed as the Millennium Development Goals (MDGs) to address worldwide concerns such as poverty, hunger, disease, illiteracy, environmental degradation, and discrimination against women. Following the MDGs, the United Nations expanded the scopes of the goals and introduced the world’s Sustainable Development Goals (SDGs) for 2030 in 2015 [1]. The proposal of SDGs has provided a practical methodology and measurement index for analyzing global human social development, bringing together the concerns and contributions of the worldwide community on sustainable development.
The sustainable development process varies from region to region due to policies, geographic location, environmental conditions, and other factors [10,11]. In China, the eastern part of the country is highly developed, while the western part is underdeveloped [12]. The persistence of regional imbalance affects economic efficiency, social welfare and harmony [13]. Research on Chinese regional sustainable development began in the 21st century, and the relevant studies are categorized into single-indicator assessment, multi-indicator assessment, and comprehensive assessment. For single-indicator assessment, Xu et al. [14] used SDG11 indicators to assess the sustainable development of 27 cities in the Yangtze River Delta, China. Wu [15] combined SDG11.4 with remote sensing data to quantitatively assess the ecological environment quality of typical natural heritage sites, such as Mount Huang, Mount Wuyi, and so on. Zhang et al. [16] monitored and assessed SDG11 indicators in 18 cities and counties in Hainan Province. Scientists are increasingly inclined to evaluate multiple indicators in a spatiotemporal manner. As the assessment of sustainable development tends to be more systematic, some scholars assess the indicator system from various aspects. Xu et al. [17] focused on the 17 goals and 119 indicators of SDGs to evaluate the process of sustainable development at the national and provincial levels in China based on the statistical data. Jia et al. [18] proposed an evaluation index system for ecological development in Qinghai Province based on economic development, social progress, and ecological protection. Ding et al. [19] measured the pattern of the coupled coordination degree of the three major systems of land use, high-quality economic development, and carbon emission in 282 prefectural-level cities in China from the perspective of spatial and temporal changes in 2006–2019. Since 2018, the Chinese government has successively set up several National Sustainable Development Agenda Innovation Demonstration Zones, such as Taiyuan, Guilin, Shenzhen, Chenzhou, Lincang, and Chengde.
The imbalance of the sustainable development process also exists between urban and rural areas. Assessing the process of sustainable development goals at a small scale [20] is the basis for clarifying regional development issues and promoting synergistic urban–rural sustainable development. Studies on the European urban system considered that towns are especially important for the development of sustainability potential, i.e., (1) towns located in the proximity of large cities are subject to the “borrowing-size” effect and (2) towns embedded in a specialized agricultural area (rural towns) have a bidirectional relationship with the surrounding rural settlements [21]. In China, rural revitalization and synergistic urban–rural development are always top priorities for the government [22]. Towns serve as an important transition area between urban and rural areas and an essential hub for the interactive development of urban and rural areas. The current township research mainly focuses on specific aspects of sustainability, such as land utilization, tourism development, cultural protection, and village patterns. For example, Zeng [23] established a sustainable land utilization evaluation index system for Nancheng County, Jiangxi Province, to assess the sustainability of its land resources. Huang [24] analyzed the current situation of rural tourism development in Mashan County, Guangxi, by combining literature research and a field survey. Pi [25] constructed the evaluation index system for sustainable tourism development in traditional villages by using the hierarchical analysis method in Guangxi, with eight subsystems and 36 indexes belonging to the four aspects of economy, society, culture, and ecology based on an expert questionnaire. Zeng et al. [26] tried to evaluate the sustainable development capacity by using principal component analysis (PCA) in Changtang Town, Guangxi.
Summarily, the above studies are mostly based on statistical data or interview surveys. Due to the limited number of data sources, the assessment of the efforts to achieve the Sustainable Development Goals is mainly performed at the provincial or municipal level. These studies therefore cannot effectively reveal the spatial patterns and differences within administrative units, such as the urban–rural relationships. At a small scale, current township research mainly focuses on specific aspects of sustainability. The evaluation indicators are formed by highly subjective questionnaires with certain types of indicators, and some of them are difficult to quantify. There is, therefore, an urgent need for more granular data to assess the efforts to achieve the Sustainable Development Goals at an acceptable (township) scale.
Monitoring the indicators of the Sustainable Development Goals is paramount, and Earth observation technologies such as remote sensing (RS) are essential tools. With the rapid development of aerospace technology, remote sensing techniques are significantly advancing. Several Earth observation systems have been successfully built with global coverage, which can rapidly and accurately acquire Earth observation data at a wide range of spatial, temporal, and spectral resolutions, thus providing excellent data support for assessing SDGs. As early as 30 years ago, Rao et al. [27] foresaw the potential of RS technology in sustainability-related research. With the introduction of the SDGs, some scholars have proposed concepts such as “sustainability remote sensing” [28] and “sustainability seen from space” [29], and the Group on Earth Observations (GEO) has launched the Earth Observations for the Sustainable Development Goals (EO4SDG) initiative [30]. In addition, big Earth data, including remote sensing data, have been widely used in urban monitoring [31] and air quality monitoring [32] for SDG11, climate change research [33] for SDG13, land cover monitoring and ecosystem assessment [34] for SDG14, and hydrological and water resources research [35] for SDG6. The accurate and dynamic monitoring capability of big Earth data provides an essential tool for sustainable development evaluation [36]. Guo et al. [37] introduced the realization of big Earth data in assessing SDG indicators to comprehensively analyze the process of SDGs 2, 6, 11, 13, 14, and 15 in China for 2010–2020. Han et al. [38] confirmed that the SDG 11 indicator assessment framework based on satellite imageries and geospatial data has excellent application in Guilin, Guangxi, and could be applied to other cities for targeted planning and assessment. Remote sensing emerges as a crucial monitoring tool, bridging the spatial coverage and temporal frequency gaps evident in existing observational data [30,39]. The advantages of remote sensing data, characterized by high spatial and temporal resolution, make them invaluable for SDG monitoring. Furthermore, remote sensing data facilitate examining and identifying priority areas for sustainable management [40]. Applying remote sensing data to township-level studies could effectively improve the efficiency and quality of evaluating the sustainable development process on a regional scale.
This paper mainly focuses on three aims in order to achieve the research objectives: (1) to assess the spatial and temporal variations of sustainable development goals at the township scale; (2) to analyze sustainable development process in towns under different dimensions by dividing the indicator data into different subsystems; and (3) to classify the types of towns based on their process of sustainable development goals as to support decision-making by adaption to the local conditions of different townships. Located in southwestern China and connected to the Association of Southeast Asian Nations (ASEAN), Guangxi has rich natural ecological resources and diversified cultural backgrounds, and is characterized by diverse karst landscapes, widespread mountainous terrain, and severe rocky desertification. Its geographic fragility and cultural complexity constrain local socio-economic development, and unbalanced regional development is a prominent problem in Guangxi, which makes it a valuable area for sustainable development assessment. In this study, we establish an SDG composite index (SDGCI) by using the entropy method to integrate 25 SDG-related factors. Then, the spatial and temporal changes in the SDGCI at the scale of townships (1241 towns) in Guangxi were evaluated in 2014–2020. Furthermore, the SDG indicators were divided into the systems of people, planet, and prosperity under the United Nations classification. Lastly, the towns were clustered into different types based on their SDGCI values, so as to provide guidance for the local government on the fine-tuning of the development policy, and to promote the balanced and sustainable development of the townships.
2. Study Area and Data
2.1. Overview of the Study Area
The Guangxi Zhuang Autonomous Region (GZAR) is located in southwestern China, between latitudes of 20°54′ and 26°24′ N and longitudes of 104°26′ and 112°04′ E, with a total landmass area of about 237,600 km2. The geographical features of Guangxi include mountains, plains, rivers, and coastlines, which could be roughly divided into the karst landscape area in the south and the mountains and plains area in the north, as shown in Figure 1. Guangxi has a warm climate with abundant rainfall and ample sunlight, with an average annual temperature ranging from 17.5 to 23.5 °C. The precipitation varies between 800 and 2000 mm. The climate in Guangxi exhibits distinct seasonal differences, with hot and rainy summers and warm and dry winters.
According to the 2021 statistics, the GZAR is governed by 14 prefecture-level administrative units, 109 county-level units, and 1241 townships. At the end of 2021, the total resident population of the region was 50.47 million, of which 28.09 million were urban residents, accounting for 55.66% of the resident population.
2.2. Data
In this study, we use various big Earth data, covering 15 target indicators of SDGs and 25 datasets (Table 1), to transform the gridded data into township-scale irregular spatial unit data using a zonal statistical method, and then to carry out township-scale sustainable development assessment. For data with a spatial resolution of 10 km, the approximate nearest neighbor resampling method was used to obtain zonal statistics. For data with a higher spatial resolution, the mean resampling method was used; especially particular, for preparing the percentage of cultivated land area, surface water area, forest area, the sum resampling method was used. The research period of this study was 2014–2020. To address the issue of insufficient or missing data in specific years, the analysis primarily relied on data from the preceding year. The correspondence between the SDG indicators and the datasets is shown in the table below.
3. Method
3.1. SDGCI Calculation and Change Analysis
Given that the entropy method could objectively weight the data and avoid subjectivity, this study established an SDG composite index (SDGCI) to integrate 25 SDG-related factors by employing the entropy method. The detailed calculation process was as follows.
In the initial step, positive and negative indicators were normalized to eliminate masking effects and differences in magnitude among the data.
where Xij represents the value of indicator j in township i; Zij is the normalized value of Xij, and if Zij is 0, it is replaced by 0.0001; and maxXij and minXij represent the maximum and minimum values of Xij, respectively.
In the second step, the weights of the indicators were calculated based on the calculation of entropy.
where pij is the proportion of indicator j to the sum of all the indicator values for township i, n is the number of townships, ej is the entropy value of indicator j, wj is the weight of indicator j, and m denotes the number of indicators.
The third step was to calculate the SDG composite index (SDGCI) of each town for each year. The SDGCI is a weighted sum of all the SDG indicators. It represents the combination measurement of SDG indicators, which is calculated by multiplying the standardized value of the indicators by their weights and then summing the products by all the indicators.
3.2. Classification and Cluster Analysis of SDG Indicator System
Existing research indicates a synergistic and balanced relationship between the partial and holistic goals. Classification and cluster analysis could simplify the complex relationships between goals and improve the SDG’s intersectoral management [54]. In this study, we adopted the United Nations SDG classification [1] to categorize SDG indicators of towns in Guangxi into three systems: people (SDG1~7), planet (SDG8~12), and prosperity (SDG13~15). The SDGCI values for these three systems could be calculated according to the method in Section 3.1.
In order to further measure the contribution of each system to the overall SDGCI and their interrelationship, this study invoked the coupling coordination degree method to analyze the coupling coordination degree among systems, and the formula is as follows:
where Upeople, Uplanet and Uprosperity represent the SDGCI values of the three systems, respectively. C is the coupling degree. D is the coupling coordination degree. , which represents the average of the SDGCI values of the three systems.
In order to analyze the distribution of SDGCIs for the three systems and explore the differences and correlations among different townships, this study carried out cluster analysis by using SDGCIs of the three systems as inputs. The hierarchical clustering method is based on the similarity of distance among data points. The advantages of the hierarchical clustering method are that (1) the similarity of distances is easy to define with few restrictions, and (2) the number of clusters does not need to be given in advance [55]. The number of clusters was determined according to the elbow rule [56], and the cluster distribution of each town in Guangxi under the United Nations SDG classification was finally obtained.
4. Results
4.1. Spatial and Temporal Changes of SDGCI
Figure 2 shows the spatial distribution of SDGCI in Guangxi townships from 2014 to 2020. The spatial pattern of SDGCI in Guangxi is characterized as “high in the southern and central region and low in the surrounding areas”. From 2014 to 2020, the average value of the SDGCI of towns in Guangxi is around 0.12. The maximum value of the SDGCI of townships fluctuates at about 0.45, indicating that the comprehensive sustainable development level of townships in Guangxi is relatively low. The towns with an SDGCI value of more than 0.3 are mainly distributed in the urban centers and the flat areas, and there are significant regional differences. As shown in Table 2, from 2014 to 2020, about 35% of the towns in Guangxi have an SDGCI of 0.1 or less; about 57% of the towns have an SDGCI between 0.1 and 0.2; about 7% of the townships have an SDGCI between 0.2 and 0.3; and the proportion of townships with an SDGCI greater than 0.3 is about 1%. The number of townships in Guangxi with an SDGCI greater than 0.3 ranges from 11 to 19, with the least being observed in 2018 and 2020, the most in 2015, and a decrease in 2020 compared to 2014.
We calculated the annual changes in the SDGCI in Guangxi townships in 2014–2020 (Figure 3). Summarily, the towns with a negative change in SDGCI are mainly distributed in the northern and southern regions, and those with a positive change are mainly distributed in the central part of Guangxi. Developing townships in the northern and southern regions need more attention and strengthening.
4.2. SDGCI Changes and Relationship Analysis for Different Systems
4.2.1. SDGCI Changes Based on United Nations SDG Classification
Figure 4 illustrates the spatial distribution of SDGCI of the three systems based on the United Nations SDG classification in 2015 and 2020. Overall, the SDGCI of the prosperity system contributes the most to the overall results. The average SDGCI value of the prosperity system is greater than the sum of the values of the people and planet systems (Table 3). Most towns have Upeople and Uplanet values below 0.2, while the value of Uprosperity is larger than 0.2. The SDG indicators of the prosperity system in Guangxi have been well developed, and the underdevelopment of Upeople and Uplanet constrains the improvement of the overall SDGCI of towns. It is necessary to strengthen the development of people and planet system indicators, such as strengthening the utilization and protection of cultivated land, controlling pollution emissions strictly, reducing the production of urban particulate matter, and strengthening infrastructure construction.
4.2.2. Spatial and Temporal Variations of SDGCI Coupling Degree (SDGCI_CD) among Different Systems
The spatial distribution of SDGCI_CD among different systems at the township scale in Guangxi is analyzed, as shown in Figure 5. Overall, the SDGCI_CD among the three systems is very high, and the average coupling degree is higher than 0.85 in both 2015 and 2020. Furthermore, according to the classification of the coupling degree level [19], the coupling degree is at a high level. The towns with a high SDGCI_CD in 2015 are mainly distributed in the southwest and northeastern regions of Guangxi. In 2020, the towns with a high SDGCI_CD extend towards the southeastern region. Compared with that in 2015, the SDGCI_CD values of towns in the northwest of Guangxi decrease in 2020, while those in the southeast increase. The value of SDGCI_CD change shows an increasing trend from northwest to southeast. As shown in Table 4, the number of towns with SDGCI_CD > 0.8 increases by 5% (62) in 2020 compared to that in 2015.
4.2.3. Spatial and Temporal Variations of SDGCI Coupling Coordination Degree (SDGCI_CCD) among Different Systems
The spatial distribution of SDGCI_CCD among different systems at the township scale in Guangxi is analyzed, as shown in Figure 6. The SDGCI_CCD of most towns in Guangxi in 2015 and 2020 ranges between 0.3 and 0.5. The towns with an SDGCI_CCD of more than 0.5 are sporadically distributed in flat areas or close to urban areas, with high coupling coordination. Compared with 2015, the SDGCI_CCD of towns in most regions of Guangxi shows a decreasing trend, while the SDGCI_CCD of the western and eastern regions shows an increasing trend in 2020. The number of towns with decreasing SDGCI_CCD values is more than those whose SDGCI_CCD increases. As shown in Table 5, the number of towns with an SDGCI_CCD greater than 0.4 decreases by 108 in 2020 compared with 2015.
4.3. Differences and Linkages of SDGCI in Townships: Results of Cluster Analysis
A cluster analysis is carried out on SDGCI of the towns in Guangxi under the United Nations SDG classification, and the number of clusters is determined to be three based on the elbow rule.
As shown in Figure 7 and Table 6, the towns in Guangxi are classified into three categories based on the SDGCI values of the three systems under the United Nations SDG classification in 2015 and 2020. The first type of town (Cluster 1) exhibits high SDGCI values for prosperity system and low values for people and planet systems. These towns are mainly distributed in the marginal regions in 2015 and extend towards the west and central regions in 2020. The second type of town (Cluster 2) exhibits moderate performance for all three systems by considering SDGCI values. These towns are mainly distributed in the central part of Guangxi in 2015 and shrink into the southeast part in 2020. The third type of town (Cluster 3) has high SDGCI values for the planet system and low values for people and prosperity systems. These towns are sporadically distributed in the central and southern regions in 2015 and 2020. Compared with 2015, the number of towns in the first category increases significantly, while that in the second category decreases and that in the third category remains almost the same. Different towns possess different features. The three systems of the second type of town develop in a balanced way. The prosperity system of the first type of town develops prominently, and the planet system of the third type of town develops well. It is necessary to adapt to the local conditions of different towns in formulating policies and implementing planning.
5. Discussions
Based on existing research, this study applies big Earth data to the assessment of sustainable development indicators, which partly solves the problem of insufficient and missing statistical data, and also achieves the characterization of spatial differences in the sustainable development goals [57]. This study takes Guangxi as an example to assess the sustainable development process at the township scale, which shall provide a reference for assessing sustainable development process at fine scales.
Comparing with the results of existing studies, Xu et al. [17] assessed the SDG process at the provincial scale in China from 2000 to 2015 every five years, and Wang et al. [58] assessed the development of environment-related SDG indicators at the provincial scale in China from 2010 to 2018 for each year. This study further assesses the SDG process at township scale in Guangxi from 2014 to 2020 every year. We extend the SDG assessment to the post-COVID-19 era and focus on the finer scale of townships. Xu et al. found that the overall SDG composite index of Guangxi showed an increasing trend from 2000 to 2015. Wang et al. found that the SDG composite index of Guangxi showed an increasing trend from 2010 to 2016 and illustrated a decreasing trend from 2016 to 2018. This study further discovers that the SDG composite index in Guangxi increased in 2014–2017 and decreased in 2017–2020 at the township scale, which is consistent with the results of existing studies.
To analyze the relationship between SDGCI and SDG indicators further, we calculate the Pearson correlation coefficient (PCC) between SDGCI and 25 variables used in this study for each year (Table 7). The results show that most of the variables (18 in 25) have a linear relationship with SDGCI at a high significance level (** p value < 0.01), in which the gross domestic product, actual electricity consumption, cultivated land area, nighttime lighting index, surface water area, rice cultivation area and maize cultivation area have a strong positive relationship with SDGCI (PCC > 0.5). PM2.5, potential evapotranspiration, PM10 and fossil fuel emission are strongly negatively correlated with SDGCI (PCC < −0.4). Primarily, it can be concluded that SDGCI in towns of Guangxi is highly related to their agriculture, economy, water resources and air pollutant emission. Accordingly, corresponding policy recommendations are proposed:
- (1)
- Protection of cultivated land. The results show that both cultivated land and rice cultivation areas have a strongly positive relationship with SDGCI. While guaranteeing the quantity of cultivated land, we should ensure its spatial production suitability and improve the matching of crops and cultivated land [59].
- (2)
- Protection of the natural environment, especially the surface water environment. Ecosystem quality index and forest area contribute to SDGCI positively at a significant level, while surface water area and potential evapotranspiration have a strong relationship with SDGCI. Ecosystem conservation could integrate biodiversity conservation, ecological restoration, and water resource exploitation and protection, and promote the establishment of comprehensive conservation policies, laws and ecological compensation measures [60,61].
- (3)
- Improvement of infrastructure construction. Although the contribution of the distance to a railway, road, and hospital to SDGCI in Guangxi is low, the relationships between distance to a railway and road and SDGCI are significant (* p < 0.05). Guangxi is famous for its beautiful natural environment and rich tourism resources. The coordinated development of interregional, urban and rural transportation could meet economic and tourism development needs [62].
- (4)
- Control of environmental pollution: Atmospheric pollutants such as PM2.5, PM10, SO2, CO, O3 and fossil fuel emissions negatively correlate with SDGCI in Guangxi. The following suggestions are put forward: vigorously developing green transportation and controlling traffic pollution, regulating high-polluting industries, improving clean production in various industries, and developing clean energy [63].
In all, the key to SDGs is to balance the economy and environment under ecological and environmental constraints and promote high-quality and green development of the economy.
The results obtained in this study on the assessment of sustainable development process at the township scale still have certain limitations. The following improvements need to be made in future research: (1) The number of sustainable development goal indicators is still limited, and a more comprehensive range of data still need to be collected. (2) The data sources in this study are diverse, and the data consistency could cause uncertainties. (3) The data with coarse spatial resolution could lead to uncertainties when obtaining zonal statistics for towns with smaller area.
6. Conclusions
This study takes 1241 townships in Guangxi as the study area. We characterized spatial and temporal changes in the sustainable development composite index from 2014 to 2020 at the township scale. The results obtained are as follows:
- (1)
- The average value of SDGCI in Guangxi is around 0.12. The SDGCI level of townships in Guangxi is low, and the development of towns in the northern and southern regions needs to be strengthened.
- (2)
- The SDGCI value of the prosperity system contributes the most to the overall SDGCI. It is necessary to strengthen the development of people and planet system indicators, such as strengthening the utilization and protection of cultivated land, controlling pollution emissions, and strengthening infrastructure construction.
- (3)
- The towns in Guangxi are categorized into three clusters based on SDGCI values of the three systems. Thus, the sustainable development capacity of Guangxi could be improved by adapting to the local conditions of different towns.
Sustainable development is necessary in the towns of Guangxi. While gross domestic product, cultivated land area, and surface water area contribute positively to SDGCI, PM2.5, potential evapotranspiration, PM10 and fossil fuel emission negatively influence SDGCI in the towns of Guangxi. The key to SDGs is to balance the economy and environment under ecological and environmental constraints. This study could guide local governments to refine their development policy based on the different types of towns, and promote the balanced, sustainable development of towns to narrow the gaps between them in the process of achieving the SDGs.
Author Contributions
Conceptualization, L.S., G.J. and Y.Q.; methodology, L.S., G.J. and Y.Q.; software, L.S. and G.J.; validation, L.S.; formal analysis, L.S. and G.J.; investigation, L.S., G.J., Y.Q. and J.L.; resources, G.J. and Y.Q.; data curation, L.S. and G.J.; writing—original draft preparation, L.S.; writing—review and editing, G.J. and Y.Q.; visualization, L.S. and G.J.; supervision, G.J., Y.Q. and J.L.; project administration, G.J. and Y.Q.; funding acquisition, G.J. and Y.Q. All authors have read and agreed to the published version of the manuscript.
Funding
This research was funded by the National Key R&D Program of China (Project No. 2022YFC3800700) and the Innovation Drive Development Special Project of Guangxi (Guike AA20302022).
Institutional Review Board Statement
Not applicable.
Informed Consent Statement
Not applicable.
Data Availability Statement
Data are contained within this article.
Acknowledgments
The authors sincerely thank the editor and anonymous reviewers for their valuable comments and suggestions to improve the quality of this paper.
Conflicts of Interest
The authors declare no conflicts of interest.
References
- United Nations. Transforming Our World: The 2030 Agenda for Sustainable Development; United Nations: New York, NY, USA, 2015; pp. 1–128. [Google Scholar]
- Decancq, K.; Decoster, A.; Schokkaert, E. The evolution of world inequality in well-being. World Dev. 2009, 37, 11–25. [Google Scholar] [CrossRef]
- McGillivray, M.; Markova, N. Global inequality in well-being dimensions. J. Dev. Stud. 2010, 46, 371–378. [Google Scholar] [CrossRef]
- Jordá, V.; Sarabia, J. Well-being distribution in the globalization era: 30 years of convergence. Appl. Res. Qual. Life 2015, 10, 123–140. [Google Scholar] [CrossRef]
- Böhnke, P.; Kohler, U. Well-being and inequality. In Handbook of European Societies; Immerfall, S., Therborn, G., Eds.; Springer: New York, NY, USA, 2010; pp. 629–666. [Google Scholar]
- Goff, L.; Helliwell, J.F.; Mayraz, G. The Welfare Costs of Well-Being Inequality; National Bureau of Economic Research Cambridge: Cambridge, MA, USA, 2016; pp. 1–35. [Google Scholar]
- Meadows, D.H.; Meadows, D.H.; Randers, J.; Behrens, W.W. The Limits to Growth: A Report for the Club of Rome’s Project on the Predicament of Mankind; Universe Books: New York, NY, USA, 1972; pp. 1–211. [Google Scholar]
- World Commission on Environment and Development. Report of the World Commission on Environment and Development: Our Common Future; Oxford University Press: Oxford, UK, 1987; pp. 1–300. [Google Scholar]
- Parson, E.A.; Haas, P.M.; Levy, M.A. A summary of the major documents signed at the Earth Summit and the Global Forum. Environ. Sci. Policy Sustain. Dev. 1992, 34, 12–36. [Google Scholar] [CrossRef]
- Appleton, S.; Song, L.; Xia, Q. Understanding urban wage inequality in China 1988–2008: Evidence from quantile analysis. World Dev. 2014, 62, 1–13. [Google Scholar] [CrossRef]
- Yue, W.; Zhang, Y.; Ye, X.; Cheng, Y.; Leipnik, M. Dynamics of multi-scale intra-provincial regional inequality in Zhejiang, China. Sustainability 2014, 6, 5763–5784. [Google Scholar] [CrossRef]
- Wu, X.; Song, X. Ethnic stratification amid China’s economic transition: Evidence from the Xinjiang Uyghur Autonomous Region. Soc. Sci. Res. 2014, 44, 158–172. [Google Scholar] [CrossRef]
- Fan, S.; Kanbur, R.; Zhang, X. China’s regional disparities: Experience and policy. Rev. Dev. Financ. 2011, 1, 47–56. [Google Scholar] [CrossRef]
- Xu, X.; Gao, J.; Zhang, Z.; Fu, J. An assessment of Chinese pathways to implement the UN sustainable development goal-11 (SDG-11)—A case study of the Yangtze river delta urban agglomeration. Int. J. Environ. Res. Public Health 2019, 16, 2288. [Google Scholar] [CrossRef]
- Wu, Q. Research on Remote Sensing Monitoring and Evaluation of Natural Heritage Site Ecological Environment Oriented to SDG11.4. Master’s Thesis, University of Chinese Academy of Sciences, Beijing, China, 2021. (In Chinese). [Google Scholar]
- Zhang, C.; Sun, Z.; Xing, Q.; Sun, J.; Xia, T.; Yu, H. Localizing indicators of SDG11 for an integrated assessment of urban sustainability—A case study of Hainan province. Sustainability 2021, 13, 11092. [Google Scholar] [CrossRef]
- Xu, Z.; Chau, S.N.; Chen, X.; Zhang, J.; Li, Y.; Dietz, T.; Wang, J.; Winkler, J.A.; Fan, F.; Huang, B. Assessing progress towards sustainable development over space and time. Nature 2020, 577, 74–78. [Google Scholar] [CrossRef]
- Jia, H.; Shao, L.; Luo, S. Comprehensive Evaluation of Ecological Civilization in Qinghai Province Based on Entropy Method and Coupling Coordination Degree Model. Ecol. Econ. 2020, 36, 215–220. (In Chinese) [Google Scholar]
- Ding, X.; Wu, Q.; Liu, X.; Tan, L.; Wang, J. Coupling and coordination degree of land use, high-quality economic development, and carbon emissions and influencing factors in China: An empirical study of 282 prefecture-level cities. Resour. Sci. 2022, 44, 2233–2246. (In Chinese) [Google Scholar] [CrossRef]
- Miao, J.; Song, X.; Feng, R.; Quan, X.; Gao, F.; Huang, C.; Zhao, X.; Zhong, F.; Cheng, Q.; Wei, Y. Study on the interaction between sustainable development goals in underdeveloped mountainous areas: A case study of Lincang, Yunnan Province. Adv. Earth Sci. 2022, 37, 949–962. (In Chinese) [Google Scholar]
- Alonso, W. Urban zero population growth. In The No-Growth Society, 1st ed.; Routledge: London, UK, 2013; pp. 191–206. [Google Scholar]
- Wang, Q.; Wu, J.; Bian, Z. Village Habitat Environment Evaluation Based on Entropy Right Method under the Perspective of Rural Revitalization. Agrar. Econ. 2020, 36–37. (In Chinese) Available online: https://kns.cnki.net/kns8s/defaultresult/index?crossids=YSTT4HG0%2CLSTPFY1C%2CJUP3MUPD%2CMPMFIG1A%2CWQ0UVIAA%2CBLZOG7CK%2CEMRPGLPA%2CPWFIRAGL%2CNLBO1Z6R%2CNN3FJMUV&korder=SU&kw=%E4%B9%A1%E6%9D%91%E6%8C%AF%E5%85%B4%E8%A7%86%E8%A7%92%E4%B8%8B%E5%9F%BA%E4%BA%8E%E7%86%B5%E6%9D%83%E6%B3%95%E7%9A%84%E6%9D%91%E5%9F%9F%E4%BA%BA%E5%B1%85%E7%8E%AF%E5%A2%83%E8%AF%84%E4%BB%B7 (accessed on 10 January 2024).
- Zeng, W. A Case Study on Land Resource Use and Sustainable Development in County Area. Master’s Thesis, East China University of Technology, Shanghai, China, 2012. (In Chinese). [Google Scholar]
- Huang, L. Research on the Sustainable Development of Tourism in Xiaodubai Village of Mashan County in Guangxi. Master’s Thesis, Central China Normal University, Wuhan, China, 2021. (In Chinese). [Google Scholar]
- Pi, H. Study on Sustainable Development Evaluation of Traditional Villiage Tourism in Guangxi. Master’s Thesis, Guangxi Minzu University, Nanning, China, 2023. (In Chinese). [Google Scholar]
- Zeng, B.; Zhang, X.; Wu, F.; Wu, Y.; Wei, N.; Cheng, P.; Wang, Y. Evaluation of the sustainable development capacity of townships based on principal component analysis methods. Sci. Technol. Ind. 2016, 16, 106–110. (In Chinese) [Google Scholar]
- Rao, U.R. Remote sensing for sustainable development. J. Indian Soc. Remote 1991, 19, 217–235. [Google Scholar] [CrossRef]
- Weng, Q. Remote Sensing for Sustainability, 1st ed.; CRC Press: Boca Raton, FL, USA, 2016; pp. 1–383. [Google Scholar]
- Andries, A.; Morse, S.; Murphy, R.J.; Lynch, J.; Woolliams, E. Seeing sustainability from space: Using Earth observation data to populate the UN sustainable development goal indicators. Sustainability 2019, 11, 5062. [Google Scholar] [CrossRef]
- Anderson, K.; Ryan, B.; Sonntag, W.; Kavvada, A.; Friedl, L. Earth observation in service of the 2030 Agenda for Sustainable Development. Geo-Spat. Inf. Sci. 2017, 20, 77–96. [Google Scholar] [CrossRef]
- Weng, Q.; Lu, D.; Schubring, J. Estimation of land surface temperature–vegetation abundance relationship for urban heat island studies. Remote Sens. Environ. 2004, 89, 467–483. [Google Scholar] [CrossRef]
- Martin, R.V. Satellite remote sensing of surface air quality. Atmos. Environ. 2008, 42, 7823–7843. [Google Scholar] [CrossRef]
- Yang, J.; Gong, P.; Fu, R.; Zhang, M.; Chen, J.; Liang, S.; Xu, B.; Shi, J.; Dickinson, R. The role of satellite remote sensing in climate change studies. Nat. Clim. Change 2013, 3, 875–883. [Google Scholar] [CrossRef]
- de Araujo Barbosa, C.C.; Atkinson, P.M.; Dearing, J.A. Remote sensing of ecosystem services: A systematic review. Ecol. Indic. 2015, 52, 430–443. [Google Scholar] [CrossRef]
- Crow, W.T.; Chen, F.; Reichle, R.H.; Liu, Q. L band microwave remote sensing and land data assimilation improve the representation of prestorm soil moisture conditions for hydrologic forecasting. Geophys. Res. Lett. 2017, 44, 5495–5503. [Google Scholar] [CrossRef]
- An, P.; Xiao, X.; Guo, H.; Yan, D.; Li, J. Big Earth Data Research Topic Evolution and Influence Analysis. Bull. Chin. Acad. Sci. 2021, 36, 973–988. (In Chinese) [Google Scholar]
- Guo, H.; Liang, D.; Sun, Z.; Chen, F.; Wang, X.; Li, J.; Zhu, L.; Bian, J.; Wei, Y.; Huang, L. Measuring and evaluating SDG indicators with Big Earth Data. Sci. Bull. 2022, 67, 1792–1801. [Google Scholar] [CrossRef] [PubMed]
- Han, L.; Lu, L.; Lu, J.; Liu, X.; Zhang, S.; Luo, K.; He, D.; Wang, P.; Guo, H.; Li, Q. Assessing Spatiotemporal Changes of SDG Indicators at the Neighborhood Level in Guilin, China: A Geospatial Big Data Approach. Remote Sens. 2022, 14, 4985. [Google Scholar] [CrossRef]
- Paganini, M.; Petiteville, I.; Ward, S.; Dyke, G.; Steventon, M.; Harry, J.; Kerblat, F. The Earth Observation Handbook-Satellite Earth Observations in Support of the Sustainable Development Goals; Committee on Earth Observation Satellites & European Space Agency: Paris, France, 2018. [Google Scholar]
- Mulligan, M.; van Soesbergen, A.; Hole, D.G.; Brooks, T.M.; Burke, S.; Hutton, J. Mapping nature’s contribution to SDG 6 and implications for other SDGs at policy relevant scales. Remote Sens. Environ. 2020, 239, 111671. [Google Scholar] [CrossRef]
- Luo, Y.; Zhang, Z.; Chen, Y.; Li, Z.; Tao, F. ChinaCropPhen1km: A high-resolution crop phenological dataset for three staple crops in China during 2000–2015 based on leaf area index (LAI) products. Earth Syst. Sci. Data 2020, 12, 197–214. [Google Scholar]
- Yang, J.; Huang, X. The 30 m annual land cover dataset and its dynamics in China from 1990 to 2019. Earth Syst. Sci. Data 2021, 13, 3907–3925. [Google Scholar] [CrossRef]
- Wei, J.; Li, Z.; Wang, J.; Li, C.; Gupta, P.; Cribb, M. Ground-level gaseous pollutants (NO2, SO2, and CO) in China: Daily seamless mapping and spatiotemporal variations. Atmos. Chem. Phys. 2023, 23, 1511–1532. [Google Scholar]
- Zhao, N.; Qiu, Y.; Jia, G.; Sun, X.; Fu, W. Downscaled monthly precipitation dataset at 1 km resolution over Guangxi, China and ASEAN regions from 2001 to 2020. China Sci. Data 2022. [Google Scholar] [CrossRef]
- Peng, S. 1 km Monthly Potential Evapotranspiration Dataset in China (1901–2022); National Tibetan Plateau/Third Pole Environment Data Center: Beijing, China, 2022. [Google Scholar]
- Zhong, X.; Yan, Q.; Li, G. Long Time Series Nighttime Light Dataset of China (2000–2020). J. Glob. Change Data Discov. 2022, 6, 416–424. [Google Scholar]
- Chen, J.; Gao, M.; Cheng, S.; Hou, W.; Song, M.; Liu, X.; Liu, Y.J.S.D. Global 1 km × 1 km gridded revised real gross domestic product and electricity consumption during 1992–2019 based on calibrated nighttime light data. Sci. Data 2022, 9, 202. [Google Scholar] [CrossRef] [PubMed]
- Ma, C.; Xie, Y. Dataset of High-Energy-Consuming Industrial Products in the ASEAN Regional during 2012–2021; Science Data Bank: Beijing, China, 2022. [Google Scholar] [CrossRef]
- Wei, J.; Li, Z.; Lyapustin, A.; Sun, L.; Peng, Y.; Xue, W.; Su, T.; Cribb, M. Reconstructing 1-km-resolution high-quality PM2. 5 data records from 2000 to 2018 in China: Spatiotemporal variations and policy implications. Remote Sens. Environ. 2021, 252, 112136. [Google Scholar] [CrossRef]
- Wei, J.; Li, Z.; Xue, W.; Sun, L.; Fan, T.; Liu, L.; Su, T.; Cribb, M. The ChinaHighPM10 dataset: Generation, validation, and spatiotemporal variations from 2015 to 2019 across China. Environ. Int. 2021, 146, 106290. [Google Scholar] [CrossRef] [PubMed]
- Oda, T.; Maksyutov, S.; Andres, R.J. The Open-source Data Inventory for Anthropogenic CO2, version 2016 (ODIAC2016): A global monthly fossil fuel CO2 gridded emissions data product for tracer transport simulations and surface flux inversions. Earth Syst. Sci. Data 2018, 10, 87–107. [Google Scholar] [CrossRef] [PubMed]
- Wei, J.; Li, Z.; Li, K.; Dickerson, R.; Pinker, R.; Wang, J.; Liu, X.; Sun, L.; Xue, W.; Cribb, M. Full-coverage mapping and spatiotemporal variations of ground-level ozone (O3) pollution from 2013 to 2020 across China. Remote Sens. Environ. 2022, 270, 112775. [Google Scholar] [CrossRef]
- Xu, D.; Yang, F.; Yu, L.; Zhou, Y.; Li, H.; Ma, J.; Huang, J.; Wei, J.; Xu, Y.; Zhang, C. Quantization of the coupling mechanism between eco-environmental quality and urbanization from multisource remote sensing data. J. Clean Prod. 2021, 321, 128948. [Google Scholar] [CrossRef]
- Alcamo, J.; Thompson, J.; Alexander, A.; Antoniades, A.; Delabre, I.; Dolley, J.; Marshall, F.; Menton, M.; Middleton, J.; Scharlemann, J. Analysing interactions among the sustainable development goals: Findings and emerging issues from local and global studies. Sustain. Sci. 2020, 15, 1561–1572. [Google Scholar] [CrossRef]
- Han, S.; Yi, H.; Li, X.; Li, B.; Jing, R. Cold Start Recommendation Algorithm Based on Fusion Similarity and Hierarchical Clustering. J. Chin. Comput. Syst. 2022, 5, 985–991. (In Chinese) [Google Scholar]
- Xue, X. K—Means Algorithm Based on Python and Its Application. Sci. Technol. Vis. 2018, 24, 141–142. (In Chinese) [Google Scholar]
- Melet, O.; Youssefi, D.; Michel, J.; Cournet, M.; Languille, F.; Lebegue, L.; Bouisson, C.; Paccini, A. Large Scale Digital Surface Model Production on Cloud Using Big Data Technologies for Future EO Mission. In Proceedings of the IGARSS 2019–2019 IEEE International Geoscience and Remote Sensing Symposium, Yokohama, Japan, 28 July–2 August 2019; pp. 8570–8573. [Google Scholar]
- Wang, Q.; Liu, C.; Hou, Y.; Xin, F.; Mao, Z.; Xue, X. Study of the spatio-temporal variation of environmental sustainability at national and provincial levels in China. Sci. Total Environ. 2022, 807, 150830. [Google Scholar] [CrossRef] [PubMed]
- Chen, H.; Chen, S.; Ye, Y.M. Research on the transformation path of farmland protection under the high-quality agricultural development. Res. Agric. Mod. 2023, 44, 55–64. [Google Scholar]
- Liu, Y.; Wang, S.; Chen, B.; Yu, Z. A Review of Policies and Measures for Agricultural Biodiversity Conservation in China and Outlook for Post 2020. J. Ecol. Rural. Environ. 2021, 37, 1225–1233. [Google Scholar]
- Long, L.; Yang, X.; Ou, G. Exploration of the Application of Cultivation and Protection Measures in Forest Resources. Flowers 2019, 235–236. Available online: http://www.cqvip.com/qk/97020x/201922/7100386137.html (accessed on 10 January 2024).
- Ni, L. Coordinated Study on Town Road Planning and Tourism Resources in Majia Town, Quanzhou City. Master’s Thesis, Huaqiao University, Quanzhou, China, 2020. (In Chinese). [Google Scholar]
- An, J.; Wang, D. Analysis and Study of Air Pollutants in Chongqing Based on VAR Models. J. Chongqing Technol. Bus. Univ. (Nat. Sci. Ed.) 2023, 40, 72–80. [Google Scholar]
Figure 1.
Spatial distribution of terrain in the GZAR.

Figure 2.
Spatial distribution of SDGCI in Guangxi in 2014–2020: (a) 2014, (b) 2015, (c) 2016, (d) 2017, (e) 2018, (f) 2019, (g) 2020.
Figure 2.
Spatial distribution of SDGCI in Guangxi in 2014–2020: (a) 2014, (b) 2015, (c) 2016, (d) 2017, (e) 2018, (f) 2019, (g) 2020.
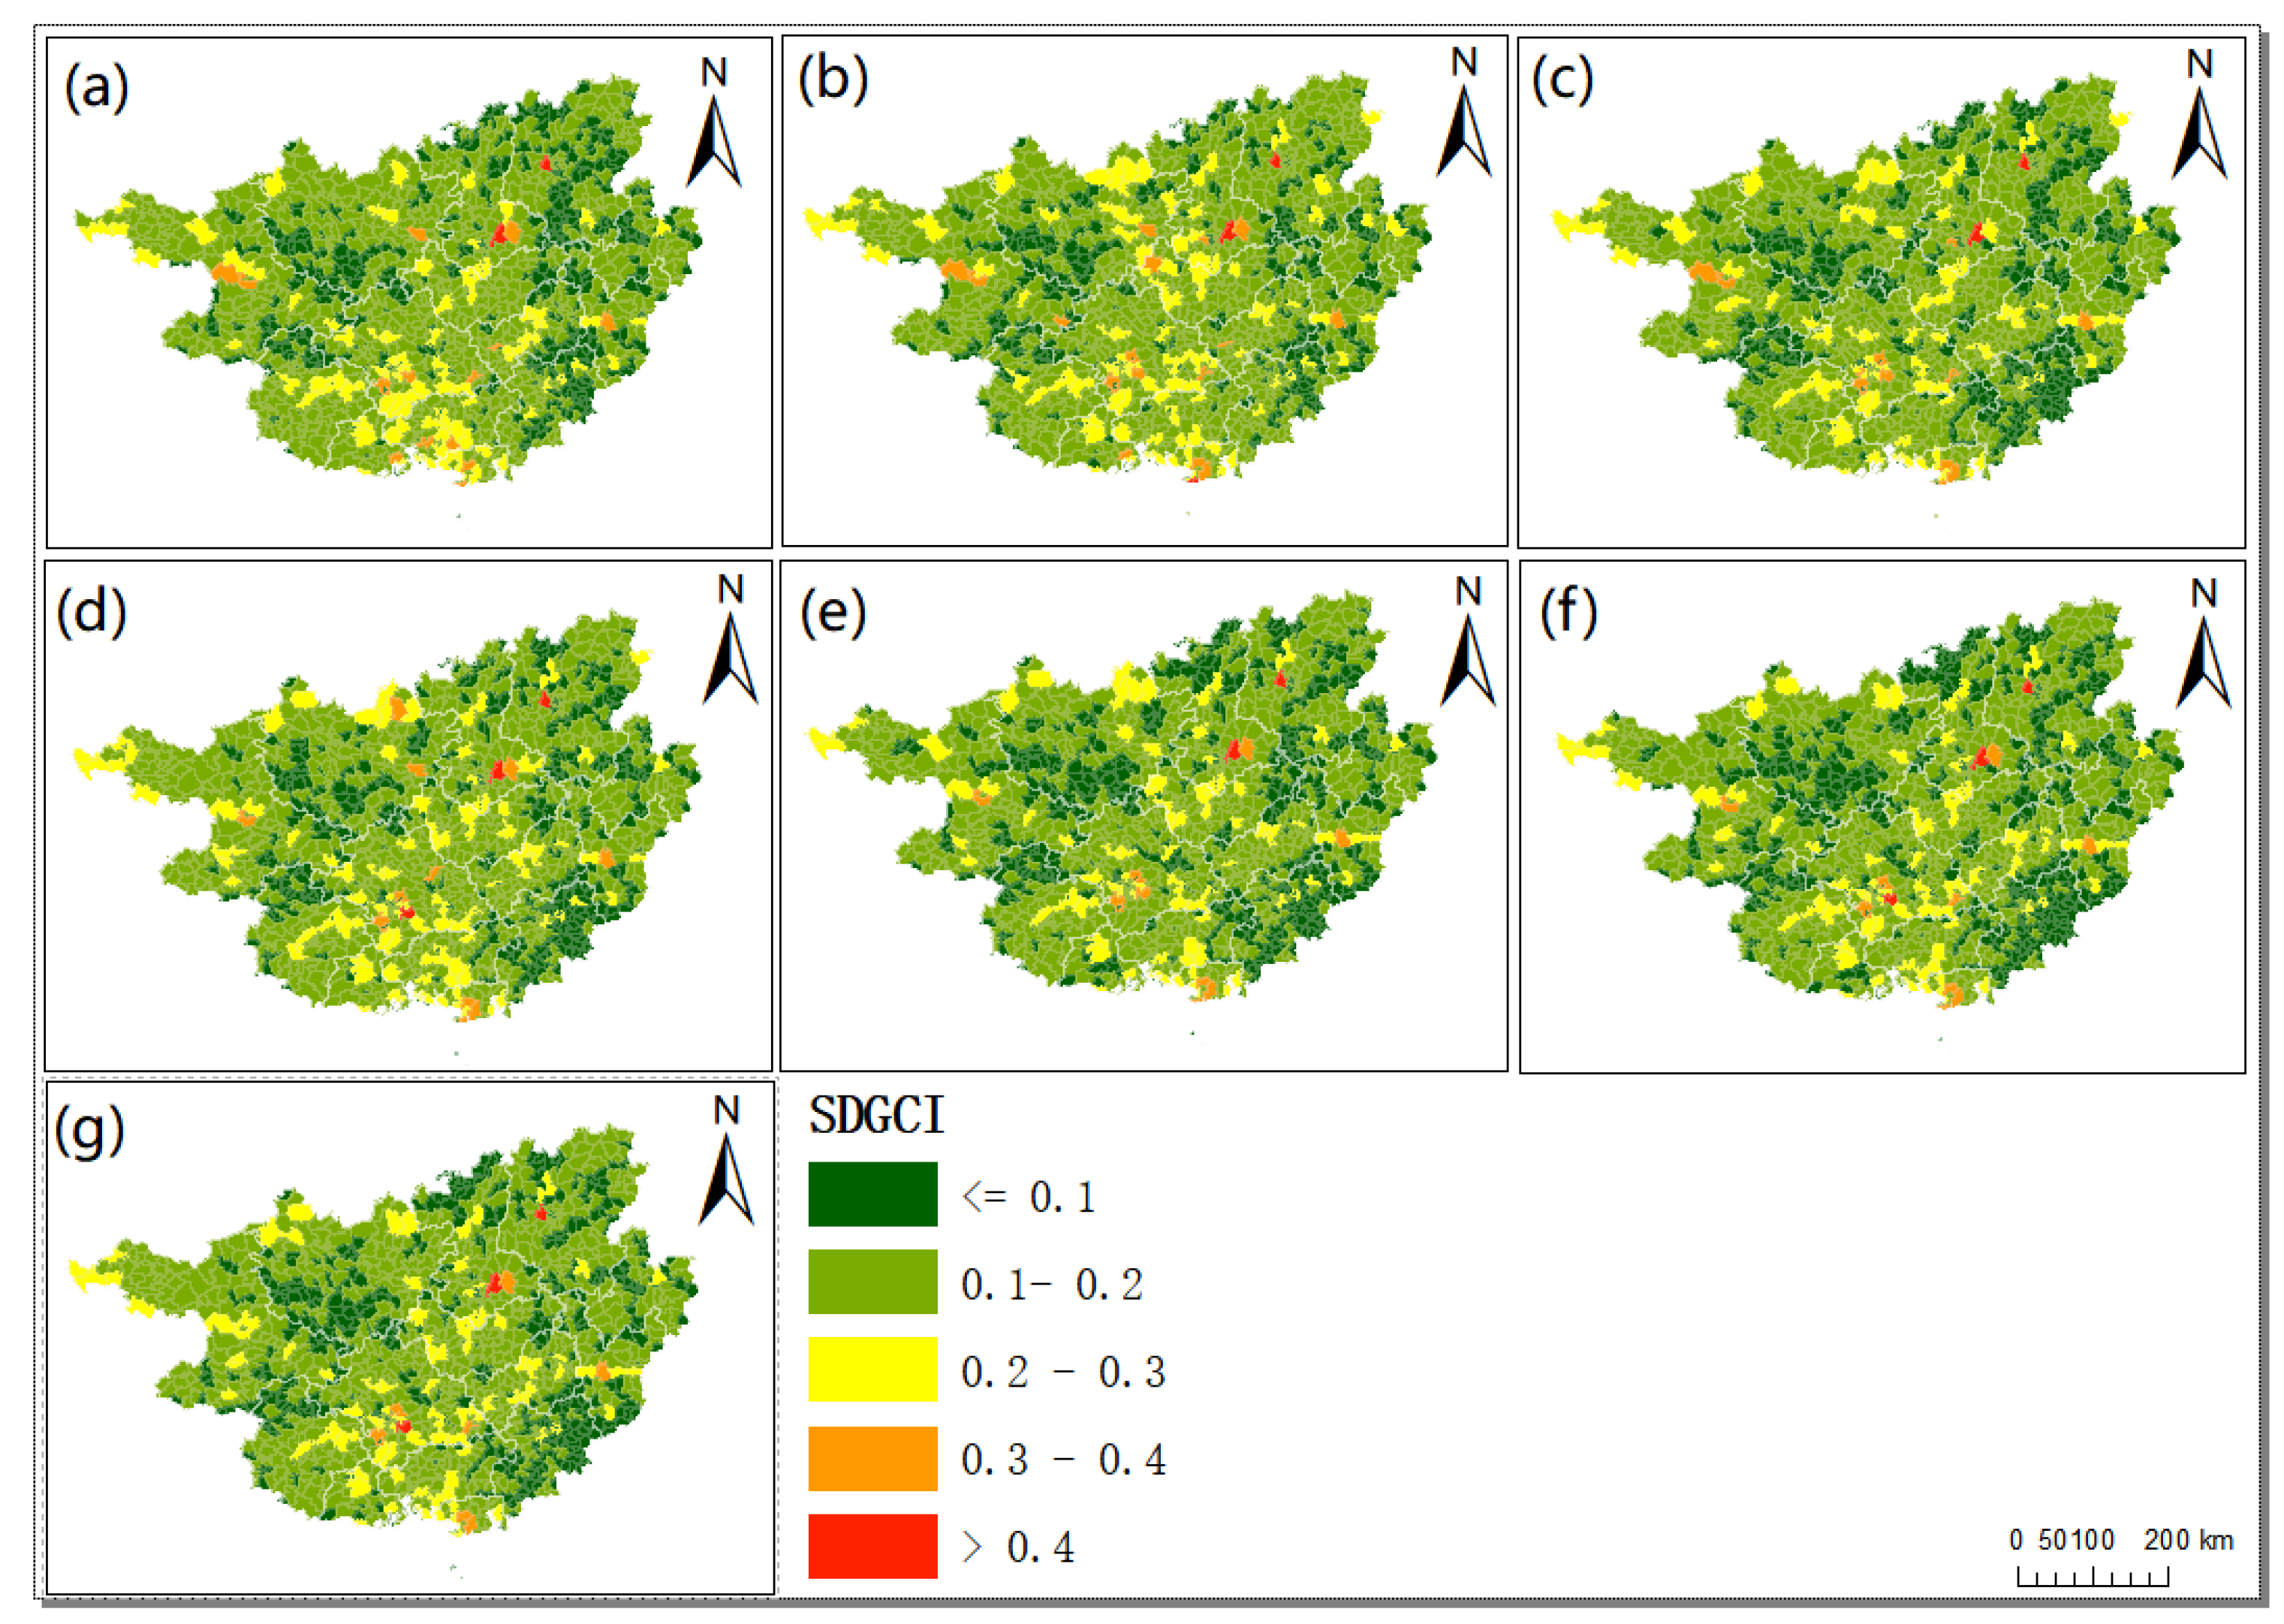
Figure 3.
Spatial distribution of SDGCI changes in Guangxi in 2014–2020.
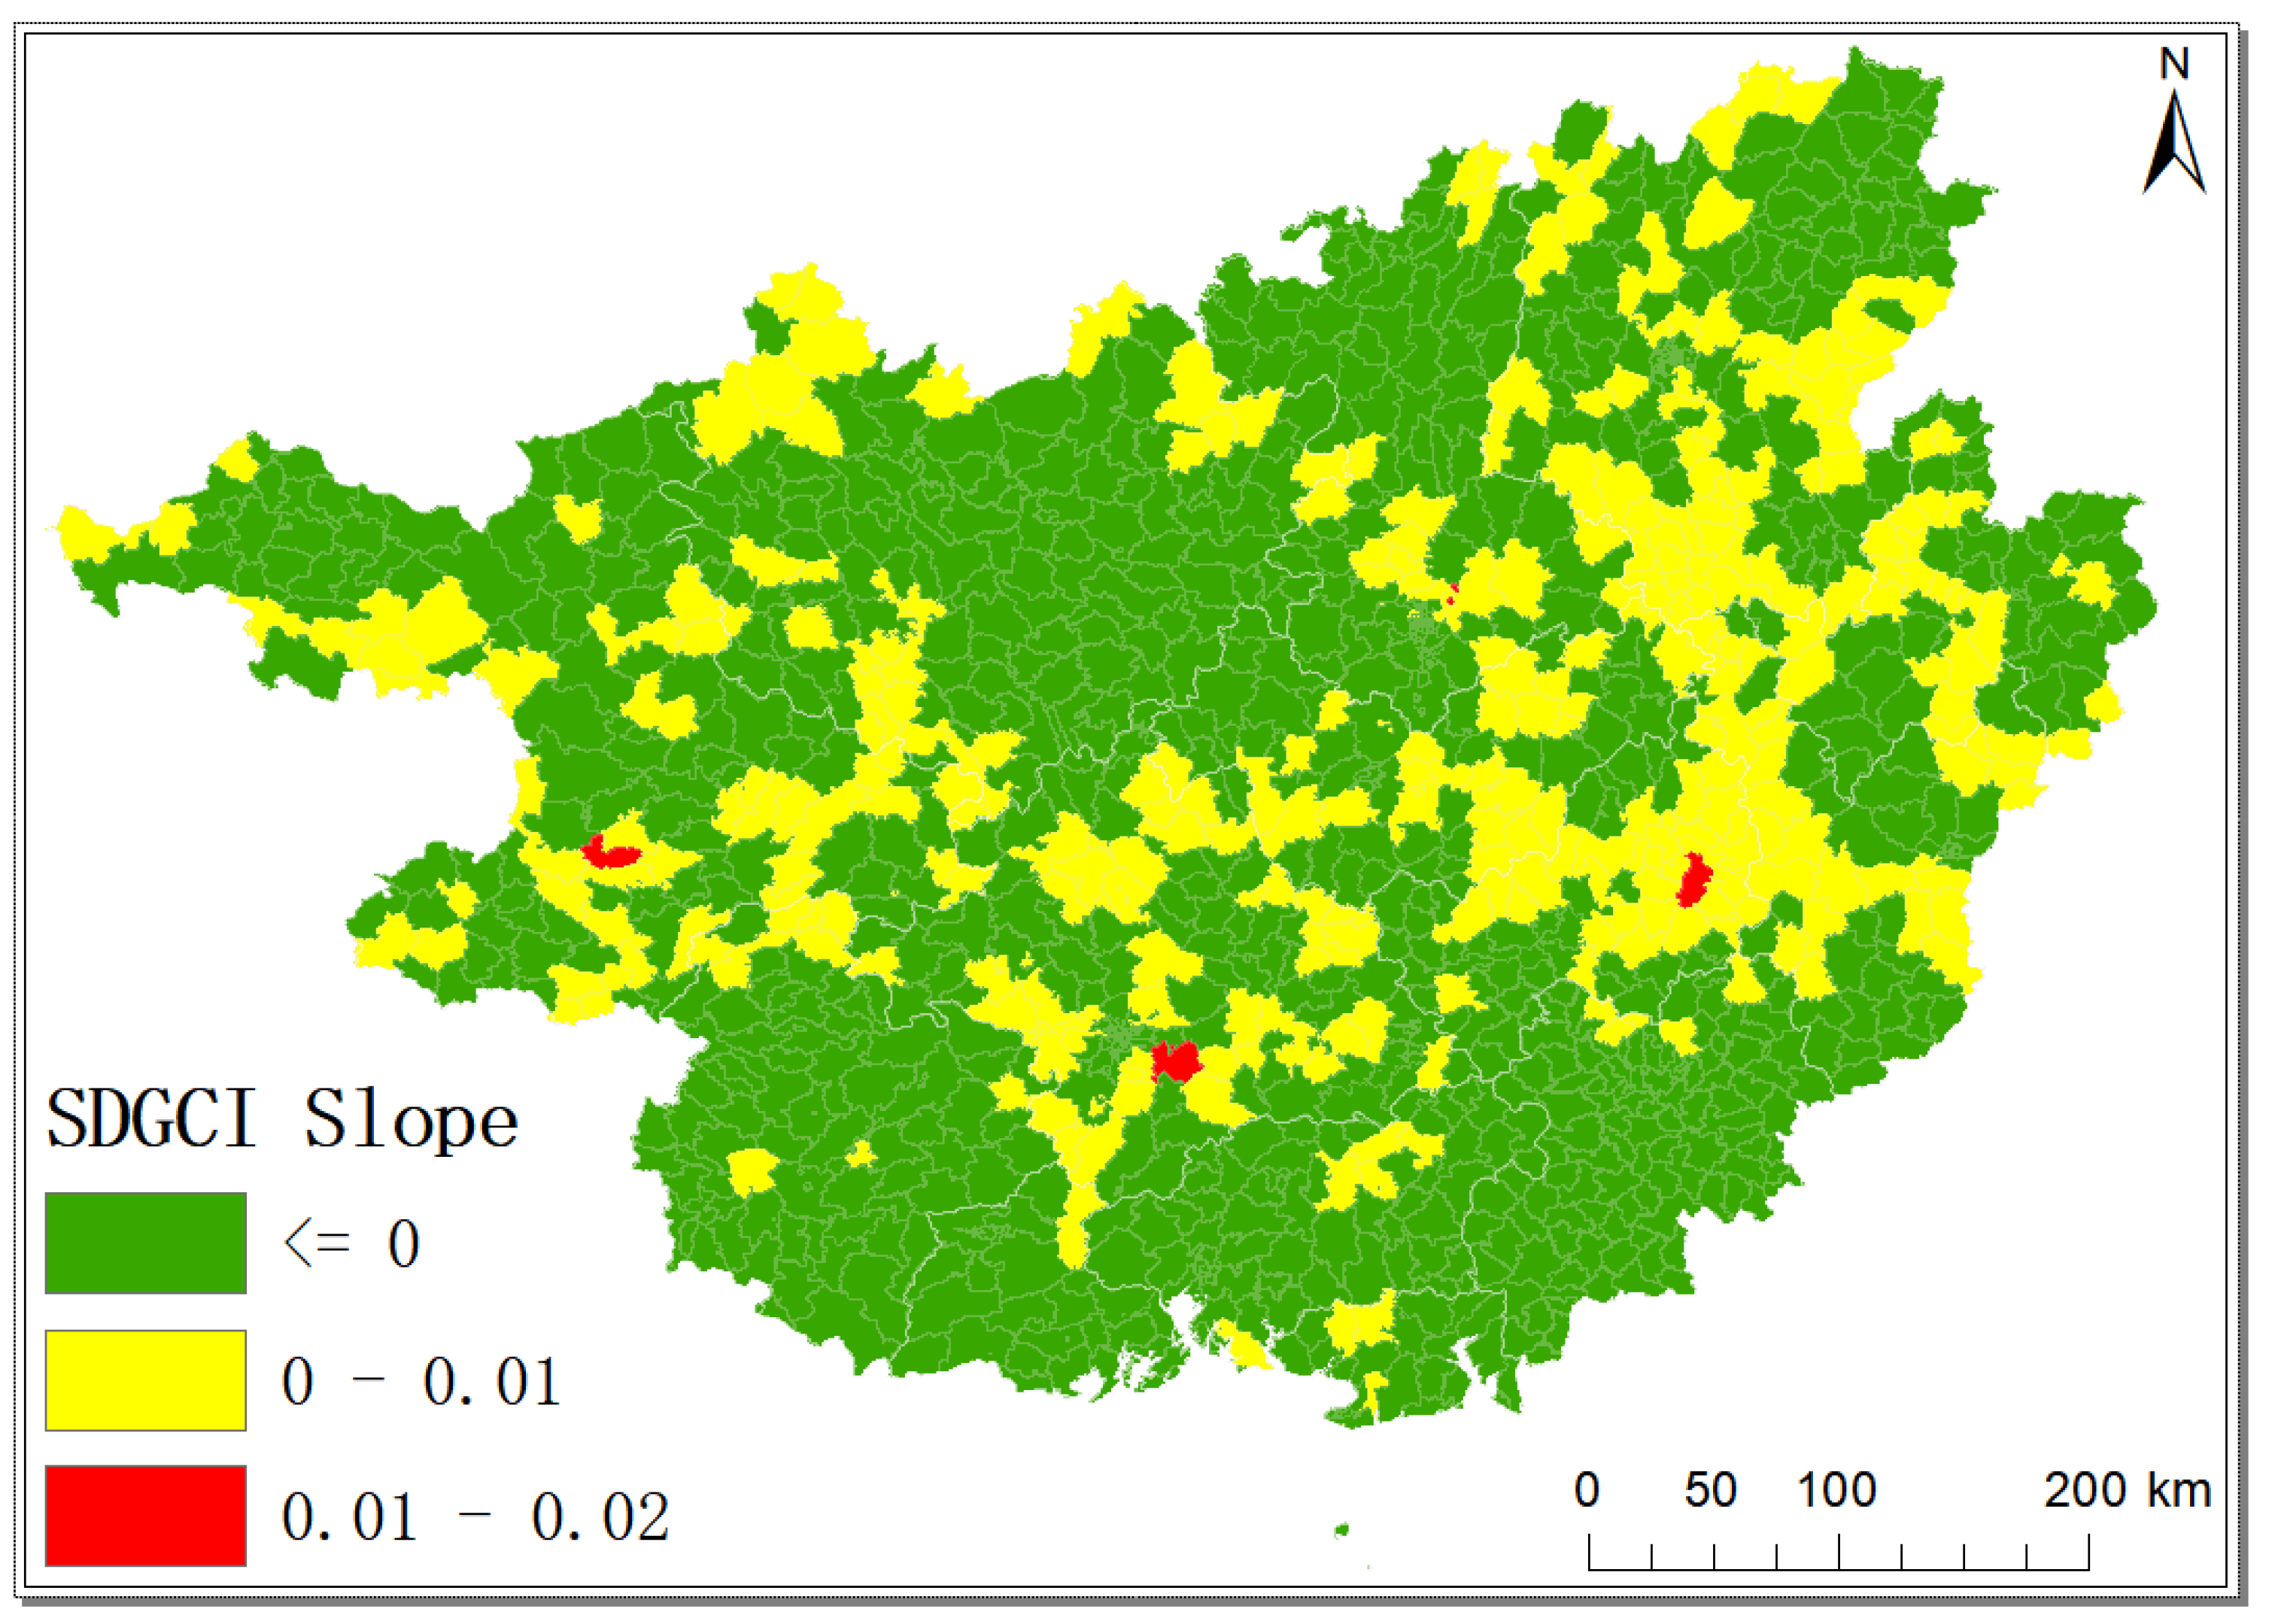
Figure 4.
Spatial distribution of the SDGCI across three systems of the United Nations SDG classification in 2015 and 2020: (a) Upeople, (b) Uplanet, and (c) Uprosperity in 2015; and (d) Upeople, (e) Uplanet, (f) Uprosperity in 2020.
Figure 4.
Spatial distribution of the SDGCI across three systems of the United Nations SDG classification in 2015 and 2020: (a) Upeople, (b) Uplanet, and (c) Uprosperity in 2015; and (d) Upeople, (e) Uplanet, (f) Uprosperity in 2020.
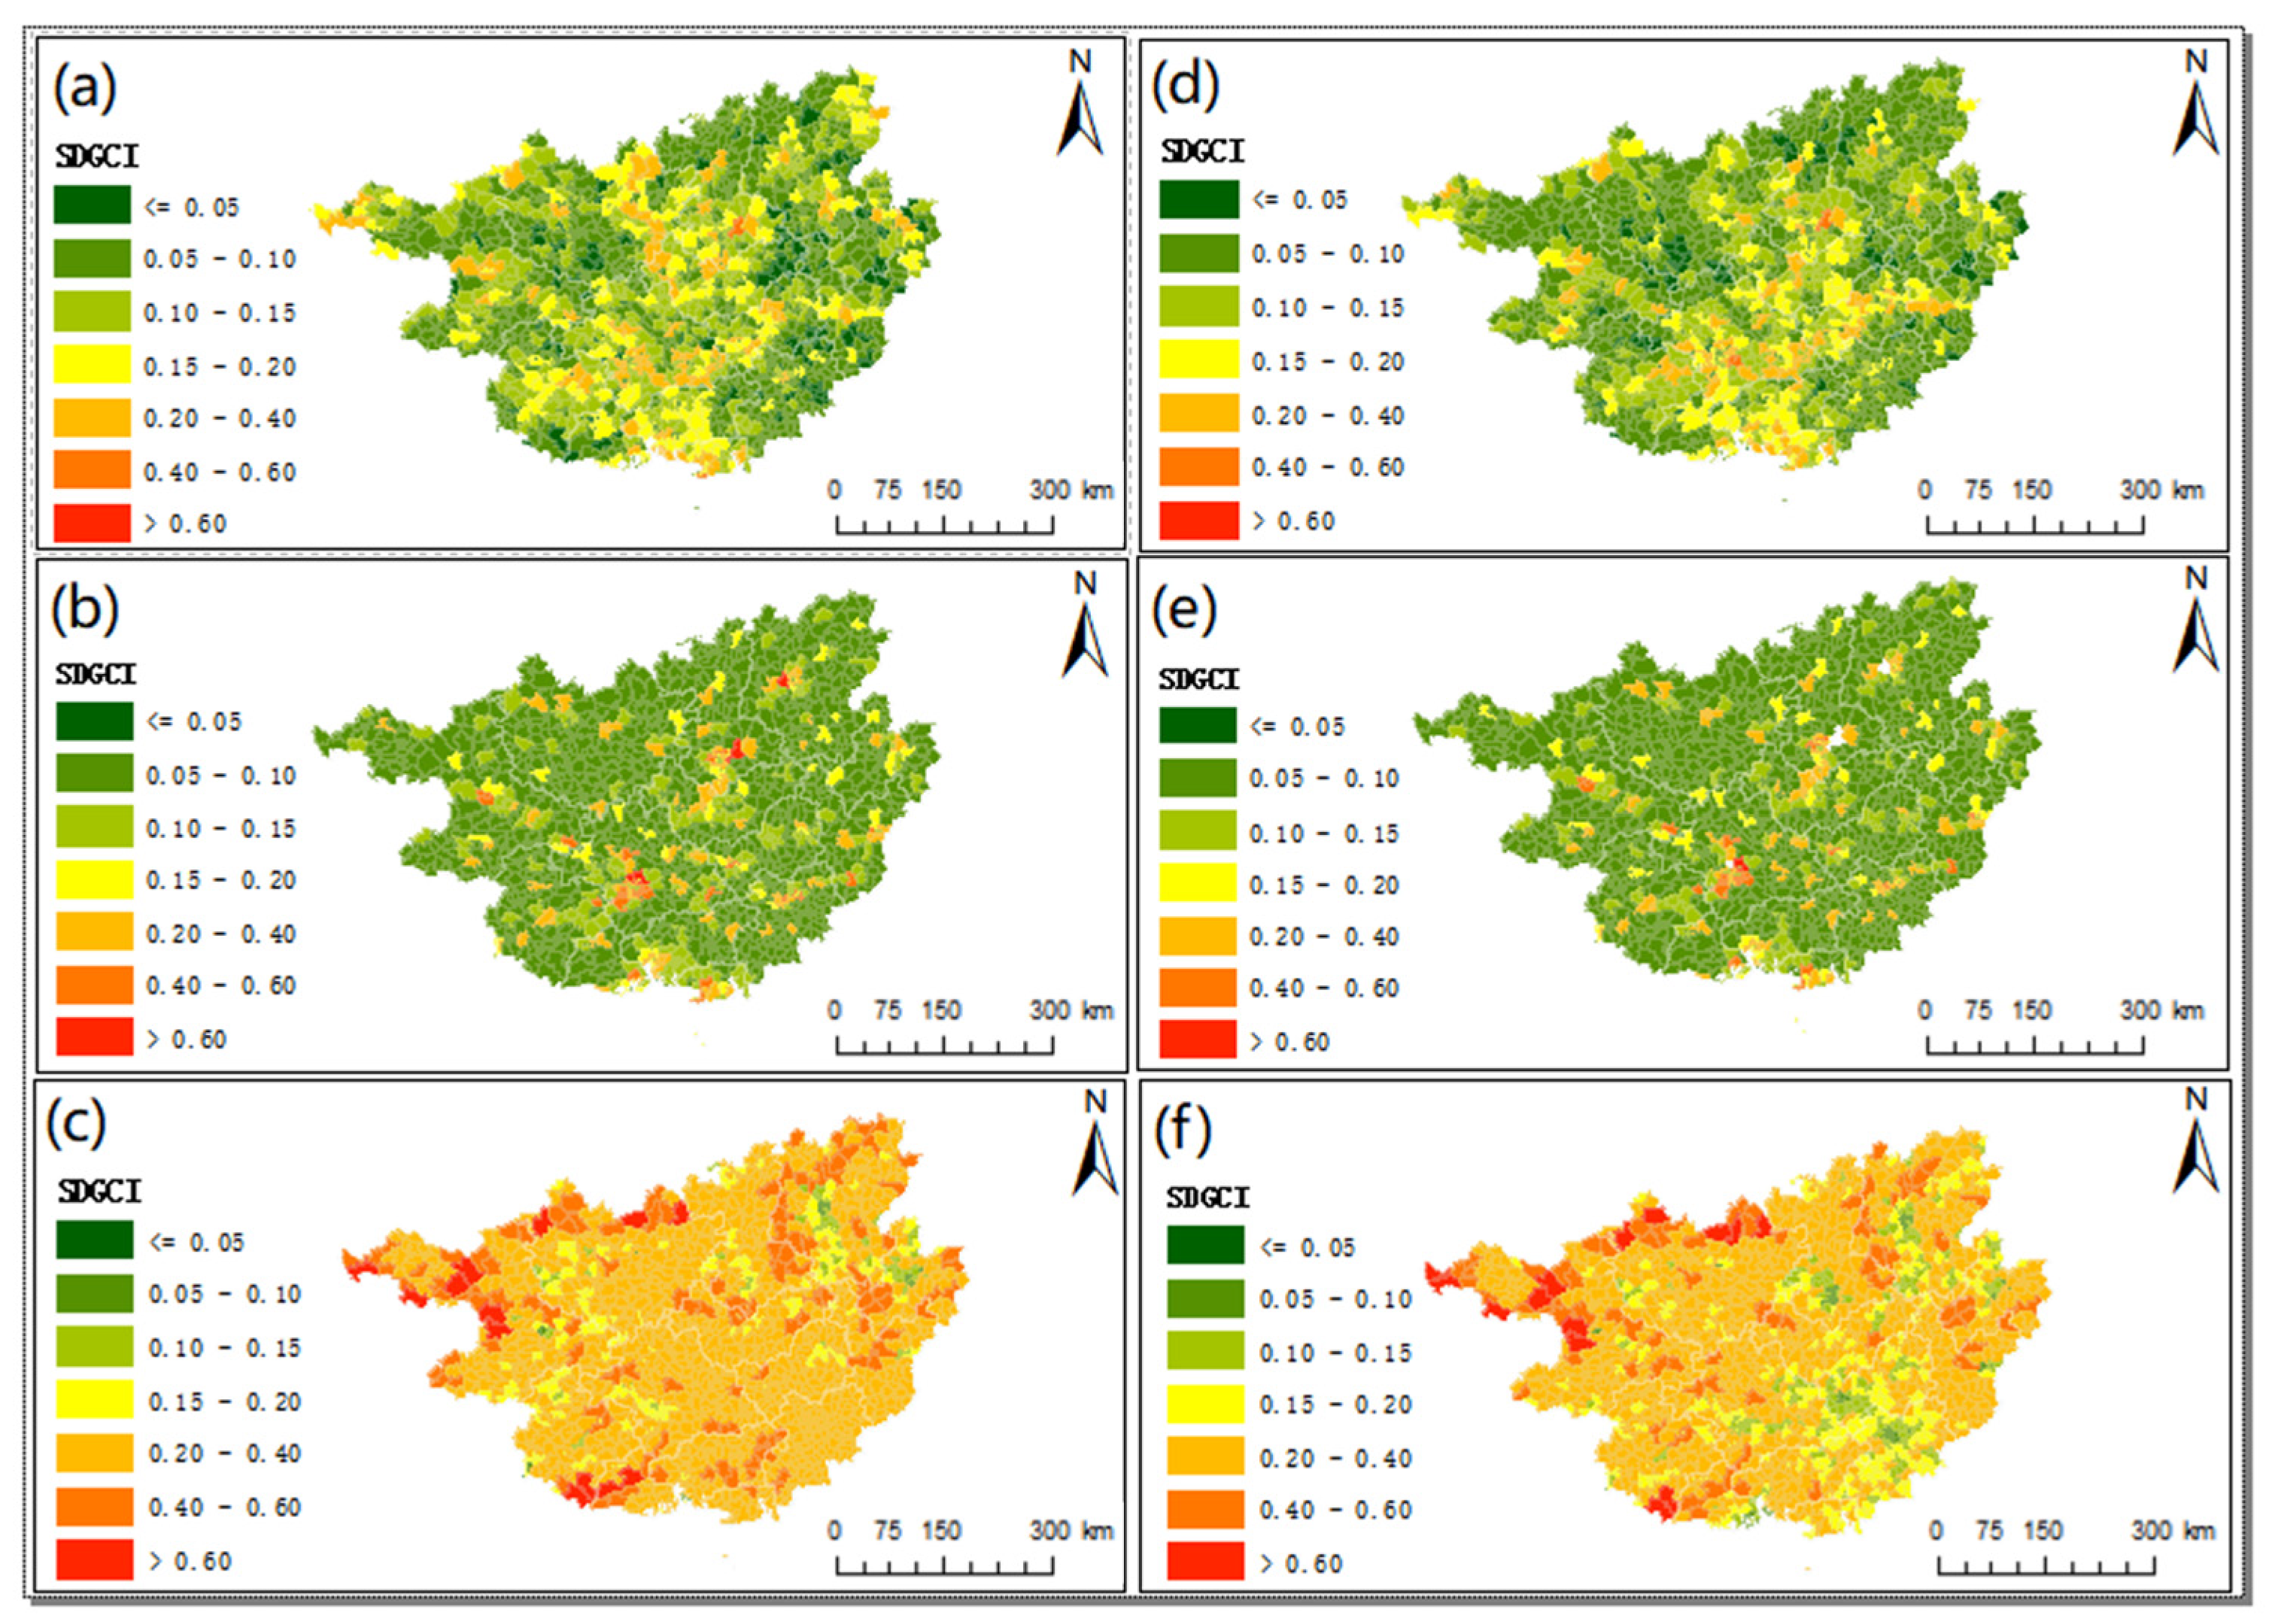
Figure 5.
Spatial distribution of SDGCI_CD among different systems in 2015 and 2020 and SDGCI_CD changes between 2015 and 2020: (a) 2015, (b) 2020, (c) changes between 2015 and 2020.
Figure 5.
Spatial distribution of SDGCI_CD among different systems in 2015 and 2020 and SDGCI_CD changes between 2015 and 2020: (a) 2015, (b) 2020, (c) changes between 2015 and 2020.
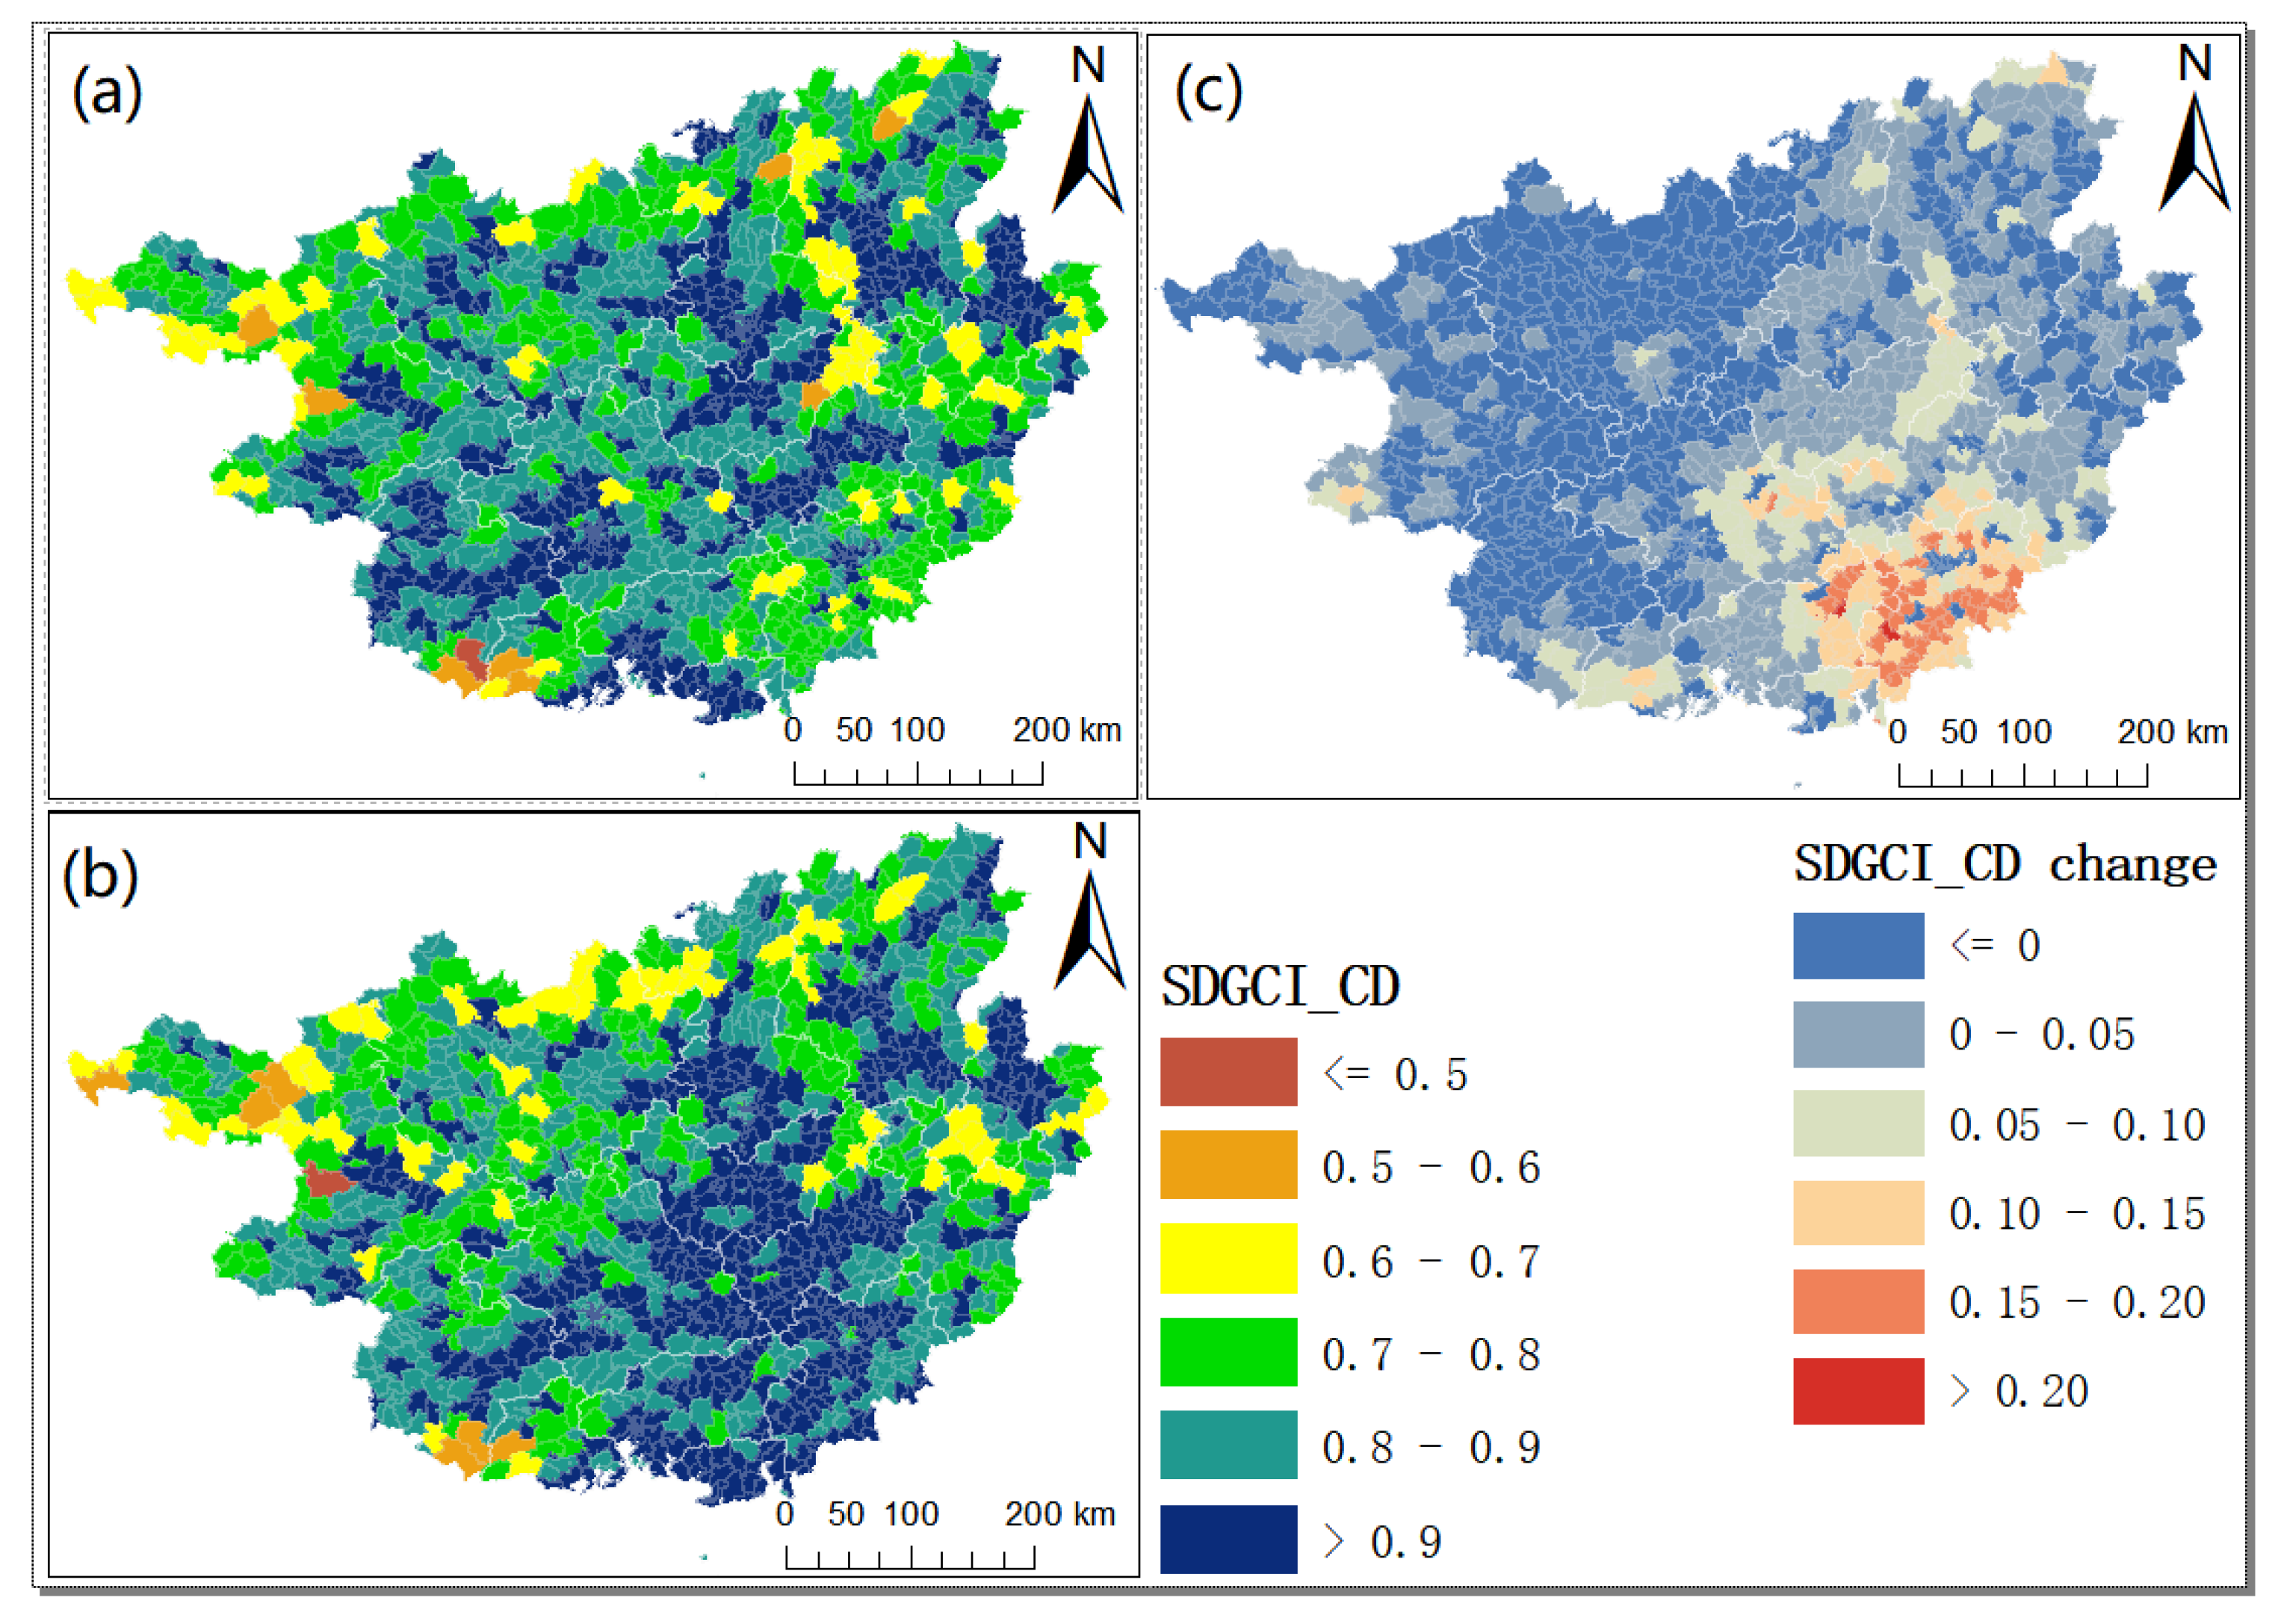
Figure 6.
Spatial distribution of SDGCI_CCD among different systems in 2015 and 2020 and SDGCI_CCD changes between 2015 and 2020: (a) 2015, (b) 2020, (c) changes between 2015 and 2020.
Figure 6.
Spatial distribution of SDGCI_CCD among different systems in 2015 and 2020 and SDGCI_CCD changes between 2015 and 2020: (a) 2015, (b) 2020, (c) changes between 2015 and 2020.
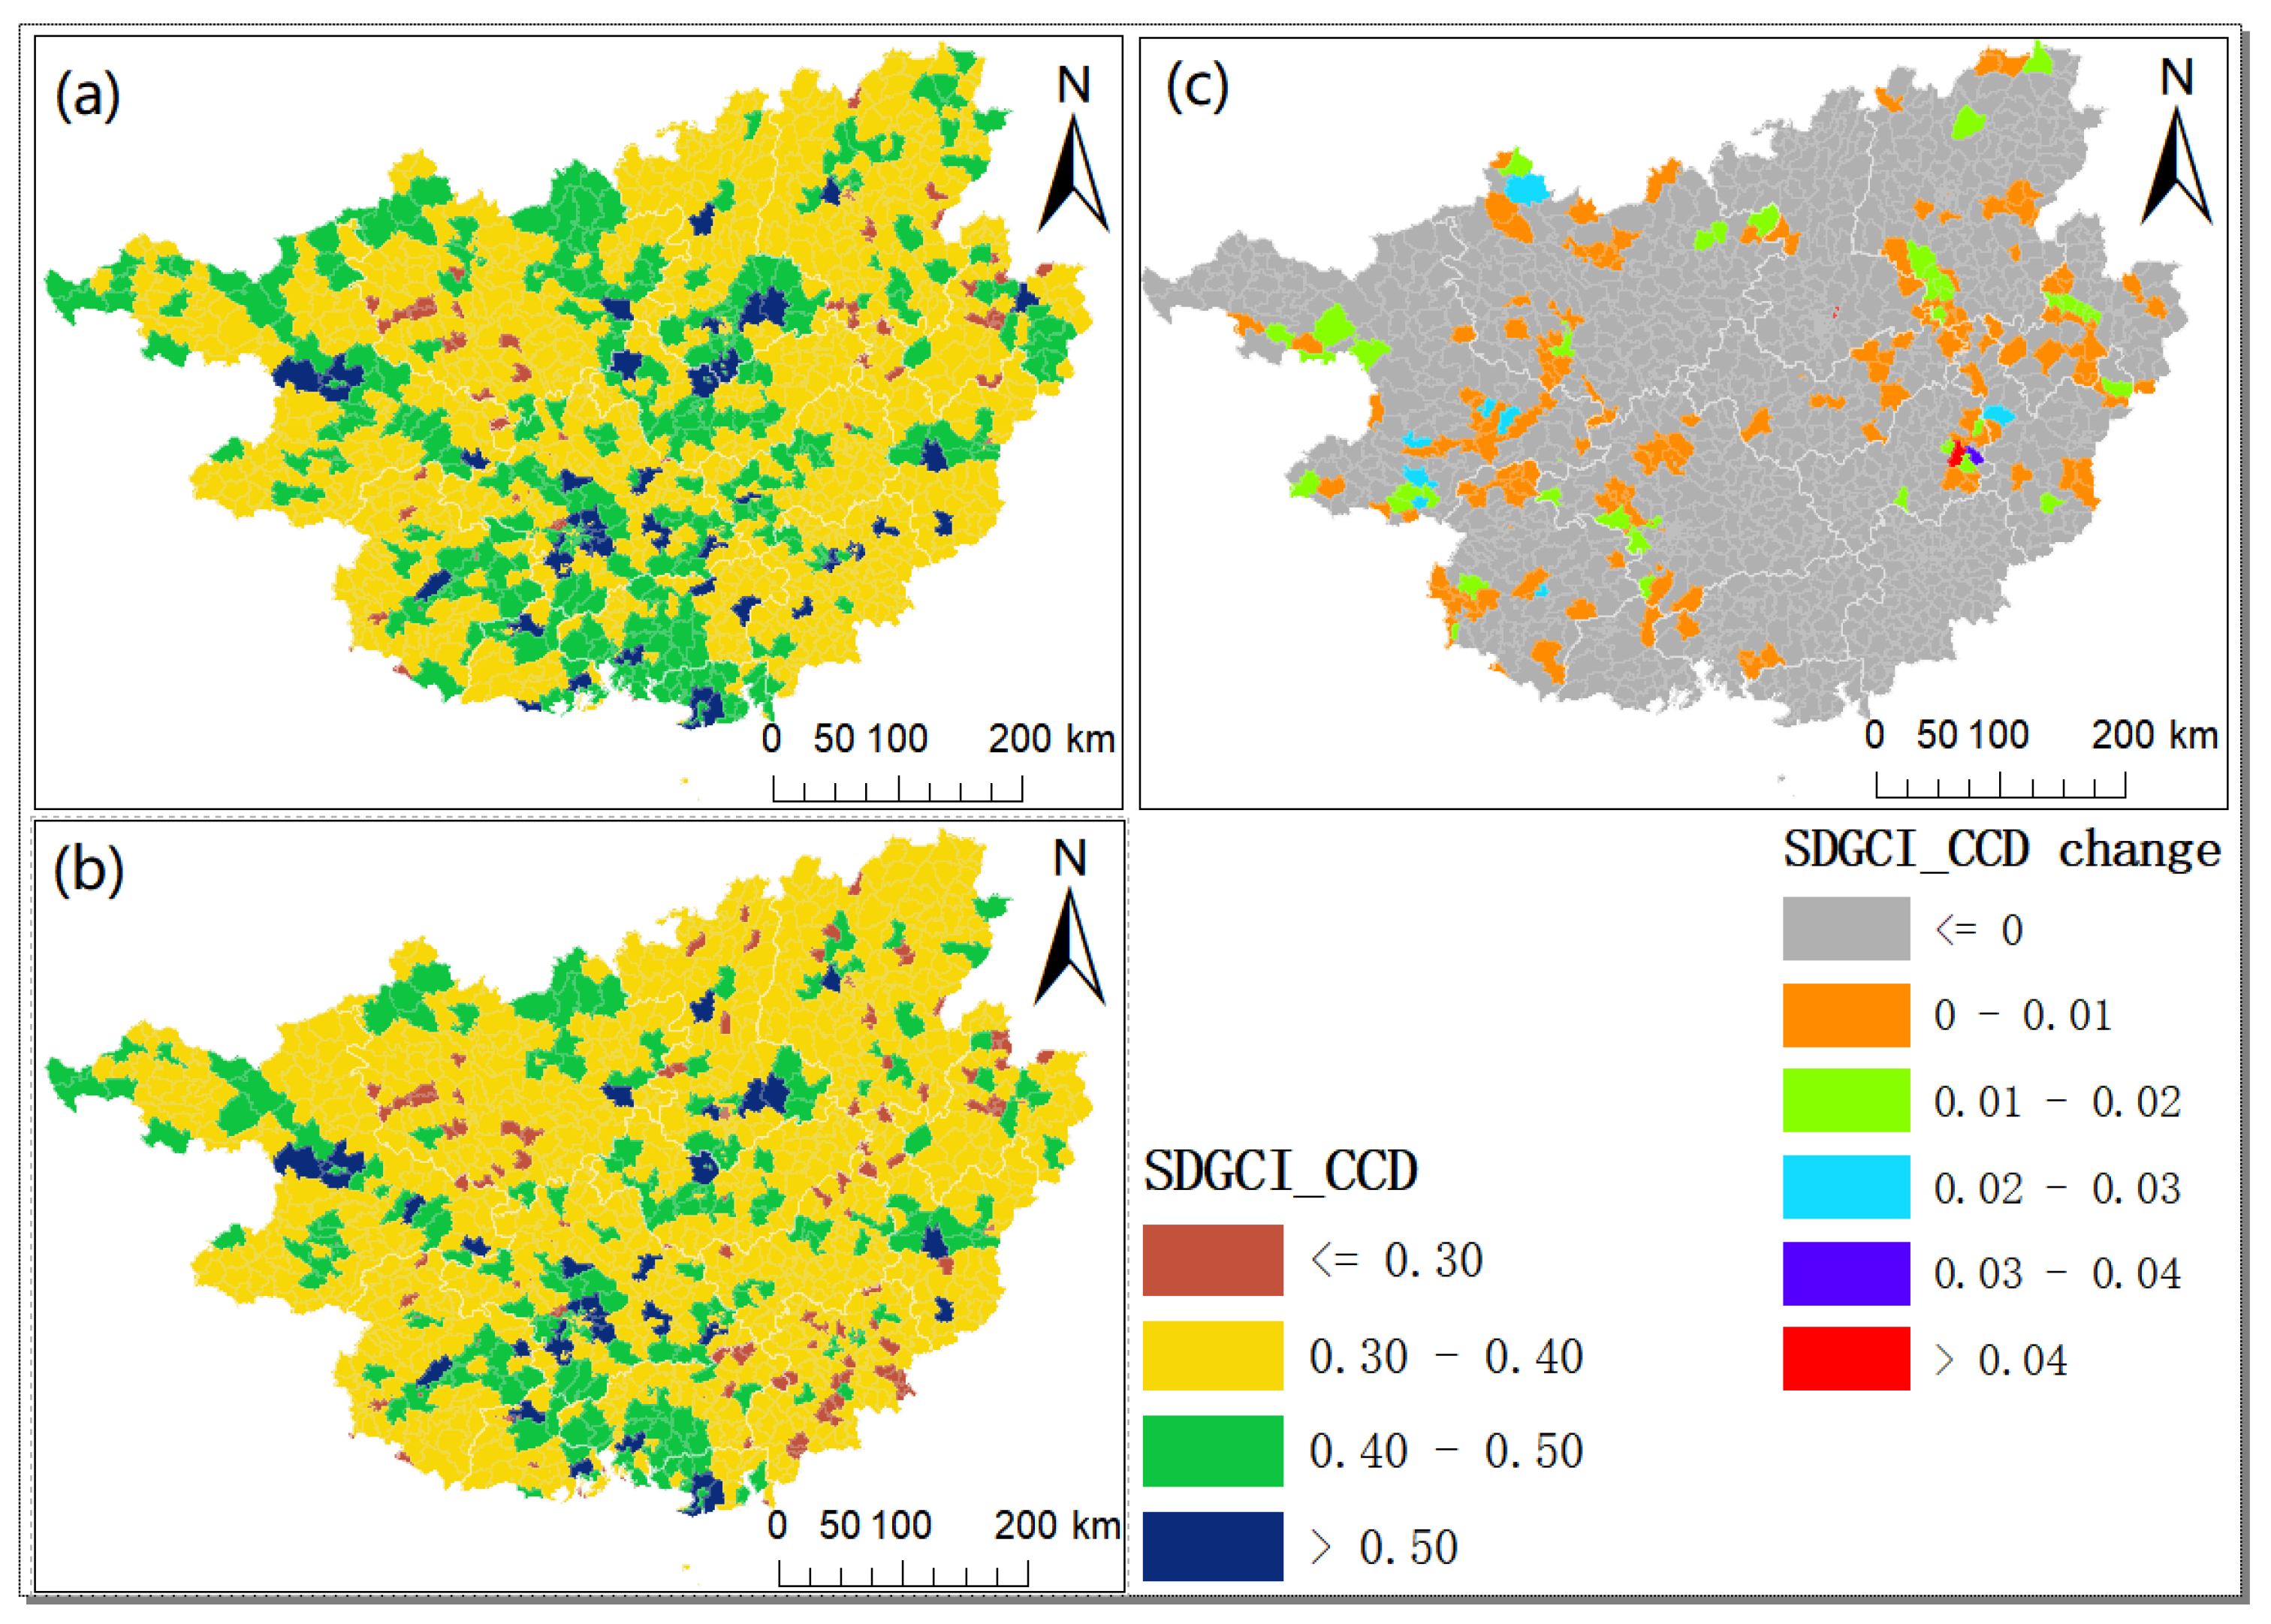
Figure 7.
Ternary maps and spatial distribution of SDGCI clustering results of towns in Guangxi in 2015 and 2020, based on the three systems under United Nations SDG classification: ternary maps of clustering results in (a) 2015 and (b) 2020 and spatial distribution maps of clustering results in (c) 2015 and (d) 2020.


Table 1.
SDG indicators and datasets.
| SDG Indicators | Datasets (Unit) | Period | Spatial Resolution | Data Sources | Incline |
|---|---|---|---|---|---|
| 2.4.1 Proportion of agricultural area under productive and sustainable agriculture | Maize cultivation area (1 km2) | 2000–2019 | 1 km | Luo et al., 2020 [41] | + |
| Rice cultivation area (1 km2) | 2000–2019 | 1 km | Luo et al., 2020 [41] | + | |
| Percentage of cultivated land area (%) | 1990–2020 | - | Yang and Huang, 2021 [42] | + | |
| 3.8.1 Coverage of essential health services | Distance to hospital (1 km) | 2014–2021 | 1 km | Open Street Map (OSM) | − |
| 3.9.1 Mortality rate attributed to household and ambient air pollution | Near-surface CO concentration (mg/m3) | 2013–2020 | 10 km | Wei et al., 2023 [43] | − |
| Near-surface SO2 concentration (µg/m3) | 2013–2020 | 10 km | Wei et al., 2023 [43] | − | |
| 4.a.1 Proportion of schools offering basic services, by type of service | Distance to school (1 km) | 2014–2021 | 1 km | Open Street Map (OSM) | − |
| 6.6.1 Change in the extent of water-related ecosystems over time | Precipitation (mm/year) | 2001–2020 | 1 km | Zhao et al., 2022 [44] | + |
| Potential evapotranspiration (mm/year) | 1990–2021 | 1 km | Peng, 2022 [45] | − | |
| Percentage of surface water area (%) | 1990–2020 | - | Yang and Huang, 2021 [42] | + | |
| Distance to river (1 km) | 2014–2023 | 1 km | Open Street Map (OSM) | − | |
| 7.1.1 Proportion of population with access to electricity | Nighttime lighting index (-) | 2000–2020 | 1 km | Zhong et al., 2022 [46] | + |
| 7.3.1 Energy intensity measured in terms of primary energy and GDP | Actual electricity consumption (kWh) | 1992–2019 | 1 km | Chen et al., 2022 [47] | + |
| Distance to energy-consuming industrial heat sources (1 km) | 2012–2022 | 1 km | Ma and Xie, 2022 [48] | + | |
| 8.1.1 Annual growth rate of real GDP per capita | Gross domestic product (million dollars) | 1992–2019 | 1 km | Chen et al., 2022 [47] | + |
| 9.1.1 Proportion of the rural population who live within 2 km of an all-season road | Distance to road (1 km) | 2014–2023 | 1 km | Open Street Map (OSM) | − |
| 11.6.2 Annual mean levels of fine particulate matter | PM2.5 concentration (µg/m3) | 2000–2021 | 1 km | Wei et al., 2021 [49] | − |
| PM10 concentration (µg/m3) | 2000–2021 | 1 km | Wei et al., 2021 [50] | − | |
| 13.2.2 Total greenhouse gas emissions per year | Fossil fuel emission (Tons of carbon) | 2000–2021 | 1 km | Oda et al., 2018 [51] | − |
| O3 concentration (µg/m3) | 2013–2020 | 10 km | Wei et al., 2022 [52] | − | |
| 15.1.1 Forest area as a proportion of total land area | Percentage of forest area (%) | 1990–2020 | - | Yang and Huang, 2021 [42] | + |
| 15.2.1 Progress towards sustainable forest management | Vegetation index (-) | 2000–2021 | 1 km | NASA MOSDIS Land Processes DAAC (MOD13Q1) | + |
| 15.4.1 Coverage by protected areas of important sites for mountain biodiversity | Distance to natural attractions (1 km) | 2014–2021 | 1 km | Open Street Map (OSM) | + |
| Ecosystem quality index (-) | 2001–2021 | 500 m | Xu et al., 2021 [53] | + | |
| 15.5.1 Red List Index | Rare plant and animal biodiversity (-) | 2018 | 10 km | BiodiversityMapping.org | + |
Table 2.
SDGCI interval statistics of townships in Guangxi in 2014–2020.
| Year | SDGCI | Number (Percentage) of Towns for Different SDGCI Intervals | ||||||
|---|---|---|---|---|---|---|---|---|
| Mean | Median | Max | ≤0.1 | (0.1,0.2] | (0.2,0.3] | (0.3,0.4] | >0.4 | |
| 2014 | 0.129 | 0.117 | 0.415 | 403 (32.5%) | 729 (58.7%) | 93 (7.5%) | 14 (1.1%) | 2 (0.2%) |
| 2015 | 0.134 | 0.122 | 0.472 | 344 (27.7%) | 774 (62.4%) | 104 (8.4%) | 16 (1.3%) | 3 (0.2%) |
| 2016 | 0.127 | 0.115 | 0.474 | 441 (35.5%) | 701 (56.5%) | 85 (6.8%) | 12 (1.0%) | 2 (0.2%) |
| 2017 | 0.129 | 0.117 | 0.481 | 406 (32.7%) | 725 (58.4%) | 96 (7.7%) | 11 (0.9%) | 3 (0.2%) |
| 2018 | 0.123 | 0.111 | 0.502 | 480 (38.7%) | 669 (53.9%) | 81 (6.5%) | 9 (0.7%) | 2 (0.2%) |
| 2019 | 0.122 | 0.110 | 0.481 | 497 (40.0%) | 649 (52.3%) | 83 (6.7%) | 9 (0.7%) | 3 (0.2%) |
| 2020 | 0.125 | 0.114 | 0.479 | 442 (35.6%) | 697 (56.2%) | 91 (7.3%) | 8 (0.6%) | 3 (0.2%) |
| Mean | 0.127 | 0.115 | 0.472 | 430 (34.7%) | 706 (56.9%) | 90 (7.3%) | 11 (0.9%) | 3 (0.2%) |
Table 3.
SDGCI interval statistics of townships in Guangxi for three systems based on the United Nations SDG classification in 2015 and 2020.
Table 3.
SDGCI interval statistics of townships in Guangxi for three systems based on the United Nations SDG classification in 2015 and 2020.
| Year | Systems | SDGCI | Number (Percentage) of Towns for Different SDGCI Intervals | |||||
|---|---|---|---|---|---|---|---|---|
| Mean | Median | Max | ≤0.2 | (0.2,0.4] | (0.4,0.6] | >0.6 | ||
| 2015 | people | 0.107 | 0.091 | 0.468 | 1161 (93.6%) | 78 (6.3%) | 2 (0.2%) | 0 (0.0%) |
| planet | 0.117 | 0.085 | 0.982 | 1111 (89.5%) | 99 (8.0%) | 27 (2.2%) | 4 (0.3%) | |
| prosperity | 0.280 | 0.269 | 0.795 | 269 (21.7%) | 845 (68.1%) | 114 (9.2%) | 13 (1.0%) | |
| 2020 | people | 0.103 | 0.089 | 0.489 | 1172 (94.4%) | 67 (5.4%) | 2 (0.2%) | 0 (0.0%) |
| planet | 0.112 | 0.078 | 0.984 | 1120 (90.2%) | 93 (7.5%) | 24 (1.9%) | 4 (0.3%) | |
| prosperity | 0.238 | 0.222 | 0.785 | 497 (40.0%) | 658 (53.0%) | 72 (5.8%) | 14 (1.1%) | |
Table 4.
Interval statistics of SDGCI_CD for different systems in 2015 and 2020.
| Year | SDGCI_CD | Number (Percentage) of Towns for Different SDGCI_CD Intervals | |||||
|---|---|---|---|---|---|---|---|
| Mean | Median | Max | ≤0.6 | (0.6,0.7] | (0.7,0.8] | >0.8 | |
| 2015 | 0.852 | 0.867 | 0.9999 | 9 (0.7%) | 63 (5.1%) | 263 (21.2%) | 906 (73.0%) |
| 2020 | 0.869 | 0.886 | 0.9995 | 7 (0.6%) | 52 (4.2%) | 214 (17.2%) | 968 (78.0%) |
Table 5.
Interval statistics of SDGCI_CCD for different systems in 2015 and 2020.
| Year | SDGCI_CCD | Number (Percentage) of Towns for Different SDGCI_CCD Intervals | |||||
|---|---|---|---|---|---|---|---|
| Mean | Median | Max | ≤0.30 | (0.30,0.40] | (0.40,0.50] | >0.50 | |
| 2015 | 0.373 | 0.361 | 0.682 | 55 (4.5%) | 864 (69.6%) | 277 (22.3%) | 45 (3.6%) |
| 2020 | 0.356 | 0.344 | 0.668 | 124 (9.9%) | 903 (72.8%) | 181 (14.6%) | 33 (2.7%) |
Table 6.
Statistics of SDGCI clustering results for the three systems under the United Nations SDG classification in 2015 and 2020.
Table 6.
Statistics of SDGCI clustering results for the three systems under the United Nations SDG classification in 2015 and 2020.
| Year | Systems | SDGCI Intervals for Clustering Results of Towns | ||
|---|---|---|---|---|
| Cluster 1 | Cluster 2 | Cluster 3 | ||
| 2015 | people | [0.056,0.414] | [0.093,0.434] | [0.113,0.350] |
| planet | [0.061,0.322] | [0.134,0.570] | [0.313,0.640] | |
| prosperity | [0.047,0.849] | [0.200,0.705] | [0.107,0.458] | |
| Number of towns | 531 | 622 | 88 | |
| 2020 | people | [0.066,0.523] | [0.135,0.466] | [0.190,0.394] |
| planet | [0.059,0.448] | [0.170,0.579] | [0.430,0.669] | |
| prosperity | [0.253,0.847] | [0.168,0.615] | [0.090,0.342] | |
| Number of towns | 733 | 414 | 94 | |
Table 7.
Pearson correlation coefficient between indicator data and SDGCI for 2014–2020. Significance levels: *** p value < 0.001; ** p value < 0.01; and * p value < 0.05.
Table 7.
Pearson correlation coefficient between indicator data and SDGCI for 2014–2020. Significance levels: *** p value < 0.001; ** p value < 0.01; and * p value < 0.05.
| Factors | 2014 | 2015 | 2016 | 2017 | 2018 | 2019 | 2020 | R Value Mean | Correlation |
|---|---|---|---|---|---|---|---|---|---|
| Gross Domestic Product | 0.666 *** | 0.655 *** | 0.694 *** | 0.652 *** | 0.675 *** | 0.671 *** | 0.666 *** | 0.668 | Positive |
| Actual electricity consumption | 0.665 *** | 0.654 *** | 0.691 *** | 0.648 *** | 0.671 *** | 0.665 *** | 0.660 *** | 0.665 | Positive |
| Percentage of cultivated land area | 0.611 *** | 0.603 *** | 0.596 *** | 0.617 *** | 0.603 *** | 0.636 *** | 0.632 *** | 0.614 | Positive |
| Nighttime lighting index | 0.581 *** | 0.574 *** | 0.612 *** | 0.569 *** | 0.598 *** | 0.601 *** | 0.605 *** | 0.591 | Positive |
| Percentage of surface water area | 0.522 *** | 0.506 *** | 0.536 *** | 0.546 *** | 0.557 *** | 0.571 *** | 0.563 *** | 0.543 | Positive |
| Rice cultivation area | 0.396 *** | 0.425 *** | 0.503 *** | 0.557 *** | 0.475 *** | 0.527 *** | 0.531 *** | 0.488 | Positive |
| Maize cultivation area | 0.457 *** | 0.461 *** | 0.361 *** | 0.400 *** | 0.412 *** | 0.398 *** | 0.397 *** | 0.412 | Positive |
| Ecosystem quality index | 0.313 *** | 0.346 *** | 0.336 *** | 0.373 *** | 0.3523 *** | 0.335 *** | 0.341 *** | 0.342 | Positive |
| Rare plant and animal biodiversity | 0.245 *** | 0.263 *** | 0.267 *** | 0.286 *** | 0.317 *** | 0.308 *** | 0.312 *** | 0.285 | Positive |
| Percentage of forest area | 0.202 *** | 0.239 *** | 0.229 *** | 0.267 *** | 0.252 *** | 0.226 *** | 0.223 *** | 0.234 | Positive |
| Distance to natural attractions | 0.217 *** | 0.179 *** | 0.269 *** | 0.243 *** | 0.242 *** | 0.215 *** | 0.227 *** | 0.227 | Positive |
| Distance to railway | 0.061 * | 0.127 *** | 0.123 *** | 0.113 *** | 0.139 *** | 0.133 *** | 0.131 *** | 0.118 | Positive |
| Distance to river | 0.077 ** | 0.072 *** | 0.076 *** | 0.058 * | 0.053 | 0.062 * | 0.067 * | 0.066 | Positive |
| Distance to road | 0.059 * | 0.033 | 0.032 | 0.012 | 0.063 * | 0.091 ** | 0.088 ** | 0.054 | Positive |
| Distance to hospital | −0.013 | 0.021 | −0.041 | −0.021 | 0.049 | 0.048 | 0.158 *** | 0.029 | - |
| Distance to school | −0.046 | 0.009 | −0.051 | −0.035 | 0.049 | 0.047 | 0.052 | 0.004 | - |
| Vegetation index | −0.048 | 0.022 | −0.014 | 0.023 | 0.005 | 0.024 | 0.014 | 0.004 | - |
| Distance to energy-consuming industrial heat sources | −0.012 | −0.042 | −0.035 | 0.010 | 0.010 | 0.025 | 0.014 | −0.004 | - |
| Precipitation | 0.087 ** | −0.089 ** | −0.068 * | 0.047 | −0.060 * | −0.147 *** | −0.097 *** | −0.047 | - |
| Near-surface SO2 concentration | −0.234 *** | −0.265 *** | −0.259 *** | −0.301 *** | −0.291 *** | −0.274 *** | −0.280 *** | −0.272 | Negative |
| Near-surface CO concentration | −0.236 *** | −0.263 *** | −0.262 *** | −0.323 *** | −0.300 *** | −0.290 *** | −0.288 *** | −0.280 | Negative |
| O3 concentration | −0.264 *** | −0.307 *** | −0.273 *** | −0.294 *** | −0.291 *** | −0.287 *** | −0.290 *** | −0.287 | Negative |
| PM2.5 concentration | −0.412 *** | −0.471 *** | −0.455 *** | −0.499 *** | −0.486 *** | −0.479 *** | −0.467 *** | −0.467 | Negative |
| Potential evapotranspiration | −0.454 *** | −0.470 *** | −0.456 *** | −0.496 *** | −0.478 *** | −0.468 *** | −0.468 *** | −0.470 | Negative |
| PM10 concentration | −0.428 *** | −0.470 *** | −0.454 *** | −0.497 *** | −0.486 *** | −0.495 *** | −0.475 *** | −0.472 | Negative |
| Fossil fuel emission | −0.582 *** | −0.567 *** | −0.597 *** | −0.550 *** | −0.573 *** | −0.570 *** | −0.574 *** | −0.573 | Negative |
Disclaimer/Publisher’s Note: The statements, opinions and data contained in all publications are solely those of the individual author(s) and contributor(s) and not of MDPI and/or the editor(s). MDPI and/or the editor(s) disclaim responsibility for any injury to people or property resulting from any ideas, methods, instructions or products referred to in the content. |
© 2024 by the authors. Licensee MDPI, Basel, Switzerland. This article is an open access article distributed under the terms and conditions of the Creative Commons Attribution (CC BY) license (https://creativecommons.org/licenses/by/4.0/).
Share and Cite
MDPI and ACS Style
Shao, L.; Jia, G.; Qiu, Y.; Liu, J. Evaluation and Analysis of the County-Level Sustainable Development Process in Guangxi, China in 2014–2020. Sustainability 2024, 16, 1641. https://doi.org/10.3390/su16041641
AMA Style
Shao L, Jia G, Qiu Y, Liu J. Evaluation and Analysis of the County-Level Sustainable Development Process in Guangxi, China in 2014–2020. Sustainability. 2024; 16(4):1641. https://doi.org/10.3390/su16041641
Chicago/Turabian StyleShao, Lanqing, Guoqiang Jia, Yubao Qiu, and Jianming Liu. 2024. "Evaluation and Analysis of the County-Level Sustainable Development Process in Guangxi, China in 2014–2020" Sustainability 16, no. 4: 1641. https://doi.org/10.3390/su16041641
Note that from the first issue of 2016, this journal uses article numbers instead of page numbers. See further details here.