
Polycentric Urban Spatial Structure Identification Based on Morphological and Functional Dimensions: Evidence from Three Chinese Cities


1
College of Art and Design, Suzhou Chien-Shiung Institute of Technology, Suzhou 215411, China
2
College of Architecture and Urban Planning, Tongji University, Shanghai 200092, China
3
College of Architecture and Urban Planning, Suzhou University of Science and Technology, Suzhou 215011, China
*
Author to whom correspondence should be addressed.
Sustainability 2024, 16(6), 2584; https://doi.org/10.3390/su16062584
Submission received: 19 February 2024
/
Revised: 15 March 2024
/
Accepted: 18 March 2024
/
Published: 21 March 2024
(This article belongs to the Section Sustainable Urban and Rural Development)
Abstract
:Regarding whether a polycentric urban spatial structure is a sustainable urban development model, various studies use different employment center identification methods, resulting in inconsistent conclusions. This paper takes Hangzhou, Wuhan, and Nanning, three Chinese cities at different stages of development as cases, and adopts various methods to identify employment centers to compares the polycentric spatial structure differences from morphological and functional dimensions, and puts forward a multi-dimensional perspective for analyzing the characteristics of the polycentric spatial structure. The results show that the polycentric model of GL_SC threshold method has the relatively good explanatory power, which can best represent the characteristics of urban development in China. The explanatory power of the polycentric model of the Wuhan commuter flow method (adjusted R-squared value is 0.37) is slightly weaker than that of the GL_SC threshold method (adjusted R-squared value is 0.40), indicating that the agglomeration development forces are equivalent to the decentralized development forces and it is a balanced polycentric development structure. In Hangzhou and Nanning, the GL_SC threshold method (adjusted R-squared values are 0.28 and 0.36, respectively) is stronger than the commuter flow method (adjusted R-squared values are 0.19 and 0.33, respectively), which reflects the strong characteristics of agglomeration polycentric development. However, from the comparison of the number and distribution of employment center identification, the polycentric development characteristics of Hangzhou are stronger than those of Nanning. The comparison of the identification results of the morphological and functional dimensions shows that the two dimensions as a unified evaluation process can more fully reflect the characteristics of an urban polycentric development structure, thereby providing preliminary research support for the study of the impact of polycentric structure on economic development, air pollution, work and residential commuting, etc.
1. Introduction
The traditional urban economic spatial structure is considered to be a typical monocentric or concentric circle structure, the most typical of which is Alonso’s (1964) monocentric city model based on Bit-Rent Curves [1]. As the economic activities of a city spread outward from the CBD (central business district), the influence of the CBD on the city gradually decreases with the increase in the distance between the region and the CBD. In the 1980s, due to the development of transportation and communication technologies and structural changes in the economy, many big cities evolved into multiple employment centers [2], and the monocentric city model gradually lost its explanatory power. Based on the Bit-Rent theory, Fujita and Ogawa [3] proposed that an agglomeration economy, i.e., through the increase of centrifugal force or urban scale would bring about the transformation of urban spatial structure from being monocentric to polycentric. Anas and Kim [4] studied the general equilibrium model and found that the number of centers increased with the increase in traffic congestion. Anas et al. [2] argued that the emergence, growth, and decline of new employment centers are the result of tradeoffs between the “agglomeration economy” and “agglomeration diseconomy”. McMillen and Smith [5] found that U.S. cities reach a critical mass (about 2.6 million inhabitants) when secondary centers emerge.
As the world’s largest cities become more and more polycentric, more approaches focus on the identification of employment centers. Due to the differences in urban development backgrounds in Europe and the United States, the identification of employment centers has roughly formed two methods: morphology and function [6]. The morphological method basically follows the framework of the agglomeration economy of North America, whereby the urbanization model is a process of decentralization from the CBD to emerging sub-centers; therefore, employment centers can be identified by the internal characteristics of the centers (e.g., size, density, etc.) [7,8,9,10,11]. The functional method is based on the central place and central flow theory [12] of Europe, whereby metropolitan areas are achieved by combining or merging existing independent or historical town centers, such as the Ranstad region of the Netherlands, where cities of 0.2 to 1 million inhabitants make up metropolitan areas with a population of more than 5 million, so employment centers are identified using a functional approach (e.g., commuter traffic), i.e., the importance of central location [6,13,14].
Since the 1980s, China’s land and housing market reform has led to the transfer of residents and industries from inner cities to suburbs, and big cities have experienced suburbanization similar to that of North America. Relevant studies have shown that although China’s big cities tend to be polycentric, the monocentric spread or strong center structure have not been fundamentally changed [15]. The Chinese government, rather than market forces, played a key role in determining the initial location and pace of development of urban sub-centers [16]. It can be seen that China’s urban polycentric development combines two mechanisms: the decentralization process led by North American market forces and the joint development led by European administrative forces. Comparing the structural characteristics of urban polycentric development from the morphological method represented by North America and the functional method represented by Europe can better reflect what forces are dominating urban development in China, and there is still a lack of empirical comparative research from this perspective. In 2023, China’s urbanization level reached 66.16 percent; however, due to the differences in economic development levels in the eastern, central, and western regions, the urbanization level is quite different. For example, in 2023, the urbanization level in Guangdong, Zhejiang, Jiangsu, and other eastern coastal developed provinces exceeded 70 percent, while that of Hubei, Anhui, and other developing provinces in Central China exceeded 65 percent, and that of Guangxi, Guizhou, and other less developed provinces in the western regions are lower than the national average. Therefore, this paper takes Hangzhou, Wuhan, and Nanning, three Chinese cities at different levels of urbanization development in the east, middle, and west, as cases to compare the characteristics of polycentric development from morphological and functional dimensions, and it verifies which method is more suitable to explain the polycentric phenomenon of Chinese cities. This study tries to answer three questions: firstly, whether the spatial distribution characteristics of employment centers identified by the morphological and functional dimensions is different for cities with different development levels; secondly, whether the polycentric spatial structure identified by the morphological and functional dimensions is different for cities with different development levels; and thirdly, the comparison of morphological and functional dimensions can be used to study whether the polycentric spatial structure is a sustainable urban development structure.
2. Relevant Literature Review
2.1. Employment Center Identification Method
2.1.1. Morphological Method
The morphological method identifies employment centers through the concentration of employment activities, which roughly includes three methods such as the threshold method, the employment density function method, and the exploratory spatial statistics method.
The threshold method commonly uses employment density [7,8,11,17,18] and employment-to-residence ratio [19,20,21] indicators. The employment density indicator considers that the employment center is a place where employment activities are highly concentrated relative to the surrounding areas, which is divided into the absolute threshold method and the relative threshold method. The absolute threshold method is represented by Giuliano and Small [7], who identify a series of continuous units greater than the minimum employment density D (10 people/acre) and the minimum employment population E (more than 10,000 people) as employment centers [8,17,18]. The main shortcoming and difficulty of the method is setting the minimum density threshold point, which is usually determined by trial and error and is susceptible to subjective factors. To this end, Muñiz and Garcia-Lopez [11] proposed the relative threshold method, which identifies continuous units that are greater than the average employment density and 1% of the total employed population of metropolitan areas as employment centers. This method can adopt the same criteria in different cities without repeatedly evaluating the threshold value [22,23]. The employment-to-residence ratio believes that industrial areas do not have high employment density while attracting a large number of commuter inflows, but these areas should also be considered as employment concentrations [20,21], for example, Shearmur and Coffey [21] identify continuous units with a employment-to-residence (E/R) ratio greater than 1 and a total employed population greater than 500 as urban employment centers in Canada.
The employment density function method identifies employment centers by the local peak of the employment density surface of metropolitan areas, and this method is divided into parametric [24] and non-parametric methods [5,25,26,27,28,29,30,31,32]. The parameter method uses a monocentric model to simulate the density surface [24]. However, the monocentric one-dimensional symmetrical spatial pattern does not conform to the reality of the multidimensional development of urban space. The non-parametric method can obtain the complex density surface through a series of local fitting, which can reflect the multi-dimensional characteristics of the urban spatial structure. The most commonly used non-parametric method is the locally weighted regression (LWR) model, which was first adopted by McMillen and McDonald [25]. McMillen [26] proposed the two-step non-parametric method, McMillen and Smith [5] combined McMillen [26] with Giuliano and Small’s [7] threshold method, Redfearn [27] adopted an iterative method to identify employment centers based on McMillen [26], and Lee [28] adopted geographical weighted regression (GWR) on the basis of McMillen and Smith [5]. LWR is the general case of GWR, with the main difference between the two being that GWR takes spatial dimensions into account by defining a weight matrix, while LWR allows geographic coordinates to be their own explanatory variables. In addition, quantile spline functions [29] and kernel density functions [30] are also used to identify employment centers.
The exploratory spatial statistics method uses local spatial autocorrelation statistics to identify employment centers, including local Moran’s I value [31,32] and local Getis-Ord Gi* statistics [33,34]. In some cases, the two are similar, with the main difference being that the former can recognize spatial positive correlation (HH, LL) and negative correlation (HL, LH), while the latter can only recognize spatial positive correlation. Baumont et al. [31] adopted employment density, and Riguelle et al. [32] adopted the logarithm of the employment density variable to conduct local Moran’s I statistics and identified the unit with statistical significance (p < 0.05) and the aggregation of HH and HL as the employment center. Asikhia and Nkeki [33] identified units with Gi* statistics as significant within 1 km of the surrounding area (standardized residual > 1.96) and employment density greater than 2.5 jobs per acre as employment centers.
2.1.2. Functional Method
The functional method considers employment centers as attracting most commuters working outside the central city. Therefore, nodes that attract more commuters are identified as employment centers [6,13,14,35]. Burns et al. [35] identified areas with a self-containment index greater than 50%, a net employment inflow of at least 15%, and a total employment population greater than 20,000 as Spanish metropolitan centers. Aguilera [13] identifies adjacent units that attract the largest proportion of workers and account for 85% of the non-local commuter population of metropolitan area as employment centers. Roca et al. [14] used a bottom-up approach to identify units with the greatest interaction, with greater than 50% self-containment and an employment population of more than 5000 as Barcelona’s employment centers. Veneri [6] identified units with an in-degree index, directional dominance index, and productive completeness index greater than 1 as employment centers. In recent years, with the rise of multi-source big data, some studies have adopted other forms of functional linkage flow to identify urban centers [36,37], and Roth et al. [36] and Cats et al. [37], respectively, adopted the London Subway passenger flow and the Stockholm public transport passenger flow to identify urban centers.
2.1.3. Comparison of Morphological and Functional Methods
In empirical research, there is no clear boundary between the morphological and functional methods. In Barcelona, Roca et al. [14] identified 8, 16, 21, 19, 27, 25, and 20 centers by using the threshold, relative threshold, gravity model, exponential model, LWR model by traffic axis, GWR, and functional methods, respectively, and believed that the functional method was more suitable for European cities. In short, no perfect employment center identification method has yet been formed. The threshold method requires researchers to be familiar with the local situation and the threshold setting is subjective, the non-parametric method is more sensitive to the search radius and window threshold setting [38], the spatial statistical method is sensitive to the spatial weight matrix as well as the granularity and precision of spatial data [35], while the commuter flow method is sensitive to the threshold of the commuter index. Yu et al. [39] found that the differences in the employment center identification methods resulted from the unclear definition of employment centers, differences in data types, spatial scales, and urban development backgrounds. In China, most empirical studies on polycentric urban spatial structure adopt one morphological approach [22,40], rarely used multi-method comparative studies from the two dimensions of morphology and function. Mobile signaling data can be located to the user’s base station location, and effective algorithms can be used to obtain population and employment distribution data similar to census data, as well as work–residence commuting contact data of traffic surveys, which are a kind of large-sample real-time data, providing a good data source for identifying urban spatial structure [23]. As in this study, the mobile phone signaling data of the three cities were acquired in 2017; the relevant data analysis was conducted in similar years. In this study, based on the commuter population identified by mobile phone signaling data, employment centers can be identified not only by the morphological method of the internal characteristics of the centers but also by the function method of the interaction of the centers, which provides a basis for the comparative study of the two dimensions.
2.2. Urban Spatial Structure Identification
In order to verify the effectiveness of different methods in identifying employment centers, urban researchers mostly adopt monocentric and polycentric population density models to verify and evaluate the impact of employment centers on urban spatial structure [2]. Clark [41], Tanner [42] and Sherratt [43], Smeed [44], Newling [45], Anderson [46], and others studied the monocentric population density models. The polycentric population density model is represented by three hypotheses proposed by Heikkila et al. [47]. Hypothesis 1 holds that residents are only affected by the nearest center, and a city is composed of multiple monocentric subdistricts. McMillen and McDonald [25] modified hypothesis 1 by adding CBD distance to the model, that is, it is assumed that the CBD has a global influence and the sub-center has a local influence. Subsequently, McMillen and Lester [48], McMillen [49], Baumont et al. [31], Garcia-Lopez and Muñiz [50], Huang et al. [51], and Zhang et al. [22] adopted this model to study the urban spatial structure of Chicago, Dijon, Barcelona, Beijing, and Shanghai. Hypothesis 2 considers that the effects of different employment centers on population density are complementary (multiplicative effect). McDonald, Prather [24], and Moghadam et al. [52] adopted hypothesis 2 and found that Chicago and Sydney tended to be more polycentric. Hypothesis 3 considers the central forces to be between hypothesis 1 and hypothesis 2 (additive effect). Small and Song [8] as well as Alidadi and Dadashpoor [53] adopted hypothesis 3 and found that Los Angeles and Tehran tended to be polycentric.
Empirical studies have shown that the key to urban spatial structure model validation lies in the number and location of centers, and the randomness of center identification has a great impact on model results. If there are too few centers, the estimation coefficient will be biased, while if there are too many centers, it is difficult to avoid the multicollinearity problem [8,11,49,54]. Muñiz et al. [11] found that the distance between the sub-center and the CBD or the sub-center was too close, resulting in the overlapping effect of density, while hypothesis 1 eliminated this effect. Craig et al. [54] used the proximity criterion (commuting distance of employment centers) to estimate the population and employment polycentric density function, and they found that the subcenter attraction is interconnected, which further verified hypothesis 1. Therefore, hypothesis 1 better avoids the multicollinearity problem; in this paper, hypothesis 1 is used to verify the different impact of morphological and functional urban spatial structure, and to determine which identification results are more suitable for the reality of urban development in China.
3. Data and Methodology
3.1. Research Area
This paper takes Hangzhou, Wuhan, and Nanning, three provincial capitals of China as the research objects (see Figure 1). Hangzhou is the capital of Zhejiang Province and one of the central cities in the Yangtze River Delta, and in 2018, it had an urban area of 8289 km2, 10 districts under its jurisdiction, a permanent population of 8.57 million, an urbanization rate of 77.40%, and a per capita GDP of USD 2.8 million. Wuhan is the capital of Hubei Province and a central city in Central China, and in 2018, it had an urban area of 8494 km2, 13 districts under its jurisdiction, a permanent population of 11.081 million, an urbanization rate of 73.20%, and a per capita GDP of USD 2 million. Nanning is the capital of Guangxi Province and the central city of Western China, and in 2018, it had an urban area of 9836 km2, 7 districts under its jurisdiction, a permanent population of 4.48 million, an urbanization rate of 62.40%, and a per capita GDP of USD 8000. The urban area and terrain of the three cities are similar, and the urban population size and economic development level are different, which are conducive to the comparative study of the polycentric development difference of cities in different development stages.
Chinese cities are broad areas defined by administrative boundaries, often covering some non-urbanized areas, and as this study mainly focuses on urban population activities, most of which occur in urbanized areas, non-urbanized areas with low population density should therefore be avoided. Li and Monzur [55] found that the smaller the scale of unit identification, the more polycentric the city tends to be, so this study uses the TAZ (Traffic Analysis Zones) unit, which is smaller than the street unit.
3.2. Research Data and Processing
In this study, the mobile phone signaling data for one consecutive month in March, April, and August 2017 in Nanning, Hangzhou, and Wuhan were used as the basic data, and the same year’s data made the results comparable. First, the stay table is obtained by combining the records that are closer to the user’s track (1000 m) or closer to the time of the user’s activity track in the mobile phone signaling data. Secondly, according to the stay table, the cumulative time method is adopted; the place where the user stays in the same base station for the longest time and for more than 1 h at night (20:00–6:00) and in the day (9:00–16:00) is used as the user’s residence and workplace on that day. Thirdly, for 30 or 20 consecutive days (working days) within a month, the residence and workplace of the same place where the repeated recognition rate is greater than or equal to 50% and the commuting distance is greater than zero (the commuting distance of zero may be for retired or homebound people and short-distance commuting employees) is taken as the final recognition result. Hangzhou, Wuhan, and Nanning identified 2.2283, 1.1986, and 0.8249 million work–residence commuters respectively.
3.3. Research Methods
3.3.1. Identifying Employment Centers
- (1)
- Threshold method
This paper compares Giuliano and Small [7], Muñiz and Garcia-Lopez [11], Shearmur and Coffey [21], and Zhu et al. [23] with the absolute threshold (GS), relative threshold (GL), employment–residence ratio (SC), and comprehensive threshold (GL_SC.) methods, and it found that the GL_SC method has the best result. The GL_CS method indicators are as follows:
In the central urban area (within the outer ring), the combination of Formulas (1)–(3) is used to identify the employment center. Outside the central urban area, the employment center is identified by a combination of Formula (1), (5) or a combination of Formulas (4), (2), and (5) as follows:
where is the employment density of the TAZ unit (person/km2), is the average employment density of all the TAZ units, is the employment population of the TAZ unit, is the resident population of the TAZ unit, is the total employed population of the adjacent units (queens rule is adopted), E is the total employed population of all the TAZ units, and is the average employment density of all the TAZ units outside the central urban area.
- (2)
- Non-parametric method
In order to test the fitting effect of the non-parametric model, the monocentric parameter model of McDonald and Prather [24] was used to simulate and compare its fitting degree. The formula is as follows:
where is the employment density of the TAZ unit (person/km2), is the distance from the TAZ unit to the CBD (using Euclidean distance), is the employment density at distance zero, is the density gradient, and ε is the error term.
The non-parametric model adopts the two-step method proposed by McMillen [26], and in the first step, the non-parametric model is used to simulate the employment density surface in ArcGIS1.5 software, and the formula is as follows:
where is the employment density of the TAZ unit, is the north–south and east–west distance from the TAZ unit to the CBD (using Euclidean distance), and the space weight of in Equation (12) is estimated based on quadratic function [5,56,57], with the formula being as follows:
where is the distance between unit i and adjacent unit j, and b is the bandwidth, that is, the window size estimated by the function. Krehl [38] found that window size had a greater impact on employment center identification, smaller Windows could better simulate the density surface, but fewer employment centers could be identified. Therefore, this paper simulated the employment density surface of 1%, 10%, 25%, and 50% units, respectively, and adopted the window with the best recognition effect to participate in the calculation of the second step. In the second step, the units whose residuals were significantly positive (p < 0.05) and the nearest adjacent units (within 1 km) were combined as the final employment centers.
- (3)
- Exploratory spatial data analysis method (ESDA)
Local Moran’s I statistic is adopted, and the key technology of this statistic is the selection of spatial weight matrix [31]. In this paper, the spatial weight matrix with the highest global Moran’s I value is used to calculate the local Moran’s I value. The local Moran’s I statistic is calculated by the following formula:
where is the local spatial autocorrelation statistic of the TAZ unit, and are the characteristic attributes of TAZ units i and j, in this paper they are employment density (or logarithm of employment density), is the average value of attributes between units i and j, is the spatial weight matrix between units i and j, i represents an observation unit, j represents the length of the spatial weight matrix, and n stands for number of observations. The units with HH and HL clusters, values of statistical significance (p < 0.05), and adjacent units with a total employed population greater than 0.25%E (E is the total employed population) are identified as employment centers.
- (4)
- Commuter flow method
The commuter flow method uses three commuter indicators proposed by Aguilera [13] and Venri [6], namely inward commuting rate (), in-degree index (), and directional dominance index (), to identify employment centers. The formula is as follows:
where is the number of the employed population in TAZ i, is the number of the population living and working in TAZ i, is the amount of all incoming commutes that go directly to the i node (consider the TAZ unit as a node), is the total number of commutes flowing directly from node i, is the inward commuting number of other j nodes in the metropolitan area to node I, and J is the number of nodes. The adjacent units with greater than 85%, and greater than 1, and the total employed population greater than 0.25%E (E is the total employed population) are identified as employment centers.
3.3.2. Urban Spatial Structure Validation
This paper adopts the monocentric and polycentric employment population density models for verification by comparing the R-squared value and the fitting coefficient of the ordinary least square estimation (OLS); the differences in the explanatory power of the results identified by the above methods were analyzed. The monocentric model adopts Equations (6)–(11) mentioned above, and the polycentric model adopts the revised hypothesis 1 of Heikkila et al. [47], that is, the CBD has global influence and the sub-center has local influence. The model formula is as follows:
where is the employment density of TAZ unit i, the CBD is the TAZ unit with the highest employment density, and are the distance from the TAZ unit to the CBD and the nearest sub-center, respectively, γ measures the influence of CBD and δ measure the influence of the nearest sub-center, and ε is the error term. Using OLS estimation, the model hypothesis is valid when the coefficients (γ < 0, δ < 0) are significant and negative, indicating that the employment density decreases with the increase in distance and that the higher the absolute value of the coefficient, the greater the influence on the employment distribution.
McMillen and Lester [48] and McMillen [49] found that the high nonlinearity between spatial units would affect the fitting effect of the OLS model, and the non-parametric model could explain the employment density surface better than the OLS model. In this paper, the non-parametric method of GWR is used to modify model (18), whose equation is as follows:
The GWR model assumes that the effect of the CBD also has a certain range, the size of which is determined by the observation window. This paper focuses on the influence range of the CBD and the sub-center, and when the influence coefficient of the CBD and the sub-center is negative, this unit is its influence range. The spatial weights of observations were defined by the quadratic function of Equation (13) above, and since the window size has an impact on the regression results, this paper measured the influence of different window sizes on the results, and the window with the best explanatory power was adopted as the final analysis result.
4. Results and Validation
4.1. Employment Center Identification Results
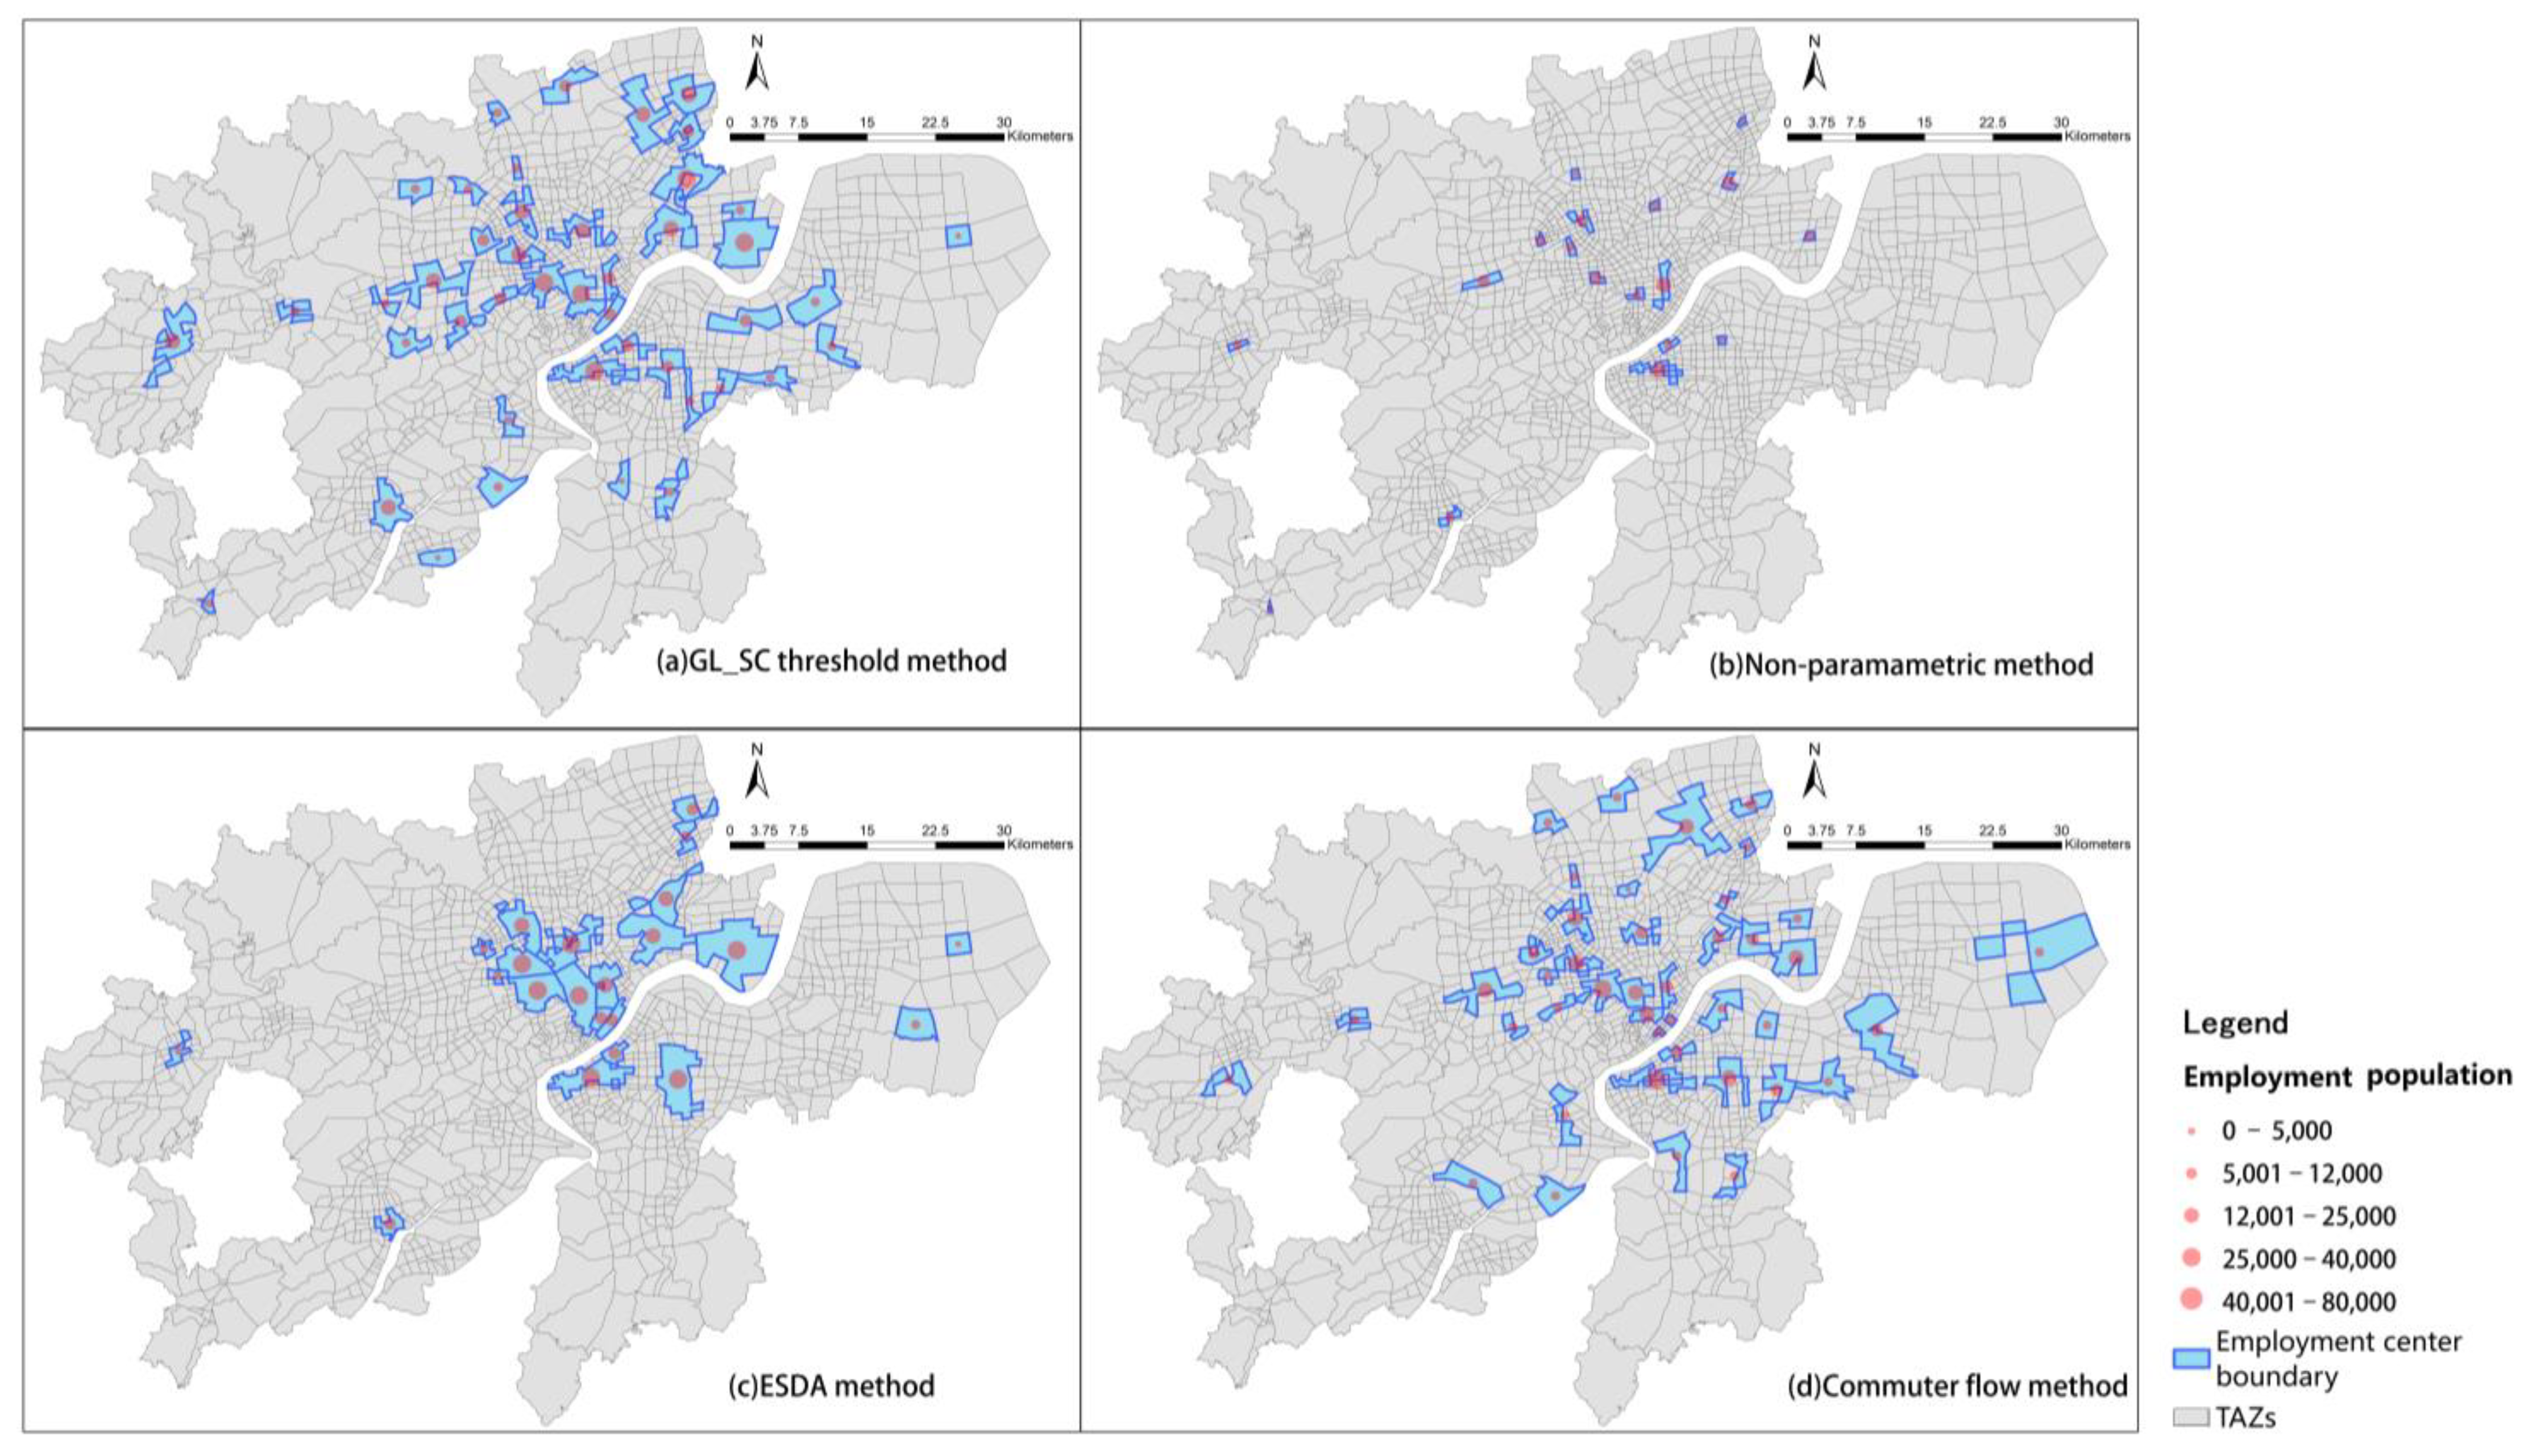
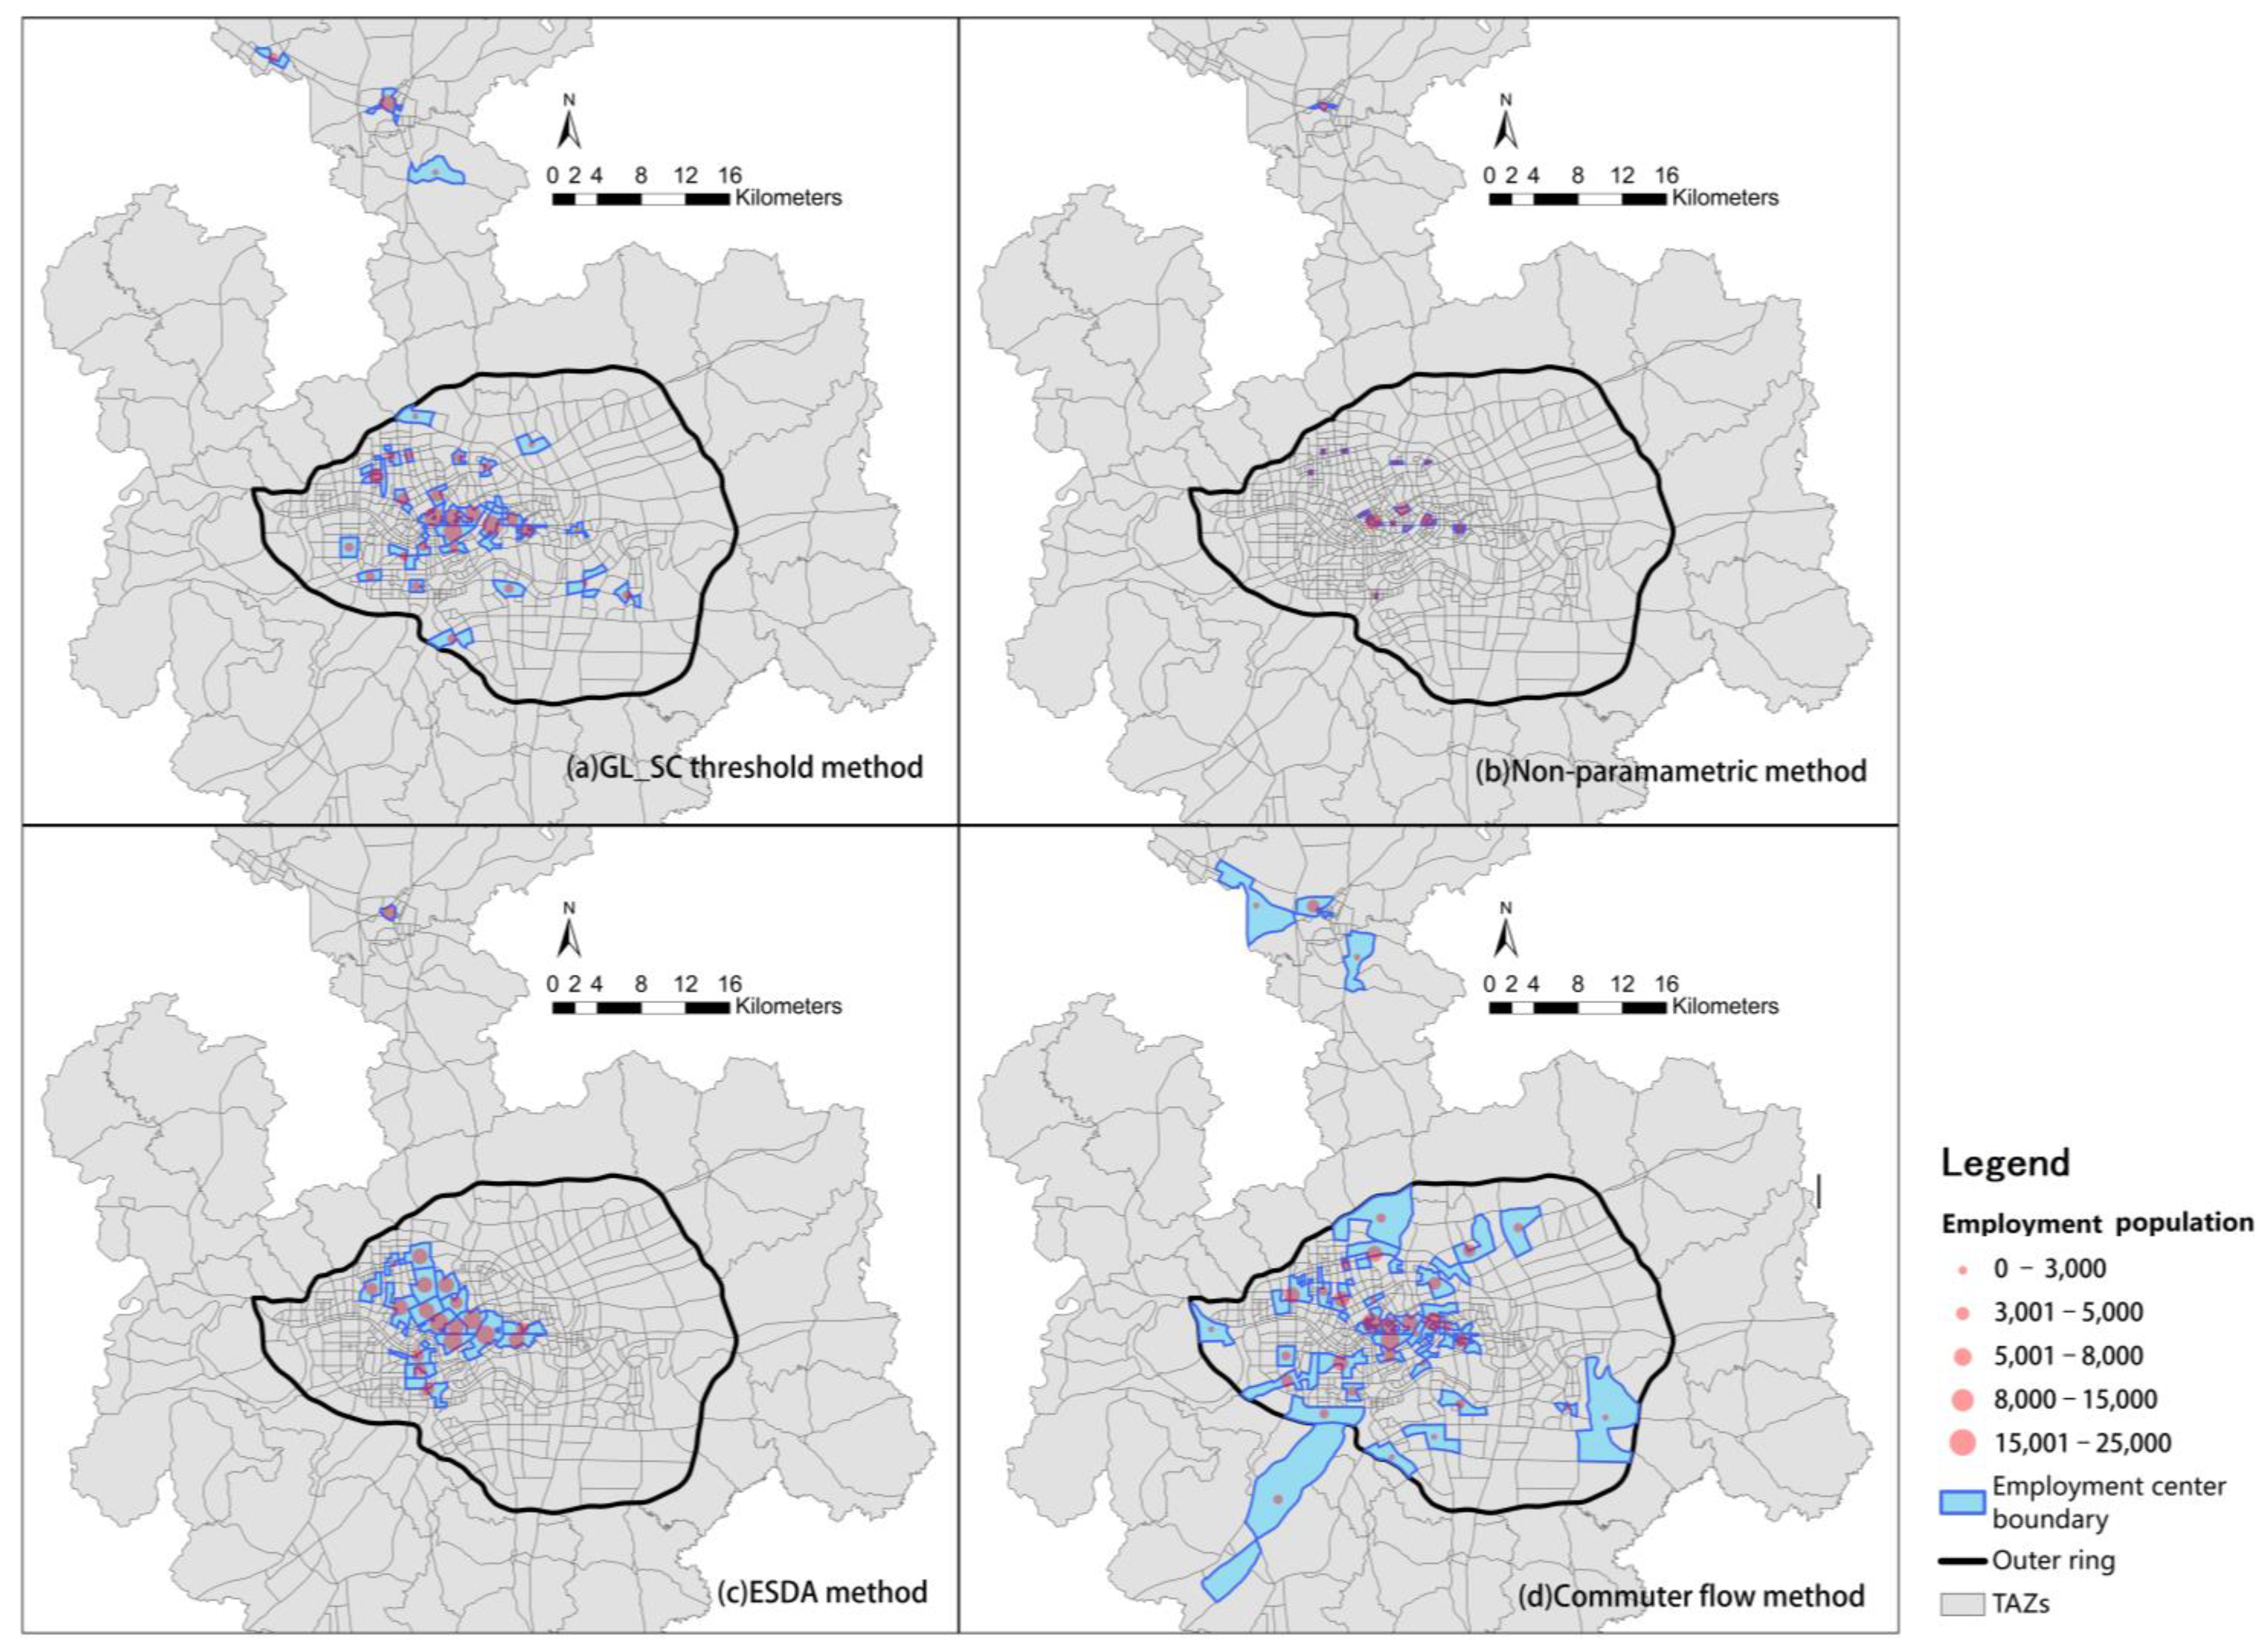
The recognition results of the threshold method are shown in Table 1. The employment centers are identified by the GS method are the least and most of them are located in the central urban area, and the higher the level of urbanization the more employment centers identified, which is similar to the results of European and American studies [7,8,17,18]. The number of employment centers identified by the GL is more than that by the GS [11], and its average employment density threshold standard is broader than that by the absolute threshold method, resulting in almost continuous employment centers in the central urban area. The SC has a good effect on the identification of manufacturing employment centers in suburban areas [21], but the identification of employment centers in the suburbs comprises too many of them and the area is too large. The GL_SC adopted in this paper avoids the disadvantages of the previous methods; it identifies the employment centers with greater development potential in the suburbs and avoids residential areas with low employment density in the old urban areas that are identified, and the boundaries of employment centers are clear, with 44, 45, and 30 employment centers being finally identified in Hangzhou, Wuhan, and Nanning.
The fitting effects of parametric and non-parametric models are shown in Table 2 (Table A1, Table A2 and Table A3), which are consistent with the research conclusion of McMillen [26], the three-city non-parametric model shows better fitting degree than the parametric model. The comparison of non-parametric models with Windows of different sizes is consistent with the results of Krehl [32], and the fitting effect decreases as the window scope expands. The McMillen [26] method was used to determine the number of candidate employment centers; it was found that under the window size of 1%, 10%, 25%, and 50%, there were (35, 61, 67, 70), (57, 89, 93, 98), and (16, 34, 35, 40) TAZ units in Hangzhou, Wuhan, and Nanning, respectively, with a significance level of 5%. Although the 1% window has the best fitting degree, its identification efficiency is low. When the window is greater than 10%, the identification efficiency is not much improved. Therefore, this paper adopts the 10% window to identify employment centers and finally identifies 18, 25, and 14 employment centers in Hangzhou, Wuhan, and Nanning.
The ESDA method takes employment density and the logarithm of employment density as variables, respectively, and compares the global Moran’s I values under different spatial weight matrices. Table 3 shows that the global Moran’s I value with the logarithm of employment density as a variable is higher than that with employment density as a variable. When the logarithm of employment density is a variable, the global Moran’s I value is the highest under Queen’s law. Therefore, this paper uses the logarithm of employment density (Queen’s rule) to calculate the local Moran’s I value to identify employment centers; Hangzhou, Wuhan, and Nanning identify 22, 23, and 19 employment centers, respectively. The employment center identified by this method is basically located in the central urban area, and the identification efficiency is not high for the suburbs with low employment density.
The commuter flow method identified 42, 47, and 35 employment centers in Hangzhou, Wuhan, and Nanning, respectively. In addition to the large area of some suburban industrial employment centers, the size of employment centers is similar to the identification results of the GL_SC threshold method, and most of the employment centers have clear boundaries and moderate sizes. The difference between the results of the commuter flow method and the GL_SC threshold method is that the latter can identify the suburban urban employment center well, while the former has a poor identification effect due to the weak employment attraction of some suburban towns, but the identification effect of the suburban industrial employment center is better.
4.2. Comparison of Recognition Results from Morphological and Functional Dimensions
According to the comparison of four identification methods (Table 4, Figure 2, Figure 3 and Figure 4), the results of employment centers identified by different methods in the same city are quite different, which is consistent with the research results of Roca et al. [14]. Different cities adopt the same method, and the number, area, and spatial distribution trend of employment centers are consistent. All four methods can be compared and applied in different cities according to specific research needs.
There are great differences in the spatial distribution characteristics of employment centers in the morphological and functional dimensions. The employment centers identified by the morphological dimension generally presents centralized dispersion characteristics. The results identified by the ESDA method has the most significant agglomeration characteristics; most of the employment centers are located in urban centers and in continuous pieces. Although the employment centers identified by the non-parametric method are few and small, most of them are also clustered in the central urban area. Although the threshold method identified more employment centers outside the central urban area, the proportion of the employment center population in the central urban area was still the largest. From the comparison of the three morphological methods, it is found that the number of employment centers identified outside the central urban area of Hangzhou is the largest, followed by Wuhan and Nanning, indicating that the polycentric development trend of Hangzhou is the strongest, followed by Wuhan and Nanning. The employment centers identified by functional dimension generally show the characteristics of decentralized concentration, which is reflected in how the number of employment centers outside the central urban area is higher than that of the morphological method, the area is larger, and the distribution is more diffuse, but the employment centers in the central urban area are still centralized.
The number, area, and size of employment centers identified by the GL_SC threshold method and the commuter flow method are close, and the boundary is clear, which better represents the two recognition methods of morphological and functional dimensions. The former represents the force of the agglomeration economy on urban space development, while the latter represents the influence of decentralized development forces on urban spatial development. The employment center population proportion identified by the GL_SC threshold and the commuter flow method in Hangzhou has the largest difference, indicating that the economic attraction of employment center agglomeration is dominant in Hangzhou. The employment center population proportion identified by the GL_SC threshold in Wuhan is slightly higher than that identified by the commuter flow method, indicating that the difference between the agglomeration economy and the decentralized development forces in Wuhan employment centers is small. The employment center population proportion identified by the commuter flow in Nanning is higher than that identified by the GL_SC threshold method, indicating that the polycentric development of Nanning depends on the attraction of suburban industrial centers to surrounding employment, but these centers have a weak influence on the urban agglomeration economy.
4.3. OLS Regression Verification of Monocentric and Polycentric Urban Spatial Structures
The fitting degree of the monocentric model is shown in Table 2. It shows that the logarithmic version of the negative exponential model has the strongest explanatory power (0.174, 0.291, and 0.295 in Hangzhou, Wuhan, and Nanning, respectively), except that the logarithmic version of the power model in Nanning has the highest adjusted R-squared value (0.344). Comparing Table 2 with Table 5, it is found that the adjusted R-squared values by the polycentric model of the four identification methods are all higher than that of the monocentric model, indicating that Hangzhou, Wuhan, and Nanning all tend to be polycentric.
From the effectiveness of the model, except that the influence the coefficient of the Wuhan ESDA method () is positive and does not conform to the hypothesis of the original model, other results show that the employment density decreases with the increase in the distance from the CBD and an employment subcenter. From the significance of the model influence coefficient (T-value), except that the Wuhan non-parametric method () is negatively correlated with the 0.01 significance level, all of them have a significant negative impact with a 0.001 significance level. The rationality of the existence of employment centers has been verified.
The Hangzhou GL_SC threshold method shows that the effects of the employment sub-center (T-value = −15.55) is stronger than that of the CBD (T-value = −13.27), indicating that the agglomeration economy of employment sub-centers has a strong decentralization effect on the CBD. The ESDA method shows that the effects of employment sub-centers and CBD are almost equal (T-value = −11.77 and −11.90, respectively), indicating that the agglomeration economic effects of the two in Hangzhou are similar. The non-parametric method and the commuter flow method show that the influence of the CBD is much stronger than that of the employment sub-center, indicating that the CBD is stronger than the employment sub-center. The comparison between the Hangzhou GL_SC threshold method (adjusted R-squared value is 0.28) and the commuter flow method (adjusted R-squared value is 0.19) shows that the morphological method has stronger explanatory power than the functional method, the agglomeration economy dominates the urban polycentric development in Hangzhou, and the employment sub-center has dispersed some functions of the CBD, but it still presents a strong agglomeration polycentric development structure.
The Wuhan GL_SC threshold method and the commuter flow method show that the CBD and the employment sub-center have similar (T-value = −20.12, −17.88 and −20.77, −17.50, respectively) effects on urban spatial structure, while the non-parametric method and the ESDA method show that the CBD is much stronger than that of the employment sub-center (T-value = −14.55, −15.62 and −4.59, 0.35, respectively). The GL_SC threshold method has the strongest explanatory power (adjusted R-squared value is 0.40), followed by the commuter flow method (adjusted R-squared value is 0.39), indicating that the morphological method and the functional method show similar effects. The T values of GL_SC and commuter flow method show that the agglomeration development force and decentralized development force between Wuhan’s CBD and employment sub-centers are comparable, and Wuhan is a balanced polycentric development structure.
The Nanning non-parametric method and ESDA method show that the employment subcenter force is much stronger than that of the CBD (T-value = −13.33, −13.74 and −6.89, −6.35, respectively), because the employment centers identified by them are basically located in the central urban area, and the distance between the CBD and the employment subcenter is relatively close, resulting in a superimposed effect on the employment density [11], with the resulting results not being explanatory. The GL_SC threshold method and commuter flow method show that the CBD has a stronger effect on urban spatial structure than the employment sub-centers (T-value = −10.79, −11.61 and −9.81, −6.68, respectively), which shows that the morphological and functional methods have similar effects. The GL_SC threshold method (adjusted R-squared value is 0.36) has stronger explanatory power than that of the commuter flow method (adjusted R-squared value is 0.33), and the T values of the two methods indicating that the agglomeration economy of Nanning was stronger than the decentralized development force of the employment sub-center, and Nanning was a agglomeration polycentric development structure.
The above results show that the recognition results of different methods differ greatly in the interpretation of polycentric structures; the three morphological methods differ greatly in the interpretation of different urban spatial structures, and the interpretation effects of the functional methods and morphological methods are also inconsistent. Therefore, when examining the development characteristics of urban spatial structure, it is best to use multiple methods to make accurate judgments.
4.4. GWR Analysis of Polycentric Spatial Structure Characteristics
The polycentric OLS regression model shows that the employment centers identified by the GL_SC threshold method are more in line with the reality of the development of the three cities. Therefore, GWR regression estimation is carried out to verify the influence range of employment centers identified by GL_SC. Table 6 shows that the global spatial autocorrelation (Moran’s I) value of regression standard residuals is close to zero (based on inverse distance weights), and all window size standard residuals are randomly distributed, indicating that the research hypothesis is valid, and GWR has a good correction to OLS regression, that is, the influence of the CBD is not global, and the influence of employment subcenters is highly local. As the window range increases, the adjusted R-squared value decreases. The model has the best fit when the window is 1%, but the AICc value, Effective Number, and multicollinearity diagnosis show that the model has the best robustness when the window is 10%.
The GWR results (Figure 5) show that the strongest influence area of Hangzhou’s CBD is concentrated within 10 km of its surrounding area. There are several strong sub-employment centers in the north of the Qiantang River, while only a few sub-employment centers in the south of the Qiantang River show strong influence, indicating that the decentralization development process of Hangzhou’s CBD is mainly concentrated in the riverside area north of the Qiantang River, and its cross-river development is still in the initial stage. Hangzhou should strengthen the construction of the urban center south of the Qiantang River in the future. The high-value influence area of Wuhan’s CBD is eroded by the adjacent employment subcenters, and the influence of the adjacent employment subcenters is stronger than that of the CBD. Across the Yangtze River, the employment subcenters form two regions with strong influence in the east and west, while the distant suburban urban centers do not form strong influence areas, indicating that the influence of Wuhan’s CBD is weak and the development trend of being polycentric is strong. In the future, Wuhan should strengthen the construction of the outer ring centers. High value, low value, and high value alternately appear in 3 km, 6 km, and 10 km around Nanning’s CBD, which shows that Nanning’s CBD has a significant circle phenomenon on the urban spatial structure, and the employment sub-center and the CBD have formed a significant dual center structure in the east and west, but they are still concentrated in the central city, and the construction of the center outside the central city should be strengthened in the future.
5. Discussion
5.1. Comparison of Recognition Methods of Morphological and Functional Dimensions
In China, both government and market forces have a strong impact on urban spatial structure. Government forces are reflected in the policies of polycentric urban planning and administrative consolidation, while market forces are reflected in the densification of CBD core functions and the rise of new urban centers as a result of housing and land market reforms. The employment center identification method based on morphological and functional dimensions reflects the internal and external development forces of the employment center, respectively. The internal force is reflected in the siphon effect of the employment center agglomeration economy on the surrounding areas in terms of population and economic agglomeration, while the external force is reflected in the interaction of the two forces of the housing market and the employment market, both of which are guided by administrative forces in China. The area of the employment center identified by the non-parametric method is the smallest, and the internal agglomeration characteristics of the employment center are not significant, which cannot represent the morphological method well. The ESDA method identified several continuous employment centers with large areas in the central urban area of Hangzhou, while in Wuhan several employment centers with smaller areas than Hangzhou were identified, and in Nanning only one employment center with a larger area was identified. Thus, Hangzhou’s CBD and sub-employment centers have stronger economic development capacity in the ESDA method, followed by Wuhan and Nanning. The GL_SC threshold method and the commuter flow method have the smallest difference in recognition results, which can best represent the two dimensions of morphological and functional features. There is little difference in recognition results between the two dimensions in the central urban area, indicating that the market and administrative forces in the central urban area are consistent. There is no significant difference between the employment centers identified by the commuter flow method and the threshold method outside the central urban area of Hangzhou, indicating that the market and administrative forces in the central city are consistent. In Wuhan and Nanning, more town centers outside the central urban area were identified by the GL_SC threshold method, while more industrial centers were identified by the commuter flow method, indicating that town centers are dominated by market forces, while industrial centers are dominated by administrative forces. Therefore, the analysis of a single dimension can only reflect the characteristics of a certain aspect, and the comparison of the two dimensions of morphology and function can more fully reflect the development characteristics of urban spatial structure.
5.2. Comparison of Urban Spatial Structure Identification from Morphological and Functional Dimensions
The employment centers identified by the GL_SC threshold method show a relatively good fitting effect in the three urban polycentric models, indicating that the employment centers identified by the morphological method are more in line with the reality of urban development in China. Fundamentally speaking, the force of urban development in China is still dominated by market forces, which is consistent with previous research results, and traditional urban centers in China still maintain strong functions [15,51]. The explanatory power of the results identified by the functional method is slightly poor, indicating that although the polycentric development led by the government administrative power has built many suburban employment centers, the suburban employment centers have failed to fundamentally affect the dominance of the CBD on the urban spatial structure. From the comparison of the explanatory power of the morphological and functional methods, the Hangzhou GL_SC threshold method is the strongest, and the commuting flow method is the weakest, indicating that Hangzhou, with the strongest level of economic development, has the strongest economic agglomeration force. There is little difference in explanatory power between the Wuhan GL_SC threshold method and the commuter flow method, indicating that Wuhan, with medium economic development level, has a similar power of agglomeration and decentralization. The results of Nanning show that the model with the best fit may not be consistent with actual urban development, and the CBD and sub-employment center, which has a general economic development level, are in the stage of agglomeration development, and the decentralized development force is the weakest.
5.3. Unify the Morphological and Functional Dimensions into a Consistent Recognition Process
Previous assessments of urban spatial structure were mostly based on the inner characteristics of the center such as population, density, land, GDP, and other morphological characteristics, while few studies were conducted on the outer functional characteristics of the center in attracting employment, leisure, commerce, entertainment, and other complex functional attractions. These two characteristics reflect the two forces of urban development, agglomeration, and dispersion. In this paper, a polycentric recognition method based on spatial distribution and interaction is proposed for morphological and functional dimensions, which can make up for the defects of single-dimension recognition results, and it compares cities from a two-dimensional perspective, reflecting the characteristics of two-dimensional polycentric urban development. Linking the results of the morphological and functional methods is helpful to determine the position and role of the employment center in different dimensions and has guiding significance for formulating employment center development policy. The contribution of this study is that the morphological dimension reflects the function, and the functional dimension affects the form. Taking the two as a unified evaluation process is conducive to the consistent evaluation of the polycentric spatial structure of large cities and thus provides a better research basis for the analysis of polycentric spatial performance.
6. Conclusions
This paper constructs a framework for the identification and evaluation of urban polycentric spatial structure from the morphological and functional dimensions. The comparison of the recognition results of the morphological and functional dimensions shows that the GL_SC threshold method has better explanatory power in the three cities, which is more in line with the characteristics of polycentric urban development in China. The comparative study of the three cities found that the stronger the level of economic development, the better the level of polycentric development of the city, and it can more comprehensively reflect the characteristics of urban spatial structure.
Consistent with previous studies, there are great differences in the spatial distribution characteristics of employment centers identified by morphological and functional dimensions [14]. In terms of morphological dimension, polycentricity generally presents the characteristics of centralized dispersion, the concentration of which is reflected in how the employment centers identified by the morphological methods are mostly located in central urban areas, especially the spatial statistics and non-parametric methods; moreover, dispersion is reflected in how, with the improvement of the urban economic development level, more suburban employment centers are identified by the same method, especially the GL_SC threshold method. In terms of functional dimension, the polycentric structure generally presents the characteristics of decentralized concentration, the concentration of which is reflected in how the identification of employment centers in the central urban area is similar to the morphological method, and dispersion is reflected in the identification of more and larger employment centers outside the central urban area.
There are differences in the characteristics of the polycentric spatial structure in morphological and functional dimensions in cities with different development stages. The explanatory power of the polycentric model of the Hangzhou GL_SC threshold method is stronger than that of the commuter flow method (the adjusted R-squared values are 0.28 and 0.19, respectively), indicating that the polycentric development of Hangzhou is dominated by the agglomeration economy, and the employment sub-centers share some functions of the CBD, but the CBD still plays a leading role in the development of the urban spatial structure. The explanatory power of the polycentric model of the Wuhan GL_SC threshold method and the commuter flow method is similar (the adjusted R-squared values are 0.40 and 0.37, respectively), which shows that the agglomeration and decentralized development forces of Wuhan’s CBD and employment sub-centers are similar, indicating a balanced polycentric development structure. The explanatory power of the polycentric model of the Nanning morphological method is stronger than that of the commuter flow method, indicating that the agglomeration force of the CBD is stronger than the decentralized development force of employment sub-centers, and Nanning has the weakest polycentric development level.
Therefore, the comparison of morphological and functional dimensions can fully reflect the spatial structure characteristics of polycentric cities, and the identification results of a single dimension may lead to the deviation of the analysis results. Regarding whether polycentric spatial structure is a sustainable urban development model, in analyzing its impact on urban economic development, work-residential commuting, traffic congestion, environmental pollution, and other issues, the development characteristics of polycentric spatial structure should be judged from multiple dimensions to avoid the impact of single dimension identification results on the research conclusion.
Author Contributions
J.Z., the leading author, initially conceived and designed the research. She performed data analysis and original draft preparation under the supervision of the corresponding author. X.N., a corresponding author, developed the original idea of this study and provided suggestions for the overall analysis. Y.W. provided some constructive suggestions on the content of the article. All authors contributed to manuscript preparation and discussed the results. All authors have read and agreed to the published version of the manuscript.
Funding
This research study was supported by general project of philosophy and social science research in universities of Jiangsu Province (2023SJYB1622).
Data Availability Statement
The data presented in this study are available on request from the corresponding authors.
Acknowledgments
The authors would like to acknowledge all colleagues and friends who have voluntarily reviewed the translation of the survey and the manuscript of this study.
Conflicts of Interest
The authors declare no conflicts of interest.
Appendix A

Table A1.
Regression model of employment density and CBD distance of TAZ unit in Hangzhou.
| Linear Model (Line) | Negative Exponential Model (EXP) | Logarithmic Model (Ln) | Logarithmic Version of the Negative Exponential Model (Ln_EXP) | Power Model (GAV) | Logarithmic Version of the Power Model (Ln_GAV) | |
|---|---|---|---|---|---|---|
| constant | 2327.2 | 1566.715 | 10,957.515 | 7.357 | - | 15.115 |
| −0.054 | −5.911 × 10⁻⁵ | −1003.024 | −5.911 × 10⁻⁵ | - | −0.923 | |
| Adjusted R-squared | 0.118 | 0.174 | 0.169 | 0.1738 | - | 0.165 |
| Sig. | 0.000 | 0.000 | 0.000 | 0.000 | - | 0.000 |
| F | 217.906 | 344.451 | 331.515 | 344.451 | - | 321.853 |
Table A2.
Regression model of employment density and CBD distance of TAZ unit in Wuhan.
| Linear Model (Line) | Negative Exponential Model (EXP) | Logarithmic Model (Ln) | Logarithmic Version of the Negative Exponential Model (Ln_EXP) | Power Model (GAV) | Logarithmic Version of the Power Model (Ln_GAV) | |
|---|---|---|---|---|---|---|
| constant | 3035.094 | 15,014.546 | 7.586 | - | 17.194 | |
| −0.088 | −9.273 × 10⁻⁵ | −1431.552 | −9.273 × 10⁻⁵ | - | −1.183 | |
| Adjusted R-squared | 0.124 | 0.291 | 0.197 | 0.291 | - | 0.290 |
| Sig. | 0.000 | 0.000 | 0.000 | 0.000 | - | 0.000 |
| F | 337.558 | 981.816 | 586.335 | 981.816 | - | 997.06 |
Table A3.
Regression model of employment density and CBD distance of TAZ unit in Nanning.
| Linear Model (Line) | Negative Exponential Model (EXP) | Logarithmic Model (Ln) | Logarithmic Version of the Negative Exponential Model (Ln_EXP) | Power Model (GAV) | Logarithmic Version of the Power Model (Ln_GAV) | |
|---|---|---|---|---|---|---|
| constant | 2386.32 | 1441.483 | 11,851.765 | 7.273 | - | 17.452 |
| −0.059 | −9.358 × 10⁻⁵ | −1131.529 | −9.358 × 10⁻⁵ | - | −1.257 | |
| Adjusted R-squared | 0.076 | 0.295 | 0.208 | 0.295 | - | 0.344 |
| Sig. | 0.000 | 0.000 | 0.000 | 0.000 | - | 0.000 |
| F | 80.855 | 407.940 | 255.872 | 407.940 | - | 510.630 |
References
- Alonso, W. Location and Land Use: Toward a General Theory of Land Rent; Harvard University Press: Cambridge, UK, 1964. [Google Scholar]
- Anas, A.; Arnott, R.; Small, K.A. Urban spatial structure. J. Econ. Lit. 1998, 36, 1426–1464. [Google Scholar]
- Fujita, M.; Ogawa, H. Multiple equilibria and structural transition of non-monocentric urban configurations. Reg. Sci. Urban Econ. 1982, 12, 161–196. [Google Scholar] [CrossRef]
- Anas, A.; Kim, I. General equilibrium models of polycentric urban land use with endogenous congestion and job agglomeration. J. Urban Econ. 1996, 40, 232–256. [Google Scholar] [CrossRef]
- McMillen, D.P.; Smith, S.C. The number of subcenters in large urban areas. J. Urban Econ. 2003, 53, 321–338. [Google Scholar] [CrossRef]
- Veneri, P. The identification of sub-centres in two Italian metropolitan areas: A functional approach. Cities 2013, 31, 177–185. [Google Scholar] [CrossRef]
- Giuliano, G.; Small, K.A. Subcenters in the Los Angeles region. Reg. Sci. Urban Econ. 1991, 21, 163–182. [Google Scholar] [CrossRef]
- Small, K.A.; Song, S. Population and employment densities: Structure and change. J. Urban Econ. 1994, 36, 292–313. [Google Scholar] [CrossRef]
- Cervero, R.; Wu, K.-L. Polycentrism, commuting, and residential location in the San Francisco Bay Area. Environ. Plan. A Econ. Space 1997, 29, 865–886. [Google Scholar] [CrossRef]
- Coffey, W.J.; Shearmur, R.G. Agglomeration and Dispersion of high-order service employment in the montreal metropolitan region, 1981–1996. Urban Stud. 2002, 39, 359–378. [Google Scholar] [CrossRef]
- Muñiz, I.; Garcia-López, M.; Galindo, A. The effect of employment sub-centres on population density in Barcelona. Urban Stud. 2008, 45, 627–649. [Google Scholar] [CrossRef]
- Burger, M.; Meijers, E. Form follows function? Linking morphological and functional polycentricity. Urban Stud. 2012, 49, 1127–1149. [Google Scholar] [CrossRef]
- Aguilera, A. Growth in commuting distances in french polycentric metropolitan areas: Paris, Lyon and Marseille. Urban Stud. 2005, 42, 1537–1547. [Google Scholar] [CrossRef]
- Roca, C.J.; Marmolejo, D.C.; Moix, M. Urban Structure and Polycentrism: Towards a Redefinition of the Sub-centre Concept. Urban Stud. 2009, 46, 2841–2868. [Google Scholar] [CrossRef]
- Lv, Y.; Zheng, X.; Zhou, L.; Zhang, L. Decentralization and polycentricity: Spatial changes of employment in Beijing metropolitan area, China. Sustainability 2017, 9, 1880. [Google Scholar] [CrossRef]
- Liu, Z.; Liu, S. Polycentric development and the role of urban polycentric planning in China’s mega cities: An examination of Beijing’s metropolitan area. Sustainability 2018, 10, 1588. [Google Scholar] [CrossRef]
- Cervero, R.; Wu, K.-L. Sub-centring and commuting: Evidence from the San Francisco Bay area, 1980–1990. Urban Stud. 1998, 35, 1059–1076. [Google Scholar] [CrossRef]
- Giuliano, G.; Redfearn, C.; Agarwal, A.; Li, C.; Zhuang, D. Employment concentrations in Los Angeles, 1980–2000. Environ. Plan. A Econ. Space 2007, 39, 2935–2957. [Google Scholar] [CrossRef]
- McDonald, J.F. The identification of urban employment subcenters. J. Urban Econ. 1987, 21, 242–258. [Google Scholar] [CrossRef]
- Forstall, R.L.; Greene, R.P. Defining job concentrations: The los angeles case. Urban Geogr. 1997, 18, 705–739. [Google Scholar] [CrossRef]
- Shearmur, R.G.; Coffey, W.J. Urban employment subcenters and sectoral clustering in montreal: Complementary approaches to the study of Urban form. Urban Geogr. 2002, 23, 103–130. [Google Scholar] [CrossRef]
- Zhang, T.; Sun, B.; Li, W.; Dan, B.; Wang, C. Polycentricity or dispersal? The spatial transformation of metropolitan Shanghai. Cities 2019, 95, 102352. [Google Scholar] [CrossRef]
- Zhu, J.; Niu, X.; Shi, C. The Influencing Factors of a Polycentric Employment System on Jobs-Housing Matching—A Case Study of Hangzhou, China. Sustainability 2019, 11, 5752. [Google Scholar] [CrossRef]
- McDonald, J.F.; Prather, P.J. Suburban employment centers: The case of Chicago. Urban Stud. 1994, 31, 201–218. [Google Scholar] [CrossRef]
- McMillen, D.P.; McDonald, J.F. A Nonparametric analysis of employment density in a polycentric city. J. Reg. Sci. 1997, 37, 591–612. [Google Scholar] [CrossRef]
- McMillen, D.P. Nonparametric employment subcenter identification. J. Urban Econ. 2001, 50, 448–473. [Google Scholar] [CrossRef]
- Redfearn, C.L. The topography of metropolitan employment: Identifying centers of employment in a polycentric urban area. J. Urban Econ. 2007, 61, 519–541. [Google Scholar] [CrossRef]
- Lee, B. “Edge” or “edgeless” cities? Urban spatial structure in US metropolitan areas, 1980 to 2000. J. Reg. Sci. 2007, 47, 479–515. [Google Scholar] [CrossRef]
- Craig, S.G.; Ng, P.T. Using quantile smoothing splines to identify employment subcenters in a multicentric urban area. J. Urban Econ. 2001, 49, 100–120. [Google Scholar] [CrossRef]
- Leslie, T.F. Identification and differentiation of urban centers in phoenix through a multi-criteria kernel-density approach. Int. Reg. Sci. Rev. 2010, 33, 205–235. [Google Scholar] [CrossRef]
- Baumont, C.; Ertur, C.; Le Gallo, J. Spatial analysis of employment and population density: The case of the agglomeration of Dijon 1999. Geogr. Anal. 2004, 36, 146–176. [Google Scholar] [CrossRef]
- Riguelle, F.; Thomas, I.; Verhetsel, A. Measuring urban polycentrism: A European case study and its implications. J. Econ. Geogr. 2007, 7, 193–215. [Google Scholar] [CrossRef]
- Asikhia, M.O.; Nkeki, N.F. Polycentric Employment Growth and the Commuting Behaviour in Benin Metropolitan Region, Nigeria. J. Geogr. Geol. 2013, 5, p1. [Google Scholar] [CrossRef]
- Hajrasouliha, A.H.; Hamidi, S. The typology of the American metropolis: Monocentricity, polycentricity, or generalized dispersion? Urban Geogr. 2017, 38, 420–444. [Google Scholar] [CrossRef]
- Burns, M.C.; Cladera, J.R. Contrasting indications of polycentrism within Spain’s metropolitan urban regions. In Proceedings of the Eight European Estate Society Conference (No. eres2001_127), Alicante, Spain, 26–29 June 2001. [Google Scholar]
- Roth, C.; Kang, S.M.; Batty, M.; Barthélemy, M. Structure of urban movements: Polycentric activity and entangled hierarchical flows. PLoS ONE 2011, 6, e15923. [Google Scholar] [CrossRef] [PubMed]
- Cats, O.; Wang, Q.; Zhao, Y. Identification and classification of public transport activity centres in Stockholm using passenger flows data. J. Transp. Geogr. 2015, 48, 10–22. [Google Scholar] [CrossRef]
- Krehl, A. Urban subcentres in German city regions: Identification, understanding, comparison. Pap. Reg. Sci. 2018, 97, S79–S105. [Google Scholar] [CrossRef]
- Yu, L.; Zheng, W.; Yu, T.; Wu, Y. How to identify urban centers/subcenters in metropolises? An analytical review. Habitat Int. 2021, 115, 102397. [Google Scholar] [CrossRef]
- Long, Y.; Song, Y.; Chen, L. Identifying subcenters with a nonparametric method and ubiquitous point-of-interest data: A case study of 284 Chinese cities. Environ. Plan. B Urban Anal. City Sci. 2022, 49, 58–75. [Google Scholar] [CrossRef]
- Clark, C. Urban Population Densities. J. R. Stat. Soc. Ser. A 1951, 114, 490. [Google Scholar] [CrossRef]
- Tanner, J.C. Factors Affecting the Amount of Travel; Road Research Technical Paper No. 51; Department of Scientific and Industrial Research: London, UK, 1961. [Google Scholar]
- Sherratt, G.G. A model for general urban growth. Manag. Sci. Models Tech. 1960, 2, 147–159. [Google Scholar]
- Smeed, R.J. The traffic problem in towns. Manch. Stat. Soc. 1961, 8, 1–59. [Google Scholar] [CrossRef]
- Newling, B.E. The Spatial variation of urban population densities. Geogr. Rev. 1969, 59, 242. [Google Scholar] [CrossRef]
- Anderson, J.E. Cubic-spline urban-density functions. J. Urban Econ. 1982, 12, 155–167. [Google Scholar] [CrossRef]
- Heikkila, E.; Gordon, P.; I Kim, J.; Peiser, R.B.; Richardson, H.W.; Dale-Johnson, D. What Happened to the CBD-Distance Gradient?: Land Values in a Policentric City. Environ. Plan. A Econ. Space 1989, 21, 221–232. [Google Scholar] [CrossRef]
- McMillen, D.P.; Lester, T.W. Evolving subcenters: Employment and population densities in Chicago, 1970–2020. J. Hous. Econ. 2003, 12, 60–81. [Google Scholar] [CrossRef]
- McMillen, D.P. Employment densities, spatial autocorrelation, and subcenters in large metropolitan areas. J. Reg. Sci. 2004, 44, 225–244. [Google Scholar] [CrossRef]
- Garcia-López, M.; Muñiz, I. Employment decentralisation: Polycentricity or scatteration? The case of Barcelona. Urban Stud. 2010, 47, 3035–3056. [Google Scholar] [CrossRef]
- Huang, D.; Liu, Z.; Zhao, X. Monocentric or Polycentric? The Urban Spatial Structure of Employment in Beijing. Sustainability 2015, 7, 11632–11656. [Google Scholar] [CrossRef]
- Moghadam, A.S.; Soltani, A.; Parolin, B.; Alidadi, M. Analysing the space-time dynamics of urban structure change using employment density and distribution data. Cities 2018, 81, 203–213. [Google Scholar] [CrossRef]
- Alidadi, M.; Dadashpoor, H. Beyond monocentricity: Examining the spatial distribution of employment in Tehran metropolitan region, Iran. Int. J. Urban Sci. 2018, 22, 38–58. [Google Scholar] [CrossRef]
- Craig, S.G.; Kohlhase, J.E.; Perdue, A.W. Empirical polycentricity: The complex relationship between employment centers. J. Reg. Sci. 2015, 56, 25–52. [Google Scholar] [CrossRef]
- Li, Y.; Monzur, T. The spatial structure of employment in the metropolitan region of Tokyo: A scale-view. Urban Geogr. 2017, 39, 236–262. [Google Scholar] [CrossRef]
- Li, Q.; Liu, J.; Wang, S.; Guo, Y.; Han, X.; Li, Q.; Cheng, Y.; Dong, Z.; Li, X.; Zhang, X. Numerical insights into factors affecting collapse behavior of horizontal wellbore in clayey silt hydrate-bearing sediments and the accompanying control strategy. Ocean. Eng. 2024, 297, 117029. [Google Scholar] [CrossRef]
- Li, Q.; Wang, F.; Wang, Y.; Bai, B.; Zhang, J.; Lili, C.; Sun, Q.; Wang, Y.; Forson, K. Adsorption behavior and mechanism analysis of siloxane thickener for CO2 fracturing fluid on shallow shale soil. J. Mol. Liq. 2023, 376, 121394. [Google Scholar] [CrossRef]
Figure 1.
Research area and units.
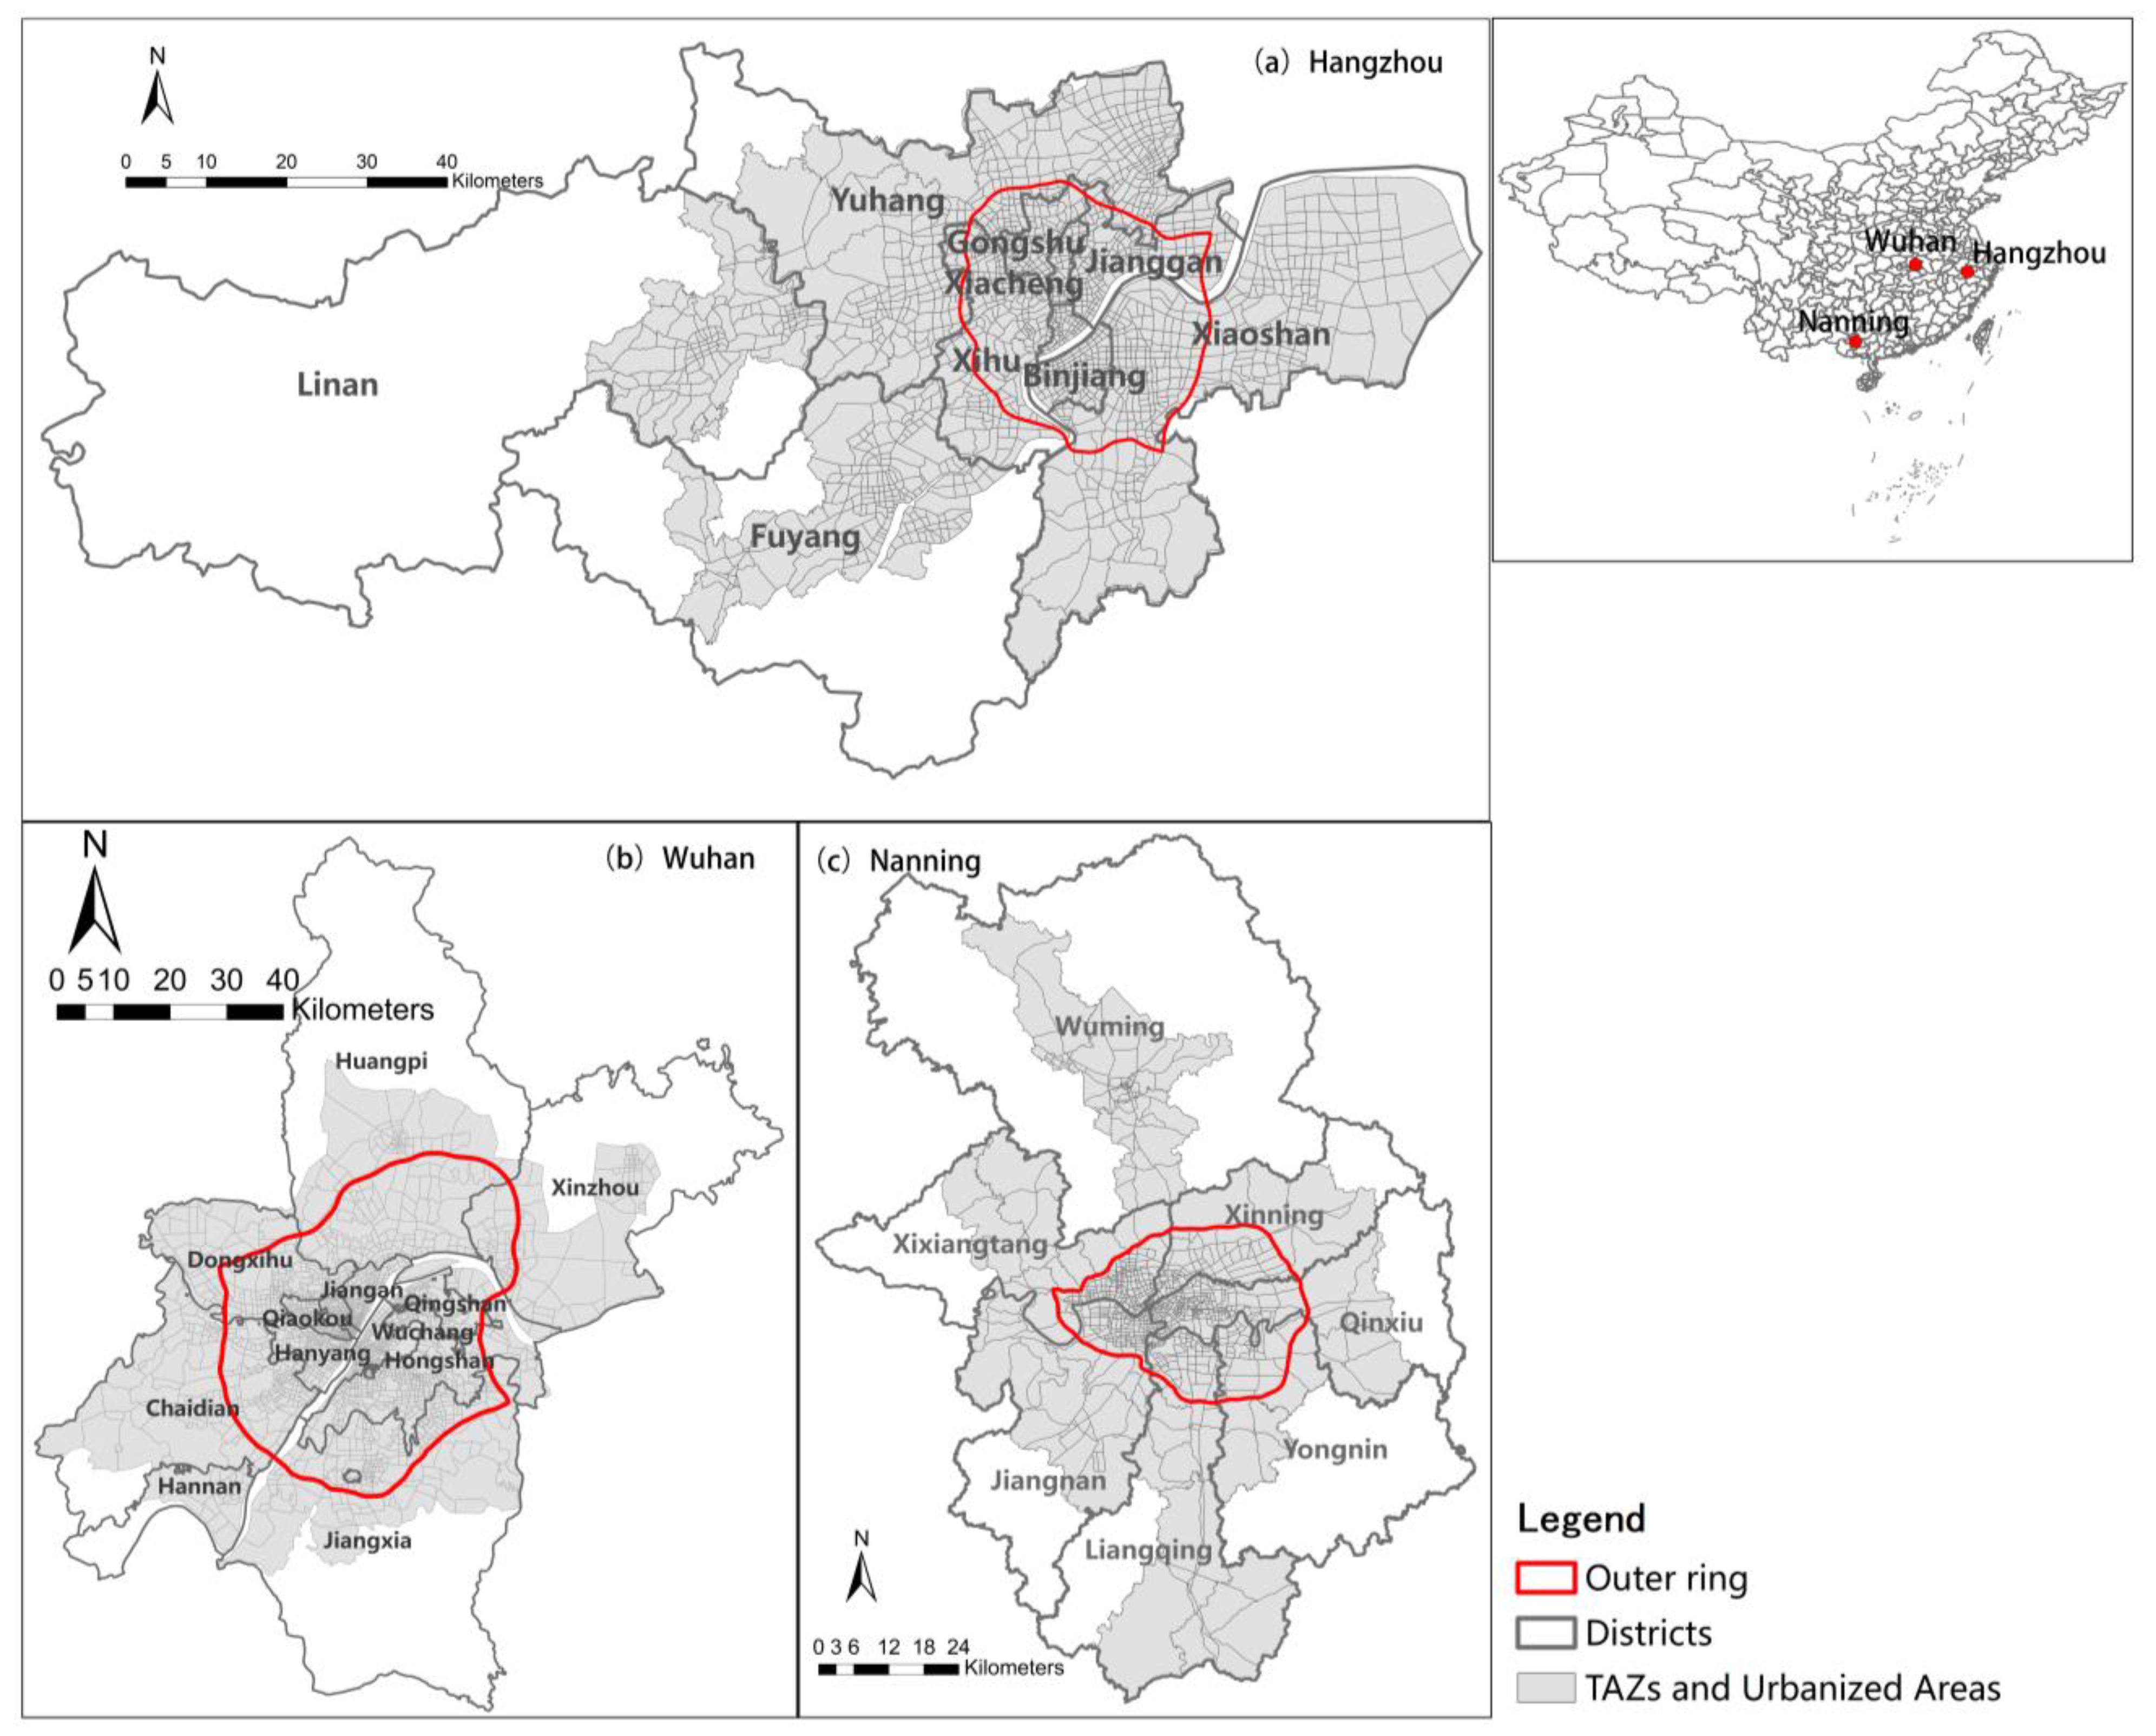
Figure 2.
The distribution of the employment center identification results of Hangzhou: (a) GL_SC threshold method; (b) non-parametric method; (c) ESDA method; (d) commuter flow method.
Figure 2.
The distribution of the employment center identification results of Hangzhou: (a) GL_SC threshold method; (b) non-parametric method; (c) ESDA method; (d) commuter flow method.

Figure 3.
The distribution of employment center identification results of Wuhan: (a) GL_SC threshold method; (b) non-parametric method; (c) ESDA method; (d) commuter flow method).
Figure 3.
The distribution of employment center identification results of Wuhan: (a) GL_SC threshold method; (b) non-parametric method; (c) ESDA method; (d) commuter flow method).
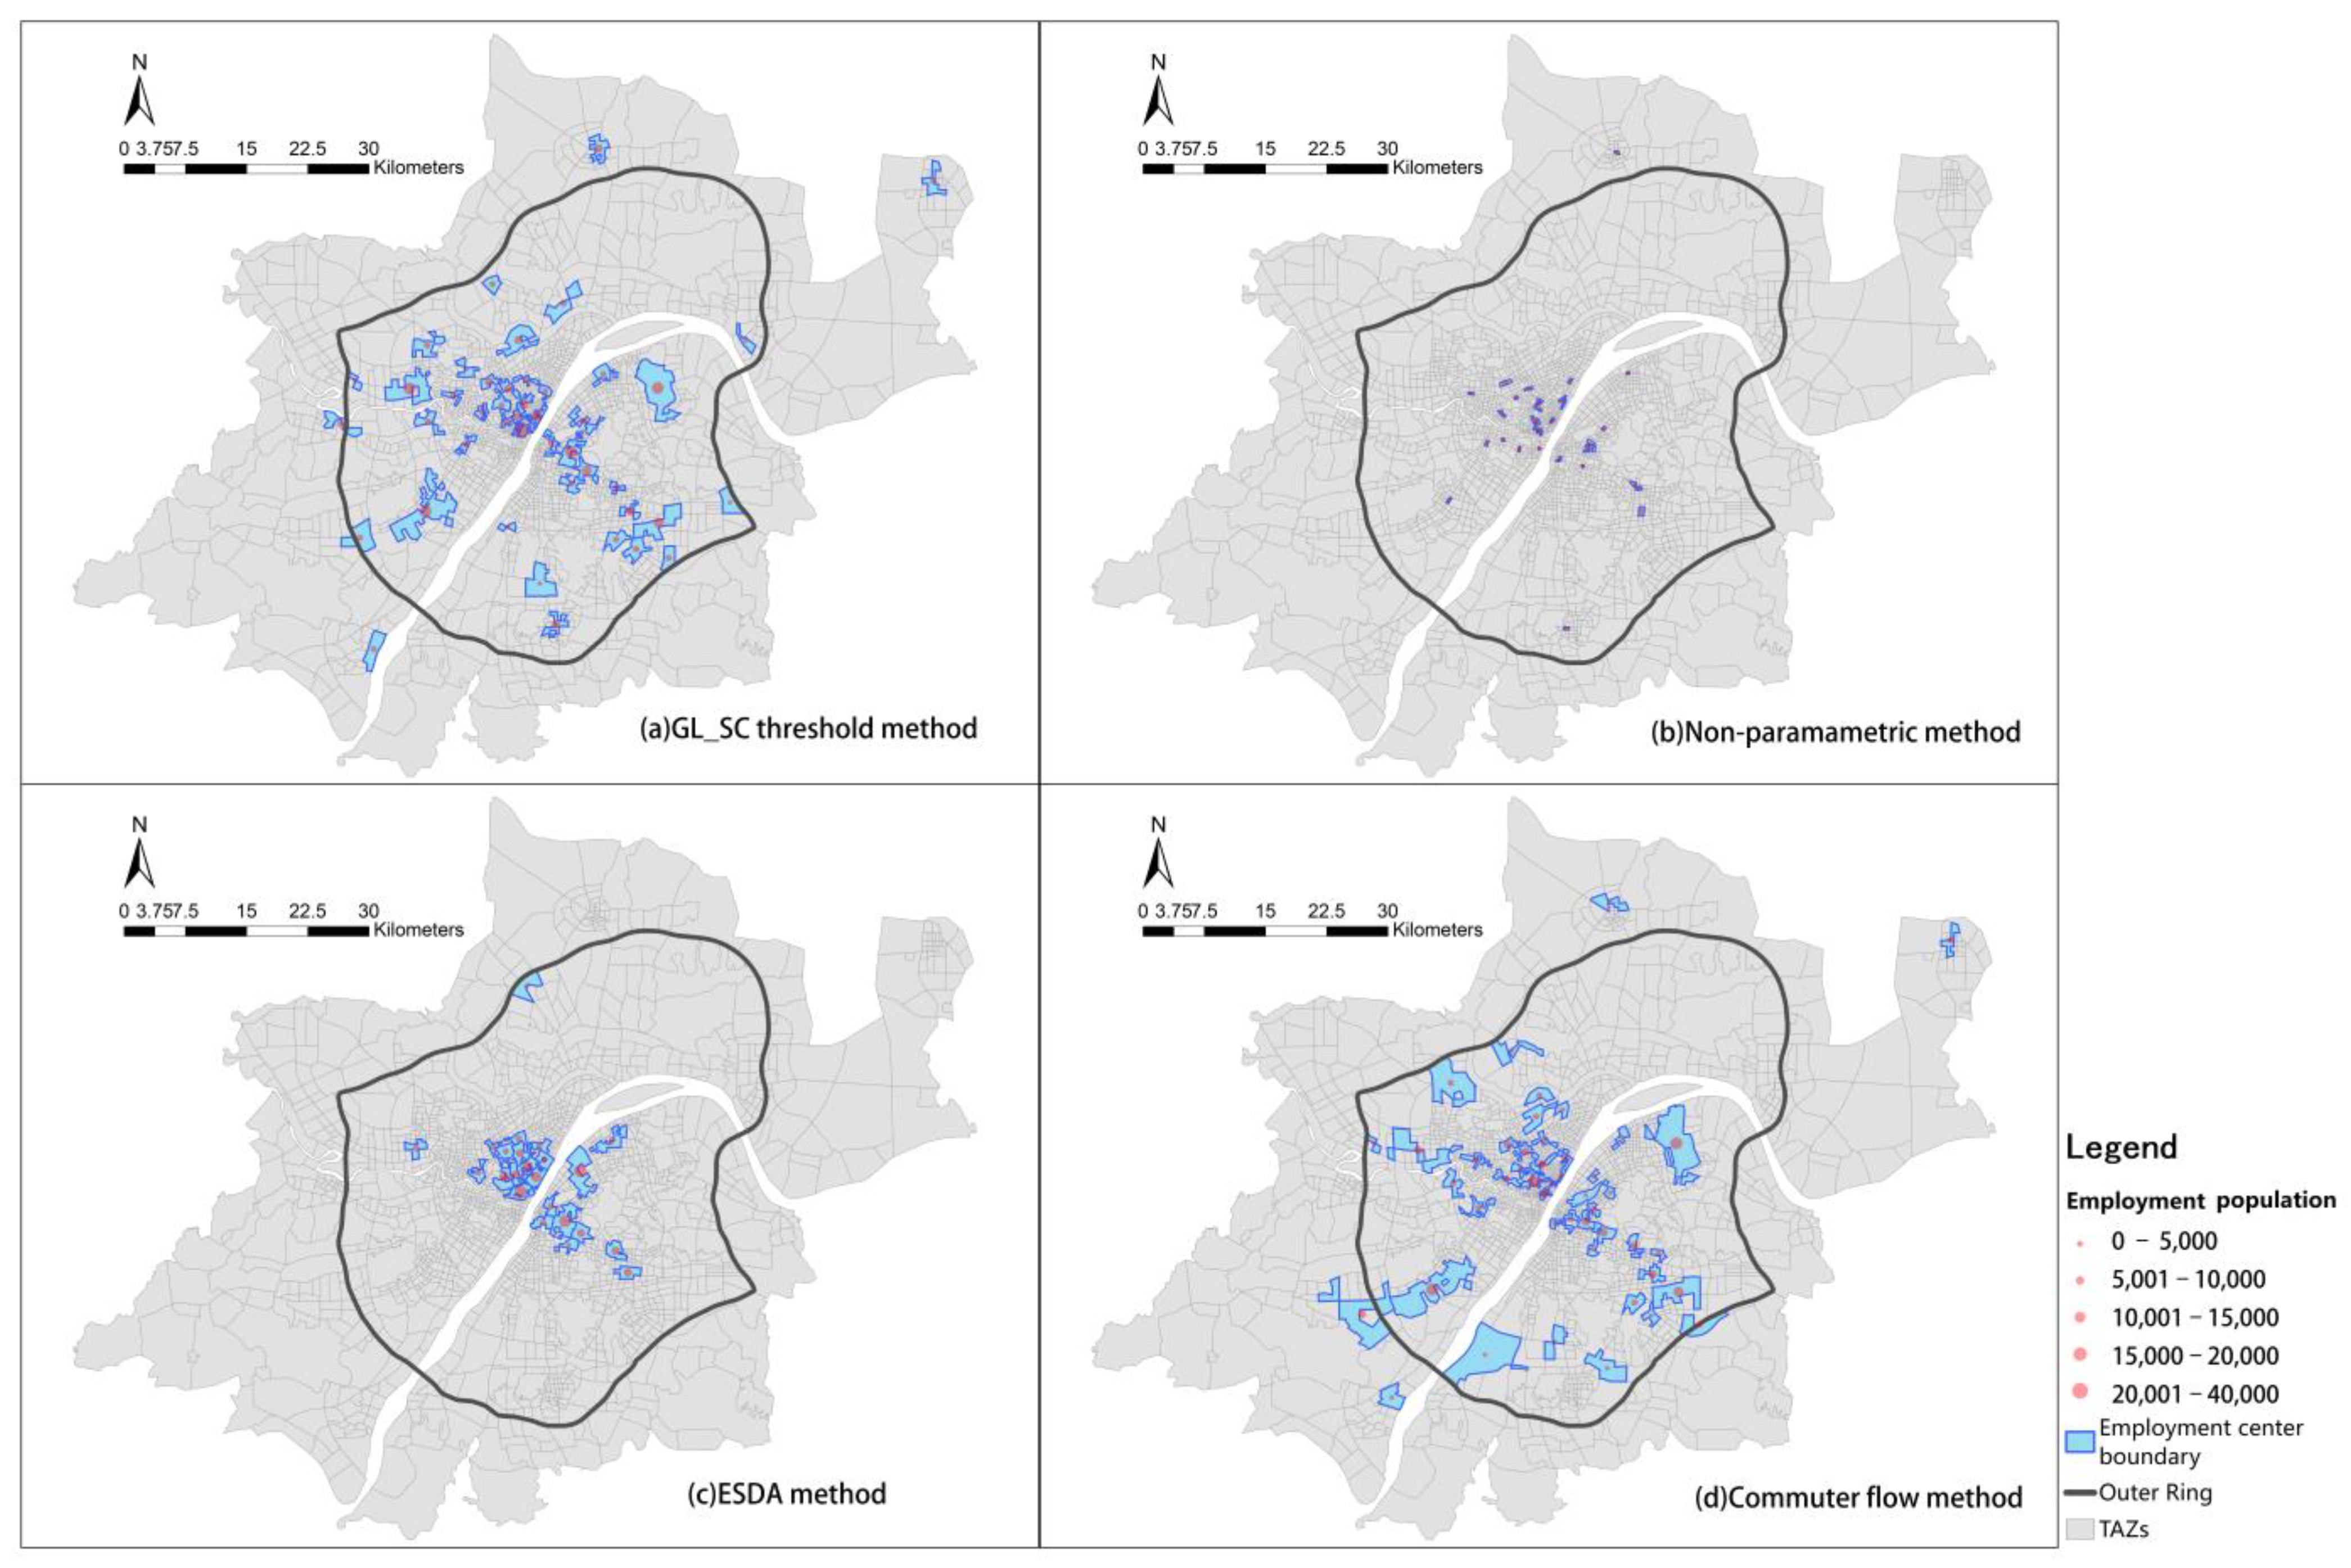
Figure 4.
The distribution of employment center identification results of Nanning: (a) GL_SC threshold method; (b) non-parametric method; (c) ESDA method; (d) commuter flow method).
Figure 4.
The distribution of employment center identification results of Nanning: (a) GL_SC threshold method; (b) non-parametric method; (c) ESDA method; (d) commuter flow method).

Figure 5.
GWR (10% window) influence coefficient distribution of CBD and sub-centers.
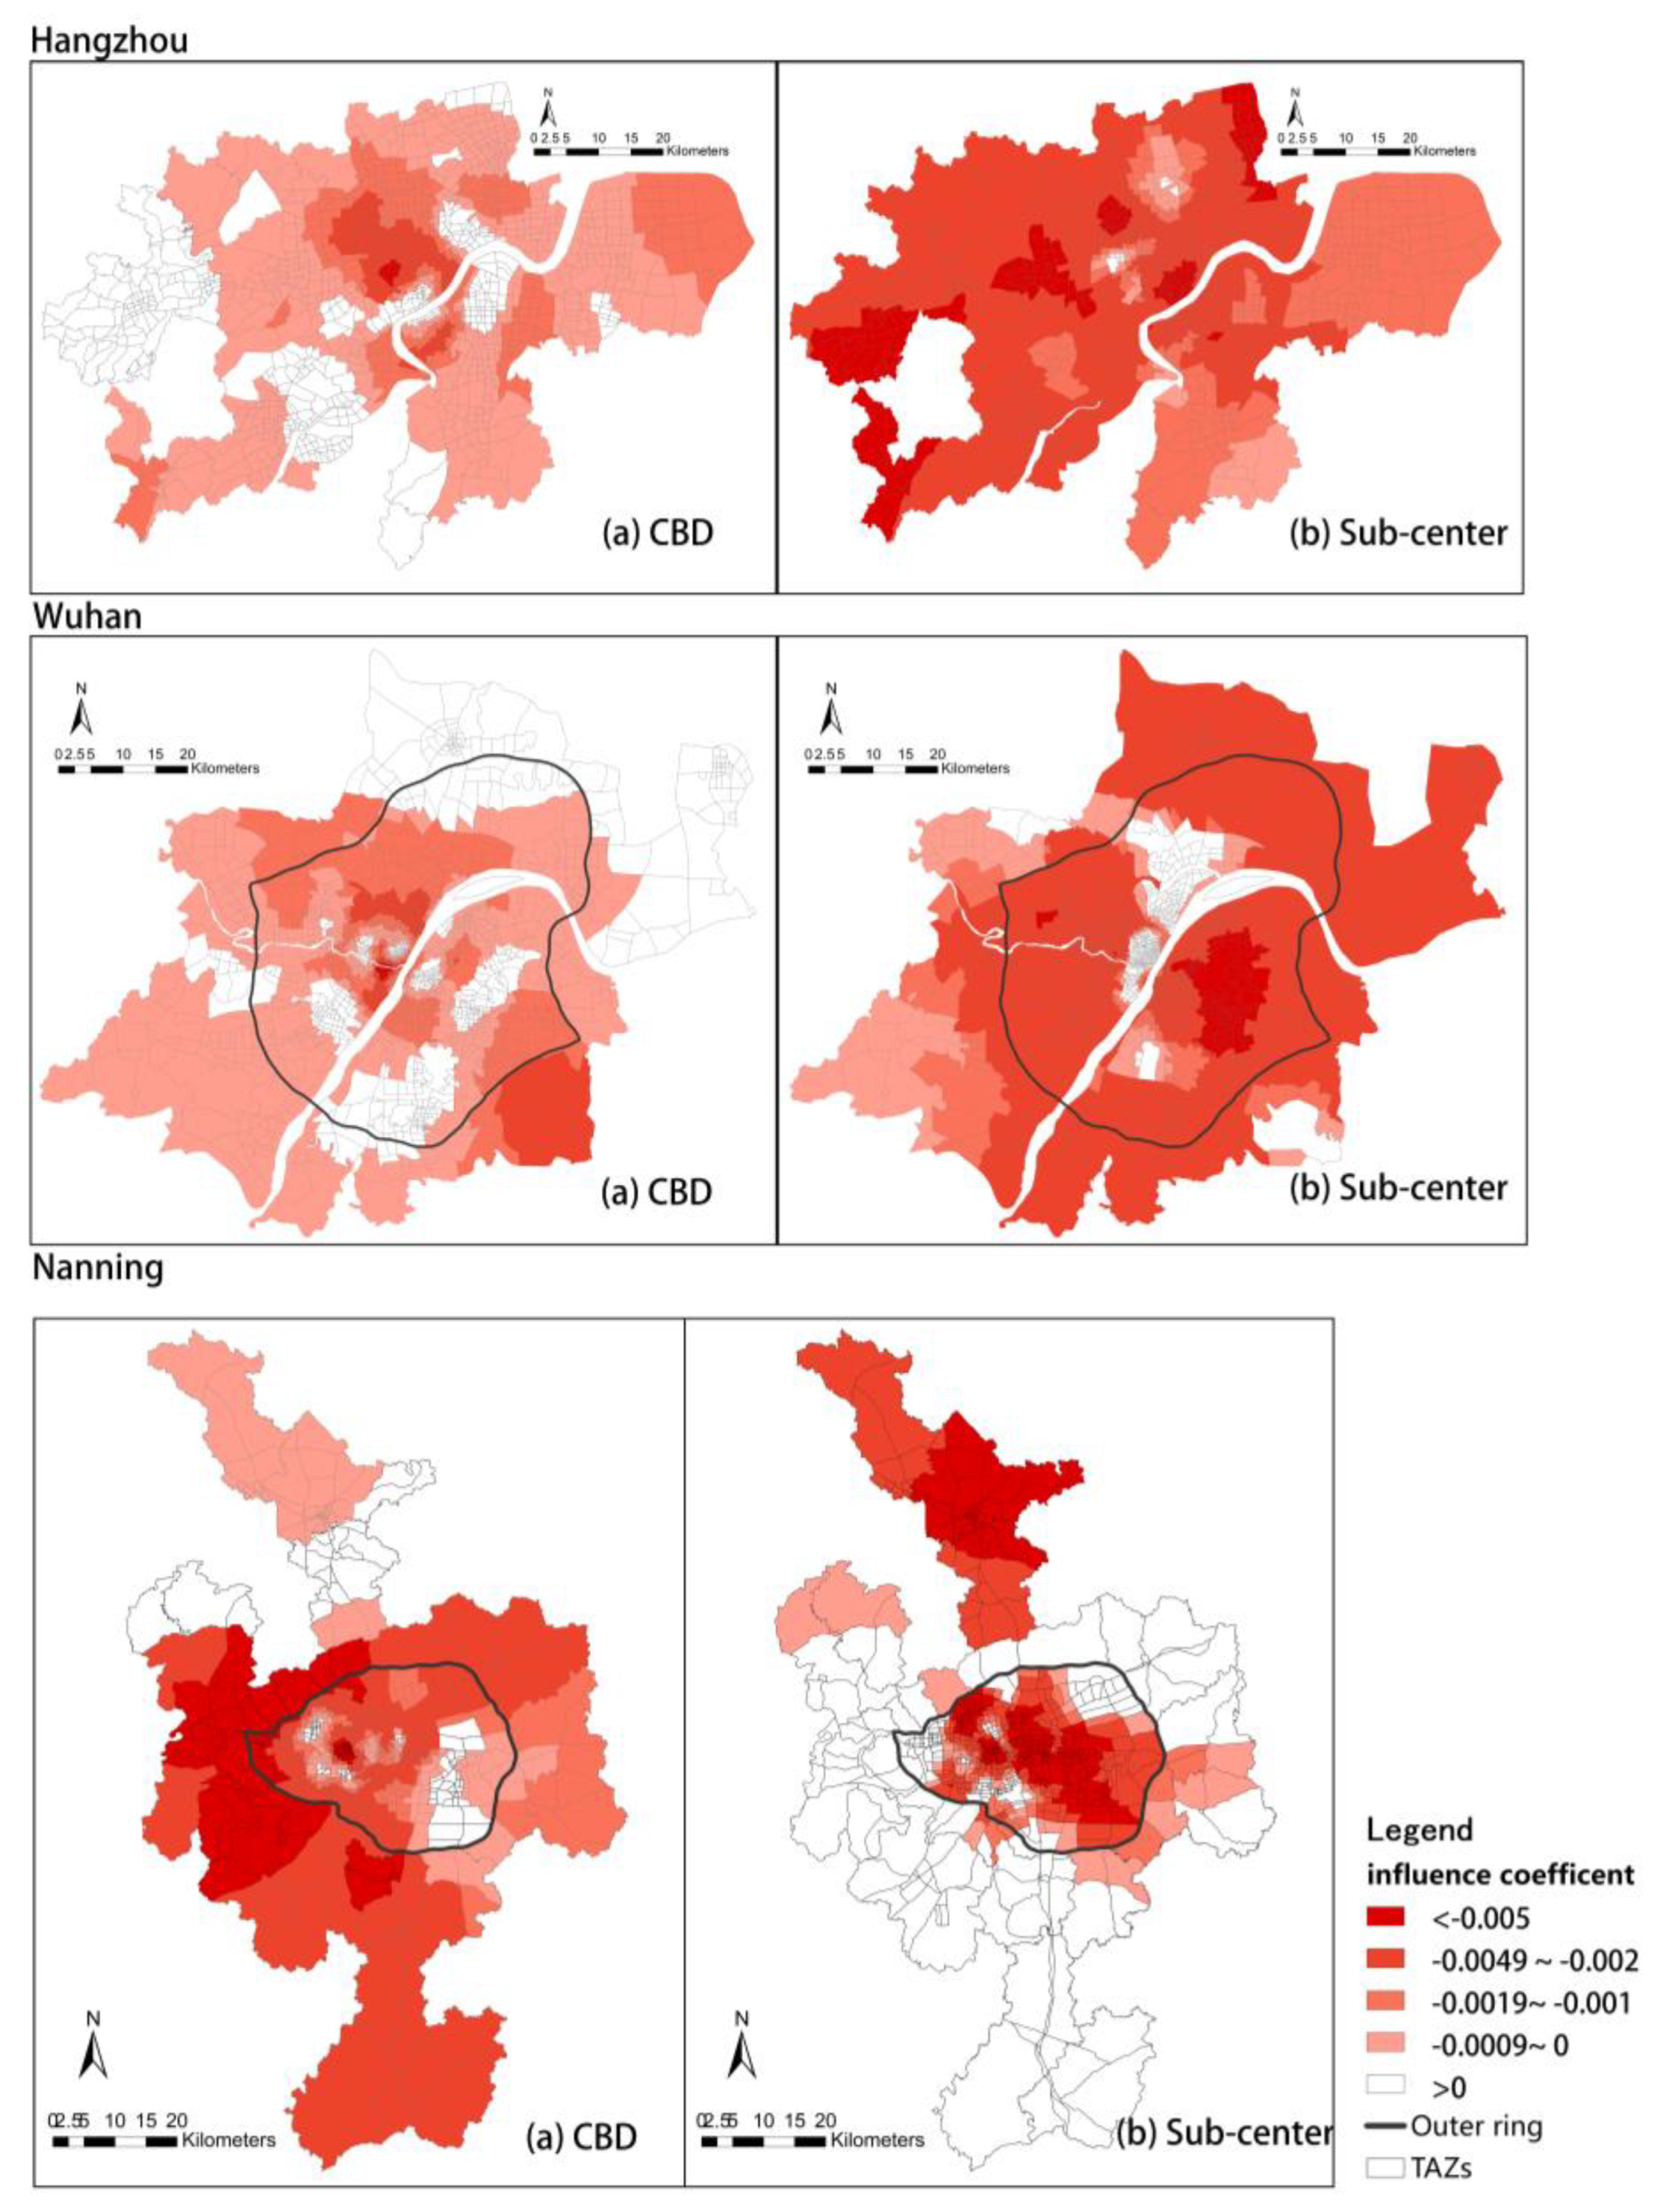
Table 1.
Comparison of employment center identification results with different threshold methods.
| Identification Method | Number of Centers (Pieces) | Employment Center Population | Employment Center Area | Recognition Efficiency (Area per 1% of Employed Population) | |||
|---|---|---|---|---|---|---|---|
| Total (10,000) | Proportion (%) | Area (km2) | Proportion (%) | ||||
| Hangzhou | GS | 21 | 55.18 | 28.02 | 123.99 | 3.03 | 0.12% |
| GL | 34 | 103.85 | 52.74 | 368.61 | 9.01 | 0.17% | |
| SC | 55 | 111.86 | 56.81 | 1446.02 | 35.34 | 0.62% | |
| GL_SC | 44 | 94.74 | 48.11 | 413.31 | 10.10 | 0.21% | |
| Wuhan | GS | 17 | 27.89 | 23.75 | 53.75 | 1.07 | 0.045% |
| GL | 33 | 46.94 | 39.97 | 122.28 | 2.43 | 0.06% | |
| SC | 45 | 57.39 | 48.87 | 1099.19 | 21.87 | 0.45% | |
| GL_SC | 45 | 46.97 | 40.00 | 219.95 | 4.38 | 0.11% | |
| Nanning | GS | 8 | 13.62 | 23.90 | 27.65 | 0.57 | 0.024% |
| GL | 21 | 25.06 | 43.97 | 71.15 | 1.47 | 0.033% | |
| SC | 24 | 27.84 | 48.85 | 606.06 | 12.57 | 0.257% | |
| GL_SC | 30 | 19.91 | 34.94 | 73.86 | 1.53 | 0.044% | |
Table 2.
Comparison of fitting degree between parametric and non-parametric models.
| Adjusted R2 | ||||
|---|---|---|---|---|
| Hangzhou | Wuhan | Nanning | ||
| Parametric model (OLS regression of distance from CBD) | Linear model (Line) | 0.118 | 0.124 | 0.076 |
| Negative exponential model (EXP) | 0.174 | 0.291 | 0.295 | |
| Logarithmic model (Ln) | 0.169 | 0.197 | 0.208 | |
| Logarithmic version of the negative exponential model (Ln_EXP) | 0.174 | 0.291 | 0.295 | |
| Power model (GAV) | n.a. | n.a. | n.a. | |
| Logarithmic version of the power model (Ln_GAV) | 0.165 | 0.290 | 0.344 | |
| Non-parametric model (LWR of north–south and east–west distances from CBD) | 1% window | 0.494 | 0.297 | 0.178 |
| 10% window | 0.280 | 0.316 | 0.326 | |
| 25% window | 0.217 | 0.277 | 0.280 | |
| 50% window | 0.170 | 0.245 | 0.234 | |
Table 3.
Comparison of spatial clustering levels (global Moran’s I values) of different spatial weight matrices.
Table 3.
Comparison of spatial clustering levels (global Moran’s I values) of different spatial weight matrices.
| Variable Spatial Weight Matrix | Employment Density | Logarithm of Employment Density | ||||
|---|---|---|---|---|---|---|
| Hangzhou | Wuhan | Nanning | Hangzhou | Wuhan | Nanning | |
| Queen’s rule | 0.408 | 0.332 | 0.368 | 0.490 | 0.590 | 0.660 |
| K adjacent (4 adjacent) | 0.411 | 0.331 | 0.372 | 0.471 | 0.530 | 0.610 |
| K adjacent (6 adjacent) | 0.417 | 0.330 | 0.410 | 0.445 | 0.524 | 0.605 |
| K adjacent (12 adjacent) | 0.354 | 0.352 | 0.387 | 0.387 | 0.495 | 0.576 |
| Inverse distance weight | 0.178 | 0.213 | 0.091 | 0.256 | 0.425 | 0.376 |
Table 4.
Comparison of employment centers identified by different methods.
| Identification Method | Number of Centers (Pieces) | Number of TAZs in Center (Pieces) | Employment Center Population | Employment Center Area | |||
|---|---|---|---|---|---|---|---|
| Total (10,000) | Proportion (%) | Area (km2) | Proportion (%) | ||||
| Hangzhou | GL_SC | 44 | 403 | 94.74 | 48.11 | 413.31 | 10.10 |
| Non-parametric | 18 | 56 | 21.88 | 11.11 | 31.99 | 0.78 | |
| ESDA | 22 | 352 | 71.64 | 36.38 | 272.31 | 6.66 | |
| Commuter flow | 42 | 271 | 69.96 | 35.53 | 377.19 | 9.22 | |
| Wuhan | GL_SC | 45 | 481 | 46.97 | 40.00 | 219.95 | 4.38 |
| Non-parametric | 25 | 65 | 8.09 | 6.89 | 8.02 | 0.20 | |
| ESDA | 23 | 446 | 28.74 | 24.47 | 91.84 | 1.83 | |
| Commuter flow | 47 | 349 | 39.10 | 33.30 | 293.43 | 5.84 | |
| Nanning | GL_SC | 30 | 210 | 19.91 | 34.94 | 73.86 | 1.53 |
| Non-parametric | 14 | 38 | 4.23 | 7.42 | 4.49 | 0.01 | |
| ESDA | 19 | 217 | 20.02 | 35.13 | 71.45 | 1.48 | |
| Commuter flow | 35 | 191 | 23.07 | 40.49 | 259.81 | 5.38 | |
Table 5.
Polycentric employment population density model verification (OLS regression).
| Variable | Logarithm of Employment Density | ||||
|---|---|---|---|---|---|
| GL_SC Threshold | Non-Parametric | ESDA | Commuter Flow | ||
| Hangzhou | constant | 7.756 *** (107.48) | 7.490 *** (104.17) | 7.551 *** (105.88) | 7.349 *** (105.88) |
| −0.000042 *** (−13.27) | −0.000043 *** (−12.07) | −0.000041 *** (−11.90) | −0.000044 *** (−11.29) | ||
| −0.00029 *** (−15.55) | −0.000085 *** (−9.25) | −0.00011 *** (−11.77) | −0.000087 *** (−6.40) | ||
| Adjusted R-squared | 0.28 | 0.22 | 0.24 | 0.19 | |
| Observed quantity | 1633 | 1633 | 1633 | 1633 | |
| Wuhan | constant | 7.828 *** (148.45) | 7.494 *** (126.48) | 7.595 *** (124.24) | 7.684 *** (144.94) |
| −0.000062 *** (−20.12) | −0.000074 *** (−14.56) | −0.000095 *** (−15.62) | −0.000060 *** (−17.88) | ||
| −0.000288 *** (−20.97) | −0.000037 ** (−4.59) | 0.0000029(0.35) | −0.000198 *** (−17.50) | ||
| Adjusted R-squared | 0.40 | 0.30 | 0.29 | 0.37 | |
| Observed quantity | 2385 | 2385 | 2385 | 2385 | |
| Nanning | constant | 7.200 *** (90.45) | 7.273 *** (95.19) | 7.238 *** (95.17) | 7.217 *** (88.37) |
| −0.000060 *** (−10.79) | −0.000040 *** (−6.89) | −0.000037 *** (−6.35) | −0.000068 *** (−11.61) | ||
| −0.000116 *** (−9.81) | −0.000136 *** (−13.30) | −0.000137 *** (−13.74) | −0.000096 *** (−6.68) | ||
| Adjusted R-squared | 0.36 | 0.40 | 0.41 | 0.33 | |
| Observed quantity | 972 | 972 | 972 | 972 | |
Note: t statistic in parentheses, *** is p < 0.001, ** is p < 0.01.
Table 6.
Model verification of population density of employment center identified by threshold method (GWR).
Table 6.
Model verification of population density of employment center identified by threshold method (GWR).
| Window Size | 1% | 5% | 10% | 25% | 50% | |
|---|---|---|---|---|---|---|
| Hangzhou | Residual Squares | 167.87 | 1810.28 | 2502.07 | 2735.50 | 2874.52 |
| Effective Number | 84.55 | 121.55 | 76.72 | 36.34 | 20.59 | |
| AICc | 750.55 | 4407.02 | 5454.85 | 5535.65 | 5591.62 | |
| Adjusted R2 | 0.616 | 0.435 | 0.414 | 0.376 | 0.350 | |
| Moran’s I (Std. Residual) | −0.005 | −0.015 | −0.008 | 0.010 | 0.031 | |
| Wuhan | Residual Squares | 487.81 | 3798.37 | 4288.14 | 4533.24 | 4679.43 |
| Effective Number | 127.11 | 145.08 | 86.73 | 44.08 | 29.94 | |
| AICc | 1534.06 | 7852.78 | 8305.73 | 8370.25 | 8424.04 | |
| Adjusted R2 | 0.633 | 0.527 | 0.509 | 0.490 | 0.477 | |
| Moran’s I (Std. Residual) | −0.005 | −0.010 | −0.002 | 0.010 | 0.023 | |
| Nanning | Residual Squares | 64.31 | 791.70 | 1375.74 | 1578.31 | 1733.34 |
| Effective Number | 93.61 | 124.66 | 86.38 | 44.09 | 25.26 | |
| AICc | 614.54 | 2409.75 | 3223.79 | 3301.18 | 3362.18 | |
| Adjusted R2 | 0.751 | 0.687 | 0.630 | 0.606 | 0.576 | |
| Moran’s I (Std. Residual) | −0.005 | −0.013 | −0.013 | −0.006 | 0.002 | |
Disclaimer/Publisher’s Note: The statements, opinions and data contained in all publications are solely those of the individual author(s) and contributor(s) and not of MDPI and/or the editor(s). MDPI and/or the editor(s) disclaim responsibility for any injury to people or property resulting from any ideas, methods, instructions or products referred to in the content. |
© 2024 by the authors. Licensee MDPI, Basel, Switzerland. This article is an open access article distributed under the terms and conditions of the Creative Commons Attribution (CC BY) license (https://creativecommons.org/licenses/by/4.0/).
Share and Cite
MDPI and ACS Style
Zhu, J.; Niu, X.; Wang, Y. Polycentric Urban Spatial Structure Identification Based on Morphological and Functional Dimensions: Evidence from Three Chinese Cities. Sustainability 2024, 16, 2584. https://doi.org/10.3390/su16062584
AMA Style
Zhu J, Niu X, Wang Y. Polycentric Urban Spatial Structure Identification Based on Morphological and Functional Dimensions: Evidence from Three Chinese Cities. Sustainability. 2024; 16(6):2584. https://doi.org/10.3390/su16062584
Chicago/Turabian StyleZhu, Juan, Xinyi Niu, and Yao Wang. 2024. "Polycentric Urban Spatial Structure Identification Based on Morphological and Functional Dimensions: Evidence from Three Chinese Cities" Sustainability 16, no. 6: 2584. https://doi.org/10.3390/su16062584
Note that from the first issue of 2016, this journal uses article numbers instead of page numbers. See further details here.