Article

Introducing Industrial Clusters in Multi-Node Energy System Modelling by the Application of the Industry–Infrastructure Quadrant

by
Nienke Dhondt
*,
Francisco Mendez Alva
and
Greet Van Eetvelde
Energy & Cluster Management-EELAB, Department of Electromechanical, Systems and Metal Engineering, Faculty of Engineering and Architecture, Ghent University, Tech Lane Ghent Science Park Campus A, Technologiepark-Zwijnaarde 131, 9052 Ghent, Belgium
*
Author to whom correspondence should be addressed.
Sustainability 2024, 16(6), 2585; https://doi.org/10.3390/su16062585
Submission received: 19 February 2024 / Revised: 13 March 2024 / Accepted: 20 March 2024 / Published: 21 March 2024

Abstract

:
To reach climate neutrality and circularity targets, industry requires infrastructure guaranteeing available, accessible, affordable, and sustainable supply of renewable energy and resources. The layout and operation of the required grids are a key topic in energy system modelling, a research field under constant development to tackle energy transition challenges. Although industry is a core player, its transformation and related policy initiatives are not yet fully reflected, resulting in a research gap. The industrial cluster concept, stimulating local cross-sectoral co-operation, circularity, and optimisation, offers untapped potential to improve the spatial representation of industry in energy system models and paves the way for cluster transition research. This paper introduces the Industry–Infrastructure Quadrant to visualise the relationship between industry and infrastructure presence by means of five distinct area categories. A complementary methodology integrates industrial clusters for multi-node selection in energy system models, solely relying on open-source data and cluster algorithms (DBSCAN). A case study applied to Belgium results in ten nodes to represent the territory, accurately reflecting crucial infrastructure elements and future needs whilst improving industry representation in terms of space and composition. The work serves as a first step towards a deeper understanding of the prominence of industrial clusters in sustainable energy systems.

1. Introduction

At present, the European industry operates within an extensive policy framework to guide it through the energy transition towards climate and resource neutrality and lower its dependence on fossil fuels. Illustrative examples are the targets set in the 2030 and 2050 climate strategies, the Renewable Energy and Energy Efficiency Directives, caps within the EU Emissions Trading System (ETS), and strategic innovation incentives, such as REPowerEU and the Green Deal Industrial Plan [1,2]. An overhaul of industry towards clean technologies is deemed necessary, supported by the Net Zero Industry Act, but requires the prioritisation of efforts and investments [1]. In order to reach the emission and energy efficiency targets, multiple mitigation techniques are developed and rolled out in parallel. The main pathway building blocks are increased material and energy efficiency and circularity, feedstock switch, fuel switch, new processes (e.g., electrification), carbon capture and storage (CCS), and, as a last resort, offsetting emissions [3]. A crucial prerequisite for successfully completing the energy transition cost-efficiently and in time is a guaranteed and secure supply of cheap and renewable energy and resources for process industries [4]. Beyond investments in R&D&I for new, clean technologies, the supporting infrastructure and supply chains must be adjusted and enhanced. One cannot go without the other, and the selection of a mitigation pathway strongly relates to the availability, accessibility, and affordability of renewable energy sources, which implies the presence of infrastructure for electricity and molecules (hydrogen, CO2, etc.) [5]. According to their report on challenges and opportunities for Energy Intensive Industries (EIIs) in the energy transition, a lack of infrastructure is recognised as a critical hurdle by the EU Committee on Industry, Research, and Energy, and its progress will strongly influence the future of energy-intensive process industries in Europe [6]. Electrification will increase the pressure on currently existing electrical grids and in order to implement hydrogen and CCS technologies, in most cases, new infrastructure will still have to be built. Typically, decisions on the future layout and operation of these backbone grids are out of the scope of industry but in the hands of grid operators. Where to expand infrastructure with new or stronger segments? How to provide for future energy needs, not only from industry? Which road will each of the EII sectors take in the range of mitigation options, and how will it locally affect the supply chains for energy and feedstock? Grid operators are confronted with many questions and challenged with the exercise to balance decisions with investment costs and risks of stranded assets. On top of this, time is of the essence as the permitting, construction, and development of grid (as well as industry) adjustments take time. The first efforts should focus on readying the supply backbones to answer future industry needs. An initiative that recognises the urgency of this matter is the higher TRL project TRILATE, which analyses the need for energy transport infrastructure for industrial clusters in Belgium, and, by extension, its neighbouring regions [7].
Providing insights on the future demand and supply of energy commodities and on how to tackle the challenges faced by a variety of actors is the goal of energy system modelling (ESM), which is often used by policy and decision makers to assess the impact of their plans. Among other applications, ESMs can be used as a support tool for infrastructure development by analysing and comparing different scenarios and identifying what it takes to maintain the security of supply [8]. The number of models has increased over the past decades, tailoring to the needs of their users and keeping track of the trends challenging current energy systems. Thanks to the large, open-source community behind ESMs, there is a clear overview of models that are suited to investigate any type of issue related to the energy supply chain [9]. Progressive insight drives developments in ESMs, clearly shown by the wave of models suitable for assessing the integration of renewables and the path towards climate neutrality [10]. Given the importance of industry as a large contributor to both greenhouse gas emissions and energy consumption and its dependence on supporting infrastructure, it is worthwhile to reflect on the representation of EIIs in ESMs and if their strategies and investment plans are accounted for in ESM frameworks. Many policy recommendations point towards the strength of cross-sectoral co-operation as a leverage for climate and resource neutrality, advancing the energy transition; a trend increasingly picked up by countries in their strategic planning [4,5]. The masterplan published by the High-Level working Group on EIIs emphasises the link between optimised infrastructure developments and crossing the borders of industry sectors, regions, and energy commodities, integrating and optimising all segments together [4]. A term often used in this context is industrial cluster (IC). For ease of access to material and energy flows, EIIs tend to be densely grouped together in a certain region, often overlapping with port areas. The World Economic Forum (WEF) is an active contributor to the knowledge gathered on ICs and provides strategic insights on how to leverage opportunities resulting from such an integrated IC approach, like economies of scale and scope, risk spreading, sharing of resources and infrastructure, and local optimisation of demand and supply [11,12]. Another key player in the field of cross-sector collaboration is Processes 4 Planet (previously A.SPIRE). This European process industry initiative introduced the concept ‘Hubs for Circularity’ (H4C) to stimulate the sharing of energy, resources, and infrastructure that brings mutual benefits for the stakeholders [13]. The scope is not limited to industrial boundaries and compared to ICs, H4Cs also include urban centres [14]. The WEF’s characterisation of an IC is based on four pillars: industry composition, geography, existing infrastructure, and energy costs and policy [12]. From the list of building blocks for industry pathways towards climate and resource neutrality mentioned above, the WEF expects some to have a larger impact when implemented at the IC level, such as systemic efficiency and circularity, electrification and renewable heat, and hydrogen and carbon capture for storage or usage. Acknowledging this is a critical step in reaching the climate targets; ICs put forward an integrated approach for the optimisation of EIIs and the supporting infrastructure that is currently still lacking in ESMs.

1.1. Goal and Contribution of This Paper

The objective of this study is to investigate the current representation of energy-intensive industries in energy system modelling and to contribute to this field by providing a framework that introduces industrial clustering. This approach is still lacking in the current ESM discipline and could improve the support of energy and climate policy. Ultimately, the goal is to maximise system value through the optimal integration of industrial clusters and to provide the basis for co-operation on infrastructure and other assets, de-risking investments, and saving both resources and energy [11].
Completing this introduction, this paper continues with a brief literature review on the state of the art of industrial cluster representation in ESMs, identifying research gaps and pointing to challenges and future work. Section 2 delivers the methodology for a newly developed framework that looks in parallel at industry and energy infrastructure and facilitates the introduction of ICs in ESMs. Section 3 shares the results of the methodology applied to a case study on Belgian industry. Section 4 discusses the case study findings and reflects on the contributions of this work to improving industry representation in ESMs and closing the research gap. To conclude this work, Section 5 summarises the work’s most important findings and discusses leads for future work.

1.2. Literature Review

This literature review studies the representation of industry in ESMs and how it could be improved by introducing industrial clustering. The work of Mendez Alva laid the foundation for this research by analysing ICs in terms of cross-sectoral collaborations and industrial symbiosis (IS) [13]. This paper deepens the knowledge of the role of ICs in the energy system and aims to close the gap between IC and ESM research. Hence, the targeted ESMs include industry as a separate demand sector, split over the different subsectors and covering multiple energy commodities. Summaries of each available model’s specific approach, strengths, and weaknesses are the topic of multiple review papers, aiding potential users in their search for ESMs suitable for their research question and exposing research gaps. Often, they provide a categorisation of ESMs based on commonly used modelling characteristics. According to Ringkjøb et al., the main themes are general logic (purpose, approach, methodology), spatiotemporal resolution, and technical and economic features [8]. A second set of ESM review papers provide an overview of the challenges and future work within this modelling discipline. Progressive insight in the energy transition raises new questions and exposes hurdles to be taken along the way. The paper by Prina et al. reaches the conclusion that resolution is the main next frontier of developments in terms of time, space, techno-economic detail, and sector coupling [15]. Crucial for the integration of large amounts of Variable Renewable Energy Sources (VRES), the interlinkages between different energy commodities increase. Hence, Ringkjøb et al. mention sector coupling as a research gap within ESMs, together with proper VRES forecasting and uncertainty [8]. Fodstad et al. add further to the list and raise attention to behavioural aspects in the energy transition strongly influencing the energy system [10]. Lopion et al. warn of an increasing modelling complexity due to high VRES shares, energy storage needs, cross-sectoral technologies, and the internationalisation of energy markets [16]. Next to increased complexity, all four sources also mention the computational burden and its trade-off with improved accuracy. On top of this, one cannot assume the availability of the data required to go to the next level of detail [17,18]. The latter is especially relevant for industry, as confidentiality issues often arise [19]. From this list of challenges and future work, the remainder of this work will discuss improved spatial resolution by representing EIIs as part of ICs. This opens up the possibility to include local energy and resource efficiency gains resulting from cross-sectoral co-operation in the context of ESMs.
The discussion on spatial resolution is mostly held in terms of the total number of nodes [15]. Whether or not a model has one or multiple affects energy and material exchanges and allows or hinders taking bottlenecks and transport constraints into account [16]. This is crucial in performing an infrastructure analysis. A trend noticed by Lopion et al. shows an increasing number of ESMs allowing flexibility in spatial granularity by altering the number of nodes [16]. In order to go from a single-region to a multiple-region model, you need some sort of division criteria. According to Fodstad et al., splits are often made reflecting public institutions and are categorised as ‘energy system independent divisions’ [10]. This does not reflect typical characteristics or the design of an energy system; an example can be found in Colbertaldo’s Italian case study framework [20]. An opposite approach, ‘energy system dependent division’, clearly refers to its better ability to represent energy system properties [10]. Examples include splitting with respect to price zones and VRES availability. Ultimately, the element chosen to underpin the division will determine the property represented best.
Most papers in this literature review list the integration of VRES as the main or only example of the need for increased spatial resolution. This is due to its distributed and location-dependent nature, influencing production capacity, generation costs, and profiles [15,17,18]. In their paper on the spatial resolution of VRES in ESMs, Martínez-Gordón et al. make use of Geographic Information System (GIS) tools and data clustering, showing promising results [18]. According to the authors, the tools hold potential in other fields as well, like infrastructure layout, supply chain analysis, and demand localisation. ESM and IC research already share common ground on the use of data clustering algorithms. The work by Mendez Alva et al. successfully illustrates that its application should not be limited to VRES and compares different clustering algorithms and their ability to retrieve potential H4Cs [14].
The inclusion of industry as a demand sector in ESMs could, similar to VRES but to a lesser extent discussed in the literature, benefit from an improved spatial resolution, especially when results are used to support policy recommendations or infrastructure development. A paper by Frysztacki et al. states that regions with high geographic variability in energy demand are equally relevant for increased spatial resolution as heterogeneous regions due to large VRES shares [21]. Also, Fodstad et al. suggest dividing regions based on demand [10]. In this paper, industrial clustering is proposed as a division criterion to go from a single to multiple nodes in ESMs. Each node would then properly represent a cluster in terms of the four WEF characteristics. This format provides new insights into ESMs. The geography and existing infrastructure in ICs influence the pathways towards resource and climate neutrality and, accordingly, steer infrastructure updates and additions to the hydrogen and CO2 networks. ICs also relate to the energy hub concept in ESMs, serving as coupling points between different commodities as defined by Fodstad and Kriechbaum [10,17].
To conclude the literature review, the focus is shifted to what is already known and written about the application of ICs in ESMs. On this very specific topic, publications are not yet common. Most often, articles either focus on just one IC or a specific technology pathway (e.g., hydrogen). The paper by Sechi et al. presents a review of modelling approaches in terms of IC representation and uses a GIS tool that increases the spatial resolution up to the plant level together with a methodology to allocate emissions and total energy consumption to the clusters [22]. The main outcome of the paper is a taxonomy for IC climate neutrality which, according to the authors, is more insightful than classification based on economic activities in the context of energy transition due to its more detailed portrayal of energy supply and demand. In their review of ESMs, Sechi et al. come to the conclusion that none apply an IC-based approach as they still stick to sectoral disaggregation [22]. The scope of industrial sectors in Sechi’s paper is EIIs. However, eventually, the authors decided to leave out refineries and bulk chemicals due to the complicated processes (compared to other sectors) and the lack of required data to execute their presented methodology. According to the results by Mendez Alva et al., these sectors play a significant role both as source and sink of energy and material flows and thus deserve a place in the context of many IC initiatives.
An excellent example of IC analysis in terms of a specific technology pathway is presented in the paper by Calvillo et al., in which the authors emphasise that a proper understanding of an IC’s composition, geography, and infrastructure is crucial for the development and implementation of a CCS system [23]. The lack of and inconsistency in exact descriptions of ICs is mentioned as a hurdle in their research. In the context of this research, the approach to display EIIs in the recently finished AIDRES (Advancing Industrial Decarbonisation by assessing the future use of Renewable Energies in industrial processes) project is most in line with the current objectives. Compared to typical studies on trajectories towards climate neutrality by 2050 that only look at one sector and/or technology pathway at a time, the project’s scope includes EU facilities from six crucial EIIs (cement, chemicals, fertilisers, glass, refinery, and steel) for which multiple production route options are recognised [24]. Results on future energy demand and GHG emission roadmaps from and by these industries are available on a NUTS3 (nomenclature of territorial units for statistics) level. The project picked up the potential of ICs and applied the DBSCAN cluster algorithm, as recommended by Mendez Alva et al., as part of the methodology to estimate the potential of IS to reduce energy and resource consumption and emissions [13].
From this literature review, it can be concluded that industry representation in ESMs can still improve significantly, both in terms of spatial resolution and composition. The industrial cluster concept offers an integrated approach and can function as a bridge between energy systems and industrial sustainability research. It opens up the possibility to further investigate industrial symbiosis opportunities and incorporates cluster transition research into ESMs. This work aims to take the first step in closing this research gap by improving industry representation (spatial and composition) through industrial clustering.

2. Materials and Methods

Considering the spatial representation of EIIs in ESMs in the current literature, and applications of ICs, this paper aims to contribute to the state of the art by providing a classification methodology for regions taking into account the IC characteristics geography, composition, and existing infrastructure. The latter, although seen by the WEF as one of the four key characteristics of ICs and crucial in energy systems, was not yet included in the limited number of papers on the topic. Please note that for the remainder of this paper, the scope of infrastructure is limited to the backbone grids for both electrons and molecules. Describing both local industry together with backbone grid presence can eventually support regional divisions to go to multi-node energy system models useful for IC and ESM research.

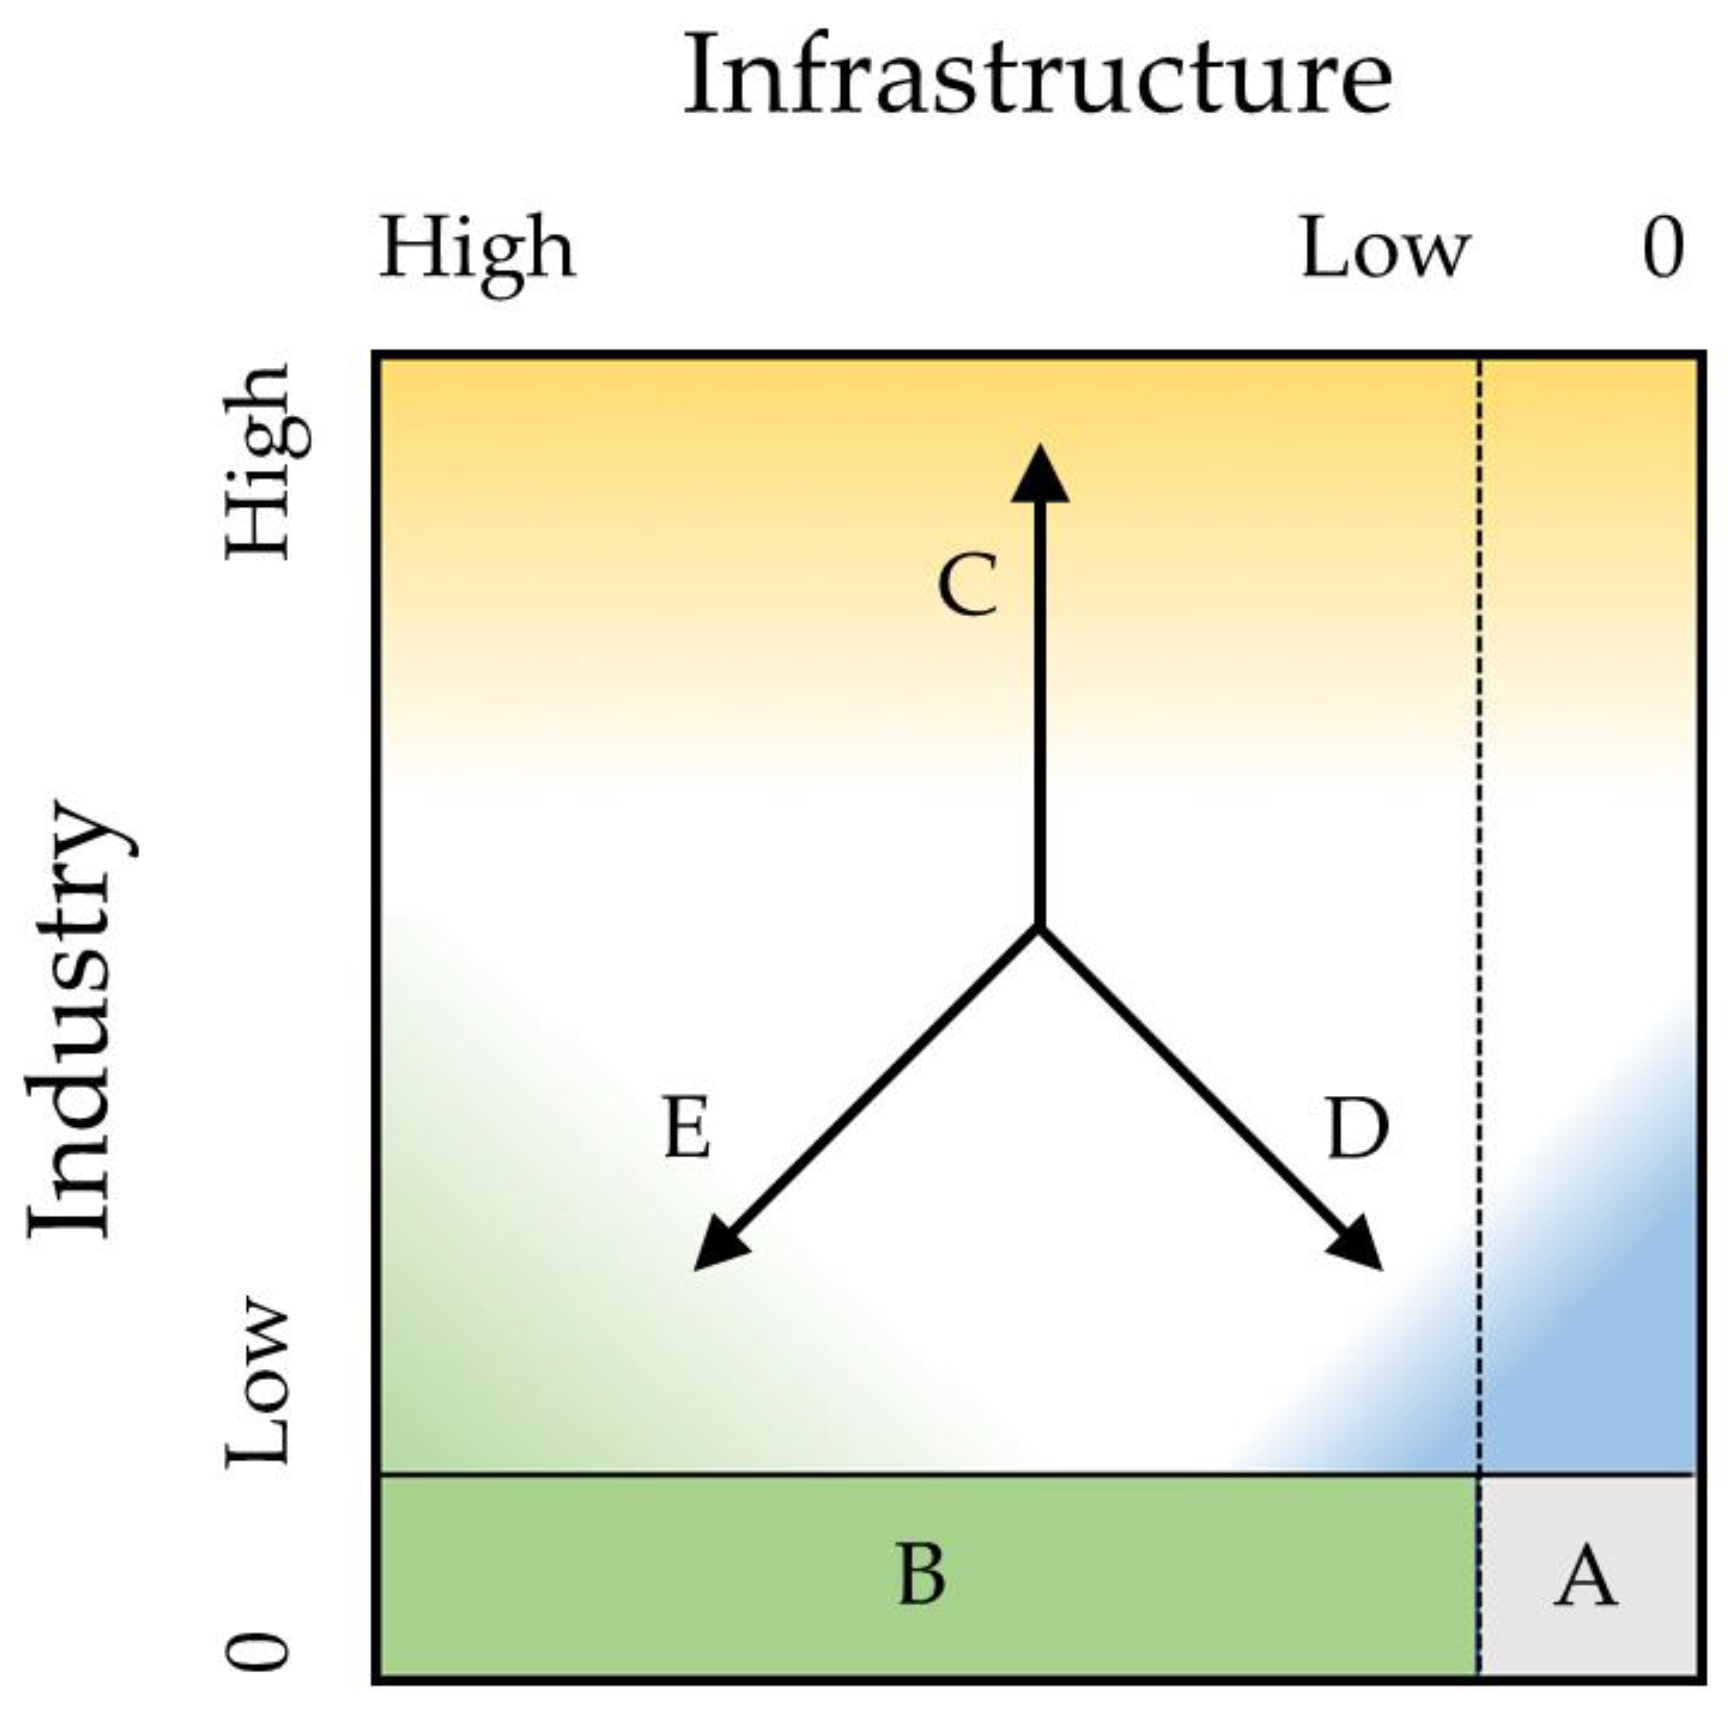
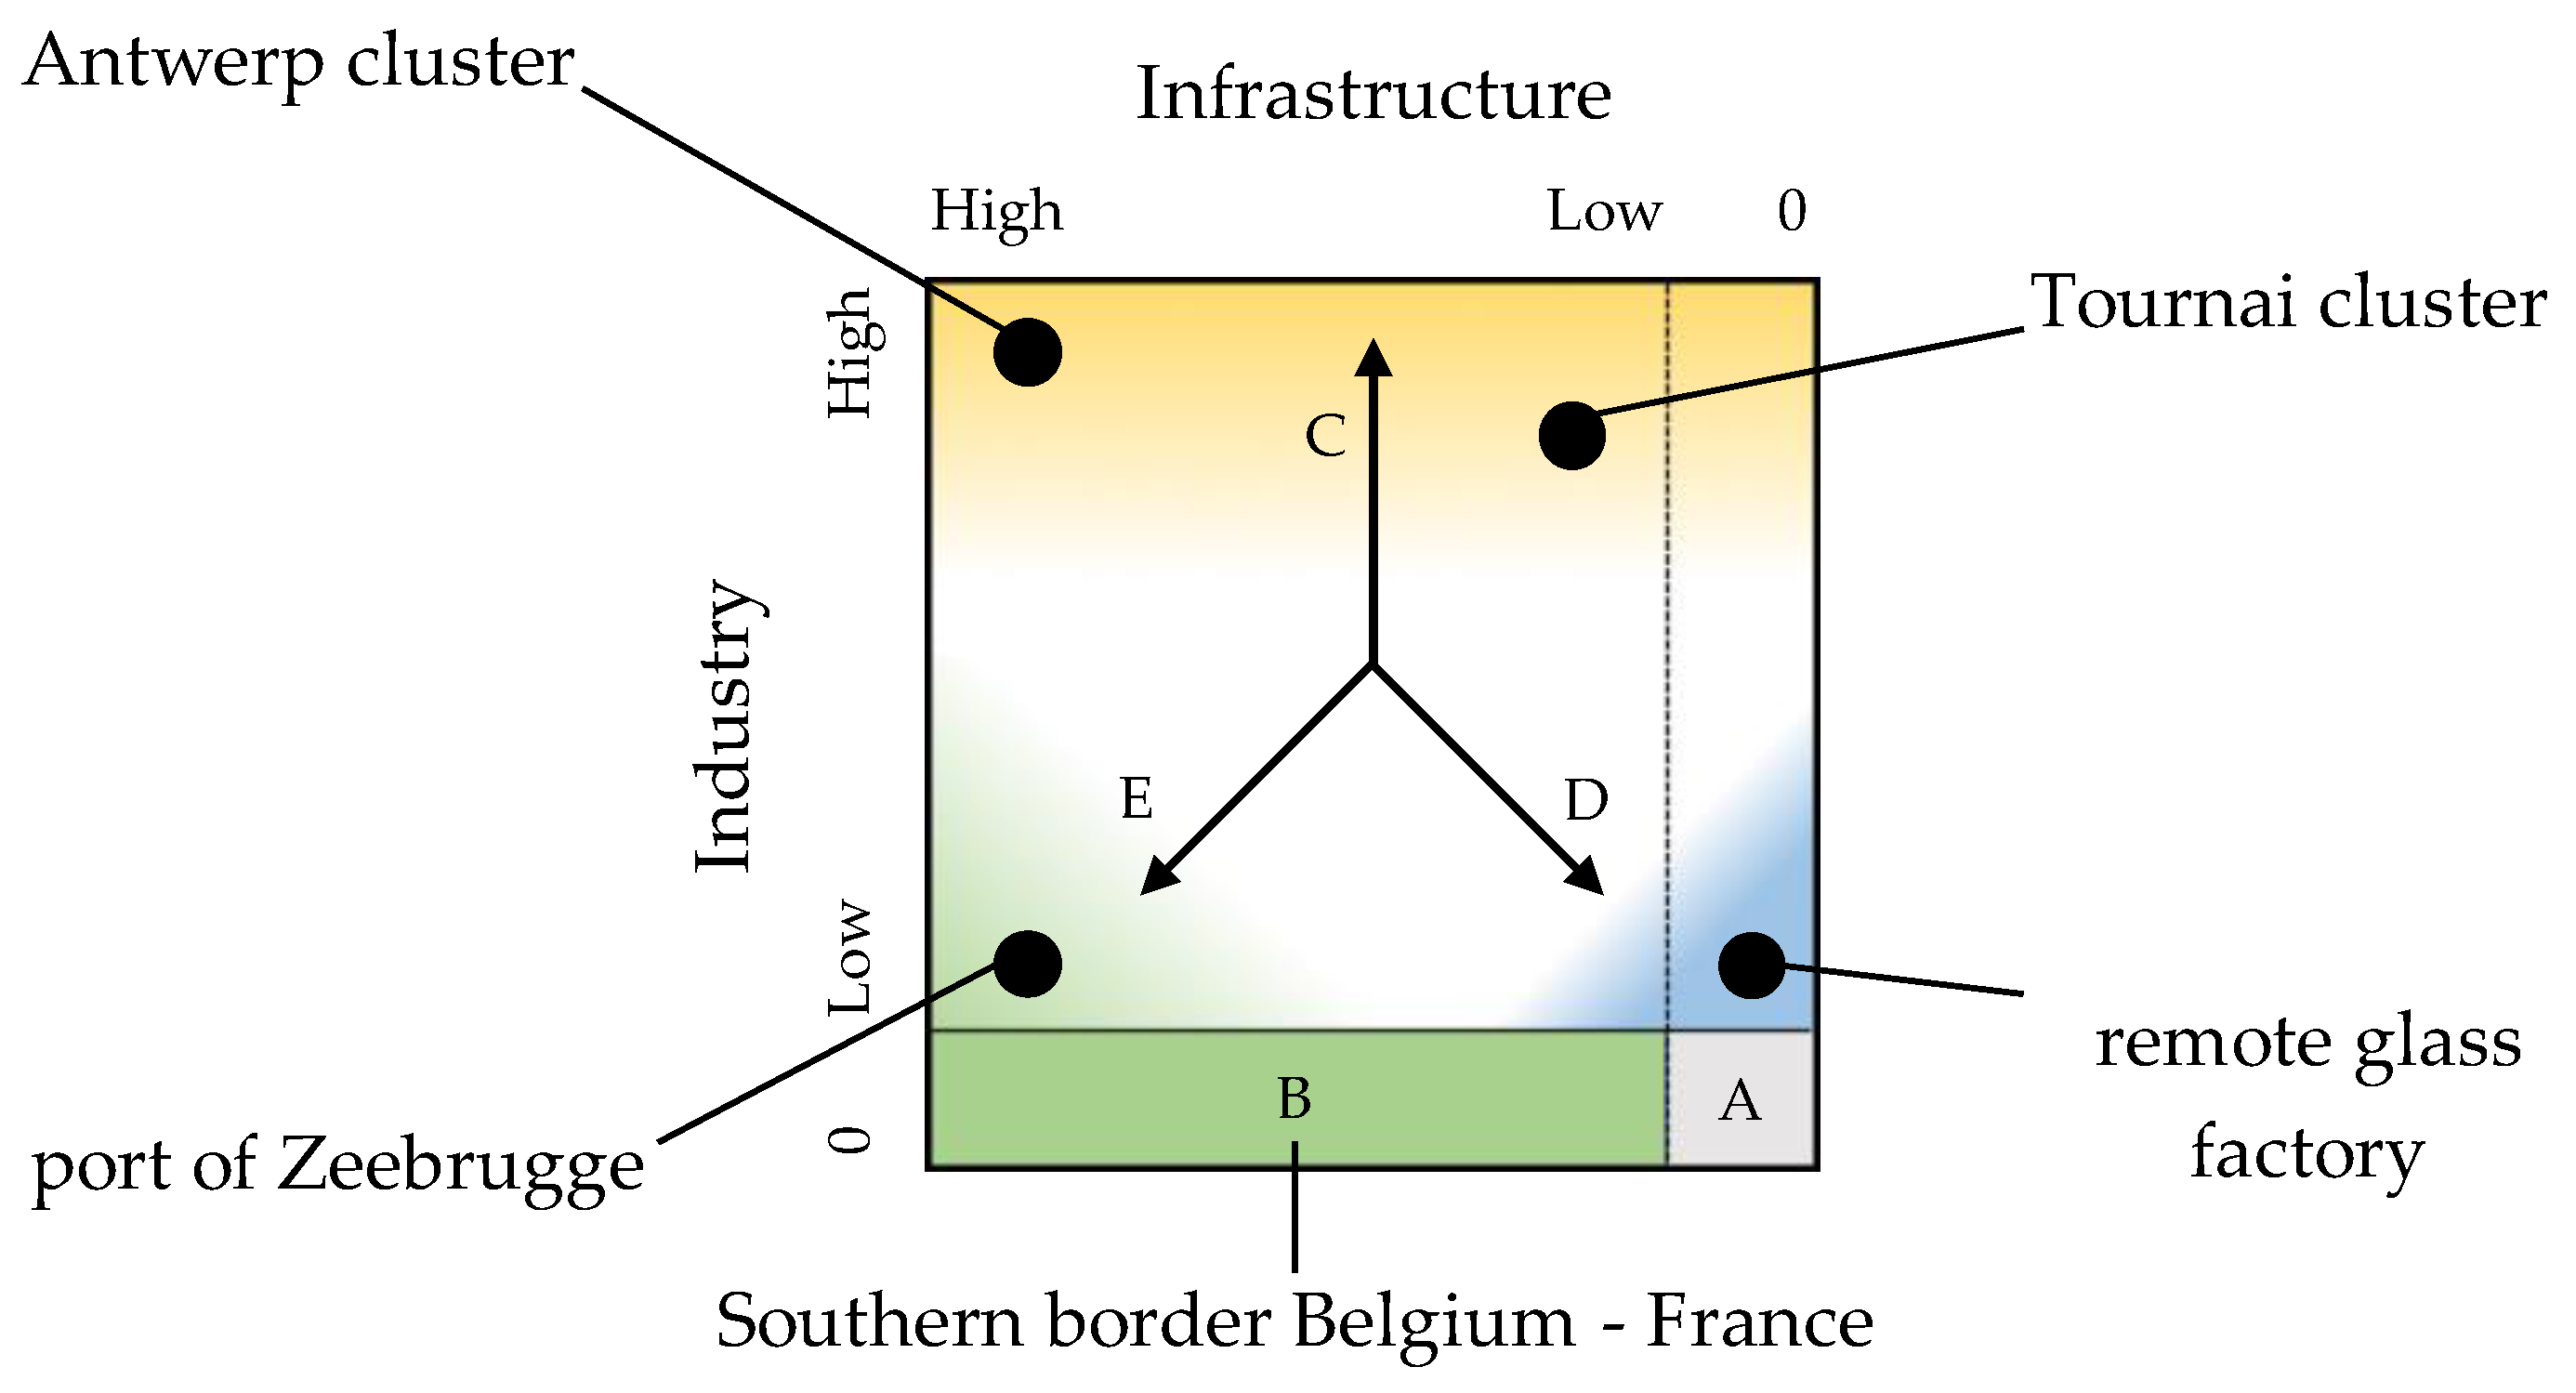
2.1. The Industry–Infrastructure Quadrant

In order to simultaneously visualise both local industrial presence, whether or not as part of a cluster, and the availability of energy infrastructure, the Industry–Infrastructure Quadrant (IIQ) is introduced (Figure 1). This quadrant serves as a visualisation tool to be used in the classification of areas in terms of industry importance and existing backbone grids from which potential nodes of interest for ESM studies can be selected. The horizontal position within the IIQ reflects the local presence of infrastructure elements in an area and runs from high (left) to low (right), adding the lack of infrastructure as a separate case (most right). Similarly, for the vertical industry axis, a top or bottom position in the IIQ reflects a high or low relative importance in terms of industry presence. A clear distinction is once again made for areas lacking industry.
To capture the most meaningful conclusions in the IIQ, areas are categorised based on defining the outliers, as shown in Figure 1. The first category consists of regions that do not contain any industrial facilities or nearby infrastructure, which are further referred to as ‘out of scope’ (A). Secondly, areas without any industrial presence might function as interconnections in the international energy systems. This category is called the ‘interconnection corridor’ (B). The majority of areas do have industry present, and out of those remaining, three more significant categories are uncovered. These are visualised in the quadrant by means of three axes. The ‘industry axis’ runs towards the areas with the highest industrial importance (C), grouped together under the term ‘cluster potential’. It covers the full scope of infrastructure presence, high to low, and cluster potential areas that end up to the right in the IIQ indicate candidate areas in need of infrastructure strengthening or expansion.
The second identified axis is the ‘remote activity axis’, referring to single industries present in an area without any infrastructure nodes (D). The last ‘infrastructure axis’ corresponds to the areas in which the present infrastructure is more significant than its industry (E). Due to this characteristic, these are called ‘infrastructure corridors’.
In order to make use of this IIQ, data on both industry and infrastructure need to be available and quantified with respect to each other in terms of regional presence. The following subsections describe in detail how this can be achieved for both the industry and infrastructure axes, respectively. To support the use of this IIQ concept in future research, the methodology solely relies on open-source data and data processing tools.

2.2. Data Collection and Processing

2.2.1. Industry

The IIQ methodology requires geospatial data on the industry to analyse it in terms of IC potential. As part of the Industrial Emissions Directive (IED) and European Pollutant Release and Transfer Register regulation (E-PRTR), the largest EU industrial complexes are obligated to share data on their releases and transfers of regulated substances [25]. The resulting datasets cover a wide range of sectors, allocating facilities to an economic activity, and include geospatial data in coordinates. This open-source information is frequently updated and can easily be extracted from the database. (At the time of writing this paper, the latest version of the database was published in May 2023 and covers information on facilities up to 2021 [25]. The database is frequently updated). The scope of economic activities is kept at the definition of EIIs according to the High-Level Expert Group [4]. Due to its relevance, the production of food and drink is added to the selection of activity codes. Infrastructure operators, especially those of electrical grids, keep an eye on this sector due to its large electrification potential [26]. In order to narrow down the selection of industrial facilities and only include the most energy-intensive plants, the IED database is combined with ETS data, which excludes installations below a certain size [27]. As there are no open-source databases on energy intensity at the level of individual industrial facilities, the verified ETS emissions of these sites are used as a proxy (for the year 2021). The selection methodology applied here builds on AIDRES, which started from the EU Transaction Log as well, but enlarges the scope of industrial sectors and extends the set of product categories (e.g., in AIDRES, steel finishing sites are excluded) [24,28].
After compiling the industry database from official EU IED and ETS sources, data processing steps include the identification of potential industrial clusters. The paper by Mendez Alva et al. on H4Cs compares three different clustering algorithms on the ability to locate potential hubs [14]. Compared to K-means and hierarchical agglomerative clustering, density-based spatial clustering with noise or DBSCAN, in short, was most successful due to its ability to alter the clustering parameters that influence IC density and differentiate clusters from noise points. It was also applied in the AIDRES project [13]. Hence, its use in the field of IC research is continued in this work as well. By means of open-source Python libraries, the algorithm can be applied to the industry database and retrieves clusters of similar density [29]. Users need to define two parameters: the maximum distance between two ‘neighbouring’ nodes (Epsilon) and the minimal number of neighbouring nodes to be considered a cluster (MinPoints) [29]. Either an industrial facility is part of a cluster or considered a noise point. The latter can be seen as an indicator for remote industries. Optimal values for Epsilon and MinPoints are case specific, although MinPoints should be equal to or higher than three, and it is not recommended to go above 25 km for Epsilon. Hence, a parameter sensitivity analysis complementary to the IIQ goal and purpose is desirable. This methodology suggests a parameter selection that returns a reasonable number of ICs with a high density of industrial facilities and sufficient coverage of the complete industrial database. The latter can be checked by applying the Pareto principle (‘80% of the consequences come from 20% of causes’, otherwise known as the 80/20 rule [30]) on the share of ETS emissions allocated to clustered facilities, which should at least reach 80%. The reasoning behind this originates from the typical outcome that a significant share of resources, energy, and emissions can be traced back to only a handful of stakeholders. This limited number of industrial facilities should be covered by the algorithm output.
A high density of clustered facilities implies providing DBSCAN a high MinPoints and a low Epsilon value. Ultimately, the parameter sensitivity analysis will show the trade-off between density and number of clusters and, together with the Pareto Principle check, it will return a suitable parameter selection for industrial database processing. Visual confirmation of the resulting clusters together with the parameter sensitivity analysis are the two main validation options for the DBSCAN output according to Mendez Alva et al. [14].
Once the clusters are defined, the economic activity data linked with the facilities can be used to reflect on cluster industry composition and uncover potential trends for industrial subsectors in the context of the IIQ.

2.2.2. Energy Infrastructure

This part of the IIQ relies on existing infrastructure, such as backbone grids for the bulk transmission of electricity and natural gas, in the assumption that the energy infrastructure of the future will largely be based on present connections and nodes. Special attention is given to grid interconnections with neighbouring countries and port areas serving as entering points to reflect the international nature of the energy system.

Electrical Backbone Grid

ENTSO-E publishes up-to-date maps of the interconnected electrical power grid in and beyond Europe operating at high-voltage levels of 220 kV and above [31]. These lines and cables are seen as the backbone grid of the electrical power system and set the scope chosen in this study. Connections at lower voltage levels and distribution grids are not included. Three different types of substations are retrieved from the ENTSO-E maps: regular substations, interconnection substations, of which the lines cross country borders, and AC-DC converter stations. The latter also serve in most cases as interconnections.
In terms of data processing, the exact locations of the substations are used to construct Voronoi diagrams using the SciPy Python module (version 1.9.1) [32]. Each field in the Voronoi diagram corresponds to the nearest substation. The relative size of each of these Voronoi fields and the total number of fields required to cover a certain area are used to reflect the local electrical backbone grid presence. To illustrate the connectivity between the substations, an abstracted map of the electrical backbone grid is helpful. This can be derived from the ENTSO-E maps. It shows the current status of the transmission grid and is useful to form statements on future infrastructure expansion needs.

Molecule Backbone Grid

Similar to ENTSO-E, ENTSO-G keeps track of the natural gas transmission system in and beyond Europe [33]. The grid map contains data on cross-border capacities, the locations and sizes of pipelines, liquid natural gas terminals, and large-scale storage and is once again used to set the scope for this study. In terms of data processing, a different approach needs to be made compared to the electrical backbone grid data: instead of focussing on the nodes of the grid, for gas molecules, it is more relevant to look at the most nearby passage of a pipeline. How far is the nearest molecule backbone grid pipeline removed from my facility, cluster, etc.? Similar to the electrical backbone grid, an abstracted map is useful to illustrate the (missing) grid connections and is derived from the ENTSO-G map.

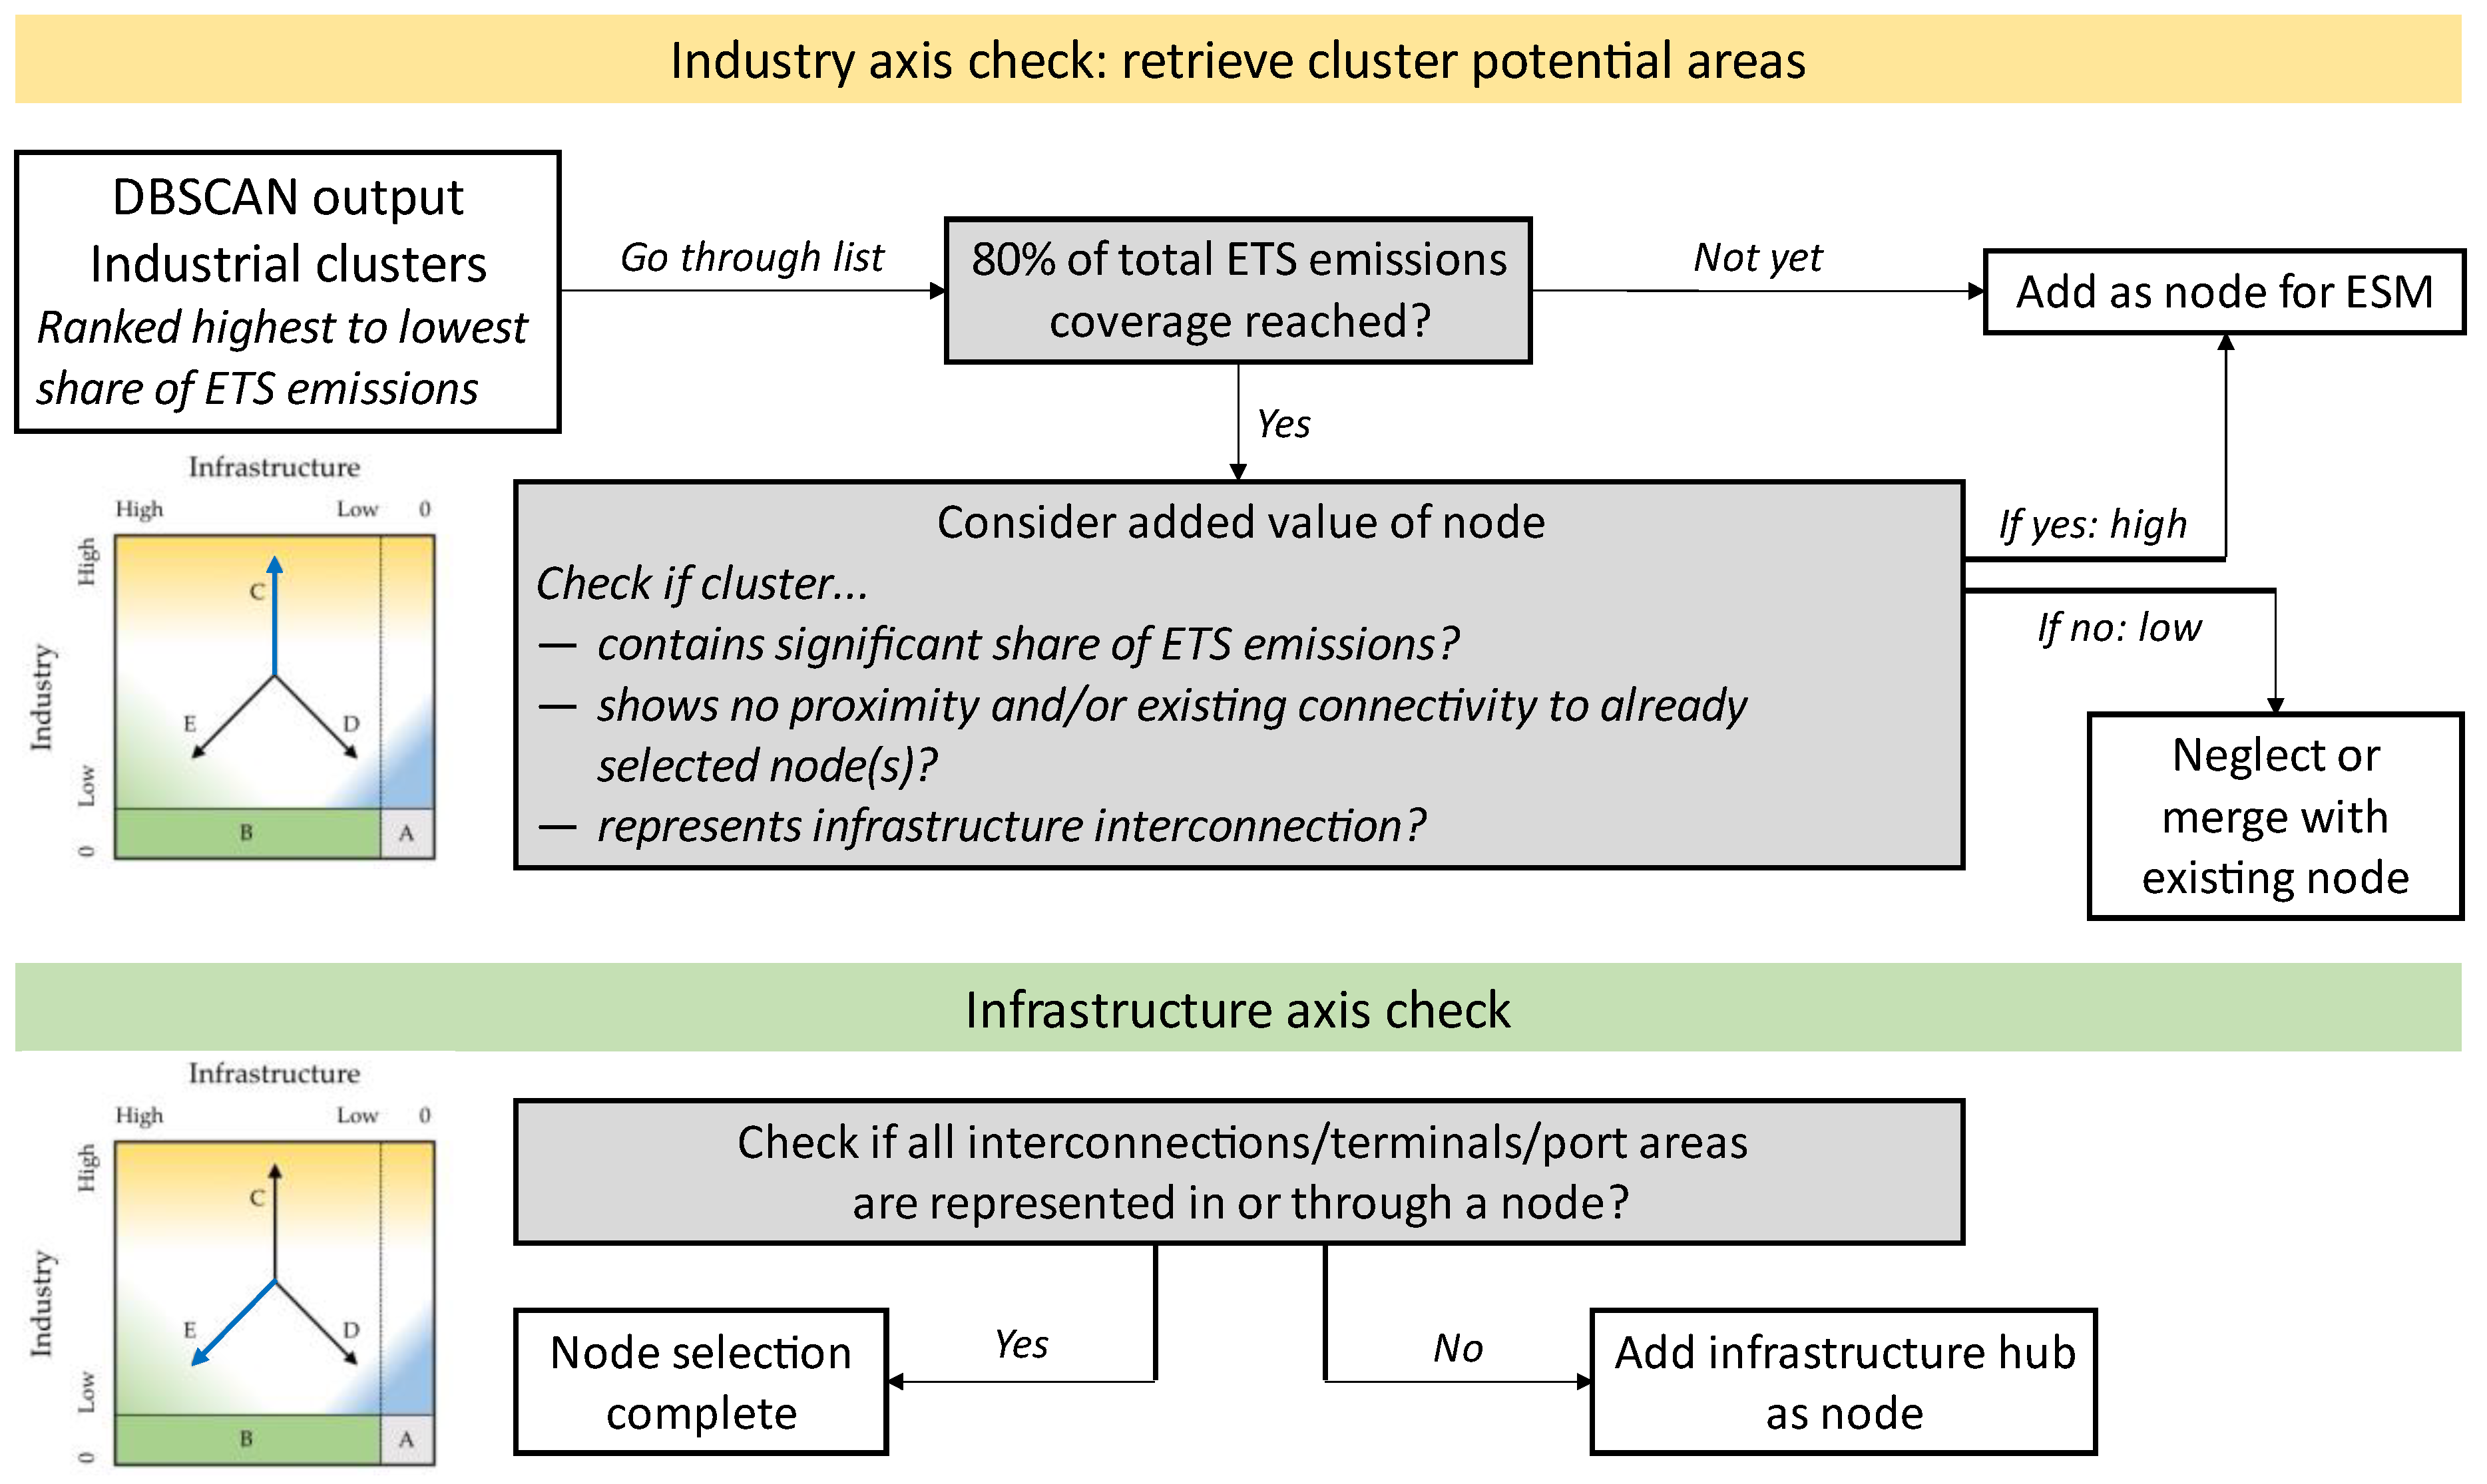
2.3. Industry–Infrastructure Quadrant Application

With all required data gathered, processed, and prepared for assessing industry and infrastructure presence, the IIQ can be applied in order to retrieve areas of interest useful for the ESM. Based on the definitions for each of the five typical areas present in the IIQ, the categories cluster potential, interconnection, and infrastructure corridors seem most promising and should be reflected in the ESM node selection. Hence, this part of the methodology discusses a systemic approach to retrieve these areas of interest from the collected industry and infrastructure data and allocate them to a set of ESM nodes.
Making use of the identified axes C and E in Figure 1, the flowchart in Figure 2 presents a decision tree to assess the completeness of the current node selection and the added value of a potential node. A larger set of nodes increases the spatial granularity, thus improving EII and IC representation. However, it also contributes to the computational burden. Hence, unnecessary nodes should be avoided in the final node selection. The grey boxes in the flowchart list the main criteria for node selection, forcing the user to reflect on both industry and infrastructure presence and coverage.
The industry axis highlights areas with cluster potential and follows the outcomes of the DBSCAN algorithm after correctly setting the parameters as discussed in Section 2.2.1. Up until reaching the Pareto limit of 80% coverage of ETS emissions, ICs are added to the node selection automatically. Next, every cluster beyond this limit is checked for significant added value, both in terms of industry and infrastructure importance, and forces the user to evaluate whether or not creating a new node or a merging opportunity with an existing node is present and desirable. Lastly, the infrastructure axis is considered to evaluate the completeness of the node selection. It looks for crucial, yet still unrepresented infrastructure elements, like interconnections, terminals, or port areas. If still missing, these are added to the node selection, purely serving as an infrastructure hub.
The data collection on infrastructure as presented in Section 2.2.2 are especially useful for the evaluation of nodes in the second and third steps in the decision tree. Users can consider the overlap between a cluster and the electrical Voronoi diagram, the proximity of infrastructure passages, and the connectivity through existing infrastructure to other clusters to form a statement on an IC’s infrastructure presence.

3. Results

As an example, the IIQ methodology is applied to the full territory of Belgium. Located in the heart of Europe, the Belgian industry is of high importance for export, and its infrastructure provides a gateway for the rest of the continent (e.g., through connections to offshore energy hubs and important centres, like the Port of Antwerp-Bruges, North Sea Port, etc.). The list of Belgian core sectors in terms of total value added includes pharmaceuticals, chemicals, food and drink, and basic metals and metal products [34].

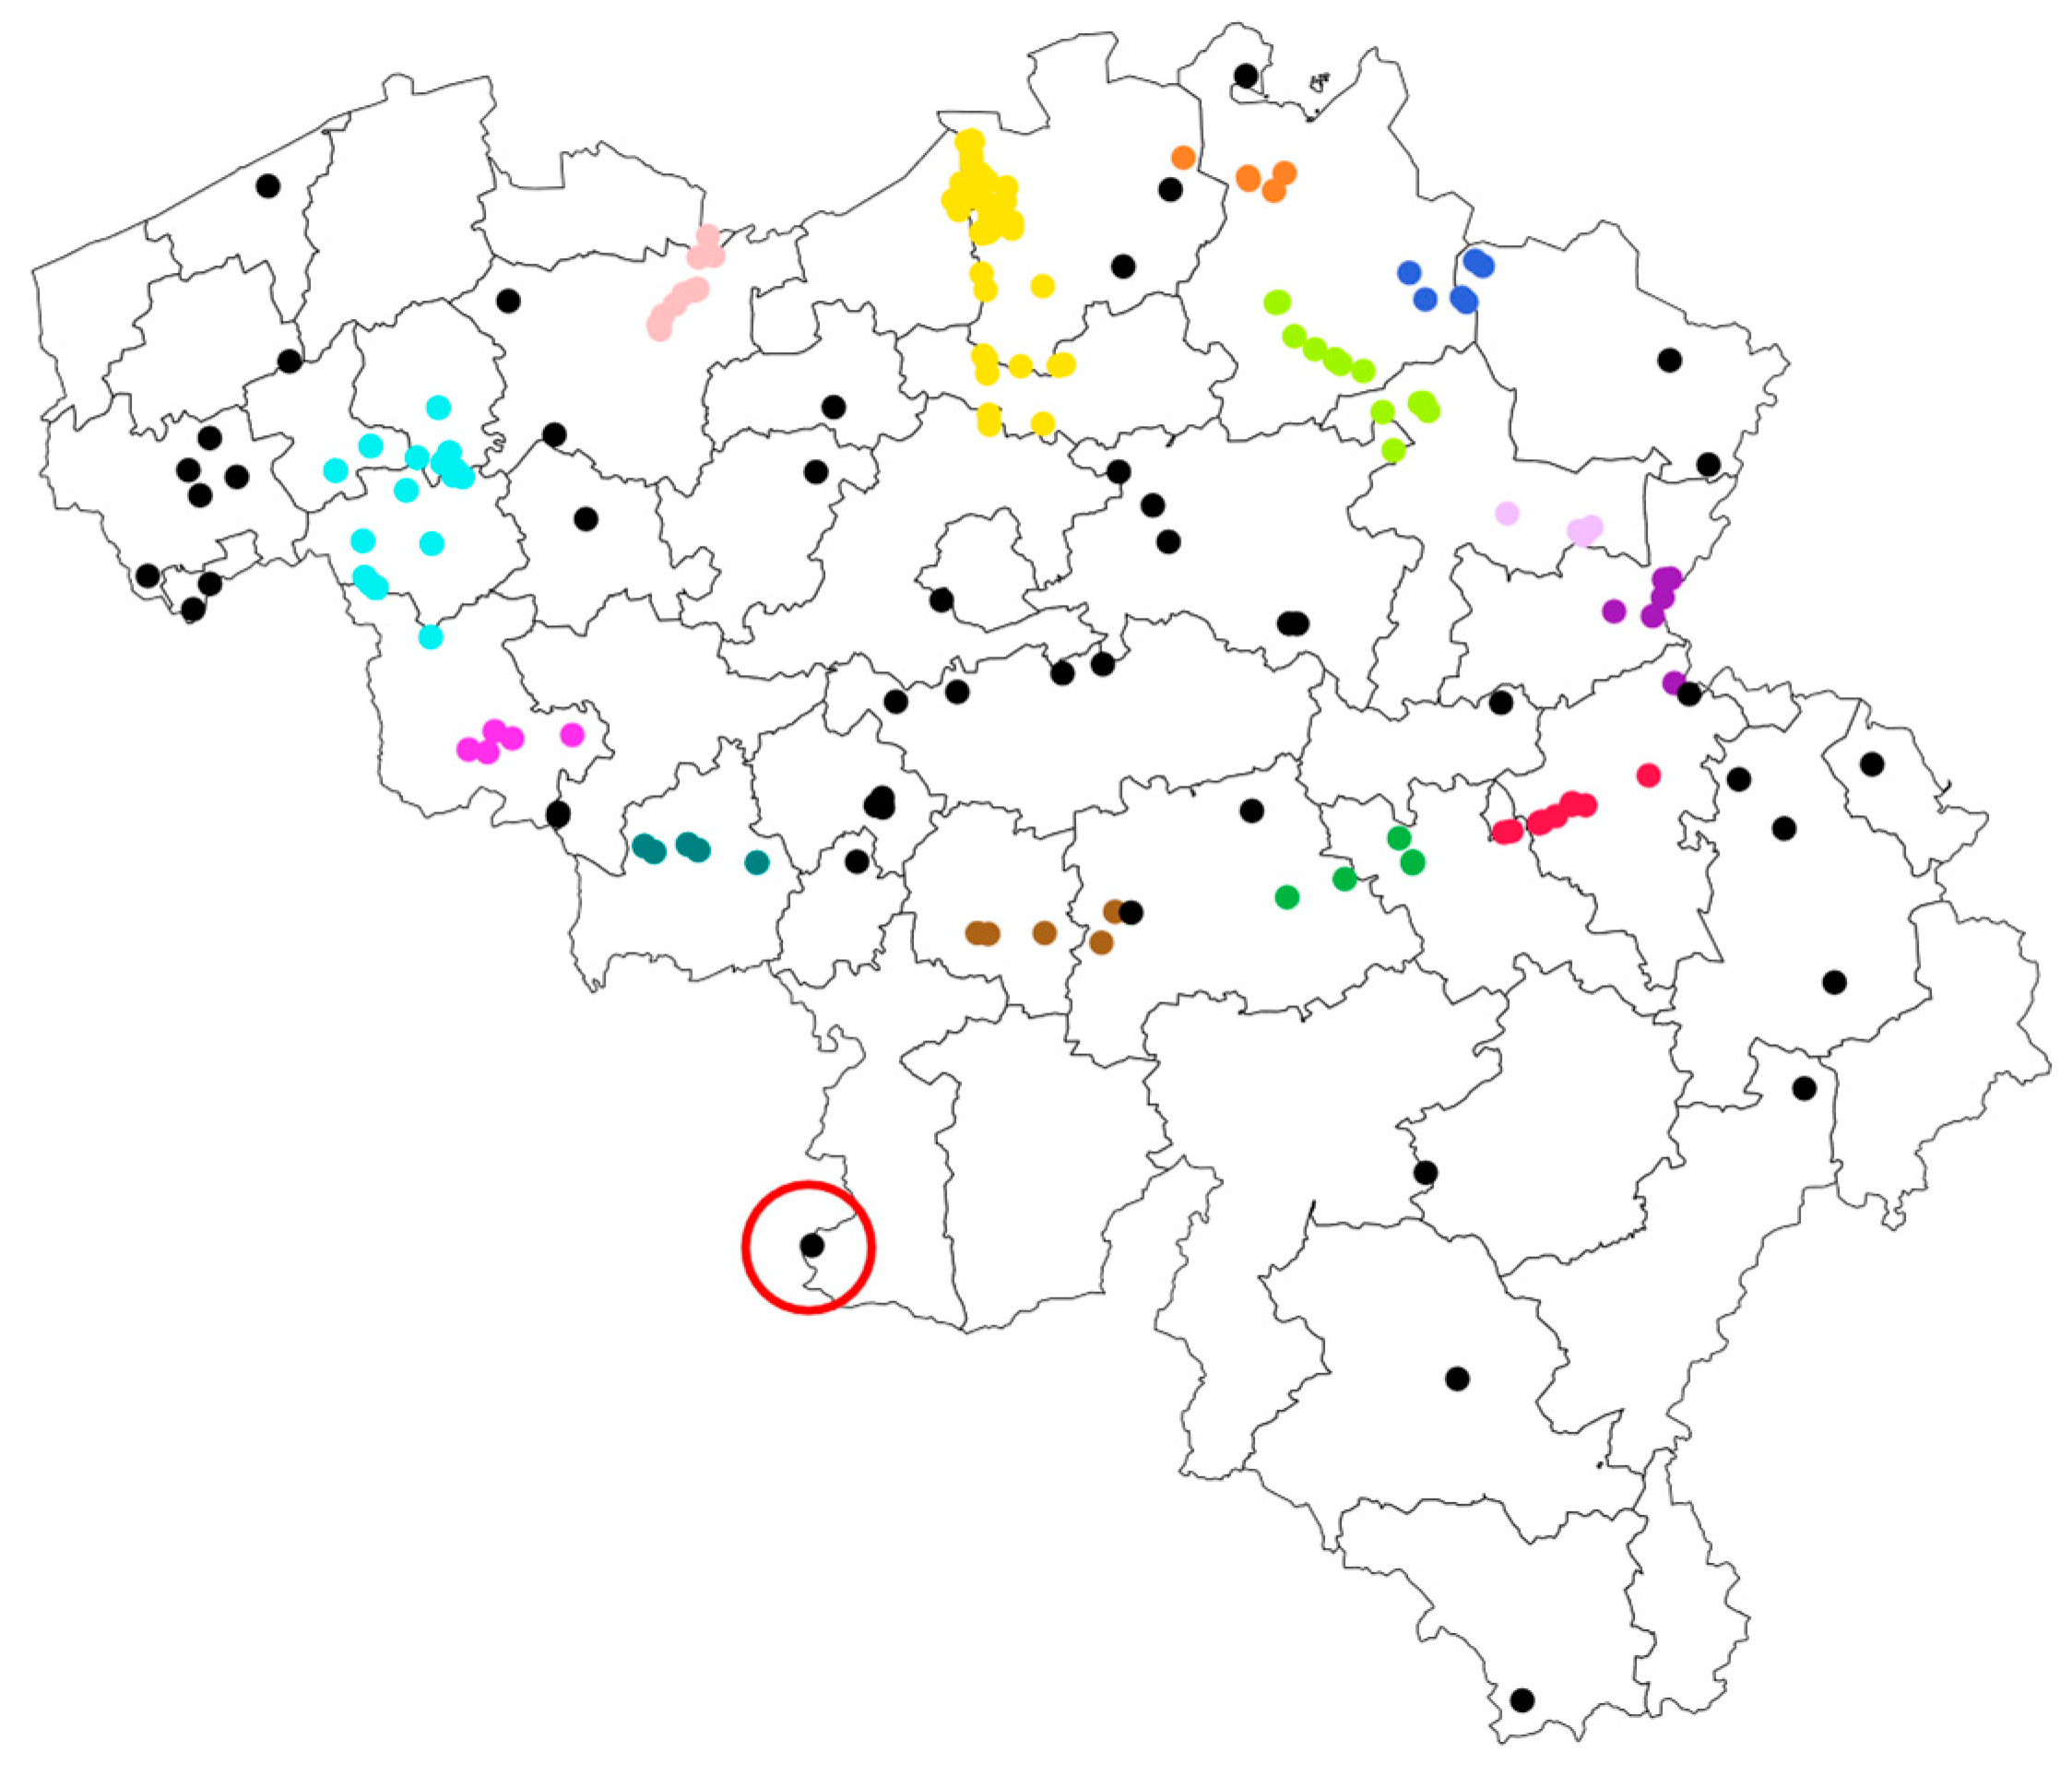
3.1. Industry Data Collection and Processing for the Belgian Case Study

To construct the Belgian industry database, the two-step approach is followed as described in Section 2.2.1, starting from the EU IED and E-PRTR databases with the column ‘country code’ set equal to BE. Next, the list of facilities is cross-linked with ETS data of Belgium to limit the scope to significant energy-intensive industries. Since the most recent data in the IED/E-PRTR databases correspond to the year 2021, corresponding annual ETS data are considered for the case study. Duplicates or facilities no longer reporting (e.g., due to closure) are removed from the dataset. Finally, applying a filter on the ‘main activity’ column sets the scope to EIIs (including food and drink) and returns 186 rows of data. The complete dataset is made available in the Supplementary Materials.
In terms of data processing, the coordinates present in the Belgian industry database are used as a direct input of the DBSCAN cluster algorithm. Two parameters, Epsilon and MinPoints, need proper defining in order for the algorithm to return a suitable number of dense clusters that cover at least 80% of total ETS emissions present in the database. The two graphs presented below conclude the parameter sensitivity check. In Figure 3b, all possible combinations for Epsilon and MinPoints that reach 80% coverage of ETS emissions can be retrieved. Figure 3a can then be used to check the total number of clusters to which this parameter selection corresponds. Epsilon 10 km; MinPoints 5 exceeds the Pareto limit and requires fewer ICs (13) compared to Epsilon 10 km; MinPoints 3 and Epsilon 5 km; and MinPoints 3 (17). For Epsilon 15 km, MinPoints 5–7–10 return the same number of clusters (6) but have a decreasing coverage of ETS emissions. Due to the higher resulting density, Epsilon 10 km is preferred over Epsilon 15 km.
A visual check of the clusters, shown in Figure 4, confirms that the desired level of IC density is reached with a parameter selection Epsilon 10 km; MinPoints 5. This setting is fixed for the remainder of this case study. Out of 186 data rows, 138 facilities are allocated to a cluster, reaching an ETS emissions coverage of 90.4%.

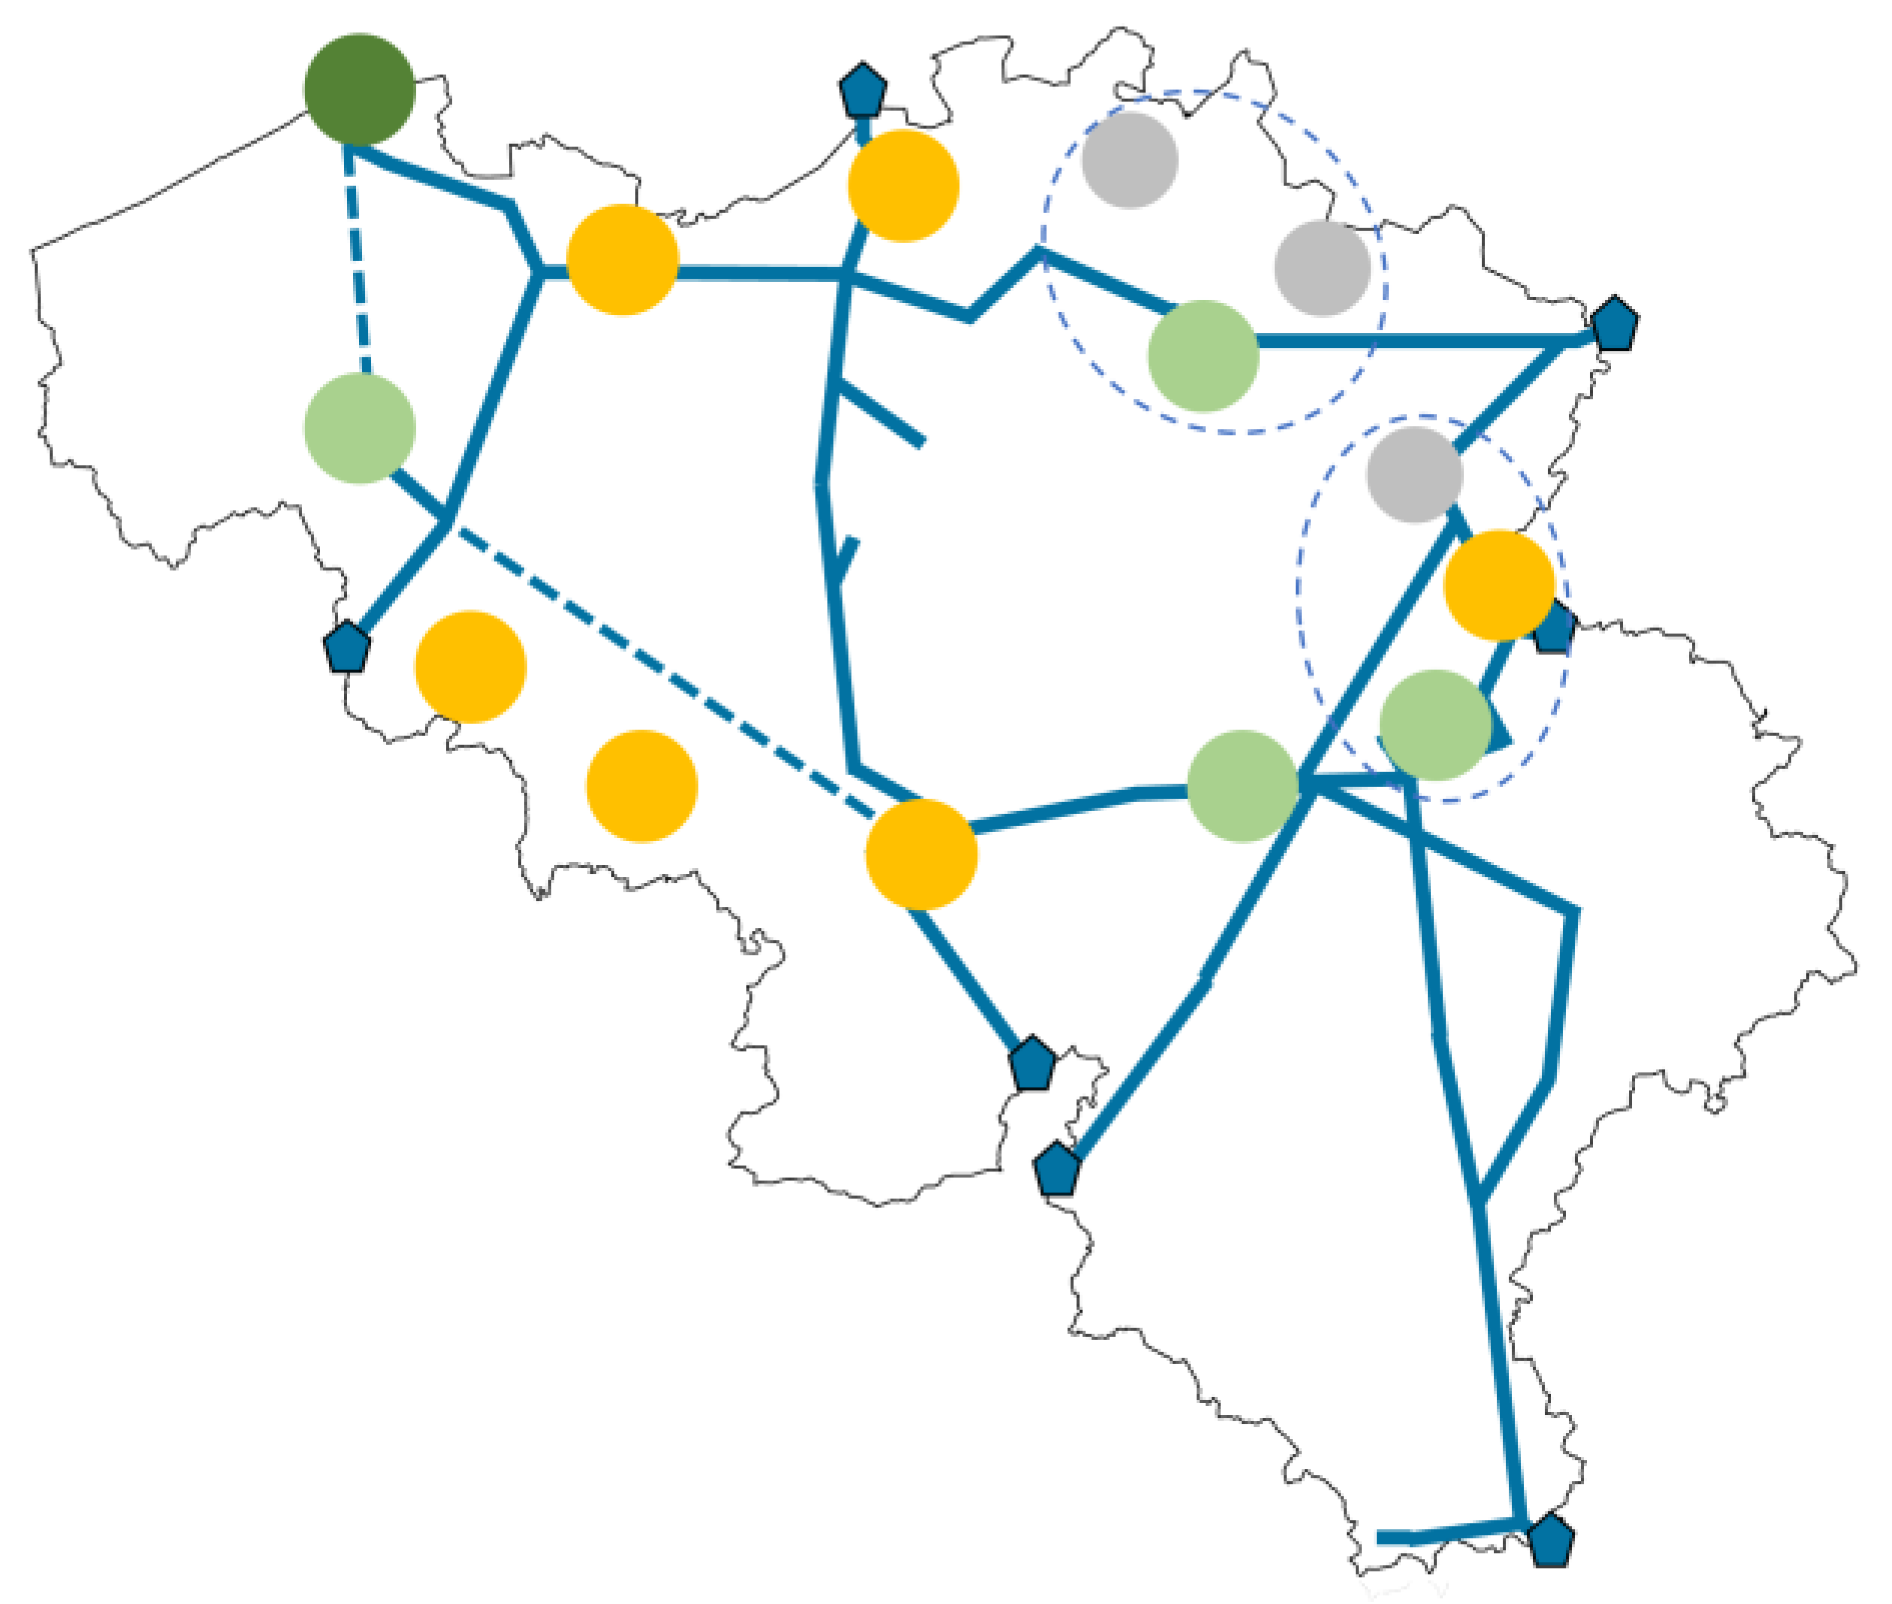
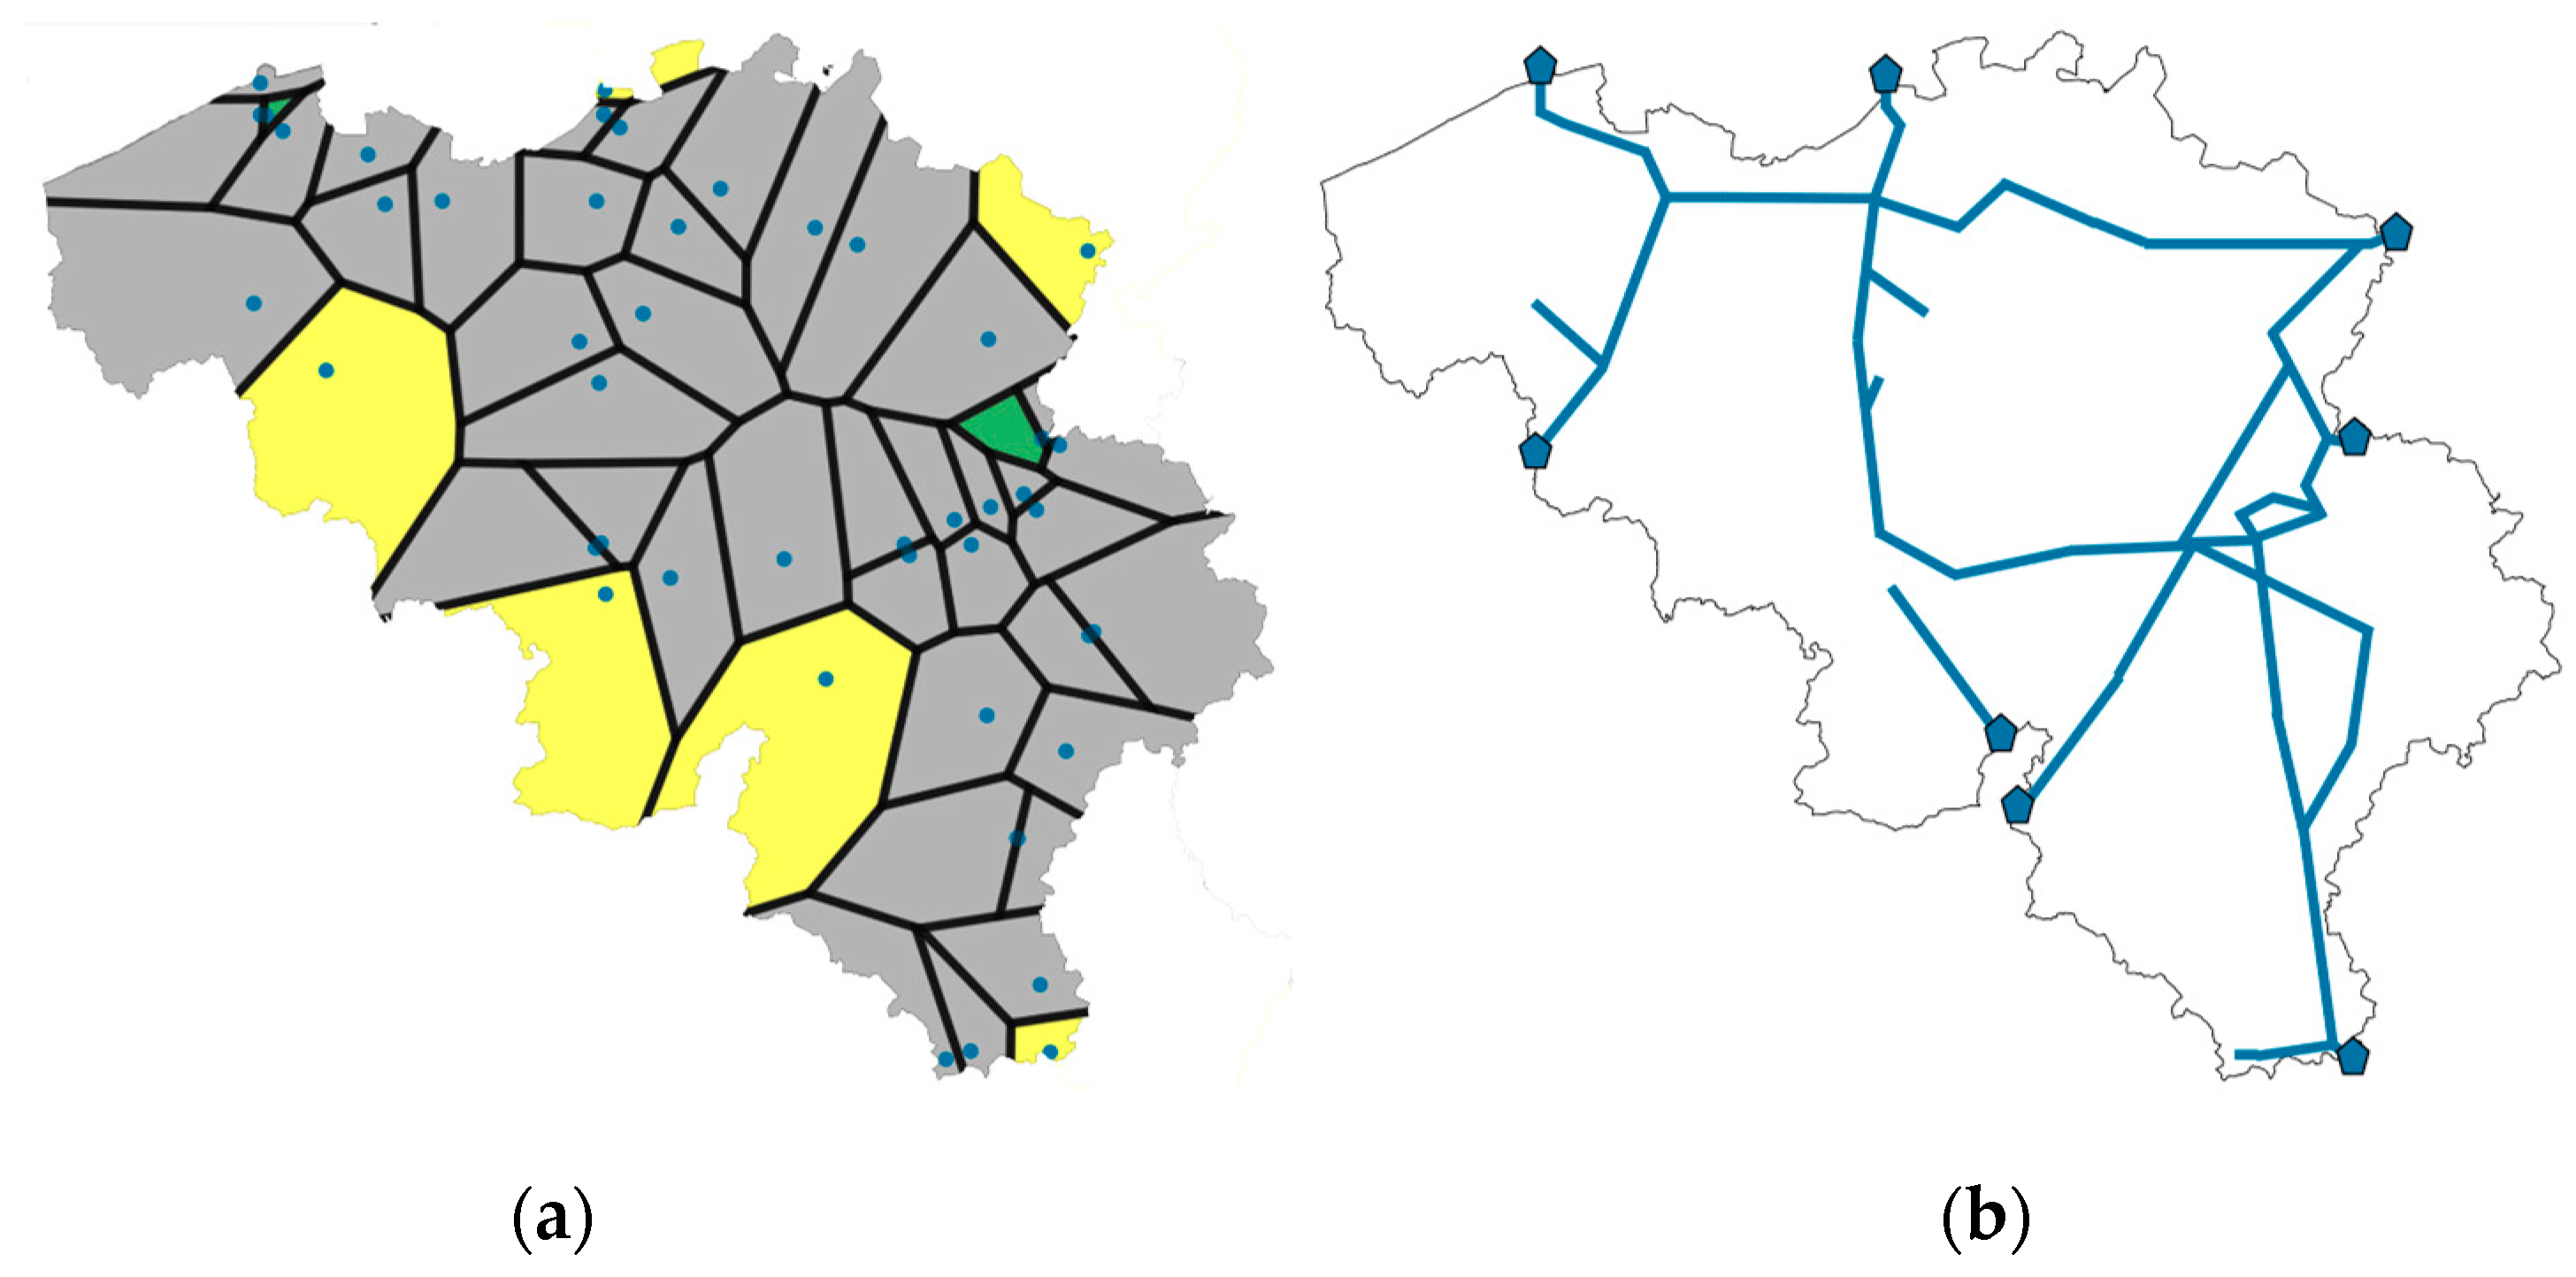
3.2. Infrastructure Data Collection and Processing for the Belgian Case Study

For this study, the most recent versions of the ENTSO-E and ENTSO-G maps are used, dating from 2023 and 2024, respectively. From the ENTSO-E map, the locations and types of electrical substations are derived, and exact coordinates are verified through the use of OpenStreetMap [35]. The SciPy Python module allows for the creation of a Voronoi diagram based on the substation coordinates and divides the Belgian territory according to the most nearby substation. Results are shown in Figure 5a, in which the fields of the Voronoi diagram are coloured according to the type of substation. Figure 5b represents the current connectivity of the substations.
For the molecule backbone grid, the ENTSO-G map forms the basis for an abstracted map of the currently existing pipeline transmissions in and through Belgium. Three different pipeline transmission capacities are distinguished, each corresponding to a different line thickness in Figure 6.

3.3. Industry–Infrastructure Quadrant Application

Table 1 contains each IC resulting from the DBSCAN algorithm and its share of ETS emissions and the corresponding node number in the final selection. To ease the discussion, each cluster is given a name that either refers to a nearby city or waterway useful for industry. As the flowchart in Figure 2 proposes, up until the Pareto front, ICs are automatically linked to an ESM node (six in total). Both the electrical and molecule backbone grid maps return in Figure 7, on which the first six nodes are indicated in yellow. The seven remaining Ics are evaluated based on the added value of an extra node. Three clusters, Albert Canal, Namur, and Kortrijk, extend the node selection (light green in Figure 7) due to their emissions share but most importantly because of their position in the energy transmission system. Each of them lies along existing backbone grids connecting to neighbouring countries, visually confirmed in Figure 7. Although Liège has an equal ETS share as Albert Canal, it is merged with the Maastricht node due to its proximity and connectivity through electrical and molecule grids.
The three remaining clusters no longer reach a 1% ETS share and no longer contribute to improving the translation of backbone grids. Hence, these are merged either with the Albert Canal or Maastricht nodes based on proximity.
The last step of the flowchart suggests checking whether all high-importance infrastructure elements are reflected in/through the set of nodes. The maps conclude this is nearly complete. Only one missing infrastructure hub, the port area in Zeebrugge, is manually added to the set of nodes (dark green in Figure 7). With this, all interconnections are covered by at least one of the nodes.
By applying the IIQ framework and its methodology, this case study proposes a set of ten nodes to represent energy-intensive industry through industrial clustering in the energy system models of Belgium.

4. Discussion

The IIQ is presented as a tool for multi-node selection in the ESM if an improved spatial representation of industry according to cluster potential is desirable. Section 3 showcased the methodology for a case study on Belgium, proposing ten distinct nodes to construct a model. As can be seen in Figure 7, the IC-based nodes nicely correspond to important backbone grid junctions. Historically speaking, it makes sense that gigawatt energy corridors pass along large demand hubs, like industrial clusters. According to a recent report, industry is responsible for 26% of the total final energy consumption in Belgium in 2022 [36]. In terms of energy sources, industry mostly used natural gas (36.3%), electricity (33.4%), and, to a lesser extent, crude oil products (13.6%) [36].
The energy transition forces industry to look forward. The mix of energy sources will evolve over the coming decades. Hence, it is useful to also reflect on the planned and required expansion of each grid. This is necessary to enable the energy transition, for example, to bring multi-gigawatt offshore wind power potential inland, distribute hydrogen, and transport captured CO2 to sinks or storage sites. As already mentioned in Section 2.1, clusters located more towards the right in the IIQ indicate candidate areas in need of infrastructure strengthening or expansion. With this in mind, two clusters in Figure 7 immediately pop up as there currently is no electrical backbone grid present: Tournai and Mons. Hence, connecting both clusters with other nodes is an outcome of this study. This was discussed in the frame of the TRILATE project, in which Elia, the electrical transmission grid operator in Belgium, participates [7]. Elia plans on constructing two new high-voltage power transmission lines. Ventilus would run from the port of Zeebrugge infrastructure hub to the substations present in the Kortrijk cluster area [37]. The second one, Boucle du Hainaut, would connect the Kortrijk cluster to the Charleroi cluster [38]. With this, the underrepresentation of electrical backbone grids in that region would be resolved, and the electrical high-voltage grid would become more redundant (see Figure 8). These findings are anticipated by the IIQ analysis.
Finally, Figure 9 returns to the IIQ and gives an example from the case study for each area category. The figure merely serves to illustrate the relative position of the nodes to support the interpretation of the work. Quantifiable indicators on both industry and infrastructure presence can be applied if more precise positions in the IIQ are desired. Based on the data gathered in this work, the share of ETS emissions can be used for the industry axis and the locally installed energy capacity for the infrastructure axis. It is noted, however, that the latter requires detailed information on the backbone grids, which is not always publicly available.
Two clusters, Antwerp and Tournai, aim to illustrate the range of existing infrastructure availability in cluster potential areas through their relative position in the IIQ. Antwerp is the largest European chemical complex and after Houston in the USA, the second-largest petrochemical cluster globally [39]. The significance of its industry and the port activities turn Antwerp into a centre of gravity in the energy system, which is reflected in Figure 7. The grid maps also show the contrast with Tournai. Already discussed above and shown in Figure 8, this cluster, composed of cement, ceramics, and food industries, could benefit from electrical grid extensions.
The port of Zeebrugge is an excellent example of an infrastructure corridor. Offshore interconnections, both for electrons and molecules, together with offshore wind power arrive at the area from which it departs to fulfil inland demand. Its local industry is insignificant compared to its critical role as an energy hub.
Lastly, an example of the remote activity category can be found in a noise point in the Walloon area. Figure 4 highlights a solitary glass factory located near the French border, with no industry or connection to the Belgian backbone grids present in its direct neighbourhood. Its remoteness will most likely have an influence on its energy transition. The area along the southern part of the border between Belgium and France can be positioned in the interconnection corridor category due to its general lack of industrial facilities, despite numerous electron and molecule grid interconnections.

4.1. Industry Composition

The way information on energy-intensive industry is collected and processed in Section 2.2.1 allows for the post-processing of the DBSCAN cluster results in terms of industry composition. Agreeing with Sechi et al., this extra dimension is of added value in the ESM and provides the opportunity to disaggregate local industrial demand and supply more realistically [22]. This section briefly discusses the clustering tendency of the industrial facilities present in the Belgian industry database and summarises trends on a sector level.
Table 2 contains all industrial sectors, their total number of facilities, and their share of ETS emissions. The last two columns share the post-processing results by dividing the facilities and their respective emissions into either the clustered or non-clustered category according to the DBSCAN output. The table clearly shows that some sectors are more spatially scattered or concentrated than others. In the Belgian case study, all fertiliser and non-ferrous and refinery plants are fully clustered. Steel, chemicals, ceramics and cement, and lime show a strong cluster tendency as well. The remaining sectors are more spread out, which can be seen by the number of noise point (non-clustered) facilities compared to clustered facilities. This is the case for food and drink, glass, and paper and pulp. According to the IIQ, these noise point facilities are candidates for the remote activity axis. These findings largely confirm the results of Mendez Alva et al. [14].
The detailed knowledge of cluster composition can be leveraged for further energy system integration, in particular by addressing the interactions between different energy carriers through industrial activities. Some industrial sectors already serve as a meeting point for various energy carriers, for example, refineries, and future diversification of energy supply to industry will increase this trend in others as well. The scope of the AIDRES project (cement, chemicals, fertilisers, glass, refinery, steel) gives an impression of targeted sectors that present the largest energy hub opportunities [24]. A high share of clustered facilities is desirable for this selection and is, except for glass, achieved in the case study. Secondly, based on the industry composition of the clusters, certain industrial symbiosis opportunities arise, which support energy and resource efficiency through circularity and optimisation. This work follows the lead from Mendez Alva and paves the way for future cluster transition research in the larger context of the energy system [13].

4.2. Methodology Comparison and Limitations

To validate the proposed node selection resulting from the Belgian case study, it is worthwhile to compare it with existing multi-node energy system models. However, the availability of such models is very limited since most ESM frameworks reduce the problem to a single node. The latest Belgian multi-node ESM resulted from the recently finished EPOC project in which a tri-regional energy system model in the TIMES framework was developed [40]. According to Fodstad’s categorisation, the EPOC model can be seen as an ‘energy system independent division’ because it reflects the three political regions of the country [10]. The node selection presented in this case study can be categorised as ‘energy system dependent division’. Compared to the EPOC model, the ten nodes from the case study increase the resolution in the two regions Flanders and Wallonia. However, the third region corresponding to Brussels, Belgium’s capital city and a separate region of the country, is not reflected by any of the ten nodes. This can be explained by (1) the primary focus on industry as an energy sector in this paper, (2) the region’s lack of an industrial cluster, which can be partly explained by its importance as an urban centre, and (3) its infrastructure passages, which are already reflected by connecting the ten nodes.
The IIQ framework and methodology have a primary focus on energy-intensive industry. Even if this tends to disregard other energy actors, such as residential, commercial, and transportation sectors, the focus on the EII is not considered a limitation. The work serves as a benchmark for multi-node ESM applications, with targeted demand sectors going beyond energy-intensive industry. On the other hand, the reliance on European data sources, in particular EU ETS, is recognised as a limitation of the work but is justified as it serves as a commonly accepted proxy for energy intensity. It is used in many studies as a workaround for the lack of publicly available, detailed indicators on energy consumption in Europe and it aims to inspire other regions to duplicate or extrapolate the efforts of IC integration in ESMs.

5. Conclusions

Despite the challenges, the energy transition also provides an opportunity to revise and optimise energy supply and demand, in particular in and between industrial clusters. This paper advances the search for implementation pathways towards climate and resource neutrality in energy and process sectors by introducing the industrial cluster concept and integrating it into the field of energy system modelling. The Industry–Infrastructure Quadrant framework presents five area categories that illustrate the relationship between infrastructure and industry presence. A complementary methodology for multi-node selection reflecting ICs is illustrated in a case study that successfully identified ten nodes to represent Belgian backbone grids and industry. From the proposed node selection, practical recommendations could be made regarding desired grid extensions to improve infrastructure availability to clusters. In addition, detailed information on cluster composition for each of the nodes offers untapped potential for cluster transition research.
The node selection resulting from the IIQ-based methodology has the potential to successfully improve industry representation in energy system models through the increased spatial resolution and cluster composition details.

Future Work

To conclude, the authors of this paper have identified some relevant research topics resulting from the current study.
  • Translate the Belgian case study into a suitable energy system model framework to verify the effectivity of the final node selection in Section 3. Potential focal points of research that could benefit from this IC-based spatial resolution are upcoming hydrogen and CO2 infrastructure developments. Industrial cluster composition knowledge can be used to disaggregate industrial demand and supply data over the nodes.
  • Perform additional case studies to validate the IIQ framework and verify whether the results hold if applied to other, less dense, EU countries with varying industry and infrastructure landscapes.
  • Analyse the impact of (a lack of) infrastructure on the industry in the midst of the energy transition. Use the IIQ concept to reflect on the availability of infrastructure to industry (clusters).
  • Extend the infrastructure scope beyond transmission grids to deepen the knowledge of the role of distribution grids in industrial clusters.
  • Suggest synergies enabled by the energy transition of industrial clusters and evaluate their impact and feasibility. The Funnel tool, currently in development by the authors, combines industry-specific roadmaps together with IS databases to identify such opportunities in a wide range of future cluster layouts. A survey on legal, economic, spatial, technical, and social (LESTS) constraints is included in the tool and indicates industrial symbiosis hurdles and enablers [13]. The aim is to facilitate IS implementation and support ICs in their transition.

Supplementary Materials

The following supporting information (industry database case study Belgium) can be downloaded at https://zenodo.org/records/10654578 (accessed on 19 March 2024).

Author Contributions

N.D., conceptualisation, methodology, writing—original draft preparation, data collection and curation, and visualisation; F.M.A., writing—review and editing; G.V.E., supervision, writing—review and editing, and funding acquisition. All authors have read and agreed to the published version of the manuscript.

Funding

This paper builds on the work conducted and results obtained in the energy transition funds project ‘Trilate’ organised by the FPS economy, S.M.E.s, Self-employed and Energy, Belgium. The authors acknowledge the support received by the FPS economy, S.M.E.s, Self-employed and Energy, Belgium, and the Research Foundation—Flanders (FWO), file number K225323N.

Institutional Review Board Statement

Not applicable.

Informed Consent Statement

Not applicable.

Data Availability Statement

The data generated are available in the Supplementary Materials.

Acknowledgments

The authors would like to express their gratitude to the TRILATE project consortium partners for the collaborative and constructive atmosphere and inspiring interactions that supported this research.

Conflicts of Interest

The authors declare no conflicts of interest.

Nomenclature

EpsilonDistance in km between two neighbouring industries
MinPointsMinimal number of neighbouring industries for them to be considered a cluster

References

  1. Directorate-General for Research and Innovation (European Commission). Scaling up Innovative Technologies for Climate Neutrality: Mapping of EU Demonstration Projects in Energy Intensive Industries; Publications Office of the European Union: Luxembourg, 2023; Available online: https://data.europa.eu/doi/10.2777/926968 (accessed on 16 January 2024).
  2. Energy—European Commission. 2024. Available online: https://energy.ec.europa.eu/index_en (accessed on 16 January 2024).
  3. INEOS. INEOS Sustainability Report 2022. 2023. Available online: https://www.ineos.com/globalassets/sustainability/sustainability-reports/ineos_sustainabilityreport_2022.pdf (accessed on 16 January 2024).
  4. European Commission. Directorate General for Internal Market, Industry, Entrepreneurship and SMEs. Masterplan for a Competitive Transformation of EU Energy-Intensive Industries Enabling a Climate-Neutral, Circular Economy by 2050; Publications Office: Luxembourg, 2019; Available online: https://data.europa.eu/doi/10.2873/854920 (accessed on 11 January 2024).
  5. European Commission. Directorate General for Research and Innovation. ERA Industrial Technology Roadmap for Low-Carbon Technologies in Energy-Intensive Industries; Publications Office: Luxembourg, 2022; Available online: https://data.europa.eu/doi/10.2777/92567 (accessed on 16 January 2024).
  6. EU ITRE Committee. Energy-Intensive Industries, Challenges and Opportunities in Energy Transition. Available online: https://cedelft.eu/publications/energy-intensive-industries-challenges-and-opportunities-in-the-energy-transition/ (accessed on 16 January 2024).
  7. TRILateral Research for Optimal Investments in Adequate Cross-Border Infrastructure (TRILATE). Universiteit Gent. Available online: https://www.ugent.be/ea/emsme/en/research/eelab/ecm/trilate (accessed on 13 February 2024).
  8. Ringkjøb, H.K.; Haugan, P.M.; Solbrekke, I.M. A review of modelling tools for energy and electricity systems with large shares of variable renewables. Renew. Sustain. Energy Rev. 2018, 96, 440–459. [Google Scholar] [CrossRef]
  9. Openmod—Open Energy Modelling Initiative. Available online: https://openmod-initiative.org/ (accessed on 16 January 2024).
  10. Fodstad, M.; Crespo Del Granado, P.; Hellemo, L.; Knudsen, B.R.; Pisciella, P.; Silvast, A.; Bordin, C.; Schmidt, S.; Straus, J. Next frontiers in energy system modelling: A review on challenges and the state of the art. Renew. Sustain. Energy Rev. 2022, 160, 112246. [Google Scholar] [CrossRef]
  11. WEF, Accenture, EPRI. Transitioning Industrial Clusters towards Net Zero. 2023. Available online: https://www.weforum.org/publications/transitioning-industrial-clusters-towards-net-zero/ (accessed on 16 January 2024).
  12. Industrial Clusters: Working Together to Achieve Net Zero. Available online: https://www.accenture.com/content/dam/accenture/final/accenture-com/document/Accenture-WEF-Industrial-Clusters-Report.pdf (accessed on 16 January 2024).
  13. Mendez Alva, F. Industrial Symbiosis Enabling Resource Circularity and Climate Neutrality in the Process Industry. Ph.D. Thesis, Faculty of Engineering and Architecture, Ghent University, Ghent, Belgium, 2022. [Google Scholar]
  14. Mendez Alva, F.; De Boever, R.; Van Eetvelde, G. Hubs for Circularity: Geo-Based Industrial Clustering towards Urban Symbiosis in Europe. Sustainability 2021, 13, 13906. [Google Scholar] [CrossRef]
  15. Prina, M.G.; Manzolini, G.; Moser, D.; Nastasi, B.; Sparber, W. Classification and challenges of bottom-up energy system models—A review. Renew. Sustain. Energy Rev. 2020, 129, 109917. [Google Scholar] [CrossRef]
  16. Lopion, P.; Markewitz, P.; Robinius, M.; Stolten, D. A review of current challenges and trends in energy systems modeling. Renew. Sustain. Energy Rev. 2018, 96, 156–166. [Google Scholar] [CrossRef]
  17. Kriechbaum, L.; Scheiber, G.; Kienberger, T. Grid-based multi-energy systems—Modelling, assessment, open source modelling frameworks and challenges. Energy Sustain. Soc. 2018, 8, 35. [Google Scholar] [CrossRef]
  18. Martínez-Gordón, R.; Morales-España, G.; Sijm, J.; Faaij, A.P.C. A review of the role of spatial resolution in energy systems modelling: Lessons learned and applicability to the North Sea region. Renew. Sustain. Energy Rev. 2021, 141, 110857. [Google Scholar] [CrossRef]
  19. Cervo, H. Development of a Methodology Enabling the Identification of Industrial Symbiosis Opportunities and Their Assessment in the Petrochemical Industry. Ph.D. Thesis, Faculty of Engineering and Architecture, Ghent University, Ghent, Belgium, 2020. [Google Scholar]
  20. Colbertaldo, P.; Parolin, F.; Campanari, S. A comprehensive multi-node multi-vector multi-sector modelling framework to investigate integrated energy systems and assess decarbonisation needs. Energy Convers. Manag. 2023, 291, 117168. [Google Scholar] [CrossRef]
  21. Frysztacki, M.M.; Hagenmeyer, V.; Brown, T. Inverse methods: How feasible are spatially low-resolved capacity expansion modelling results when disaggregated at high spatial resolution? Energy 2023, 281, 128133. [Google Scholar] [CrossRef]
  22. Sechi, S.; Giarola, S.; Leone, P. Taxonomy for Industrial Cluster Decarbonization: An Analysis for the Italian Hard-to-Abate Industry. Energies 2022, 15, 8586. [Google Scholar] [CrossRef]
  23. Calvillo, C.; Race, J.; Chang, E.; Turner, K.; Katris, A. Characterisation of UK Industrial Clusters and Techno-Economic Cost Assessment for Carbon Dioxide Transport and Storage Implementation. Int. J. Greenh. Gas Control 2022, 119, 103695. [Google Scholar] [CrossRef]
  24. Catholic University Leuven; DECHEMA; Directorate-General for Energy (European Commission); EnergyVille; Ghent University; IPESE EPFL; Vito; Vrije Universiteit Brussel; Girardin, L.; Valee, J.; et al. AIDRES, “Advancing Industrial Decarbonization by Assessing the Future Use of Renewable Energies in Industrial Processes”: Assessment and Geo Mapping of Renewable Energy Demand for Technological Paths towards Carbon Neutrality of EU Energy Intensive Industries: Methodology and Results in Support to the EU Industrial Plants Database; Publications Office of the European Union: Luxembourg, 2023; Available online: https://data.europa.eu/doi/10.2833/696697 (accessed on 11 January 2024).
  25. Industrial Reporting under the Industrial Emissions Directive 2010/75/EU and European Pollutant Release and Transfer Register Regulation (EC) No 166/2006. Available online: https://www.eea.europa.eu/en/datahub/datahubitem-view/9405f714-8015-4b5b-a63c-280b82861b3d (accessed on 11 January 2024).
  26. Elia Group. Powering Industry towards Net Zero. 2022. Available online: https://issuu.com/eliagroup/docs/powering_industry_towards_net_zero?fr=sNThlMjU0MTU1OTg (accessed on 11 January 2024).
  27. Union Registry—European Commission. Available online: https://climate.ec.europa.eu/eu-action/eu-emissions-trading-system-eu-ets/union-registry_en (accessed on 11 January 2024).
  28. The Database “Advancing Industrial Decarbonisation by Assessing the Future Use of Renewable Energies in Industrial Processes” (AIDRES)—European Commission. Available online: https://energy.ec.europa.eu/publications/database-advancing-industrial-decarbonisation-assessing-future-use-renewable-energies-industrial_en (accessed on 11 January 2024).
  29. sklearn.cluster.DBSCAN. Scikit-Learn. Available online: https://scikit-learn/stable/modules/generated/sklearn.cluster.DBSCAN.html (accessed on 17 January 2024).
  30. Pareto Principle. In: Wikipedia. 2023. Available online: https://en.wikipedia.org/w/index.php?title=Pareto_principle&oldid=1191440343 (accessed on 17 January 2024).
  31. Grid Map. Available online: https://www.entsoe.eu/data/map/ (accessed on 11 January 2024).
  32. scipy.spatial.voronoi_plot_2d—SciPy v1.11.4 Manual. Available online: https://docs.scipy.org/doc/scipy/reference/generated/scipy.spatial.voronoi_plot_2d.html#scipy.spatial.voronoi_plot_2d (accessed on 17 January 2024).
  33. Maps|ENTSOG. Available online: https://www.entsog.eu/maps (accessed on 11 January 2024).
  34. FPS Economy, S.M.E.s, Self-employed and Energy. Belgium’s Economy in a Nutshell—Economic Outlook of August 2022; Séverine Waterbley: Brussels, Belgium, 2022; Available online: https://economie.fgov.be/en/publication/belgiums-economy-nutshell-8#:~:text=The%20estimated%20inflation%20increase%20in%202022%20is%208.1%25.,will%20slow%20down%20to%20about%202.6%25%20in%202022 (accessed on 22 January 2024).
  35. OpenStreetMap. Available online: https://www.openstreetmap.org/ (accessed on 23 January 2024).
  36. FOD Economie, K.O.; Middenstand en Energie. Belgian Energy Data Overview—Editie Januari 2024; Séverine Waterbley: Brussels, Belgium, 2024; Available online: https://economie.fgov.be/en/publication/belgian-energy-data-overview (accessed on 16 February 2024).
  37. Ventilus. Available online: https://www.elia.be/nl/infrastructuur-en-projecten/infrastructuurprojecten/ventilus (accessed on 25 January 2024).
  38. Boucle du Hainaut. Available online: https://www.elia.be/fr/infrastructure-et-projets/projets-infrastructure/boucle-du-hainaut (accessed on 25 January 2024).
  39. Vanthillo, T.; Cant, J.; Vanelslander, T.; Verhetsel, A. Understanding evolution in the Antwerp chemical cluster: The role of regional development strategies. Eur. Plan. Stud. 2018, 26, 1519–1536. [Google Scholar] [CrossRef]
  40. Moglianesi, A.; Das, P.; Nijs, W.; Vingerhoets, P.; Coppens, L.; Lempereur, A.; Capart, R.; Marenne, Y. Low Carbon Scenarios for Belgium: Insights from a Tri-Regional Energy System Model. Available online: https://www.epocbelgium.be/sites/epoc/files/2.2.1%20Moglianesi%20A.%20Das%20P.%20Coppens%20L.%20et%20al%20TIMES%20final%20report.pdf (accessed on 6 March 2024).
Figure 1. The Industry–Infrastructure Quadrant and its area categories: (A) out of scope; (B) interconnection corridor; (C) cluster potential; (D) remote activities; (E) infrastructure corridor.
Sustainability 16 02585 g001
Figure 2. Flowchart describing the node selection methodology for the ESM based on the data gathered and processed in the context of the IIQ. The grey boxes indicate the applied criteria for node selection.
Sustainability 16 02585 g002
Figure 3. (a) Total number of ICs retrieved by the DBSCAN cluster algorithm and (b) respective coverage of ETS emissions by the clustered facilities for Epsilon 1–15 km and MinPoints 3–10.
Sustainability 16 02585 g003
Figure 4. Map of the Belgian industry database after processing by the DBSCAN cluster algorithm (Epsilon 10 km; MinPoints 5). Coloured dots correspond to clustered facilities, facilities with the same colour belong to the same cluster. Black dots correspond to noise points or non-clustered industries. The black lines indicate the borders of the arrondissements (NUTS3 regions). The red circle points out a remote industry candidate.
Sustainability 16 02585 g004
Figure 5. (a) Voronoi diagram of the 220 and 380 kV substations in Belgium. Grey: regular substation; green: AC-DC converter station; yellow: interconnection; (b) (abstracted) map of the electrical backbone grid in Belgium. Each polygon corresponds to an interconnection.
Sustainability 16 02585 g005
Figure 6. (Abstracted) map of the molecule’s backbone grid in Belgium. The pipelines correspond to <24” (thin), 24–36” (medium), and >36” (thick) diameters. Each polygon corresponds to an interconnection.
Sustainability 16 02585 g006
Figure 7. IC-based node selection for the ESM after application of the IIQ framework. Yellow dots correspond to ICs required to reach the Pareto front, light green indicates relevant ICs in terms of infrastructure and/or ETS emissions, and grey dots refer to less significant clusters. Dashed lines group ICs for merging into one larger node. Dark green dots correspond to important infrastructure hubs not yet covered by ICs. (a) Projected results on the electrical backbone grid and (b) on the molecule backbone grid map.
Sustainability 16 02585 g007
Figure 8. Revision of Figure 7a with the two planned high-voltage power lines indicated by dashed lines.
Sustainability 16 02585 g008
Figure 9. Visualisation of case study results according to the IIQ. Area categories: (A) out of scope; (B) interconnection corridor; (C) cluster potential; (D) remote activities; (E) infrastructure corridor.
Sustainability 16 02585 g009
Table 1. Summary of the ICs resulting from the DBSCAN cluster algorithm, corresponding to Figure 4. The ICs are sorted from largest to smallest share of ETS emissions.
ColourCluster Name 1Share of ETS Emissions (%)Add to ESM Node Selection?Number
Antwerp45.7 *Yes, the Pareto limit has not yet been reached1
Ghent15.1 *2
Tournai6.5 *3
Mons5.6 *4
Maastricht4.3 *5
Charleroi2.9 *6
Albert Canal2.7Yes, electron and molecule interconnection7
Liège2.7Merge with 5; good proximity and connectivityMerge with 5
Namur1.9Yes, electron and molecule interconnection8
Kortrijk1.1Yes, electron and molecule interconnection9
Mol0.8Merge with 7; no significant added valueMerge with 7
Genk0.7Merge with 5; no significant added valueMerge with 5
Beerse0.5Merge with 7; no significant added valueMerge with 7
1 Named after a local city or canal. * Pareto limit reached (80.1%).
Table 2. Table describing the sector composition of the industrial clusters resulting from the DBSCAN cluster algorithm.
Industrial SectorTotal Number of Facilities
Total Share ETS Emissions
ClusteredNon-Clustered
Cement and lime12
18.7%
11
17.3%
1
1.3%
Ceramics23
1.7%
15
1.1%
8
0.6%
Chemicals67
31.5%
57
29.8%
10
1.7%
Fertilisers1
2.3%
1
2.3%
0
0%
Food and drink38
4.8%
21
2.2%
17
2.6%
Glass8
2.2%
4
0.6%
4
1.7%
Non-ferrous6
1.4%
6
1.4%
0
0%
Paper and pulp11
2.3%
6
1.2%
5
1.1%
Refineries4
19.4%
4
19.4%
0
0%
Steel (incl. processing)16
15.7%
13
15.1%
3
0.6%
Total186
100%
138
90.4%
48
9.6%
Disclaimer/Publisher’s Note: The statements, opinions and data contained in all publications are solely those of the individual author(s) and contributor(s) and not of MDPI and/or the editor(s). MDPI and/or the editor(s) disclaim responsibility for any injury to people or property resulting from any ideas, methods, instructions or products referred to in the content.

