
Research on Image Perception of Tourist Destinations Based on the BERT-BiLSTM-CNN-Attention Model

1
School of Business Administration, Liaoning Technical University, Huludao 125105, China
2
Ordos Institute of Liaoning Technical University, Ordos 017000, China
*
Author to whom correspondence should be addressed.
Sustainability 2024, 16(8), 3464; https://doi.org/10.3390/su16083464
Submission received: 23 February 2024
/
Revised: 11 April 2024
/
Accepted: 18 April 2024
/
Published: 21 April 2024
(This article belongs to the Section Tourism, Culture, and Heritage)
Abstract
:Image perception of tourism destinations plays an important role in destination marketing and management. Considering that long-distance feature information of travel review text is difficult to capture and local key information is ignored, BiLSTM and CNN are improved to propose a travel text classification method based on BERT-BiLSTM-CNN-Attention hybrid neural network model. Taking Sanya City as the research object, we adopt the emotion classification and content analysis methods and construct the tourism destination image perception analysis framework based on the “cognitive-emotional” three-dimensional model, providing a research perspective for the sustainable development of tourism in Sanya City. The results show that the accuracy of the proposed model reaches 93.18%, which is better than other models. Tourists’ perception of destination image includes four aspects: tourism resources, tourism environment perception, tourism infrastructure and supporting services, as well as tourism activities. Positive emotions dominate emotional image, and negative emotions are mainly focused on tourism infrastructure and supporting services. On the overall image perception, tourists have a high evaluation of the tourism image of Sanya City. This research has some implications for tourism destinations, such as improving their management programs, enhancing their marketing strategies, and achieving long-term sustainable development of their destinations.
1. Introduction
Sanya is one of China’s four first-line tourist cities, and it is China’s only international tropical coastal tourist resort, with the “Oriental Hawaii” reputation. Analyzing tourists’ perception of Sanya’s tourism image through tourist-generated information provides a certain reference for the long-term development of Sanya tourism. Tourism destination image is the overall perception of tourists to the tourism destination, is the tourists’ views, impressions, and emotional expression of the tourism destination, which has a very important significance and value for the promotion and marketing of the tourism destination [1]. It includes three aspects: cognitive image, emotional image, and overall image [2]. Cognitive image refers to the tourist’s perception and impression of the natural, social, cultural, and other characteristics of the tourist destination, which is the objective cognition formed by the tourist through various sources of information and personal experience. Emotional image refers to the emotional response and attitude of tourists to the cognitive image of the tourism destination, which is tourists’ subjective feeling and evaluation. Overall image refers to the comprehensive reflection of the cognitive image and emotional image of the tourist destination, which is the overall impression and tendency of the tourist destination. Understanding destination images is pivotal for influencing potential tourists’ decisions and providing valuable insights to tourism product and service providers. By grasping tourists’ preferences and needs, destinations can develop effective marketing strategies to enhance their competitiveness in the global tourism market. This broader perspective transcends specific locales like Sanya, reflecting the universal significance of destination image management in international tourism.
Understanding the methodologies used to analyze visitor perceptions becomes imperative in this context. The authenticity and accessibility of tourists’ user-generated content (UGC) make it directly affect the shaping of the image of tourist destinations and tourists’ decision-making behaviors, and it also becomes an important source of data for the research on the image of tourist destinations, which can help researchers to more accurately understand tourists’ needs and perceptions of the destinations and to obtain the cognitive, emotional, and overall image of the destinations by tourists. Image is the vitality of a tourist destination, which directly affects tourists’ decision-making behavior and satisfaction. Only by paying attention to the image perception of tourists can tourist attractions continuously improve their satisfaction and thus obtain sustainable development. The collection and mining of big data have greatly promoted the development of tourist destinations, and social media mining and sentiment analysis have better understood the needs of tourists, providing a reference for image shaping, product design, and marketing promotion of scenic spots.
However, previous research on the analysis of emotional images in the image perception of tourism destinations has primarily adopted the content analysis software analysis method (ROST CM6) [3], the emotion dictionary analysis method [4], and the machine learning analysis method [5]. While these methods have their merits, they lacked the mining of the emotional information of tourism destinations for the online text, as well as the adjustment and optimization of the image of tourism destinations based on the results. The processing of text semantics using the content analysis software ROST is relatively simple and does not adequately reflect the useful information of tourist comments. The use of the sentiment dictionary analysis method has the problem that some of the vocabulary expressions of tourist destinations cannot be reflected. In contrast, the machine learning analysis method can more accurately identify the important information in a large amount of tourist review texts. Deep learning, as a branch in the field of machine learning, is capable of acquiring high-level features from data, digging deeper into the perceived elements of a destination’s image, and focusing on the deeper information behind the emotional changes of travelers when experiencing a destination. Currently, scholars have paid attention to the application of deep learning models such as LSTM [6], Bert [7], and CNN [8] on image perception of tourist destinations and confirmed the advantages of deep learning models in processing tourist review texts. Tourism review texts may contain content unrelated to the destination image, which may affect our understanding of the destination image, which will be a difficulty and a challenge when we study the destination image. When the tourism network text is long, the long-distance information will be weakened, and the already existing research did not consider the tourism review text has the problems of long-distance feature information is difficult to capture, ignoring the local key information, and ignoring the strength of the sentiment feature words, which results in the low accuracy of the sentiment classification.
In order to more accurately analyze the sentiment tendency of tourism review texts, this paper improves CNN and BiLSTM and introduces the attention mechanism to deeply mine the key information that tourists’ image perception focuses on. A combined BERT-BiLSTM-CNN-Attention deep learning sentiment classification model is proposed for tourist destination review data sentiment classification. The model uses Bert to transform text into word vectors and perform preliminary feature processing. The deep text feature extraction classification module utilizes the BiLSTM-CNN network to extract contextual deep features and local key information. Then, each word is weighted and summed by the attention mechanism to get the final feature vector of the text, and finally, the classification result is obtained by Softmax. Based on the UGC data, this paper conducts systematic research on the image perception of the Sanya tourist destination using the BERT-BiLSTM-CNN-Attention deep learning algorithm and content analysis method from the three aspects of knowledge image, emotion image, and overall image, respectively, so as to provide a reference for the management and marketing of Sanya city and other tourist cities.
The significant contributions of this work are as follow:
- We develop a sophisticated deep learning model that combines BERT-BiLSTM-CNN-Attention for sentiment classification, allowing for bidirectional text learning and capturing high-level semantic and contextual features. Our approach leverages BERT embeddings for pre-processing and incorporates a self-attention layer to highlight impactful words;
- The deep learning method constructed in this paper can be used as an interface between big data analytics and tourism management theory to provide a systematic theoretical framework for tourism destination research;
- Textual content analysis can help researchers understand the potential causes of tourists’ negative emotions and provide a strong guide to improve the tourism experience and enhance the attractiveness of destinations, thereby promoting sustainable tourism development;
- Our hypothetical model demonstrates significantly better performance than the baselines in experimental evaluation.
The rest of the paper is structured as follows: Section 2 reviews related work. Section 3 proposes a sentiment classification method based on BERT-BiLSTM-CNN-Attention hybrid neural network model. Section 4 applies our methodology to sentiment analysis for Sanya. In Section 5, we discuss the results. Section 6 concludes the paper.
2. Literature Review
2.1. Tourism Destination Image Perception
Destination image is one of the hottest topics in tourism research, with Hunt pioneering the basic concept of the perceived image of a destination in 1975, being the first to demonstrate its importance for increasing the number of tourists to a destination [9]. Three theoretical models with a certain progression have been developed: the “attribute-whole” model (1991), the “cognitive-emotional-intentional” model (1994), and the “cognitive-emotional-whole” model (1999).
Echtner et al. [10] proposed the “attribute-whole” model, suggesting that the destination image consists of attribute- and ensemble-based parts. The former refers to perceptions of destination characteristics, and the latter refers to mental intentions towards the destination. The model does not address the emphasis on the affective component. Gartner [11] proposed the “cognitive-emotional-intentional” model, compared with the “attribute-whole” model; the model incorporates emotional evaluation, believing that the destination image is composed of cognition, emotion, and intentionality and that the three interact with each other, constrain each other and coordinate each other. As the research progressed, Baloglu et al. followed up by proposing for the first time a “cognitive-emotional” three-dimensional model of destination image [2]. The model suggests that the perceived image of a destination is composed of a three-dimensional structure of cognitive, affective, and holistic images. While cognitive image focuses on functional information and affective image emphasizes emotional connection, overall image integrates both cognitive and affective dimensions [12] and is a holistic perception of the destination [13]. Tourists’ perception of destination image has a crucial impact on tourism [14], and the favorable perception of destination image affects tourists’ willingness to visit tourist attractions [15]. Ageeva et al. [14] found that good destination image increases tourist inflow from both supply side and demand side perspectives. The “cognitive-emotional” three-dimensional model provides a more systematic framework for understanding destination image, which helps to deepen the understanding of destination image perception and provides more accurate image-building strategies for tourism operators. Some scholars [16,17,18] have also verified the reasonableness and applicability of this model. In view of this, this paper is based on the “cognitive-emotional” three-dimensional model used to study destination image perception.
2.2. Research Methodology of Tourism Destination Image
Tourism destination image research methods are generally categorized into qualitative and quantitative studies [19]. Qualitative research methods are based on the collection of tourists’ evaluations and perceptions of tourist destinations as research data, and most of them use grounded theory or in-depth interviews, etc. Kim [20] obtained a model of local food consumption in tourist destinations from a qualitative study of 20 respondents through grounded theory. Lee used a questionnaire survey to analyze tourists in five destinations in Shanghai to conduct a study on tourist satisfaction from the perspective of sustainable tourism [21]. With the development of the Internet, some scholars combine grounded theory and content analysis methods to carry out research. Li Ting et al. used content analysis and grounded theory methods to study the destination image of the Wutai Mountain scenic area through online comments to explore the post-trip image perception of tourist destinations and its mechanism [17]. However, the development of the big data era has prompted more and more scholars to prefer quantitative analyses of such problems [22].
Among the quantitative research methods, most of them adopt the structural equation model [23], meta-analysis [24], IPA analysis [25], and content analysis [26] to explore the issue of tourism destination image. Lam et al. collected 342 surveys of travelers in Kuala Lumpur, Malaysia, used the structural equation model analysis method to obtain the important determinants of the platform co-creation experience, and proposed ways to enhance the image of the tourism destination [27]. Afshardoost et al. used meta-analysis to explore the relationship between destination image and tourist behavioral imagery [28]. Boley et al. adopted IPA analysis to explore residents’ perceptions of sustainable tourism [29]. Garay adopted content analysis to explore the nature of cognitive and affective attributes in tourism destination image [30]. The above methods obtain a quantitative evaluation by selecting evaluation attributes and obtaining quantitative data on the image of the tourist site through mathematical statistics, which has the advantages of being controllable, intuitive, and convenient for statistics and comparisons [31]. Maldonado-López et al. used a combination of qualitative and quantitative methods to analyze the perception of the image of cross-border sustainable tourism destinations in peripheral areas and obtained the key elements that contribute to their development [32]. In addition, factor analysis [33], image recognition methods [34], user-generated content (UGC) based mining, and geographic information mining frameworks [35] have also been widely used in tourism destination image mining and analysis research. The digital economy generates massive amounts of authenticity data from tourists that can naturally capture and portray users’ emotions and opinions. In view of this, this paper uses UGC data to mine and analyze the image of tourist destinations.
2.3. Research on Text Sentiment Analysis Techniques
In the context of the big data era, the large number of comments posted by tourists on the Internet platform provides a huge amount of raw, fragmented information for research, and with the help of online text analysis technology, it can effectively bring into play the advantages of qualitative research in the observation of information and in-depth analysis, and at the same time, it can also highlight the advantages of quantitative methods of processing text data such as machine learning and deep learning algorithms [36]. Three main methods currently commonly used for text sentiment analysis are Sentiment Dictionary, Machine Learning, and Deep Learning.
Sentiment lexicon-based text analysis uses a pre-constructed sentiment lexicon to determine a text’s sentiment tendency and intensity [37]. The adoption of the sentiment lexicon approach can accurately capture the unstructured features of the text [38], which is easy to analyze and understand, but there are still some shortcomings in this approach. Machine learning is more accurate for sentiment analysis compared to sentiment lexicon-based analytics, reflecting greater scalability and reusability. The core idea of machine learning is to train a model with given data and make predictions of outcomes from that model. Common machine learning algorithms include Support Vector Machines (SVM) [39], Naive Bayes (NB) [40], and Random Forests (RF) [41], etc. The classification effect of the method, however, depends on the quality of the dataset, while building large-scale, high-quality datasets requires high labor costs, whereas deep learning algorithms do not require human intervention.
Deep learning algorithms have been widely used in the field of text analysis in recent years, and learning through multi-level neural networks has overcome the limitations of machine learning to a certain extent [42]. Commonly used deep learning models include Recurrent Neural Networks (RNN), Convolutional Neural Networks (CNN), Long Short-Term Memory Networks (LSTM), Transformers, and Attention mechanisms. Rani et al. [43] used a CNN model for sentiment analysis of movie reviews, which outperformed traditional learning methods and achieved 95% accuracy. Arshed et al. [44] proposed a deep learning-based LSTM model for sentiment classification of text related to COVID-19 with a model accuracy of 71.1%. Rehman et al. [45] proposed a hybrid LSTM and CNN model for improving the accuracy of sentiment analysis of movie reviews, and the results show that the proposed hybrid CNN-LSTM model outperforms traditional deep learning and machine learning techniques for sentiment classification. Google Inc. proposed the BERT [46] pre-training model in October 2018, which is a major breakthrough in the field of NLP. Duan et al. [47] used Bert instead of Word2vec extracted word vector as the model input, improving text classification’s effect. Cao et al. used the Bert model to analyze the sentiment of online reviews of nine attractions in Melaka, and the results showed that the BERT-based deep learning approach can obtain improved sentiment predictive performance [7]. Deep learning-based models have significant advantages over the first two approaches in that they can process complex, large-scale information more efficiently. However, many of these models are poorly interpretable. A better understanding of the theoretical aspects of these models will help develop better models for various text analysis scenarios, which is a major direction for future research [42].
3. Data and Method
Under the background of the Internet, the OTA platform contains a huge amount of textual comments on the image of tourist destinations. In this study, a text sentiment classification model based on BERT-BiLSTM-CNN-Attention is proposed based on the Ctrip travel OTA platform review data, as shown in Figure 1. The analytical process is divided into five steps: (1) data collection, (2) data pre-processing, (3) building the BERT-BiLSTM-CNN-Attention model, (4) comparative result analysis in different models, and (5) sentiment analysis based on this model.
3.1. Data Collection and Pre-Processing
Sanya City has abundant tourism data and information resources, and researchers can relatively easily access relevant data for in-depth study. This data availability and research feasibility help ensure the study’s reliability and practicality and improve the results’ applicability. In the context of considering sustainable development, Sanya City, as a typical representative of China’s tropical tourism development, is characterized by geographical, climatic, and tourism resource characteristics that are somewhat universal. Therefore, through the study of tourism in Sanya City, some generally applicable laws and trends can be revealed, which are of great significance in understanding and promoting the sustainable development of global tropical tourism. In order to obtain the image perception of Sanya City tourist destination, this study selects five popular tourist attractions in Sanya City: Lost Space Aquarium at Atlantis Sanya, Cape Haijiao in Sanya, Wuzhizhou Island, West Island, and Sanya Yalong Bay Tropical Paradise Forest Park. This article’s online review text data comes from Ctrip, China’s largest online travel operator. The “Bazhuayu v8.6.7” software is used to crawl the review data of these attractions on https://www.ctrip.com/ (accessed on 1 January 2023) for the year 2023, and each comment includes a user name, review content, score, review time, place, and number of thumbs up. The data were processed by de-duplication, deletion of missing values, deletion of invalid characters, etc., and finally, a total of 13,001 valid comments were obtained (Table 1).
The sentiment polarity of the raw data was initially labeled according to the rating values: comments with a score of 4–5 were initially identified as positive and labeled as “1”; comments with a score of 1–2 were initially identified as negative and labeled as “0”; comments with a score of 3 are initially considered neutral and are not labeled at this time. The experimental data were obtained from online reviews of traveling in Sanya City on the Ctrip website. A portion of it is selected as the experimental dataset, which contains 12,157 comments, of which 6125 are positive and 6032 are negative. The dataset was divided into training and testing sets according to the ratio of 8:2, and part of the travel review data is shown in Table 2. Word segmentation was performed with the Jieba segmentation package in Python, using the HIT stop word list to stop words and filter out stop words such as “we”, “the”, “this,” and punctuation. After the above processing, a higher-quality text corpus is obtained, thus improving the classification effect. The cleaned data and class labels are stored in CSV files for subsequent sentiment classification experiments. Finally, the combined BERT-BiLSTM-CNN-Attention deep learning model proposed in this paper is used for sentiment classification to obtain positive and negative comments.
3.2. BERT-BiLSTM-CNN-Attention Model Design
In existing research, the challenge of capturing long-distance feature information, adequately addressing local key information within tourism review texts, and accurately highlighting the intensity of emotion feature words to capture the core content of tourists’ emotions has often been overlooked. Recognizing these gaps, this study proposes a new fusion deep learning model. The overall architecture of the proposed model is shown in Figure 2.
The model has six layers: input layer, BERT layer, CNN layer, BiLSTM layer, attention mechanism layer, and output layer. Firstly, the input text sequence of travel reviews is encoded using the BERT model to obtain a vector representation of each word while preserving the contextual information of the text. Then, Bert’s output is used as input to CNN, and the text is feature extracted by multiple convolutional kernels of different sizes to obtain local features at different scales. Next, the output of the CNN is used as the input to the BiLSTM, and the sequence modeling of the text is performed by a bidirectional recurrent neural network, which yields a bidirectional semantic representation of each word while capturing the long-distance dependencies of the text. Finally, the output of BiLSTM is used as the input of Attention, and the importance of each word is weighted and fused through the attention mechanism to obtain the final feature vector of the text, which is fed into the fully connected layer and the output layer, and the classification result of the text is obtained through Softmax.
3.2.1. Bert
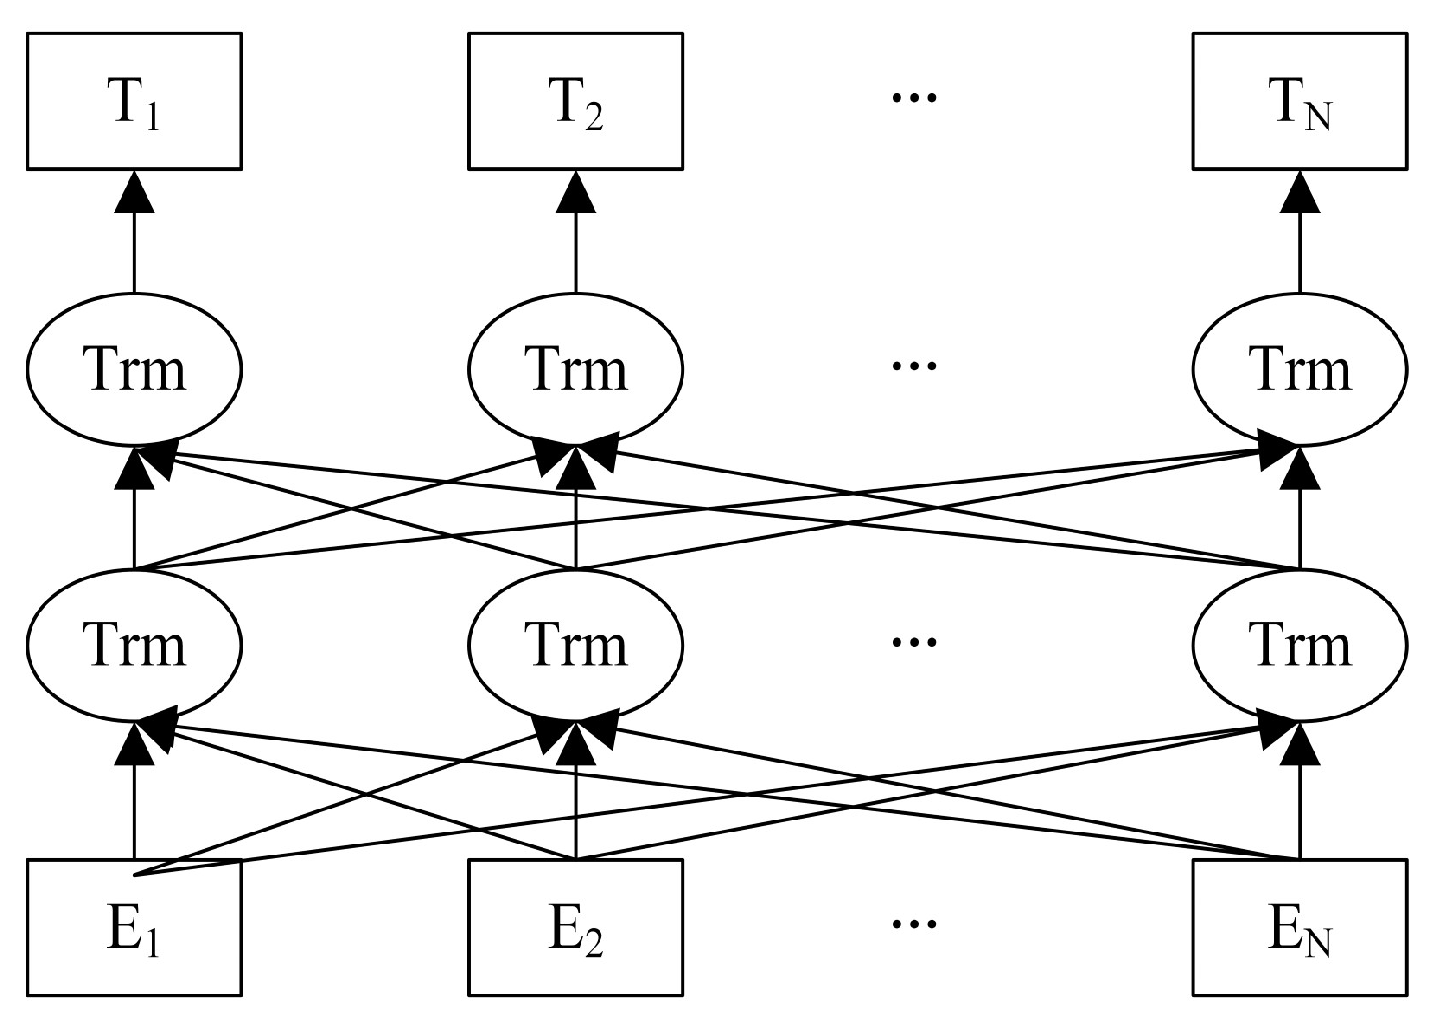
BERT [46] is a pre-trained language representation model for natural language processing. It can calculate the interrelationships between words and extract key features in the text by adjusting the weights. Using the self-attention mechanism for pre-training and building deep bidirectional representations by fusing left and right contexts. Compared to previous pre-trained models, BERT captures real contextual information more effectively and learns associations between successive text segments. The model pre-training structure is shown in Figure 3.
, , …, indicate the word input in the text. After being processed by the bi-directional Transformer encoder, the comment text , , …, are transformed into vector representations, which are mainly implemented by the Transformer encoder. By pre-training on the task, the BERT model measures the training corpus to accurately capture the word-learned features in the vector representation trained by the BERT model. Specifically, denoted as , where denotes the vector matrix of the th sentence, and denotes the vector representation of each word, denotes the maximum sentence length.
3.2.2. BiLSTM
LSTM is consistent with typical RNN frameworks, but it uses a different approach to compute the hidden state, thus solving the problem of gradient vanishing in RNN. The LSTM consists of a series of repeating memory cells, each containing three neural gates with different functions: input gate, forget gate, and output gate. Below is the process by which these gates adaptively remember the input vectors, forget the previous histories, and generate the output vectors.
In the formula, , and denote the input gate, oblivion gate and output gate, , and denote the weight matrices, , and denote bias terms, denotes the hidden state vector at moment .
In order to improve the accuracy of the prediction results, the output at the current moment may need to take into account inputs from several previous states and several future states. Therefore, a bidirectional recurrent neural network (BiLSTM) is proposed. It compensates for the problem of LSTM’s lack of access to future contextual information. With the bi-directional structure of BiLSTM, the model is able to understand and exploit the spatio-temporal information of the sequence data in a more comprehensive way, improving the ability to model complex relationships. The hidden state of BiLSTM at moment contains forward and backward as shown in Equations (7)–(9):
3.2.3. CNN
CNN uses convolutional kernel sliding to collect sentence information to extract features and then completes text classification using the extracted local features, which usually include the input, convolutional, pooling, and full connection layers. CNN networks have a simple structure and can quickly extract local features in text. The convolutional layer aims to extract the data features of the input corpus, which is computed as shown in Equation (10), and finally, the new feature is obtained.
In Equation (10): is the ReLU activation function; is a convolution kernel of size ; is the word vector of the input layer; is the bias term.
The input word vector is feature extracted by setting the convolution kernel, and the sliding filter mapping yields the local feature set , which is calculated as
The pooling layer is applied to the output feature set of the convolution layer to reduce the data dimension while maintaining the statistical properties of text features and increasing the adaptability of the model. The maximum pooling method is used to extract the features, which are calculated as
After the pooling layer, the locally important features of the text are extracted, then all the features obtained from the pooling layer are combined in the fully connected layer to get the output vector as
3.2.4. Attention
In sentiment analysis, due to the different importance of words in the text and the different feature weights, the introduction of the attention mechanism can better learn the inter-word dependencies and enhance the attention to the important words. Therefore, the accuracy of the classification is further improved by assigning different weights to focus on the important parts of the context. The processing of the attentional mechanism is shown in Equations (14)–(16).
Equation (14) is a nonlinear transformation of by means of the tanh activation function, resulting in the attribute representation vector ; is the vector of BiLSTM outputs, ; is the trained parameter vector and is the corresponding bias; Equation (15) uses the softmax function to calculate the weight of each component , the obtained denotes the weight importance; is the transpose matrix; Equation (16) represents the sentence vector of weighted sums of -importance, denoted by .
Finally, the vector representation is obtained after the attention mechanism, which is inputted into the softmax classifier to get the final classification result, thus realizing the task of sentiment classification of comment text.
3.3. Experimental Results and Analysis
Model parameters are configuration variables inside the model; different parameter settings will affect the experimental results. The parameters were tuned for BiLSTM and CNN, and the finalized model parameter settings after debugging are shown in Table 3. The experiments were conducted in Python 3.8 programming environment, and the deep learning framework pytorch was used to construct the model. The experimental parameters were set as shown in Table 3.
Model performance is evaluated using Accuracy, Precision, Recall, and F1 score. The categorization matrix is shown in Table 4.
The specific equations are shown in Equations (17)–(20).
To demonstrate the validity of the Bert-BiLSTM-CNN-Attention model, the proposed model was compared experimentally with CNN, Bi-LSTM, Bert-BiLSTM, Bert-CNN, and Bert-BiLSTM-CNN models on the travel Review dataset, with comparison metrics including accuracy, precision, recall, and F1 score. The experimental results are shown in Table 5 and Figure 4.
As can be seen from the experimental results of each model in Table 5 and Figure 4, the Bert-BiLSTM-CNN-Attention model performs the best among the above sentiment classification models, and the F1 score of the Bert-BiLSTM-CNN-Attention model reaches 0.9318. A comparison of CNN and Bert-CNN models shows that the F1 value for classification is improved by 11.1%. A comparison of BiLSTM and Bert-BiLSTM models shows that the F1 value for classification is improved by 3.82%. It can be seen that the fusion of Bert’s pre-training model can better extract text feature information. Comparing the model proposed in this paper with Bert-BiLSTM, Bert-CNN, and Bert-BiLSTM-CNN models, it can be concluded that the F1 values are improved by 10.39%, 4.79%, and 1.71%, respectively. It can be seen that the model proposed in this paper solves the problems of CNN with long-distance feature information that is difficult to capture, BiLSTM ignoring local key information, and ignoring the intensity of emotional feature words. The model constructed in this paper compensates for the above problems and has higher performance than other models, proving the effectiveness of the model for sentiment classification of travel review texts.
4. Results
4.1. Cognitive Image Analysis
4.1.1. Analysis of High-Frequency Words of Tourism Image
The more times a word appears in the textual content, the more attention the tourists pay to it. In this paper, with the help of the word frequency analysis function in the ROST CM6.0 software, we analyze the word frequency of the collected online text data, extract the feature words with high frequency, and summarize and organize the high-frequency words that are ranked in the top 60 (Table 6).
By analyzing the high-frequency words in Table 6, it can be seen that the first-ranked word is “service”, which indicates that tourists are particularly concerned about the quality of services provided by tourist destinations, which may include hotels, tour guides, transportation, and other services. It shows that providing excellent service quality is an important factor in attracting and satisfying tourists. Secondly, the top words such as “landscape”, “scenery”, “electromobile”, “project”, “experience”, etc., highlight the tourists’ attention to the natural landscape, novelty experience, and various projects in the tourist destinations. This suggests that visitors are more likely to choose places that offer colorful experiences and beautiful views while also being concerned about the projects that are available for play and the transportation modes. Words such as “fun”, “happy”, and “worth” that express satisfaction and recommendation indicate that tourists find the overall experience of the destination enjoyable and recommendable. This has a positive impact on motivating other potential tourists to choose the same destination. Finally, the focus on specific attractions such as “Yalong Bay” and “Cape Haijiao in Sanya” suggest that tourists have a certain level of anticipation and interest in the destination’s well-known attractions, which may be due to their unique appeal in terms of history, culture or nature. In summary, by analyzing the high-frequency words, we can gain insight into tourists’ concerns about service, landscape, experience, and satisfaction, which provides useful guidance for enhancing the tourism experience, accurate promotion, and service improvement.
4.1.2. Analysis of Tourism Image Dimensions
The image dimension of a destination is the main content of image measurement and evaluation. Drawing on the research results of scholar Tan [48], this paper categorizes the first 60 high-frequency words of Sanya City’s tourism cognitive image into four dimensions. Cognitive image elements can be summarized as tourism resources, tourism environment perception, tourism infrastructure and supporting services, as well as tourism activities (Table 7).
Tourism resources accounted for 32.07% of the total, with high-frequency words focusing on the natural and human resources of scenic spots, such as “landscape”, “rainforest”, “island”, “sea water”, “beach” and so on. This reflects tourists’ attention to the natural landscape and characteristic locations of tourist destinations. Perception of the tourism environment accounts for 15.65%, and the high-frequency words mainly cover the words that tourists perceive the tourism environment as a whole, such as “worth”, “happy”, “fun”, “beautiful”, “beauty”, “graceful”, etc. In their comments, these words reflect the degree of pleasure and satisfaction tourists feel towards the overall environment. Tourism infrastructure and supporting services accounted for 29.98% of the total, with high-frequency words mainly focusing on aspects related to tourism infrastructure and services, such as “service”, “electromobile”, “explain”, “personnel”, “time”, “tickets”, “cost-effectiveness”, “tour guide”, etc. This shows that tourists are concerned about the quality of service, transportation, narration services, and time schedules in their reviews. The tourism activity dimension accounts for 22.28% of the total, and the high-frequency words cover words related to tourism activities, such as “project”, “experience”, “performance”, “play”, “photograph”, etc. This indicates that tourists emphasized their participation and activity experience in the comments. In summary, it shows that the natural beauty of scenic spots, overall environmental feeling, service quality, and diversified tourism activities are the main focus of tourists’ attention and evaluation.
4.1.3. Semantic Structural Analysis
High-frequency word analysis can extract the attributes of phrases and thus reveal the main factors that tourists pay attention to, but it cannot reflect the relationship between high-frequency words and the deep connection inherent in the text. Therefore, in order to fully analyze the deeper relevance of the textual content, a co-occurrence matrix is constructed for high-frequency words. The co-occurrence matrix consists of high-frequency phrases and the number of times they co-occur in a logical relationship before and after a comment, which can be used for key information extraction, correlation analysis, and visualization, and then obtain the semantic structure of the review to reveal a deeper cognitive image of the destination, which is adopted in this study by the Gephi semantic network analysis method.
As can be seen from Figure 5, the words “electromobile”, “scenery”, and “roundabouts” indicate that tourists pay special attention to the convenience of transportation while playing, and at the same time, they have high expectations and attach great importance to the natural landscape of the scenic spot and the beautiful environmental feeling. Words such as “service”, “enthusiasm”, “personnel”, and “attitude” indicate that tourists pay special attention to the experience in terms of service. They emphasize the warm attitude of the service staff and have a high opinion of the service quality and professional attitude of the scenic spot staff. It reflects that in addition to focusing on the scenic environment and activities, tourists also pay special attention to the interactive experience with the service staff and expect to feel good service and friendly attitude during their trip. The words “happy”, “performance”, “kid”, and “aquarium” indicate that the wonderful and interesting performance of the aquarium makes the kids very happy, and the tourists focus on the entertainment and family bonding experiences during their visit. “Project” and “experience” suggest that tourists value the full experience of playing the project. It shows that visitors are particularly interested in the evaluation of various activities and projects that can provide rich, unique, and memorable experiences. “Park”, “forest” and “Yalong Bay” illustrate tourists’ focus on natural landscapes and specific locations, and show the pursuit of interacting with nature and enjoying the beauty of the scenery during their travels. “Glass” and “boardwalk” illustrate the interest of tourists in scenic facilities with innovative design and unique experiences, reflecting the success of the attraction in providing unique highlights and creative facilities.
4.2. Emotional Image Analysis
4.2.1. Overall Emotional Image Analysis
Tourism emotion is the intuitive response of tourists to the destination experience and significantly impacts tourists’ loyalty and satisfaction. Positive emotions are conducive to increasing tourist satisfaction and loyalty, and negative emotions will reduce tourist loyalty and satisfaction with the destination. In this paper, the BERT-BiLSTM-CNN-Attention model is used to perform sentiment analysis on 13,001 tourist review texts on Sanya City in order to understand the actual sentiment attitudes and overall impressions of tourists. For high (4 to 5 points) and low (1 to 2 points) comments, the initial labeling was done earlier based on the score, and for 3-point comments, the sentiment polarity is labeled directly based on the model classification results. After the above processing, we finally got 11,993 positive comments and 1008 negative comments in Chinese. According to Table 8, positive emotions accounted for 92.25%, and negative emotions accounted for 7.75%. This shows that tourists’ emotional image of tourism in Sanya City is mainly positive, and the proportion of negative emotions is relatively small. This is consistent with the results of the high-frequency feature word analysis described above (high-frequency feature words are predominantly positive words), and tourists’ overall satisfaction is relatively high.
4.2.2. Negative Affective Factors Analysis
Positive emotions dominate tourists’ perception of Sanya’s tourism image, but 7.75% of tourists still have negative emotions. It is worth noting that negative sentiments are more reflective of the problems that exist in tourist destinations and can be used to guide the management of tourist destinations in improving and developing the problems. Therefore, this section focuses on negative comments. The top 30 high-frequency words in 1008 negative comments were extracted by word frequency analysis (Table 9).
The 30 high-frequency words extracted from the negative comments show that “project”, “queue”, and “tickets” are the main reasons for tourists’ negative emotions. This is partly indicative of the fact that tourists may express dissatisfaction with the program experience provided by scenic spots, possibly because the program content is unattractive, of poor quality, or lacks sufficient innovation and entertainment. Tourists mentioning “queuing” in their comments may mean that they have experienced waiting in a queue in a scenic area, which can lead to inconvenience and wasted time and be the cause of a negative experience. Tourists expressing dissatisfaction with “admission fees” may indicate that they believe that the cost of admission to an attraction is unreasonable in relation to the experience or service provided or that there is a non-transparent fee structure.
Similarly, the 30 high-frequency words were categorized according to the 100 high-frequency words extracted from all the comments above to explore the factors that triggered tourists’ negative emotions, as shown in Table 10. In this paper, tourists’ negative emotion triggers are divided into four categories: tourism resources, tourism environment perception, tourism infrastructure and supporting services, and tourism activities.
4.3. Overall Image Summarization and Conclusion
According to the above word frequency analysis and semantic network analysis, the cognitive image of tourism in Sanya City can be summarized into four aspects: “tourism resources”, ”tourism environment perception”, “tourism infrastructure and supporting services” and “tourism activities”. Meanwhile, as shown by the results of the sentiment analysis study, the vast majority of tourists gave a favorable opinion of Sanya City tourism, and the overall image perception is relatively good; Sanya City is a famous tourist destination known for its magnificent natural landscapes, diversified activities, warm and hospitable services, and world-class vacation facilities. Tourists are able to experience heavenly beauty, colorful tourist activities, and attentive services, and it gives them an unforgettable travel experience.
As can be seen from Table 10, the category of “tourism infrastructure and supporting services” has the highest proportion of negative perception factors, which is 47.03%. This suggests that tourists are focusing more on issues related to tourism infrastructure and services in their comments. Words such as “queue”, “tickets”, and “electromobile” indicate that tourists are concerned about the smoothness of the flow of the tour and the perception of the cost. Words such as “service”, “personnel”, and “cost-effectiveness” indicate that tourists are concerned about the quality of service provided by scenic spots, the performance of staff, and value for money issues in their comments. Words such as “suggestion” and “time” may relate to visitors’ suggestions about the operation and services of the attractions and their views on time management.
The category of “tourism resources” has the second highest percentage of negative perception factors, at 27.33%. This emphasizes the attention that tourists pay to the natural and cultural resources of scenic spots in their comments. The words “scenic area”, and “attractions” express the dissatisfaction of tourists with elements such as landscape, scenery, or beaches in the scenic area. The words “stone” and “beach” indicate that tourists have some negative opinions about the ground conditions of the scenic spots or some facilities in the scenic spots and the environmental conditions of the beaches.
The category of “tourism activities” accounted for the third largest share of negative perceptions, at “17.44%”. Words such as “tourist” and “child” reflect family tourists’ perception that scenic spots fall short in providing child-friendly activities and that more family-friendly tourism programs are needed. “Diving” indicates some problems with visitors’ experience of water activities, which may be related to the maintenance of facilities, the quality of service, or the attractiveness of the diving program.
The lowest percentage of negative perceptions is in the category of “tourism environment perception”, which is “8.20%”. The words “not worth” and “experience” express tourists’ dissatisfaction with the overall tourism experience, which may be related to the service experience, ticket price, scenic environment, and project experience.
5. Discussion
UGC data is a valuable asset for tourism destination management and marketing organizations. These data can reflect the image of the destination more objectively, including the characteristics of tourist attractions, existing problems, and tourists’ feedback and suggestions. It provides an important basis for the adjustment and optimization of tourist destinations, which in turn promotes sustainable development. By extracting and analyzing the data of tourists’ comments on the Sanya tourism destination on the Ctrip tourism website, specific analysis results can be drawn, and accordingly, suggestions for improving the perceived image of the destination audience can be put forward so as to promote the development of the tourism destination in a more sustainable direction.
- (1)
- By analyzing the high-frequency words of Sanya’s tourism image, it can be seen that “service” is the word with the highest frequency. This indicates that tourists pay special attention to the quality of services provided by tourist destinations. This further indicates that providing excellent service quality is important in attracting and satisfying tourists. Therefore, Sanya City should focus on and strengthen the development of the service industry in its future tourism development and improve the quality and level of service to meet the growing needs and expectations of tourists. This includes training and upgrading practitioners’ service awareness and skills, improving tourism facilities and infrastructure, and establishing a more comprehensive service system and management mechanism. Through these efforts, the image and competitiveness of Sanya City as a tourist destination can be further enhanced, and the goal of sustainable development can be realized.
- (2)
- According to the analysis of the tourism image dimensions of Sanya City, it can be seen that tourism resources are the aspect with the highest proportion. The high-frequency words focus on the natural and human resources of scenic spots, such as “scenery”, “rainforest”, “island”, “seawater”, “beach”, and so on. These high-frequency words focus on Sanya’s rich and diverse natural landscapes, including unique landscapes such as the fascinating coastline, dense tropical rainforests, and beautiful beaches. These natural resources are important factors in attracting tourists to come to Sanya, demonstrating the attractiveness and unique charm of Sanya City as a popular tourist destination. In response to this finding, Sanya City can further strengthen the protection and development of natural landscapes in its future tourism development and upgrade the facilities and services of scenic spots so that tourists can better experience and enjoy these unique tourism resources. In addition, strengthening the excavation and display of humanistic resources is also an important means to enhance the image of the tourist destination, for example, through cultural activities and traditional art performances, to enrich the tourists’ travel experience and enhance their goodwill and satisfaction with Sanya City. Therefore, the comprehensive utilization and development of Sanya City’s rich tourism resources and the emphasis on protecting and enhancing natural and humanistic landscapes will help to further consolidate and expand Sanya City’s position as a popular tourist destination and realize the sustainable development and prosperity of the tourism industry.
- (3)
- According to the analysis of negative sentiment factors in Sanya, the “tourism infrastructure and supporting services” category accounts for the highest proportion of negative perception factors, indicating that Sanya still has much room for improvement in this area. For example, the words “queuing”, “tickets”, and “battery car” mentioned by tourists reflect their concern for the smoothness of the tour process and the cost. Words like “service”, “staff”, and “value for money” indicate that tourists are concerned about the quality of service provided by the tourist attractions, the performance of the staff, and the value for money. In addition, words such as “suggestions” and “time” may relate to tourists’ suggestions about the operation and services of the scenic spot, as well as their perceptions of time management. The concentration of these negative perception factors reflects the problems and dissatisfaction that tourists are concerned about and experience when visiting scenic spots in Sanya City. Therefore, based on this feedback, scenic area managers can focus on optimizing tourism infrastructure and supporting services, improving the smoothness and experience of the play process, and upgrading service quality and cost-effectiveness, as well as listening to and adopting tourists’ suggestions to strengthen scenic area operations and time management, in order to enhance tourists’ satisfaction and the overall sense of experience.
Our research innovatively applies a deep learning approach to address the problem of analyzing the sentiment image of tourist destinations, which is different from previous approaches that have relied mainly on the content analysis software ROST [3], sentiment lexicon analysis [4], and machine learning analysis [5]. This innovative approach allows us to capture nuanced data and gain greater depth in our analysis compared to traditional methods. The article validates and enriches the “cognitive-emotional” three-dimensional model of destination image proposed by Baloglu [2] et al., which has practical implications for the marketing focus, improvement direction, and sustainable development of tourist destinations. From the results of the study, the overall sentiment of tourists towards Sanya City is positive, with more positive than negative evaluations, indicating that tourists have a high level of satisfaction with the destination in Sanya City, which is consistent with Hu’s findings [49]. The main reason for tourists’ negative feelings is “tourism infrastructure and supporting services”, which is consistent with the results of Yin Li’s study [50].
It can be seen that sentiment analysis based on the BERT-BiLSTM-CNN-Attention deep learning model can effectively identify the emotional characteristics of tourists and deeply analyze the root causes of their positive and negative emotions. To a certain extent, it enriches the analytical methods of the research on image perception of tourist destinations and provides valuable information and insights for enhancing the attractiveness of tourist destinations.
6. Conclusions
This paper introduces a novel combined BERT-BiLSTM-CNN-Attention deep learning model specifically tailored for analyzing sentiment in Sanya city tourism reviews. This model is crucial for gaining deeper insights into tourists’ perceptions and sentiments towards Sanya, thereby enabling more informed decision-making for tourism management and enhancement strategies in the region. Comparative experiments using CNN, Bi-LSTM, Bert-BiLSTM, Bert-CNN, and Bert-BiLSTM-CNN deep learning models are conducted to compare the accuracy and other aspects of the BERT-BiLSTM-CNN-Attention model with other methods. The results show that the BERT-BiLSTM-CNN-Attention model has an accuracy of 93.13%, which is better than other models. In this paper, based on the “cognitive-emotional” model of tourism destination image by using word frequency analysis, semantic network analysis, and sentiment analysis, we explored the tourists’ perception of Sanya’s tourism destination image from the three aspects of the cognitive image, emotional image and overall image, and obtained the following main conclusions.
First, this paper uses high-frequency words and semantic networks to analyze the cognitive image of a destination. The study found that tourists’ perceived image of Sanya City’s tourism destination includes tourism resources, tourism environment perception, tourism infrastructure and supporting services, and tourism activities. The natural beauty of scenic spots, the overall feeling of the environment, service quality, and diversified tourism activities are the main focus of tourists’ attention and evaluation.
Secondly, in terms of sentiment image, this paper adopts BERT-BiLSTM-CNN-Attention model tourists to analyze the sentiment of Sanya City tourism review text, which can be used as an interface between big data analytics and tourism management theories and provide a systematic theoretical framework for the study of tourism destinations. The results yielded 92.25% positive and 7.75% negative sentiments, and the tourists’ overall satisfaction was relatively high. The most important reason for tourists’ negative feelings is the aspect of tourism infrastructure and supporting services, accounting for 47.03%. Analyzing the potential causes of tourists’ negative emotions will help researchers understand and improve the tourism experience and provide a strong guide to improve the destination’s attractiveness.
Finally, our analysis of cognitive and emotional image reveals that tourists perceive Sanya City as a highly positive tourist destination, characterized by a predominantly positive overall image perception. This perception is shaped by tourists’ comprehensive sensory experiences of Sanya City’s physical and functional elements, including its natural scenery, cultural landscapes, tourism facilities, and infrastructure. Furthermore, tourists’ emotional responses significantly influence their overall evaluation of Sanya City as a tourism destination.
However, there are some limitations to this study. First of all, this paper only carries out deep learning through the text of tourists’ comments, without considering other information such as pictures, so the diversity of the study is somewhat deficient. The data of this study comes from Ctrip.com, but the users of the tourism website are mainly young and middle-aged people, so the data lacks samples of children and elderly groups, which may lead to some bias in the research results. In addition, the sample is only from the review content of one tourism website, which is a single source of data and does not take into account the influence of international tourists on the image of Sanya City as a tourist destination. In future research, obtaining more representative samples through diverse channels will enhance the accuracy of evaluating tourists’ emotions towards the Sanya tourism brand, thereby ensuring the broader applicability of the conclusions. While this research focuses on a specific area like Sanya City, future investigations could broaden their geographic scope to validate the model’s universality and robustness. Additionally, incorporating more socio-cultural factors into the model could provide a more comprehensive understanding of the multidimensional characteristics influencing destination image perception.
Author Contributions
Conceptualization, T.W. and X.X.; methodology, X.X.; software, X.X.; formal analysis, X.X.; writing—original draft preparation, T.W. and X.X.; writing—review and editing, X.X.; visualization, X.X.; supervision, T.W. All authors have read and agreed to the published version of the manuscript.
Funding
This research was funded by the National Natural Science Foundation of China (grant number: 71771111); Liaoning Provincial Social Science Planning Foundation (grant number: L14BTJ004); Liaoning Province Education Reform Project Foundation (grant number: 2021-39); University-local government scientific and technical cooperation cultivation project of Ordos Institute-LNTU (grant number: YJY-XD-2024-B-013).
Institutional Review Board Statement
Not applicable.
Informed Consent Statement
Not applicable.
Data Availability Statement
The data presented in this study are available on request from the corresponding author.
Conflicts of Interest
The authors declare no conflicts of interest.
References
- Pan, X.; Rasouli, S.; Timmermans, H. Investigating tourist destination choice: Effect of destination image from social network members. Tour. Manag. 2021, 83, 104217. [Google Scholar] [CrossRef]
- Baloglu, S.; McCleary, K.W. A model of destination image formation. Ann. Tour. Res. 1999, 26, 868–897. [Google Scholar] [CrossRef]
- Zhang, C.; Liu, Y.; Zhao, B.; Chai, J.; Jiang, F. Research on Destination lmage Mining of “Tang Culture” Based on Online Text Sentiment Analysis. China J. Econom. 2023, 3, 387–407. [Google Scholar]
- Geetha, M.; Singha, P.; Sinha, S. Relationship between customer sentiment and online customer ratings for hotels-An empirical analysis. Tour. Manag. 2017, 61, 43–54. [Google Scholar] [CrossRef]
- Giglio, S.; Bertacchini, F.; Bilotta, E.; Pantano, P. Using social media to identify tourism attractiveness in six Italian cities. Tour. Manag. 2019, 72, 306–312. [Google Scholar] [CrossRef]
- Lu, L.; Liao, X. Research on Image Perception of Tourism Destination Based on UGC Data: A Case Study of South Mount Heng. Econ. Geogr. 2019, 39, 221–229. [Google Scholar]
- Cao, Z.; Xu, H.; Teo, B.S.-X. Sentiment of Chinese Tourists towards Malaysia Cultural Heritage Based on Online Travel Reviews. Sustainability 2023, 15, 3478. [Google Scholar] [CrossRef]
- Yin, Q.; Gulila, A. Entity relationship extraction in tourism field based on multi-feature attention convolution neural network. J. Northeast. Norm. Univ. 2022, 54, 79–83. [Google Scholar]
- Hunt, J.D. Image as a factor in tourism development. J. Travel Res. 1975, 13, 1–7. [Google Scholar] [CrossRef]
- Echtner, C.M.; Ritchie, J.B. The meaning and measurement of destination image. J. Tour. Stud. 1991, 2, 2–12. [Google Scholar]
- Gartner, W.C. Image formation process. J. Travel Tour. Mark. 1994, 2, 191–216. [Google Scholar] [CrossRef]
- Papadimitriou, D.; Apostolopoulou, A.; Kaplanidou, K. Destination personality, affective image, and behavioral intentions in domestic urban tourism. J. Travel Res. 2015, 54, 302–315. [Google Scholar] [CrossRef]
- Stylidis, D.; Belhassen, Y.; Shani, A. Destination image, on-site experience and behavioural intentions: Path analytic validation of a marketing model on domestic tourists. Curr. Issues Tour. 2017, 20, 1653–1670. [Google Scholar] [CrossRef]
- Ageeva, E.; Foroudi, P. Tourists’ destination image through regional tourism: From supply and demand sides perspectives. J. Bus. Res. 2019, 101, 334–348. [Google Scholar] [CrossRef]
- Foroudi, P.; Akarsu, T.N.; Ageeva, E.; Foroudi, M.M.; Dennis, C.; Melewar, T. Promising the dream: Changing destination image of London through the effect of website place. J. Bus. Res. 2018, 83, 97–110. [Google Scholar] [CrossRef]
- Li, F.; Zhang, S.; Liu, J.; Jiang, L.; Gao, C. Comparative Study on Tourism Image Perception Between Beijing-Tianjin-Hebei and Yangtze River Delta Agglomerations. Econ. Geogr. 2023, 43, 194–205. [Google Scholar]
- Li, T.; Wu, G.; Liang, L.; Zhao, P. Post-visit image perception of Mount Wutai tourism destination based on online comments. J. Arid. Land. Res. Environ. 2021, 35, 192–198. [Google Scholar]
- Wu, C.; Shao, X. Analysis of tourism image perception of ancient villages based on UGC and questionnaire data—A case of Qikou ancient town. J. Arid. Land. Res. Environ. 2020, 34, 195–200. [Google Scholar]
- Shi, D.; Zhang, B.; Yi, B. How is Tourist Destination Perception Formed? Exploratory Research based on Text Mining. J. Tour. Trib. 2022, 37, 68–82. [Google Scholar]
- Kim, Y.G.; Eves, A.; Scarles, C. Building a model of local food consumption on trips and holidays: A grounded theory approach. Int. J. Hosp. Manag. 2009, 28, 423–431. [Google Scholar] [CrossRef]
- Lee, S.W.; Xue, K. A model of destination loyalty: Integrating destination image and sustainable tourism. Asia Pac. J. Tour. Res. 2020, 25, 393–408. [Google Scholar] [CrossRef]
- Li, H.; Hu, M.; Li, G. Forecasting tourism demand with multisource big data. Ann. Tour. Res. 2020, 83, 102912. [Google Scholar] [CrossRef]
- Sarstedt, M.; Ringle, C.M.; Cheah, J.-H.; Ting, H.; Moisescu, O.I.; Radomir, L. Structural model robustness checks in PLS-SEM. Tour. Econ. 2020, 26, 531–554. [Google Scholar] [CrossRef]
- Zhang, H.; Fu, X.; Cai, L.A.; Lu, L. Destination image and tourist loyalty: A meta-analysis. Tour. Manag. 2014, 40, 213–223. [Google Scholar] [CrossRef]
- Wang, X.; Li, X.R.; Zhen, F.; Zhang, J. How smart is your tourist attraction?: Measuring tourist preferences of smart tourism attractions via a FCEM-AHP and IPA approach. Tour. Manag. 2016, 54, 309–320. [Google Scholar] [CrossRef]
- Choi, S.; Lehto, X.Y.; Morrison, A.M. Destination image representation on the web: Content analysis of Macau travel related websites. Tour. Manag. 2007, 28, 118–129. [Google Scholar] [CrossRef]
- Lam, J.M.; Ismail, H.; Lee, S. From desktop to destination: User-generated content platforms, co-created online experiences, destination image and satisfaction. J. Destin. Mark. Manag. 2020, 18, 100490. [Google Scholar] [CrossRef]
- Afshardoost, M.; Eshaghi, M.S. Destination image and tourist behavioural intentions: A meta-analysis. Tour. Manag. 2020, 81, 104154. [Google Scholar] [CrossRef]
- Boley, B.B.; McGehee, N.G.; Hammett, A.T. Importance-performance analysis (IPA) of sustainable tourism initiatives: The resident perspective. Tour. Manag. 2017, 58, 66–77. [Google Scholar] [CrossRef]
- Garay, L. # Visitspain. Breaking down affective and cognitive attributes in the social media construction of the tourist destination image. Tour. Manag. Perspect. 2019, 32, 100560. [Google Scholar]
- Huang, Z.; Li, X. On the Image Perception and Promotion Pattern of Tourist Destination. Tour. Trib. 2002, 17, 65–70. [Google Scholar]
- Maldonado-López, B.; Ledesma-Chaves, P.; Gil-Cordero, E. Cross-border destination image for sustainable tourism development in peripheral areas. J. Travel Tour. Mark. 2024, 41, 614–639. [Google Scholar] [CrossRef]
- Mahfouz, A.Y.; Joonas, K.; Opara, E.U. An overview of and factor analytic approach to flow theory in online contexts. Technol. Soc. 2020, 61, 101228. [Google Scholar] [CrossRef]
- Li, C.; Cao, M.; Wen, X.; Zhu, H.; Liu, S.; Zhang, X.; Zhu, M. MDIVis: Visual analytics of multiple destination images on tourism user generated content. Vis. Inform. 2022, 6, 1–10. [Google Scholar] [CrossRef]
- Zhang, J.; Dong, L. Image monitoring and management of hot tourism destination based on data mining technology in big data environment. Microprocess. Microsyst. 2021, 80, 103515. [Google Scholar] [CrossRef]
- Zhang, W.; Fesenmaier, D.R. Assessing emotions in online stories: Comparing self-report and text-based approaches. Inf. Technol. Tour. 2018, 20, 83–95. [Google Scholar] [CrossRef]
- Wang, T.; Yang, W. Review of Text Sentiment Analysis Methods. Comput. Eng. Appl. 2021, 57, 11–24. [Google Scholar]
- Zhao, Y.; Qin, B.; Shi, Q.; Liu, T. Large-scale Sentiment Lexicon Collection and Its Application in Sentiment Classification. J. Chin. Inform. Proc. 2017, 31, 187–193. [Google Scholar]
- Pang, B.; Lee, L.; Vaithyanathan, S. Thumbs up? Sentiment classification using machine learning techniques. arXiv 2002, arXiv:cs/0205070. [Google Scholar]
- Bayhaqy, A.; Sfenrianto, S.; Nainggolan, K.; Kaburuan, E.R. In Sentiment analysis about E-commerce from tweets using decision tree, K-nearest neighbor, and naïve bayes. In Proceedings of the 2018 International Conference on Orange Technologies (ICOT), Nusa Dua, Bali, Indonesia, 23–26 October 2018; IEEE: Piscataway, NJ, USA, 2018; pp. 1–6. [Google Scholar]
- Al Amrani, Y.; Lazaar, M.; El Kadiri, K.E. Random forest and support vector machine based hybrid approach to sentiment analysis. Proc. Comput. Sci. 2018, 127, 511–520. [Google Scholar] [CrossRef]
- Minaee, S.; Kalchbrenner, N.; Cambria, E.; Nikzad, N.; Chenaghlu, M.; Gao, J. Deep learning–based text classification: A comprehensive review. ACM Comput. Surv. 2021, 54, 1–40. [Google Scholar] [CrossRef]
- Rani, S.; Kumar, P. Deep learning based sentiment analysis using convolution neural network. Arab. J. Sci. Eng. 2019, 44, 3305–3314. [Google Scholar] [CrossRef]
- Arshed, M.A.; Mumtaz, S.; Liaqat, M.S.; ul Haq, I.; Hussain, M. Lstm based sentiment analysis model to monitor COVID-19 emotion. VFAST Trans. Softw. Eng. 2022, 10, 70–78. [Google Scholar] [CrossRef]
- Rehman, A.U.; Malik, A.K.; Raza, B.; Ali, W. A hybrid CNN-LSTM model for improving accuracy of movie reviews sentiment analysis. Multimed. Tools Appl. 2019, 78, 26597–26613. [Google Scholar] [CrossRef]
- Devlin, J.; Chang, M.-W.; Lee, K.; Toutanova, K. Bert: Pre-training of deep bidirectional transformers for language understanding. arXiv 2018, arXiv:1810.04805. [Google Scholar]
- Duan, D.; Tang, J.; Wen, Y.; Yuan, K. Chinese Short Text Classification Algorithm Based on BERT Model. Comp. Eng. 2021, 41, 79–86. [Google Scholar]
- Tan, H.; Liu, P.; Li, B. Perception of Tourism Destination Image in Dalian Based on Network Text Analysis. Econ. Geogr. 2021, 41, 231–239. [Google Scholar]
- Hu, T.; Chen, H. Identifying Coastal Cities from the Perspective of “Identity-Structure-Meaning”: A Study of Urban Tourism Imagery in Sanya, China. Sustainability 2023, 15, 15365. [Google Scholar] [CrossRef]
- Yin, L.; Yan, X.; Tian, L. The Tourism Destination of lmage Research based on the Content Analysis—Take Sanya for Example. Special Zone Economy 2019, 1, 100–102. [Google Scholar]
Figure 1.
The BERT-BiLSTM-CNN-Attention based approach to tourism sentiment analytics.

Figure 2.
Model framework diagram.

Figure 3.
BERT model pre-training structure diagram.

Figure 4.
Plot of experimental results for each model.

Figure 5.
Semantic network diagram.


Table 1.
List of tourist attractions.
| Tourist Attraction | Number of Comments | Proportion |
|---|---|---|
| Lost Space Aquarium at Atlantis Sanya | 2966 | 22.81 |
| Cape Haijiao in Sanya | 2029 | 15.61 |
| Wuzhizhou Island | 2747 | 21.13 |
| West Island | 2455 | 18.88 |
| Sanya Yalong Bay Tropical Paradise Forest Park | 2804 | 21.57 |
| Total | 13,001 | 100 |
Table 2.
Sample data on tourism reviews.
| Label | Comment Text Content |
|---|---|
| 0 | Very disappointing, the environment and equipment as well as the animals are very poor. |
| 0 | Not fun, too expensive tickets, too many people, not recommended. |
| 1 | The natural environment is superb, ecological first class, great place! |
| 1 | It’s worth going over again, the ocean is beautiful and the island food is good. |
Table 3.
Hyperparameter settings.
| Hyperparameter | Value |
|---|---|
| Embedding size | 512 |
| Hidden size | 768 |
| Dropout | 0.1 |
| Learning rate | 5 × 10⁻⁵ |
| Batch size | 128 |
| Epoch | 3 |
| filter_sizes | (2, 3, 4) |
| num_filters | 256 |
| Hidden active | ReLu |
Table 4.
Classification matrix.
| Actual Results | Predicted Results | |
|---|---|---|
| Positive Examples | Negative Examples | |
| Positive examples | TP | FN |
| Negative examples | FP | TN |
Table 5.
Table of experimental results for each model.
| Model | Accuracy | Precision | Recall | F1 Score |
|---|---|---|---|---|
| CNN | 0.7906 | 0.7847 | 0.7615 | 0.7729 |
| BiLSTM | 0.7940 | 0.7863 | 0.7931 | 0.7897 |
| Bert-BiLSTM | 0.8230 | 0.8331 | 0.8228 | 0.8279 |
| Bert-CNN | 0.8754 | 0.8961 | 0.8721 | 0.8839 |
| Bert-BiLSTM-CNN | 0.9184 | 0.9063 | 0.9233 | 0.9147 |
| Bert-BiLSTM-CNN-Attention | 0.9313 | 0.9321 | 0.9316 | 0.9318 |
Table 6.
Sanya Tourism Image Perception High Frequency Glossary.
| No. | Words | Word Frequency | No. | Words | Word Frequency | No. | Words | Word Frequency |
|---|---|---|---|---|---|---|---|---|
| 1 | service | 1537 | 21 | Sanya | 738 | 41 | Cape Haijiao in Sanya | 404 |
| 2 | landscape | 1384 | 22 | seawater | 720 | 42 | rainforest | 400 |
| 3 | scenery | 1246 | 23 | aquarium | 710 | 43 | driver | 397 |
| 4 | electromobile | 1228 | 24 | photograph | 696 | 44 | beach | 396 |
| 5 | project | 1169 | 25 | suitable | 672 | 45 | tickets | 384 |
| 6 | experience | 1098 | 26 | interesting | 646 | 46 | forest | 381 |
| 7 | scenic area | 1045 | 27 | child | 641 | 47 | suggestion | 365 |
| 8 | worth | 1034 | 28 | convenience | 570 | 48 | cost-effectiveness | 345 |
| 9 | happy | 984 | 29 | time | 555 | 49 | free | 344 |
| 10 | fun | 926 | 30 | roundabouts | 548 | 50 | tourism | 325 |
| 11 | kid | 918 | 31 | environment | 523 | 51 | beauty | 324 |
| 12 | island | 904 | 32 | attitude | 497 | 52 | tropics | 314 |
| 13 | attractions | 857 | 33 | park | 483 | 53 | graceful | 311 |
| 14 | explain | 822 | 34 | queue | 472 | 54 | marine life | 310 |
| 15 | personnel | 821 | 35 | next time | 452 | 55 | mermaids | 307 |
| 16 | beautiful | 793 | 36 | glass | 448 | 56 | limpid | 298 |
| 17 | place | 791 | 37 | Yalong Bay | 440 | 57 | stimulate | 289 |
| 18 | performance | 780 | 38 | sightseeing | 435 | 58 | climatic | 288 |
| 19 | play | 753 | 39 | diving | 427 | 59 | boardwalk | 274 |
| 20 | enthusiasm | 747 | 40 | tour | 405 | 60 | tour guide | 274 |
Table 7.
Dimension Table of cognitive image.
| Dimensions | Proportion | Words |
|---|---|---|
| tourism resources | 32.07% | landscape, scenery, scenic area, island, attractions, Sanya, Yalong Bay, Cape Haijiao in Sanya, rainforest, forest, seawater, beach, glass, tropics, Marine life, mermaids, aquarium, environment, round island |
| tourism environment perception | 15.65% | worth, happy, fun, beautiful, interesting, beauty, graceful, limpid, stimulate, climatic |
| tourism infrastructure and supporting services | 29.98% | service, electromobile, explain, personnel, place, enthusiasm, convenience, time, attitude, park, queue, next time, tickets, suggestion, cost-effectiveness, free, tourism, boardwalk, tour guide |
| tourism activities | 22.28% | project, experience, performance, play, photograph, suitable, child, kid, sightseeing, diving, tour, driver |
Table 8.
Sentiment analysis results table.
| Title | Positive Emotion | Negative Emotion | Total |
|---|---|---|---|
| Proportion | 92.25 | 7.75 | 100 |
Table 9.
Top 30 high-frequency words in negative comments.
| No. | Words | Word Frequency | No. | Words | Word Frequency | No. | Words | Word Frequency |
|---|---|---|---|---|---|---|---|---|
| 1 | project | 161 | 11 | island | 85 | 21 | attitude | 48 |
| 2 | scenic area | 154 | 12 | electromobile | 70 | 22 | tourist | 47 |
| 3 | queue | 127 | 13 | personnel | 69 | 23 | scenery | 41 |
| 4 | tickets | 107 | 14 | cost-effectiveness | 67 | 24 | diving | 39 |
| 5 | place | 101 | 15 | charge | 64 | 25 | beach | 38 |
| 6 | attractions | 99 | 16 | suggestion | 60 | 26 | child | 37 |
| 7 | service | 93 | 17 | rubbish | 54 | 27 | photograph | 37 |
| 8 | landscape | 90 | 18 | time | 52 | 28 | Sanya | 37 |
| 9 | not worth | 89 | 19 | free | 51 | 29 | Stone | 36 |
| 10 | experience | 85 | 20 | sightseeing | 49 | 30 | consumption | 35 |
Table 10.
Classification of high-frequency words for negative comments.
| Dimensions | Proportion | Words |
|---|---|---|
| tourism resources | 27.33% | scenic area, attractions, scenery, island, Sanya, landscape, stone, beach |
| tourism environment perception | 8.20% | not worth, experience |
| tourism infrastructure and supporting services | 47.03% | queue, tickets, place, service, electromobile, personnel, cost-effectiveness, charge, consumption, suggestion, rubbish, time, free, attitude |
| tourism activities | 17.44% | Project, child, photograph, diving, tourist, sightseeing |
Disclaimer/Publisher’s Note: The statements, opinions and data contained in all publications are solely those of the individual author(s) and contributor(s) and not of MDPI and/or the editor(s). MDPI and/or the editor(s) disclaim responsibility for any injury to people or property resulting from any ideas, methods, instructions or products referred to in the content. |
© 2024 by the authors. Licensee MDPI, Basel, Switzerland. This article is an open access article distributed under the terms and conditions of the Creative Commons Attribution (CC BY) license (https://creativecommons.org/licenses/by/4.0/).
Share and Cite
MDPI and ACS Style
Wen, T.; Xu, X. Research on Image Perception of Tourist Destinations Based on the BERT-BiLSTM-CNN-Attention Model. Sustainability 2024, 16, 3464. https://doi.org/10.3390/su16083464
AMA Style
Wen T, Xu X. Research on Image Perception of Tourist Destinations Based on the BERT-BiLSTM-CNN-Attention Model. Sustainability. 2024; 16(8):3464. https://doi.org/10.3390/su16083464
Chicago/Turabian StyleWen, Tingxin, and Xinyu Xu. 2024. "Research on Image Perception of Tourist Destinations Based on the BERT-BiLSTM-CNN-Attention Model" Sustainability 16, no. 8: 3464. https://doi.org/10.3390/su16083464
Note that from the first issue of 2016, this journal uses article numbers instead of page numbers. See further details here.