
Spatiotemporal Dynamics and Driving Factors of Ecosystem Services in the Yellow River Delta, China

1
School of Civil Engineering, Shandong Jiaotong University, Jinan 250023, China
2
College of Geography and Environment, Shandong Normal University, Jinan 250014, China
*
Author to whom correspondence should be addressed.
Sustainability 2024, 16(8), 3466; https://doi.org/10.3390/su16083466
Submission received: 9 February 2024
/
Revised: 18 April 2024
/
Accepted: 19 April 2024
/
Published: 21 April 2024
(This article belongs to the Special Issue Assessing Ecosystem Services Applying Local Perspectives)
Abstract
:Exploring the dynamic variation in ecosystem services and clarifying the driving mechanism will help with the formulation of effective ecological environment protection policies. Accordingly, this study sought to reveal the complex variability in ecosystem services in the Yellow River Delta (YRD) at a higher temporal resolution and the transition between the main driving factors in different periods. To this end, we used the economic equivalent factor valuation method to quantify the ecosystem service value from 2000 to 2019 at 5-year intervals. Furthermore, the Geo-detector model was used to identify the main driving factors and interaction between the driving factors of ecosystem service value variations. Then, we analyzed the temporal and spatial dynamic variations in the ecosystem service value and the transitions between the main driving factors in different periods. The main results are as follows: (1) From 2000 to 2019, the ecosystem service value of the YRD showed an increasing trend followed by a decline, whereby water and construction land increased and the other classes of land decreased. Overall, the inland and coastal distribution patterns exhibited low and high values, respectively. (2) The main driving factors of ecosystem service value variations were the NDVI and topographical factors (aspect, slope, elevation), which had q values that were stable and greater than those of the other factors. Although human activity, tourist resource concentration and traffic convenience factors had a comparatively minor effect on ecosystem services, we noted a trend where their effects increased from 2000 to 2019. (3) The detection of interactions revealed complex mechanisms affecting the variation in the YRD. Interactions between variables had a stronger influence than individual effects. The interactions between the Normalized Difference Vegetation Index (NDVI) and other factors consistently had the most significant impact. These interactions primarily shaped the spatial and temporal distribution of ecosystem services. The NDVI and human activities exhibited nonlinear enhancement. These results contribute to improving our cognition of the factors and mechanisms influencing ecosystem services, offering theoretical support for the improvement of ecosystem services in the YRD.
1. Introduction
Social–economic development is rapidly increasing in China, with progress made especially during the past few decades [1,2,3]. However, this places the environment and ecosystems under huge pressure, associated with the rapid development of the social economy [4,5]. Ecosystem services are an important research framework in sustainability science, and refer to the multiple benefits that humans derive from natural systems and reflect the direct or indirect contribution of natural systems to human society’s well-being [6]. Assessing the variations in products and services that human society obtains from ecosystems can improve our understanding of ecosystem value and can help us to understand the human–ecosystem relationship [6,7]. In sum, the valuation of ecosystem services is helpful to understand the changes in the environment and ecosystems and to provide scientific guidance for regional sustainable development [8].
Ecosystem service values (ESVs) apply economic rules and quantification indexes to estimate ecosystem services, which are the diverse benefits people can attain from various natural ecosystems [7]. The ESV quantification index refers to the services that a particular land use type can provide [9]. Xie et al. proposed the economic equivalent factor of ESVs in China based on China’s national willingness survey and the ecological service value equivalent ecosystem services proposed by Costanza [10]. The equivalent factor method, which assesses ecosystem service values, is mainly based on land use classification data, and has advantages such as less data and a calculation process that is easy to perform. Since then, many scholars have carried out research to evaluate ecosystem services based on this method, and it had been widely applied in the evaluation of ecosystem services in wetland, forest, and farmland systems [7,11,12].
Land use/cover change (LUCC) has a considerable influence on the distribution and variation in ecosystem service provision, which accompanies changes in morphology and cover elements on the Earth’s surface [13,14,15,16]. In addition, natural (ecosystem type, vegetation cover and topography) and social–economic (transportation, tourism) factors can also influence ecosystem services. As such, when exploring trends in changes in ecosystem services and examining the driving mechanism of ESV changes, land use changes and natural and social–economic factors should be comprehensively considered. This can facilitate a deeper understanding of ecosystem services and ecological–social systems. Accordingly, the trajectories of LUCC and the other main driving factors of ecosystem service changes were examined in this study in order to make informed recommendations to improve ecosystem services and regional sustainable development. In the context of ecological or environmental studies, a driving factor can be any natural or anthropogenic element that plays a pivotal role in shaping the behavior, distribution, or dynamics of a particular ecosystem or environmental process.
Furthermore, many driving factors of ecosystem service changes are interlinked [17,18], and the driving relationship and complex mechanisms of this interlinking effect need to be considered. The interaction detector in the Geo-detector model that we have applied in this study can address this need. Additionally, in recent years, most studies on the driving mechanisms of ecosystem services have mainly focused on the spatial distribution during a single year or examined the difference between the final year and the base year [19,20,21,22,23,24]. The limitations of this static analysis are that it overlooks the complex variability of ecosystem services over time and the transitions of main driving factors in different periods. Meanwhile, the results do not accurately describe the dynamic spatiotemporal characteristics of ecosystem services and the effective variation in driving factors. Therefore, considering that the change in ecosystem services is a dynamic process, a longer time period or high-temporal-resolution sampling during a period should be considered [25].
The Yellow River Delta (YRD) is an important ecological barrier and economic zone in China [26,27,28,29]. The YRD, which has abundant biodiversity and ecological functions, has always been considered a very fragile area because of its location in the interaction zone between sea and land, accompanied by its rapid environmental evolution. In recent years, under the background of climate change and social development, the development of the oil extraction industry, agriculture and fisheries and urbanization in the region have accelerated. The Yellow River estuary has also experienced ecological and environmental problems such as river interruption, freshwater wetland shrinkage, plant degradation, and biodiversity reduction [4,11,30]. Moreover, most of the delta residents’ livelihoods rely mainly on ecosystem supply, and the production activities and and daily life in the delta are also affected to varying degrees. The sustainable development of the delta has become an urgent practical problem. Against this background, it is necessary to conduct novel research to reveal the evolutionary mechanism in the YRD.
In this study, we took the YRD as the research area, and the unit area equivalent factor method and Geo-detector model were used to (1) analyze the temporal and spatial patterns of land use and ESV variation from 2000 to 2019 at a high temporal resolution, revealing the dynamic evolutionary characteristics of regional ecosystem services, and (2) explore the driving factors and factor interaction effects contributing to the temporal–spatial heterogeneity of ESVs in the YRD. Our goals were to (1) improve our cognition of the factors and mechanisms influencing ecosystem services, and (2) offer a theoretical support for the improvement of ecosystem services in the YRD.
2. Materials and Methods
2.1. Overview of the Study Area
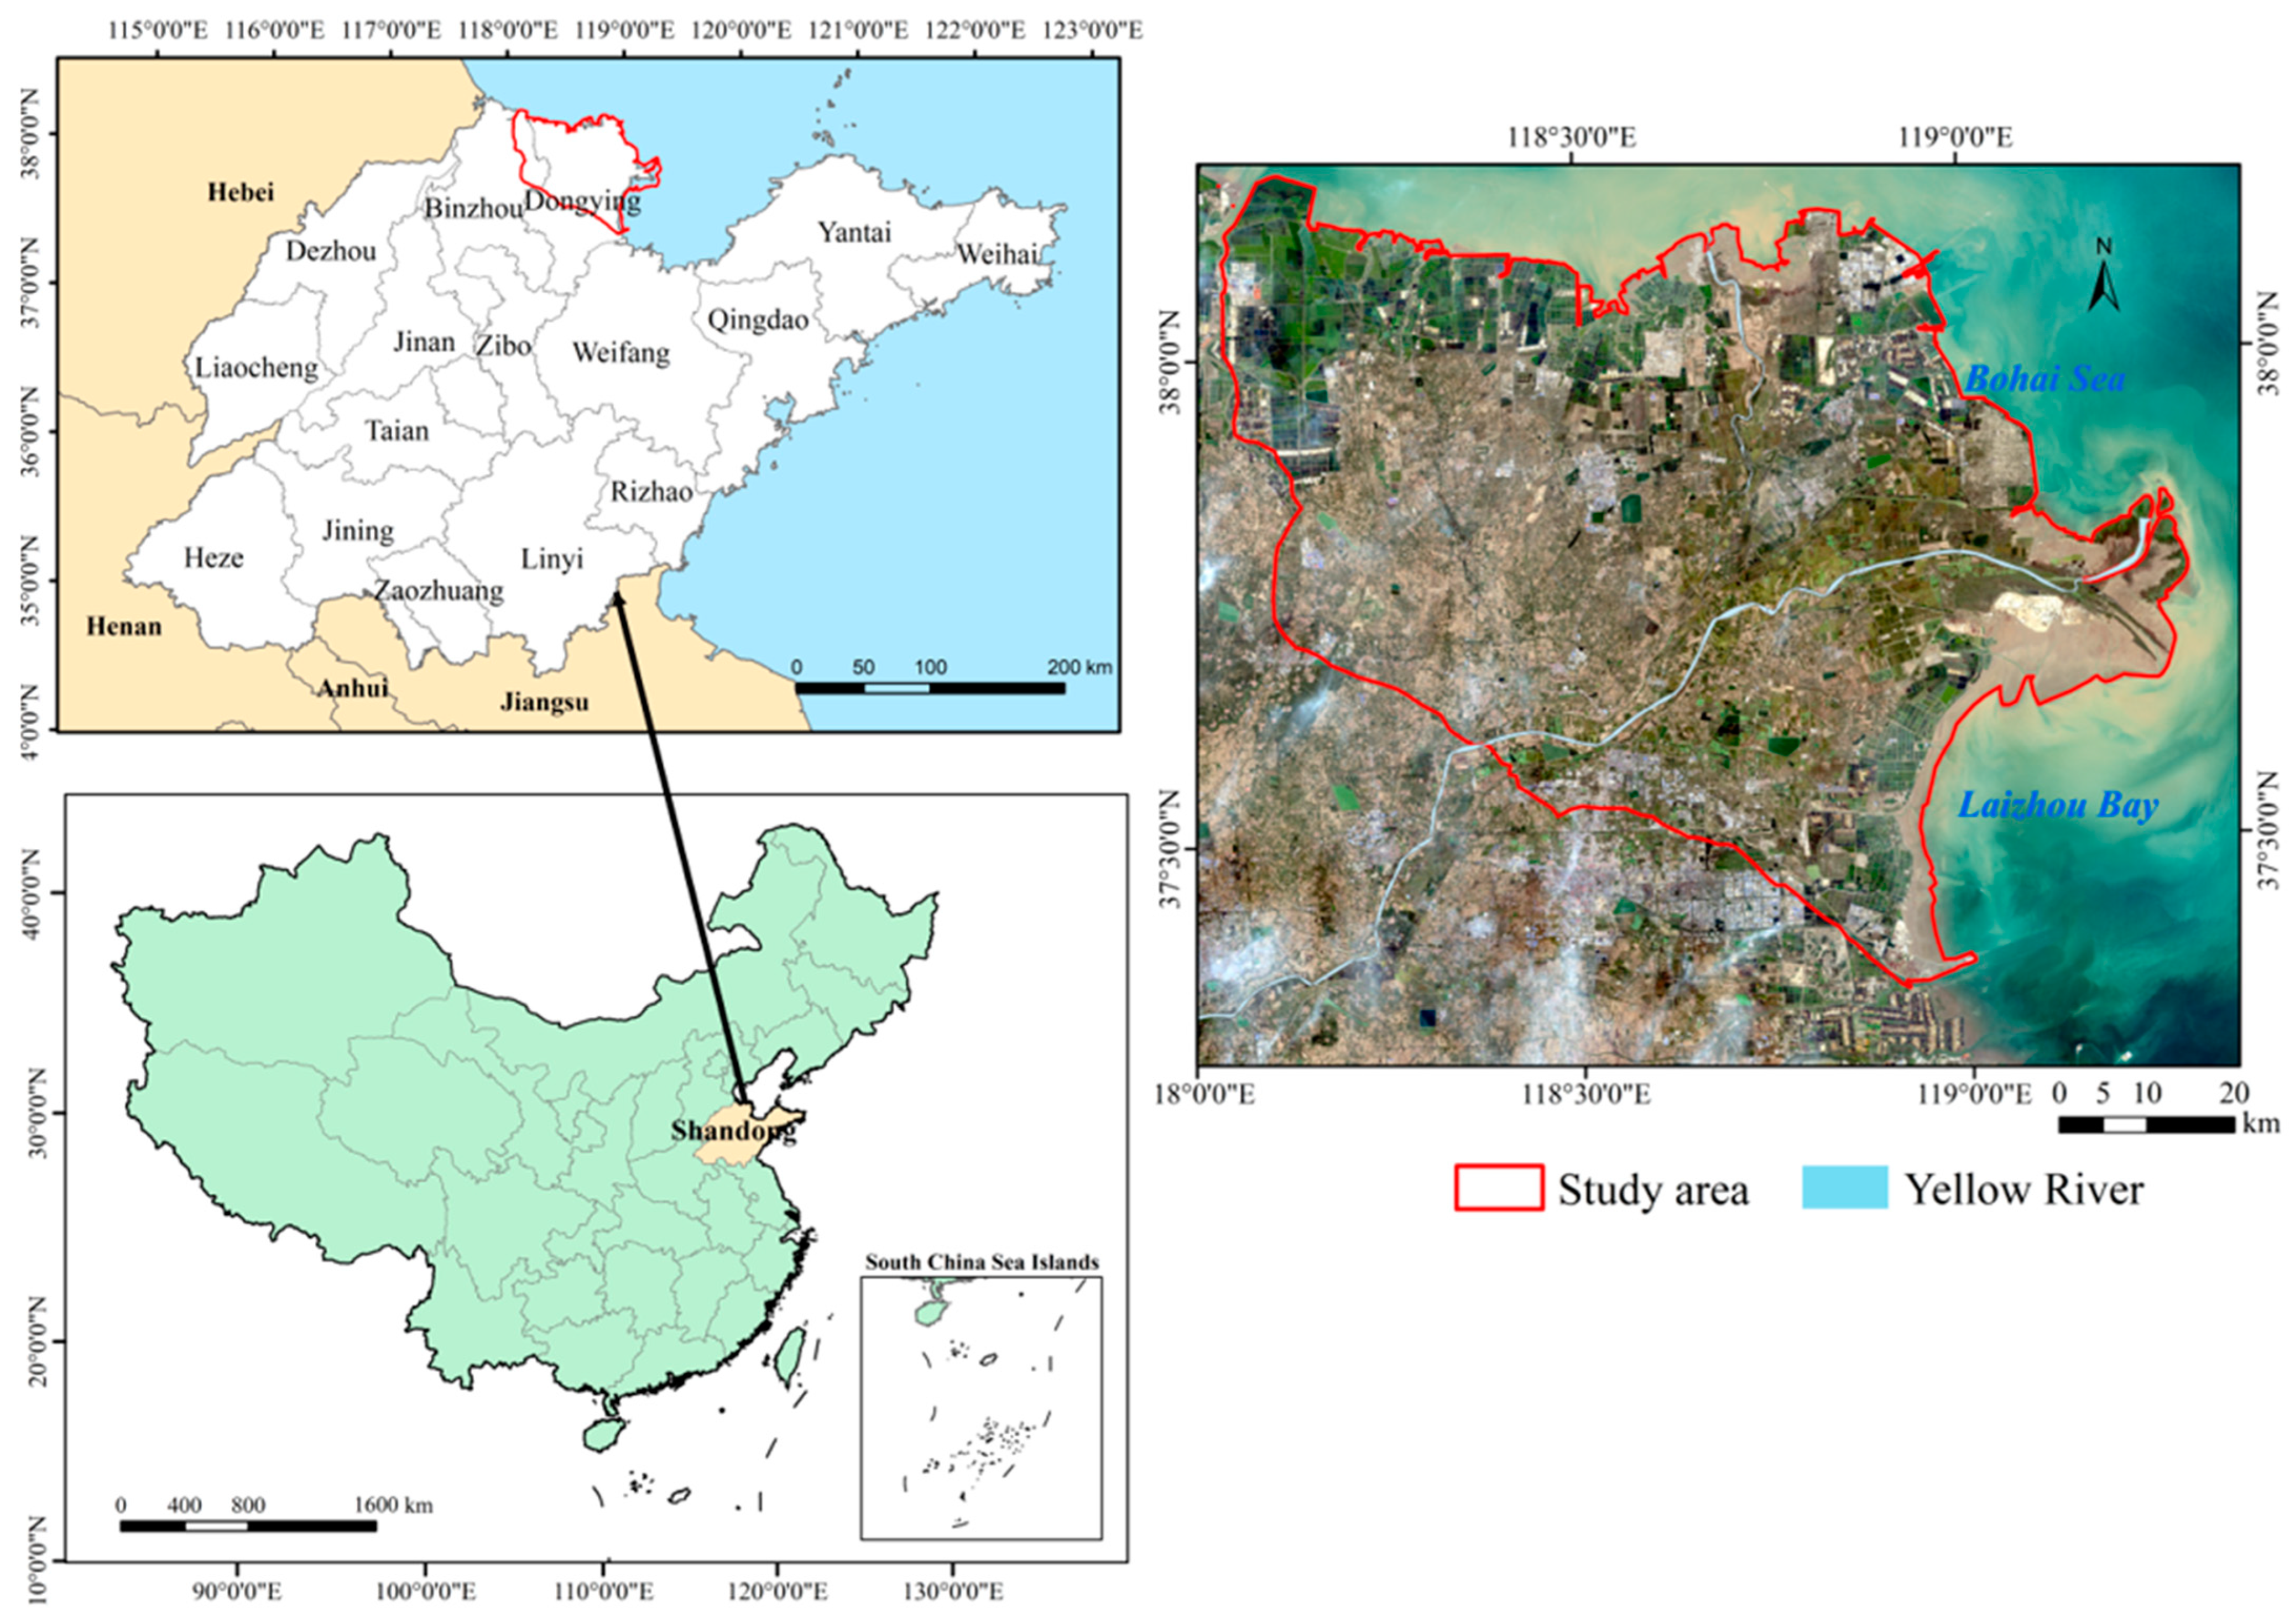
The Yellow River Delta (YRD) is located at the estuary of the Yellow River, on the northern (Bohai Sea) coast of Shandong Province, between 37°40′–38°10′ N and 118°41′–119°16′ E (Figure 1). The region falls within the warm, temperate, semi-humid continental monsoon climate zone. The temperature difference between the four seasons is noticeable, with the highest annual temperature reaching 41.9 °C and the lowest dropping to −23.3 °C. The average annual temperature ranges between 11.7 and 12.6 °C. The soil texture is predominantly loamy and mainly consists of the sediments of the Yellow River [4,31,32,33]. However, soil salinization is common due to land–sea interactions and improper land exploitation. Water resources are abundant, contributing significantly to the ecological value of the region. Considering the abundant biodiversity and ecological functions, China established the “Yellow River Delta National Nature Reserve” in 1992, and then the YRD was included in the United Nations “International Important Wetlands Directory” in 2013. The modern delta is the research object of this paper.
The “Development Plan for High-efficiency Ecological Economic Zone in the Yellow River Delta” serves as a national development policy. Socio-economic development is helpful to improve the human well-being of delta residents, improving factors such as their income, transportation, communication, and education conditions, etc. However, against a background of economic construction and land development, the land use and ecological environment in the YRD have changed significantly. Moreover, these socio-economic development activities have inevitably placed tremendous pressure on the local resources and environment, and regional ecosystem services and human well-being have gradually been impacted directly or indirectly.
2.2. Data Sources
The data sources included remote sensing data, physical geographic data and social-economic data, as follows.
The remote sensing data were sourced from Landsat and MODIS (Table 1); the Landsat data were obtained from the Geospatial Data Cloud (https://www.gscloud.cn/ (accessed on 1 September 2022)), and the MODIS series data were acquired from the LAADS DAAD from NASA (https://ladsweb.modaps.eosdis.nasa.gov/ (accessed on 18 October 2022)).
The physical geographic data included meteorological data and digital elevation model (DEM) data. The meteorological data were sourced from the National Climatic Data Center (NCDC) dataset (www.ncei.noaa.gov/products/land-based-station/integrated-surface-database (accessed on 29 November 2022)), covering the period from 2000 to 2019 for the study area and surrounding meteorological stations. The dataset comprises four meteorological elements: temperature, atmospheric pressure, dew point, and wind speed. DEM data came from the Geospatial Data Cloud (https://www.gscloud.cn/ (accessed on 14 February 2023)), with a spatial resolution of 30 m.
The social–economic data included road network data and tourist attraction data. The road network data primarily originated from the National Road Network dataset, encompassing various types of roads such as urban main roads, urban expressways, urban branch roads, highways, internal roads, sidewalks, village roads, and bicycle lanes. These data were obtained from OpenStreetMap (https://www.openstreetmap.org/ (accessed on 14 February 2023)). Tourist attraction data were obtained by traversing a map website (https://you.ctrip.com (accessed on 14 February 2023)) using code scripts. Under the broad category of tourist attractions, subcategories included scenic spots, religious sites, parks, aquariums, squares, and memorials, among others.
2.3. Research Methods
2.3.1. Remote Sensing Data Preprocessing
Landsat remote sensing data underwent FLAASH atmospheric correction using ENVI 5.6 software. Supervised classification was employed to obtain land use data for the study area, where land use types included cropland, grassland, construction land, water, and bare land. In this study, forest land was not included in the land use types due to the predominant presence of saline alkali land in the Yellow River Delta region. Forests are sparsely distributed and occupy a relatively small area. Additionally, MODIS data underwent reprojection using the IDL programming language. All images were standardized to the 2000 National Geodetic Coordinate System (CGCS2000) and subsequently cropped. Finally, the Normalized Difference Vegetation Index (NDVI) was calculated.
2.3.2. Evaluation Method of Ecosystem Service Value
In this study, we adjusted the numerical values of ESVs according to the actual conditions of the study area. Working with the data available, the annual economic value of grain production (wheat, rice, corn, millet, sorghum, soybeans, and potatoes) per unit area in the YRD in 2019 was calculated and used to adjust the numerical ESVs. The calculated economic value for each unit of ecosystem services in the study area was CNY 1605.834 per hectare per year. Then, utilizing the “China Land Ecosystem Unit Area Service Value Equivalent Table” proposed by Xie et al., we calculated the ecosystem service value of different land use types and the study area of the YRD [34].
We applied Formula (1) to calculate the ESVs of different land use types in the YRD.
where is the ESV per unit area for the j-th land use type (cropland, grassland, construction land, water area, or bare land); is the ecosystem service value equivalent of the i-th ecosystem services of a certain land use (Table 2); k is the number of ecosystem service types; and is the economic value of one unit of an ecosystem service (1605.834 CNY/hm2).
The economic value of the YRD region’s ecosystem services was calculated using Formula (2):
where is the total ecosystem service value of the study area, is the area of the j-th land use type, and is the ecosystem service value per unit area for different land use types.
2.3.3. Analysis of the Driving Factors of Dynamic Variations in Ecosystem Services
The variation in the quantity and quality of ecosystems is affected by both natural environmental conditions and human socio-economic activities, and, accordingly, we selected eleven potential influencing factors to identify the main driving factors, i.e., the temperature, dew point temperature, atmospheric pressure, wind speed, DEM, slope, aspect, distance to river, NDVI, concentration of tourist resources, and transportation convenience, which were used as independent variables (Table 3). Our spatial analysis methods included Kriging interpolation, Euclidean distance analysis, and kernel density analysis, which were conducted to obtain a spatial dataset of driving factors. Moreover, all driving factor data were classified into five levels using the natural breakpoint method.
The Geo-detector model was proposed by Wang and Xu, and was aimed at revealing the spatial differentiation of geographical objects and exploring the dominant driving factors of spatial and temporal distributions [35]. In this study, the factor detection and interaction detection methods included in the model were selected to detect the spatial impact of the aforementioned factors on ecosystem services. During the model calculation process, the ecosystem service value was regarded as a dependent variable, and the factors were used as independent variables at the grid scale (3.5 km × 3.5 km). In the Geo-detector model, the explanatory power (q-value) result is used to describe the driving effect on ESVs’ spatial heterogeneity for different driving factors, and the larger the value, the greater the driving effect. The calculation formula is as follows [35]:
where h = 1, …, L represents the stratum of the independent variable, Nh and N are the number of units in stratum h and the entire study area, respectively, and σ is the variance. After the explanatory powers (q-values) of each driving factor was obtained, the combined effect index between different driving factors can be calculated. Then, the interaction relationships between them and the degrees of interaction could be identified, according to the criteria shown in Table 4.
3. Results
3.1. Land Use Changes in the Yellow River Delta
During 2000 to 2019, the area of cropland, grassland, and bare land experienced a significant decrease, and the area of water and construction land displayed a significant increasing trend (Table 5). During 2010 to 2015, the area of construction land grew the fastest, with a growth rate of 3.92%, coinciding with the fast industrialization in China. The water area grew from 2000 to 2015; however, from 2015 to 2019, there was a decline. The water area in this study includes wetlands distributed in coastal areas (Figure 2), and in terms of spatial distribution, coastal areas have larger water areas compared to inland areas. Additionally, we noted that the water area in the northwest region was greater than that in the southeast region. The areas of grassland and bare land experienced fluctuations, but the overall trend was a decline.
The transition relationships between land use are shown in Table 6. The increase in construction land was mainly derived from cropland and bare land; the proportion of the land transferred was approximately 32.4% and 10.6%. At the same time, a large proportion of water areas was also transferred from cropland and bare land; the proportion of the land transferred was approximately 25.67% and 40.49%. The grassland was mainly converted to cropland, with about 43.1% of grassland transferred to cropland.
3.2. Spatiotemporal Dynamics of Ecosystem Service Values in the Yellow River Delta
The ESV results for different land use types in the YRD showed that the value of the water area was the highest at CNY 222.91 × 10⁸ in 2019, contributing to 65.20% of the ESV in the YRD, marking an increase of 1.5-fold when compared with 2000 (Table 7). The following land uses contributed to ESVs: bare land (26.99%), cropland (7.69%), and grasslands (0.11%), whose values all decreased from 2000 to 2019. It is noteworthy that regulation services constituted the largest proportion of the total ecosystem services, amounting to 77.59% in 2019.
The total ESV in the YRD was CNY 236.06 × 10⁸ in 2000 and CNY 341.88 × 10⁸ in 2019, revealing a growth of 44.82% (Table 8). The trend in ecosystem service changes could be divided into two periods: a rapid growth (2000–2015) and a slow decline (2015–2019). In terms of the various ecosystem services (supply services, regulation services, support services, and cultural services), regulation services contributed the largest proportion to the total, amounting to 68.55% and 77.59% of the total ecosystem services in 2000 and 2019, respectively. Furthermore, among these various ecosystem services, the values of supply and regulation services increased, especially the latter, which increased from CNY 161.82 × 10⁸ in 2000 to CNY 265.27 × 10⁸ in 2019, showing a growth rate of 63.93%. Meanwhile, during 2000 to 2019, support services and cultural services exhibited slight reductions, decreasing by approximately CNY 3.82 × 10⁸ and CNY 0.92 × 10⁸, respectively.
We generated statistics and graphics of the ESVs of the YRD on the grid scale (3.5 × 3.5 km), and then min–max normalization was conducted. Normalized data on ecosystem service values were comprehensively arranged. By analyzing the span between data, artificial breakpoints were established, resulting in the following five levels: low service values (0 < ESVs ≤ 0.1), relatively low service values (0.1 < ESVs ≤ 0.2), moderate service values (0.2 < ESVs ≤ 0.4), relatively high service values (0.4 < ESVs ≤ 0.6), and high service values (0.6 < ESVs ≤ 1.0). In this way, we charted the spatiotemporal evolution of ESVs in the YRD, as shown in Figure 3. Overall, the spatial pattern of ESVs in the YRD showed high values in coastal areas and low values in inland regions. Furthermore, the ESVs of the Yellow River estuary (southeast coast of the study area) and the Yellow River old channel estuary (northwest coast of the study area) were significantly higher than those of the other regions. Moreover, the spatial distribution of YRD ecosystem services and natural ecosystems (water, barren land, and grassland) had a strong spatial consistency. When we considered their evolution over time, the ESVs in coastal areas, especially in the northwest coastal region, showed a significant increase, while the ESVs in the inland areas were relatively low and changed insignificantly.
3.3. Exploring the Driving Factors of Ecosystem Services in the Yellow River Delta
The q statistics results of various factors from 2000 to 2019 are shown in Table 9. It can be found that although the q statistics value of the driving factors changed, the variation in the relative importance order is not significant. The NDVI, aspect, and slope exhibit a high explanatory power for the spatial heterogeneity of ESVs; the elevation, dew point temperature, pressure, wind speed, and temperature have weaker effects; and finally, the traffic convenience, river distance, and tourist resource aggregation have the weakest explanatory ability. This same order was also found for the average annual effect; in descending order, the values for the factors were as follows: relative NDVI (0.43507) > aspect (0.29602) > slope (0.25184) > elevation (0.19836) > dew point temperature (0.19070) > pressure (0.14962) > wind speed (0.12308) > temperature (0.09850) > traffic convenience (0.08003) > river distance (0.05897) > tourist resource aggregation (0.03401). In sum, we found that the ground conditions, including vegetation cover (NDVI) and topographical factors (slope and aspect), were the primary driving factors for ESVs in the YRD, while other factors had weaker impacts.
When comparing the q values of the driving factors over different years, it was found that the driving forces of the NDVI, aspect, slope, traffic convenience, and concentration of tourist resources showed a consistent increasing trend from 2000 to 2015 and then leveled out before experiencing a slight decline in 2019. Furthermore, although the human activity factors, tourist resource concentration, and traffic convenience had comparatively minor effects on ecosystem services, when we compared 2000 with 2019, we found that there was an increasing trend regarding their effects over time, indicating that human activities are increasingly influencing the ecosystem services in the study area. Overall, most of the factors significantly impacted the spatial and temporal heterogeneity in ecosystem services in the YRD, with the tourist resource concentration marking the only exception (the p values of all other factors were less than 0.05).
3.4. Interaction Effects of Ecosystem Service Driving Factors in the Yellow River Delta
The results of our investigation of the interaction of factors in the YRD from 2000 to 2019 are shown in Figure 4. In 2000, the explanatory powers of the mutual interactions between the NDVI and the other factors were the greatest, indicating that the combined effect of the interactions of both the NDVI with other factors had a great influence on the spatial and temporal distribution of ESVs in the YRD. After this, WS (wind speed) and SA (aspect), WS and TEMP1 (temperature), and WS and PES (pressure) also had relatively high interaction effects, with values of approximately 0.4 (Figure 4a). As shown in Figure 5, just over half of the interactions in 2000 took the form of bilinear enhancement, which accounted for 52.8% of all factor interactions. More specifically, the interaction effects of the NDVI and RD (river distance), the NDVI and TS (tourist resource aggregation), and the NDVI and TC (traffic convenience) on ecosystem services produced nonlinear enhancements, while the interaction effects of all other factors produced bilinear enhancements.
Compared with 2000–2005, in more recent years, an increasing number of factors were found to have produced nonlinear enhancements through their interaction effects (Figure 5). We observed that from 2005 to 2015, the predominant pattern was nonlinear enhancement, which accounted for 58.2%, 65.4%, and 63.6% of all factor interaction effects in 2005, 2010, and 2015, respectively. Moreover, as time progressed during the study period (from 2000 to 2015), most factors began to exhibit stronger interactions with one another, with the maximum interaction effect increasing from 0.442 to 0.596, as shown in Figure 4. The comprehensive interactions of these factors in later years should have promoted an increase in efficiencies in the tourism sector in the YRD. In particular, strong interaction effects were observed between the NDVI and other factors from 2005 to 2015; the NDVI and RD (river distance) exhibited the highest interaction effect, followed by the NDVI and WS (wind speed), the NDVI and PES (pressure), the NDVI and TEM1 (temperature), and the NDVI and TC (traffic convenience). We also found that although the single-factor explanatory power of river distance on ESVs was weak, the interaction between river distance and the NDVI produced a strong nonlinear enhancement effect. This shows that we should not neglect driving factors with weaker effects, but should pay attention to their interplay with other factors and the progression of these interactions over time.
When comparing 2015 with 2019, we noted that the number of nonlinear enhancement factors decreased significantly, bringing about a return to a predominant pattern of bilinear enhancement (Figure 5), which accounted for 54.5% of all factor interactions by 2019. At this time, most factors still demonstrated high interaction effects, with values of approximately 0.48. In addition to the interactions between the NDVI and other factors, the interactions between the SA (aspect) and TEM1 (temperature), the SA and PES (pressure), the SA and WS (wind speed), and the PES and TC (traffic convenience) were also strong (Figure 4). Specifically, we noted increasingly high interaction effects involving natural environmental factors, indicating that the explanatory power of natural resource environments in contributing to ecosystem service values is rising. This indicates that, given the interplay between resources and the environment, the improvement in ecosystem service values requires effective regulation of the ecosystem. Additionally, it is essential not to overlook the consistently high interaction of human activities with the ecosystem, emphasizing the need for attention to be paid when formulating relevant regulations.
In sum, during the study period from 2000 to 2019, the interactions between the NDVI and other factors always had the greatest impact, indicating that the combined effects of the NDVI with other factors are the largest influencers of the spatial and temporal distributions of ESVs in the YRD. Among the various factor interactions, those between the NDVI and human activities (tourist resource aggregation, traffic convenience) showed significant nonlinear enhancement, indicating that synergistic interactions of human activities (traffic, tourism) with the NDVI have a great capacity to promote ecosystem services in the YRD. Furthermore, when we categorized the driving factors, we found that the interaction between the meteorological phenomena (temperature, dew point temperature, pressure, wind speed) and topographical factors (elevation, slope, aspect) was approximately 0.3–0.4, which is higher than the interaction between the factors of meteorological phenomena and human activity (river distance, tourist resource aggregation, traffic convenience). Furthermore, the interaction between the factors of meteorological phenomena and human activity affected the ecosystem service values in the YRD mainly through bilinear enhancement, while the interaction between the factors of meteorological phenomena and topographical mainly exhibited nonlinear enhancements. Meanwhile, the interaction value between human activity factors and topographical factors was approximately 0.3–0.4, which is higher than the interaction effects between human activities and other factors, potentially since human activities are always constrained by topographic factors such as elevation and slope.
4. Discussion
4.1. Spatiotemporal Dynamics of LUCC and ESVs in the YRD
Since 2009, the region has seen rapid urbanization and socioeconomic growth, and construction land expansion in the inland delta has encroached on large amounts of cropland. Accordingly, from 2000 to 2019, cropland gradually decreased, while construction land increased by 47.27%. A previous study found that wetland predominated the water body types in the YRD [36], and in this study, water and wetland ecosystems were considered together, termed the “water areas”, rather than contemplating the transition between them. We took this approach since they both have high ESVs and serve several important and unique ecological functions, such as biodiversity preservation, water resource conservation, ecological balance maintenance, and cultural services [37,38]. From 2000 to 2019, the water area increased 1.5-fold in the northwest coastal areas of the YRD. The increase in water area was primarily related to wetland ecosystems, including intertidal zones, and the constantly expanding sea salt production area and shrimp aquaculture ponds in the YRD [39]. Cropland and bare land serve as the principal sources for the transfer to wetlands. Meanwhile, grasslands had a significant ecosystem service value in the YRD, given their strong ability to maintain water and soil [26,40]. Transitions from grassland to water areas or construction land mainly occurred in the southeast estuary of the YRD.
Against the background of urbanization, land use in the YRD changed rapidly and triggered temporal–spatial variations in the ecosystem services provided. In 2019, the ESVs of the YRD increased when compared with 2000, which is in line with the findings of Zhang [7]. The value of the water area was the highest at CNY 222.91 × 10⁸ in 2019, contributing to 65.20% of the ESV in the YRD, marking a 1.5-fold increase when compared with 2000. It is noteworthy that regulation services constituted the largest proportion of the total ecosystem services, amounting to 77.59% in 2019. These are provided by natural ecosystems such as water, grasslands, and bare land, indicating that the ecological environment of the YRD should be protected and maintained. Furthermore, our investigation into spatial variation mainly showed that the northwest of the YRD experienced a significant increase in water areas due to the expansion of coastal aquaculture between 2000 and 2019, leading to a notable improvement in service values, and the southern region witnessed a continuous increase in construction land formed from cropland, grassland, and bare land, resulting in decreased ecosystem values.
4.2. Suggestions for Land Use and Ecosystem Service Improvements in the YRD
Given the dominant role of water in contributing to ecosystem service values, efforts should be focused on restoring and constructing water ecosystems. In terms of land use, intensive efforts should be made to address land salinization and increase vegetation coverage, promoting soil and water conservation. To achieve such goals, a strategic plan should be formed for the overall spatial layout of the region, the management of water body areas along the coastlines should be enhanced, and water storage in inland areas should be expanded through measures such as building reservoirs. Additionally, through this investigation and survey, we found that the area of aquaculture in the YRD significantly increased in the later years studied. Studies have pointed out that the increased aquaculture areas are mainly transformed from wetland ecosystems such as mudflats in the YRD; this kind of land use transition is always accompanied by destruction of wetland ecosystems [12,41]. To resolve this problem, we recommend strict management of the coastal mudflats and other habitats for wildlife to prevent poaching and damage to the natural landscapes. We also found that the expansion of aquaculture areas increased the water area and the ecosystem service valuation of northwest coast of the study area, but from the perspective of biodiversity and ecological function, it caused a degradation of the ecosystem and its functions. Therefore, a comprehensive evaluation, integrating indicators such as biodiversity and its functions, should be conducted to accurately reveal the dynamic evolution characteristics of ecosystem services.
Because agricultural production land encroached on the natural vegetation ecosystem in the YRD, 43.1% of grassland was transferred to cropland and 36.7% of bare land was converted to water areas (including a portion of aquaculture land) and construction land. Therefore, more attention should be paid to protecting and improving the natural vegetation ecosystems in the study area. Furthermore, we found that the inland area of the delta region with a high population density always exhibited lower ecosystem service values when compared with the coastal areas. This spatial mismatch between the demand and supply of ecosystem services could be optimized by protecting and increasing the water areas, grasslands, and wetlands in areas with concentrated populations during their economic development [42,43,44]. In this sense, it is essential to enhance vegetation coverage in the YRD, strictly adhere to the redline for cropland, optimize the relationship between humans and the land, and, when developing, consider both the economic benefits and ecological risks brought to the local area.
The spatial heterogeneity of ESVs results from the combined influences of various factors, mainly natural and socioeconomic factors. Therefore, it is critical to comprehensively consider the impacts of various factors on ecosystem services when developing regulatory measures for the YRD. Through our driving factor analysis, we found that the NDVI was the main factor influencing ecosystem services, but the combined effects of different factors were superior to those of any single factor, which is in line with the findings of [18,45]. The NDVI is intricately linked with land use/cover within the realms of remote sensing and environmental research. The NDVI serves as an indicator of changes in land use/cover by quantifying the density and health of vegetation cover on the Earth’s surface. The interactions between the NDVI and human activity factors (traffic, tourism) took the form of nonlinear enhancement, indicating that there was synergy between these factors in the promotion of ecosystem services in the YRD. On this basis, we propose that attention should be paid to the potential ecological damage caused by the development of the infrastructure and tourism industry. Specifically, we recommend regularly assessing the region’s ecological carrying capacity, promptly identifying problems, and making timely adjustments. Furthermore, when developing the road infrastructure for tourism, permeable road surfaces should be laid to ensure the supply of groundwater resources.
Finally, we found that the main driving factors (NDVI, slope, aspect, DEM) of ecosystem services in the YRD were all related to the accumulation of water resources and improvements in regional ecosystem services. In agreement with this, previous studies noted that the NDVI reflects the vegetation coverage, and a higher vegetation coverage tends to reduce the evaporation of surface water, favoring water retention [46]. A greater slope, meanwhile, leads to lower water retention in the soil. Additionally, the varying radiation coverage of different slopes influences evapotranspiration, which affects the accumulation of water resources [47,48]. Research by Jia and others indicated that there may be a synergistic relationship between slope and aspect regarding water resource accumulation [49]. Beyond this, the DEM directly reflects the undulation of the Earth’s surface (e.g., geographical depressions), and the presence of elevation differences promotes the aggregation of water resources, such as through the formation of rivers and lakes.
4.3. Research Limitations and Future Prospects
Compared with previous studies, this study improved the temporal resolution to reveal the dynamic spatiotemporal changes in regional ecosystem services. The identification and analysis of dynamic features were carried out in 5-year intervals, and detailed dynamic identification results have been obtained from two aspects: change characteristics and driving factors. However, the data were not collected in yearly intervals; therefore, the problem of insufficient accuracy still exists. Furthermore, the important turning points of dynamic variation cannot be highlighted. Therefore, in response to these shortcomings, we recommended conducting detailed research on dynamic feature recognition and driving factor analysis on an annual scale to construct a detailed spatiotemporal dynamic evolution map and accurately reveal the evolution and driving mechanisms.
This study analyzed the driving factors of ecosystem service values in the YRD over the past two decades. We selected 11 factors for a driving analysis, which involved multiple aspects such as natural and socio-economic factors. However, due to limitations in data availability and accuracy, 80% of them were natural environmental factors, and the proportion of factors in the socio-economic field was relatively low, which did not support a comprehensive investigation of the intensity of human activities. In the future, in-depth research should be conducted using additional factors such as impermeable surfaces and GDP. Furthermore, while we inferred from the results that the synergistic interaction of human activity factors and environmental factors has a high explanatory power for ecosystem service values, the precise mechanisms for how they collaborate are unclear, and we lack quantitative data support for any ideas we have. In future research, we recommend that these mechanisms should be uncovered and verified.
5. Conclusions
In this study, we explored the change in land use and the dynamic evolution of ecosystem services in the YRD. By applying the ecosystem service value equivalent method, geographic information technology, and a Geo-detector model, we identified the temporal–spatial variation in land use and ESVs and the driving factors involved. We also analyzed the effects of factor interaction on the temporal–spatial heterogeneity of ESVs in the YRD from 2000 to 2019 in smaller time intervals. The results indicated that land use in the YRD changed substantially over the study period, with the most prominent changes being the expansion of water areas and construction land from 2000 to 2019. As for ESV variations, the ESVs of the YRD exhibited a trend of increasing followed by a decline, where the overall service value increased by CNY 118.15 × 10⁸ from 2005 to 2015 and then slightly decreased by CNY 12.36 × 10⁸ from 2015 to 2019. The distribution pattern of ecosystem service values in the YRD revealed higher values along the coast than inland. Then, when considering their evolution over time, we found that the ecosystem service values in coastal areas, especially in the northwest coastal region, significantly increased over the study period; meanwhile, the ESVs in the inland areas of the delta were relatively low and changed insignificantly. The results of our driving factor analysis showed that the ground conditions, including vegetation cover and topographical factors (such as slope and aspect), primarily shaped the ESVs in the YRD. Additionally, the explanatory power of tourist resource aggregation generally showed an increasing trend, indicating that human social activities became significant. The combined effects of the NDVI with other factors had the greatest impacts on the spatial and temporal heterogeneity of ESVs in the YRD. In particular, the NDVI and human activity factors (tourist resource aggregation, traffic convenience) interacted synergistically, meaning that they had a considerable impact on ecosystem service values.
Author Contributions
Conceptualization, Y.X. and L.Y.; methodology, Y.X. and S.X.; software, S.X.; validation, Y.X., S.X. and L.Y.; formal analysis, C.L.; investigation, S.X.; resources, Y.X.; data curation, S.X.; writing—original draft preparation, S.X.; writing—review and editing, Y.X., C.L. and L.Y.; visualization, S.X.; supervision, S.X. and L.Y.; project administration, Y.X. and L.Y.; funding acquisition, Y.X. and L.Y. All authors have read and agreed to the published version of the manuscript.
Funding
This study was supported by the Humanities and Social Science Project of the Ministry of Education of China (20YJCZH198); the Natural Science Foundation of Shandong Province (ZR2021QD093, ZR2021MD095); the Humanities and Social Science Project of Shandong Province (2021-JCGL-03); and the National Statistical Science Research Project (2023LY084).
Institutional Review Board Statement
Not applicable.
Informed Consent Statement
Not applicable.
Data Availability Statement
The authors have no data to share.
Acknowledgments
The authors would like to thank the editors and reviewers of this manuscript.
Conflicts of Interest
The authors declare no conflicts of interest.
References
- Li, Y.; Jia, L.; Wu, W.; Yan, J.; Liu, Y. Urbanization for rural sustainability–Rethinking China’s urbanization strategy. J. Clean. Prod. 2018, 178, 580–586. [Google Scholar] [CrossRef]
- Peng, J.; Wang, X.; Liu, Y.; Zhao, Y.; Xu, Z.; Zhao, M.; Qiu, S.; Wu, J. Urbanization impact on the supply-demand budget of ecosystem services: Decoupling analysis. Ecosyst. Serv. 2020, 44, 101139. [Google Scholar] [CrossRef]
- Wu, J.; Fan, X.; Li, K.; Wu, Y. Assessment of ecosystem service flow and optimization of spatial pattern of supply and demand matching in Pearl River Delta, China. Ecol. Indic. 2023, 153, 110452. [Google Scholar] [CrossRef]
- Wang, C.; Li, X.; Yu, H.; Wang, Y. Tracing the spatial variation and value change of ecosystem services in Yellow River Delta, China. Ecol. Indic. 2019, 96, 270–277. [Google Scholar] [CrossRef]
- Small, N.; Munday, M.; Durance, I. The challenge of valuing ecosystem services that have no material benefits. Glob. Environ. Chang. Hum. Policy Dimens. 2017, 44, 57–67. [Google Scholar] [CrossRef]
- Costanza, R.; Arge; Groot, R.D.; Farberk, S.; Belt, M.V.D. The value of the world’s ecosystem services and natural capital. Nature 1997, 387, 253–260. [Google Scholar] [CrossRef]
- Zhang, Z.; Han, L.; Feng, Z.; Zhou, J.; Wang, S.; Wang, X.; Fan, J. Estimating the past and future trajectory of LUCC on wetland ecosystem service values in the Yellow River Delta Region of China. Sustainability 2024, 16, 619. [Google Scholar] [CrossRef]
- Tao, J.; Lu, Y.; Ge, D.; Dong, P.; Gong, X.; Ma, X. The spatial pattern of agricultural ecosystem services from the production-living-ecology perspective: A case study of the Huaihai Economic Zone, China. Land Use Policy 2022, 122, 106355. [Google Scholar] [CrossRef]
- Xie, G.; Lu, C.; Kui, C. Progress in evaluation the global ecosystem services. Resour. Sci. 2001, 23, 5–9. [Google Scholar]
- Xie, G.; Zhen, L.; Lu, C.; Xiao, Y.; Chen, C. Expert knowledge based valuation method of ecosystem services in China. J. Nat. Resour. 2008, 23, 911–919. [Google Scholar]
- Zhang, X.; He, S.; Yang, Y. Evaluation of wetland ecosystem services value of the yellow river delta. Environ. Monit. Assess. 2021, 193, 353. [Google Scholar] [CrossRef]
- Yan, J.; Zhu, J.; Zhao, S.; Su, F. Coastal wetland degradation and ecosystem service value change in the Yellow River Delta, China. Glob. Ecol. Conserv. 2023, 44, e02501. [Google Scholar] [CrossRef]
- Hu, M.; Li, Z.; Wang, Y.; Jiao, M.; Li, M.; Xia, B. Spatio-temporal changes in ecosystem service value in response to land-use/cover changes in the Pearl River Delta. Resour. Conserv. Recycl. 2019, 149, 106–114. [Google Scholar] [CrossRef]
- Zhang, X.; Song, W.; Lang, Y.; Feng, X.; Yuan, Q.; Wang, J. Land use changes in the coastal zone of China’s Hebei Province and the corresponding impacts on habitat quality. Land Use Policy 2020, 99, 104957. [Google Scholar] [CrossRef]
- Song, Y.; Li, C.; Jiang, L.; Lu, L. Ecological indicators for immigrant relocation areas: A case in Luanjingtan, Alxa, Inner Mongolia. Int. J. Sustain. Dev. World Ecol. 2015, 22, 445–451. [Google Scholar] [CrossRef]
- Zhang, W.; Zhou, L.; Zhang, Y.; Chen, Z.; Hu, F. Impacts of ecological migration on land use and vegetation restoration in arid zones. Land 2022, 11, 891. [Google Scholar] [CrossRef]
- Liu, X.; Chen, X.; Hua, K.; Wang, Y.; Wang, P.; Han, X.; Ye, J.; Wen, S. Effects of land use change on ecosystem services in arid area ecological migration. Chin. Geogr. Sci. 2018, 28, 894–906. [Google Scholar] [CrossRef]
- Liu, L.; Zheng, L.; Wang, Y.; Liu, C.; Zhang, B.; Bi, Y. Land use and ecosystem services evolution in Danjiangkou Reservoir Area, China: Implications for sustainable management of national projects. Land 2023, 12, 788. [Google Scholar] [CrossRef]
- Wang, Y.; Tang, J.; Wang, W.; Wang, Z.; Wang, J.; Liang, S.; Chu, B. Long-term spatiotemporal characteristics and influencing factors of dust aerosols in East Asia (2000–2022). Remote Sens. 2024, 16, 318. [Google Scholar] [CrossRef]
- Yang, H.; Zhang, X.; Yuan, Z.; Xu, B.; Huo, J. Identifying the spatial heterogeneity and driving factors of satellite-based and hydrologically modeled profile soil moisture. Remote Sens. 2024, 16, 448. [Google Scholar] [CrossRef]
- Deng, G.; Chen, H.H. The spatiotemporal characteristics and driving factors of regional ecological efficiency in the tourism sector. Sustainability 2024, 16, 982. [Google Scholar] [CrossRef]
- Liu, Y.; Liao, H.; Qiu, J.; Liu, Y. Characteristics of spatiotemporal variations and driving factors of land use for rural tourism in areas that eliminated poverty. Land 2023, 12, 910. [Google Scholar] [CrossRef]
- Zhang, E.; Wang, Z.; Chen, G.; Wang, G.; Zhou, Y.; Hu, P.; Zhao, H. Spatial-temporal evolution patterns and influencing factors of hotels in Yellow River Basin from 2012 to 2022. Land 2023, 12, 770. [Google Scholar] [CrossRef]
- Zhang, R.; Zhang, X. Spatial pattern evolution and driving mechanism of rural settlements in rapidly urbanized areas: A case study of Jiangning district in Nanjing city, China. Land 2023, 12, 749. [Google Scholar] [CrossRef]
- Jiang, X.; Wang, Q.; Li, R. Investigating factors affecting carbon emission in China and the USA: A perspective of stratified heterogeneity. J. Clean. Prod. 2018, 199, 85–92. [Google Scholar] [CrossRef]
- Aschonitis, V.G.; Yang, J.; Xie, B.; Wang, S.; Zhang, D.; Liu, C.; Mak-Mensah, E. Temporal and spatial characteristics of grassland ecosystem service value and its topographic gradient effect in the Yellow River Basin. PLoS ONE 2022, 17, e0278211. [Google Scholar]
- Wohlfart, C.; Kuenzer, C.; Chen, C.; Liu, G. Social–ecological challenges in the Yellow River basin (China): A review. Environ. Earth Sci. 2016, 75, 1066. [Google Scholar] [CrossRef]
- Chen, Y.; Fu, B.; Zhao, Y.; Wang, K.; Zhao, M.; Ma, J.; Wu, J.; Xu, C.; Liu, W.; Wang, H. Sustainable development in the Yellow River Basin: Issues and strategies. J. Clean. Prod. 2020, 263, 121223. [Google Scholar] [CrossRef]
- Lan, H.; Peng, J.; Zhu, Y.; Li, L.; Pan, B.; Huang, Q.; Li, J.; Zhang, Q. Research on geological and surfacial processes and major disaster effects in the Yellow River Basin. Sci. China Earth Sci. 2022, 65, 234–256. [Google Scholar] [CrossRef]
- Zhang, T.; Zhang, S.; Cao, Q.; Wang, H.; Li, Y. The spatiotemporal dynamics of ecosystem services bundles and the social-economic-ecological drivers in the Yellow River Delta region. Ecol. Indic. 2022, 135, 108573. [Google Scholar] [CrossRef]
- Wang, C.; Wang, Y.; Geng, Y.; Wang, R.; Zhang, J. Measuring regional sustainability with an integrated social-economic-natural approach: A case study of the Yellow River Delta region of China. J. Clean. Prod. 2016, 114, 189–198. [Google Scholar] [CrossRef]
- Guan, B.; Xie, B.; Yang, S.; Hou, A.; Chen, M.; Han, G. Effects of five years’ nitrogen deposition on soil properties and plant growth in a salinized reed wetland of the Yellow River Delta. Ecol. Eng. 2019, 136, 160–166. [Google Scholar] [CrossRef]
- Fu, Y.; Chen, S.; Ji, H.; Fan, Y.; Li, P. The modern Yellow River Delta in transition: Causes and implications. Mar. Geol. 2021, 436, 106476. [Google Scholar] [CrossRef]
- Xie, G.; Zhang, C.; Zhang, L.; Chen, W.; Li, S. Improvement of the evaluation method for ecosystem service value based on per unit area. J. Nat. Resour. 2015, 30, 1243–1254. [Google Scholar]
- Wang, J.; Xu, C. Geodetectors: Principles and prespects. Acta Geogr. Sin. 2017, 72, 116–134. [Google Scholar]
- Ling, M.; Chen, J.; Lan, Y.; Chen, Z.; You, H.; Han, X.; Zhou, G. Exploring the drivers of soil conservation variation in the source of Yellow River under diverse development scenarios from a geospatial perspective. Sustainability 2024, 16, 777. [Google Scholar] [CrossRef]
- Tolessa, T.; Kidane, M.; Bezie, A. Assessment of the linkages between ecosystem service provision and land use/land cover change in Fincha watershed, North-Western Ethiopia. Heliyon 2021, 7, e07673. [Google Scholar] [CrossRef] [PubMed]
- Xu, Y.; Xie, Y.; Wu, X.; Xie, Y.; Zhang, T.; Zou, Z.; Zhang, R.; Zhang, Z. Evaluating temporal-spatial variations of wetland ecosystem service value in China during 1990–2020 from the donor side based on cosmic exergy. J. Clean. Prod. 2023, 414, 137485. [Google Scholar] [CrossRef]
- Fan, Y.; Chen, S.; Zhao, B.; Yu, S.; Ji, H.; Jiang, C. Monitoring tidal flat dynamics affected by human activities along an eroded coast in the Yellow River Delta, China. Environ. Monit. Assess. 2018, 190, 396. [Google Scholar] [CrossRef]
- Lou, P.; Fu, B.; Liu, H.; Gao, E.; Fan, D.; Tang, T.; Lin, X. Dynamic evaluation of grassland ecosystem services in Xilingol League. Acta Ecol. Sin. 2019, 39, 3837–3849. [Google Scholar]
- Zhang, X.; Liu, L.; Zhao, T.; Chen, X.; Lin, S.; Wang, J.; Mi, J.; Liu, W. GWL_FCS30: A global 30 m wetland map with a fine classification system using multi-sourced and time-series remote sensing imagery in 2020. Earth Syst. Sci. Data 2023, 15, 265–293. [Google Scholar] [CrossRef]
- Villamagna, A.M.; Angermeier, P.L.; Bennett, E.M. Capacity, pressure, demand, and flow: A conceptual framework for analyzing ecosystem service provision and delivery. Ecol. Complex. 2013, 15, 114–121. [Google Scholar] [CrossRef]
- Rahman, M.M.; Szabó, G. Multi-objective urban land Use optimization using spatial data: A systematic review. Sustain. Cities Soc. 2021, 74, 103214. [Google Scholar] [CrossRef]
- Akbari, M.; Neamatollahi, E.; Neamatollahi, P. Evaluating land suitability for spatial planning in arid regions of eastern Iran using fuzzy logic and multi-criteria analysis. Ecol. Indic. 2019, 98, 587–598. [Google Scholar] [CrossRef]
- Zhang, B.; Wang, Y.; Li, J.; Zheng, L. Degradation or restoration? The temporal-spatial evolution of ecosystem services and its determinants in the Yellow River Basin, China. Land 2022, 11, 863. [Google Scholar] [CrossRef]
- Yang, F.; Zhang, K.; Ma, X.; Yang, M.; Yang, J. Effect of vegetation coverage on relative hydrodynamics of overland flows. Shuili Fadian Xuebao/J. Hydroelectr. Eng. 2017, 36, 29–39. [Google Scholar]
- Li, Q.; Cai, Q.; Fang, H.; Wang, C. Analyses of suitability of soil and water conservation measures on sloping cultivated lands with different slopes over the purle soil region in the upper reaches of the Yangtze River. Resour. Sci. 2009, 31, 2157–2163. [Google Scholar]
- Yong, C.; Fan, J.; Wang, S. Effects of slope gradient on the soil saturated hydraulic conductivity of sloping land measured by three single-ring infiltrometers. Sci. Soil Water Conserv. 2018, 16, 24–30. [Google Scholar]
- Jia, H.; Liu, Y.; Xu, X.; Wang, K.; Gao, Q. Simulation of soil water dynamics in a caragana intermedia woodland in Huangfuchuan watershed: Relationships among slope, aspect, plant density and soil water content. Chin. J. Plant Ecol. 2005, 29, 910–917. [Google Scholar]
Figure 1.
Geographical location of the Yellow River Delta.

Figure 2.
Dynamic changes in land use distribution in the Yellow River Delta from 2000 to 2019.

Figure 3.
Spatiotemporal dynamics of ecological service values in the Yellow River Delta from 2000 to 2019.
Figure 3.
Spatiotemporal dynamics of ecological service values in the Yellow River Delta from 2000 to 2019.

Figure 4.
Detection results of interaction factors of ecosystem service driving factors from 2000 to 2019. Note: * represents bilinear enhancement, ** represents nonlinear enhancement.
Figure 4.
Detection results of interaction factors of ecosystem service driving factors from 2000 to 2019. Note: * represents bilinear enhancement, ** represents nonlinear enhancement.

Figure 5.
Bilinear and nonlinear enhancements in ecosystem service driving factors from 2000 to 2019. Note: all of the interactions were significant (p value less than 0.05).
Figure 5.
Bilinear and nonlinear enhancements in ecosystem service driving factors from 2000 to 2019. Note: all of the interactions were significant (p value less than 0.05).


Table 1.
Remote sensing data sources and parameter information.
| Name | Sensor | Spatial Resolution | Temporal Resolution | Selected Year |
|---|---|---|---|---|
| LANDSAT5 | MSS/TM | 30 M | 16-day | 2000, 2005, 2010 |
| LANDSAT8 | OLI/TIRS | 30 M | 16-day | 2015, 2019 |
| TERRA-MODIS | MODIS: Band1, Band2 | 250 M | 0.5-day | 2000, 2005, 2010, 2015, 2019 |
Table 2.
The ecosystem service value equivalents of different land use types in the Yellow River Delta (CNY/hm2).
Table 2.
The ecosystem service value equivalents of different land use types in the Yellow River Delta (CNY/hm2).
| Ecosystem Services | Cropland | Grassland | Construction Land | Water Area | Bare Land | |
|---|---|---|---|---|---|---|
| Supply Services | Food Production | 0.85 | 0.1 | 0 | 0.8 | 0.51 |
| Raw Material Production | 0.4 | 0.14 | 0 | 0.23 | 0.5 | |
| Water Supply | 0.02 | 0.08 | 0 | 8.29 | 2.59 | |
| Regulating Services | Gas Regulation | 0.67 | 0.51 | 0 | 0.77 | 1.9 |
| Climate Regulation | 0.36 | 1.34 | 0 | 2.29 | 3.6 | |
| Environmental Purification | 0.1 | 0.44 | 0 | 5.55 | 3.6 | |
| Hydrological Regulation | 0.27 | 0.98 | 0 | 102.24 | 24.23 | |
| Supporting Services | Soil Conservation | 1.03 | 0.62 | 0 | 0.93 | 2.31 |
| Maintenance of Nutrient Cycling | 0.12 | 0.05 | 0 | 0.07 | 0.18 | |
| Biodiversity | 0.13 | 0.56 | 0 | 2.55 | 7.87 | |
| Cultural Services | Scenic Beauty | 0.06 | 0.25 | 0 | 1.89 | 4.73 |
| Total | 4.01 | 5.07 | 0 | 125.61 | 52.02 | |
Table 3.
Driving factor system of ecosystem services in the Yellow River Delta.
| Classification | Factor Name | Unit | Code | Source |
|---|---|---|---|---|
| Natural Environment | Temperature | °C | TEM1 | NCDC |
| Dew Point Temperature | °C | TEM2 | NCDC | |
| Pressure | kPa | PES | NCDC | |
| Wind Speed | m/s | WS | NCDC | |
| Elevation | m | DEM | EARTHDATA | |
| Slope | ° | SL | EARTHDATA | |
| Aspect | ° | SA | EARTHDATA | |
| River Distance | m | RD | EARTHDATA | |
| Vegetation index | NDVI | TerraModis | ||
| Human Activities | Tourist Resource Aggregation | TS | POI Data | |
| Traffic Convenience | TC | Road Data |
Table 4.
Types of interaction between two independent variables and the dependent variable.
| Criteria | Interaction |
|---|---|
| q(X1∩X2) < Min(q(X1), q(X2)) | Weaken, nonlinear |
| Min(q(X1), q(X2)) < q(X1∩X2) < Max(q(X1), q(X2)) | Weaken, univariate, nonlinear |
| q(X1∩X2) > Max(q(X1), q(X2)) | Enhance, bilinear |
| q(X1∩X2) = q(X1) + q(X2) | Independent |
| q(X1∩X2) > q(X1) + q(X2) | Enhance, nonlinear |
Table 5.
Land use changes in the Yellow River Delta from 2000 to 2019 (hm2).
| Land Use Types | 2000–2005 | 2005–2010 | 2010–2015 | 2015–2019 |
|---|---|---|---|---|
| Cropland | −8874.27 | −21,290.40 | −21,974.94 | −6925.86 |
| Grassland | −2343.42 | 1665.72 | −3207.87 | −847.08 |
| Water area | 18,277.83 | 23,428.17 | 38,929.05 | −9783.99 |
| Bare land | −8142.48 | −11,795.40 | −28,928.88 | 9469.08 |
| Construction land | 1082.34 | 7991.91 | 15,182.64 | 8087.85 |
Table 6.
Land use transition matrix of the Yellow River Delta from 2000 to 2019 (hm2).
| 2019 | Cropland | Grassland | Water Area | Bare Land | Construction Land | Total | |
|---|---|---|---|---|---|---|---|
| 2000 | |||||||
| Cropland | 311,551.56 | 1765.54 | 22,266.75 | 9529.20 | 25,324.35 | 370,437.39 | |
| Grassland | 3135.20 | 1350.78 | 758.38 | 1283.62 | 745.87 | 7273.85 | |
| Water area | 3913.19 | 51.56 | 22,785.55 | 3385.21 | 1054.48 | 31,189.99 | |
| Bare land | 3861.74 | 492.37 | 35,125.98 | 70,563.08 | 8312.81 | 118,355.97 | |
| Construction land | 1009.42 | 3.36 | 5809.23 | 2634.23 | 42,788.15 | 52,244.40 | |
| Total | 323,471.11 | 3663.61 | 86,745.88 | 87,395.35 | 78,225.65 | 579,501.60 | |
Table 7.
Ecosystem service value of different land use types (×108 CNY).
| Land Use | 2000 | 2005 | 2010 | 2015 | 2019 | Change Ratio (%) |
|---|---|---|---|---|---|---|
| Cropland | 30.1 | 29.53 | 28.16 | 26.75 | 26.3 (7.69%) | −3.8 |
| Grassland | 0.77 | 0.58 | 0.71 | 0.45 | 0.38 (0.11%) | −0.39 |
| Water | 79.99 | 116.86 | 164.12 | 242.64 | 222.91 (65.20%) | 142.91 |
| Bare land | 125.2 | 118.4 | 108.54 | 84.38 | 92.29 (26.99%) | −32.91 |
| Total | 236.06 | 265.37 | 301.54 | 354.22 | 341.88 |
Table 8.
Ecosystem service values of the Yellow River Delta from 2000 to 2019 (×108 CNY).
| Ecosystem Services | 2000 | 2005 | 2010 | 2015 | 2019 | Change |
|---|---|---|---|---|---|---|
| Supply services | 24.18 (10.24%) | 26.25 | 28.65 | 32.34 | 31.28 (9.15%) | 7.10 (−1.09%) |
| Regulation services | 161.82 (68.55%) | 189.67 | 224.67 | 277.82 | 265.27 (77.59%) | 103.46 (9.04%) |
| Support services | 36.99 (15.67%) | 36.45 | 35.42 | 32.31 | 33.17 (9.7%) | −3.82 (−5.97%) |
| Cultural services | 13.08 (5.54%) | 12.99 | 12.80 | 11.75 | 12.16 (3.56%) | −0.92 (−1.98%) |
| Total | 236.06 | 265.37 | 301.54 | 354.22 | 341.88 | 105.81 |
Table 9.
Explanatory power (q values) of ecosystem service driving forces in the Yellow River Delta.
Table 9.
Explanatory power (q values) of ecosystem service driving forces in the Yellow River Delta.
| 2000 | 2005 | 2010 | 2015 | 2019 | Annual Average | ||||||
|---|---|---|---|---|---|---|---|---|---|---|---|
| NDVI | 0.34115 | NDVI | 0.40937 ↑ | NDVI | 0.47165 ↑ | NDVI | 0.489295 ↑ | NDVI | 0.46389 ↓ | NDVI | 0.43507 |
| TEM2 | 0.24645 | SA | 0.26783 ↑ | SA | 0.29954 ↑ | SA | 0.34874 ↑ | PES | 0.33758 ↑ | SA | 0.29602 |
| WS | 0.24141 | SL | 0.21945 ↑ | SL | 0.25503 ↑ | SL | 0.302733 ↑ | SA | 0.33419 ↓ | SL | 0.25184 |
| SA | 0.22981 | DEM | 0.16763 ↑ | DEM | 0.20749 ↑ | TEM2 | 0.253606 ↑ | SL | 0.29035 ↓ | DEM | 0.19836 |
| SL | 0.19164 | TEM2 | 0.12812 ↓ | TEM2 | 0.17873 ↑ | DEM | 0.243137 ↑ | DEM | 0.22774 ↓ | TEM2 | 0.19070 |
| PES | 0.17207 | WS | 0.12026 ↓ | WS | 0.09284 ↓ | TEM1 | 0.09887 ↑ | TEM2 | 0.14660 ↓ | PES | 0.14962 |
| TEM1 | 0.16148 | PES | 0.11283 ↓ | PES | 0.07323 ↓ | TC | 0.083099 ↑ | TEM1 | 0.10230 ↑ | WS | 0.12308 |
| DEM | 0.14580 | TC | 0.09797 ↑ | TC | 0.06834 ↓ | RD | 0.070137 ↑ | WS | 0.09350 ↑ | TEM1 | 0.09850 |
| TC | 0.06517 | TEM1 | 0.068309 ↓ | TEM1 | 0.06155 ↓ | WS | 0.067413 ↓ | TC | 0.08556 ↑ | TC | 0.08003 |
| RD | 0.05298 | RD | 0.049421 ↓ | RD | 0.05468 ↑ | TS | 0.056153 ↑ | RD | 0.06762 ↓ | RD | 0.05897 |
| TS | 0.01387 | TS | 0.01518 ↑ | TS | 0.03284 ↑ | PES | 0.052382 ↓ | TS | 0.05199 ↓ | TS | 0.03401 |
Note: The factor abbreviations correspond to the code information in Table 5: TEM1 (temperature), TEM2 (dew point temperature), PES (pressure), WS (wind speed), DEM (elevation), SL (slope), SA (aspect), RD (river distance), NDVI (vegetation index), TS (tourist resource aggregation), TC (traffic convenience). In addition, the red downward arrows and green upward arrows indicate a decrease or increase in q value compared to the previous year, respectively.
Disclaimer/Publisher’s Note: The statements, opinions and data contained in all publications are solely those of the individual author(s) and contributor(s) and not of MDPI and/or the editor(s). MDPI and/or the editor(s) disclaim responsibility for any injury to people or property resulting from any ideas, methods, instructions or products referred to in the content. |
© 2024 by the authors. Licensee MDPI, Basel, Switzerland. This article is an open access article distributed under the terms and conditions of the Creative Commons Attribution (CC BY) license (https://creativecommons.org/licenses/by/4.0/).
Share and Cite
MDPI and ACS Style
Xue, S.; Yao, L.; Xu, Y.; Li, C. Spatiotemporal Dynamics and Driving Factors of Ecosystem Services in the Yellow River Delta, China. Sustainability 2024, 16, 3466. https://doi.org/10.3390/su16083466
AMA Style
Xue S, Yao L, Xu Y, Li C. Spatiotemporal Dynamics and Driving Factors of Ecosystem Services in the Yellow River Delta, China. Sustainability. 2024; 16(8):3466. https://doi.org/10.3390/su16083466
Chicago/Turabian StyleXue, Shuqi, Lei Yao, Ying Xu, and Chunfang Li. 2024. "Spatiotemporal Dynamics and Driving Factors of Ecosystem Services in the Yellow River Delta, China" Sustainability 16, no. 8: 3466. https://doi.org/10.3390/su16083466
Note that from the first issue of 2016, this journal uses article numbers instead of page numbers. See further details here.