
Critical Watershed Prioritization through Multi-Criteria Decision-Making Techniques and Geographical Information System Integration for Watershed Management


Abstract
:1. Introduction
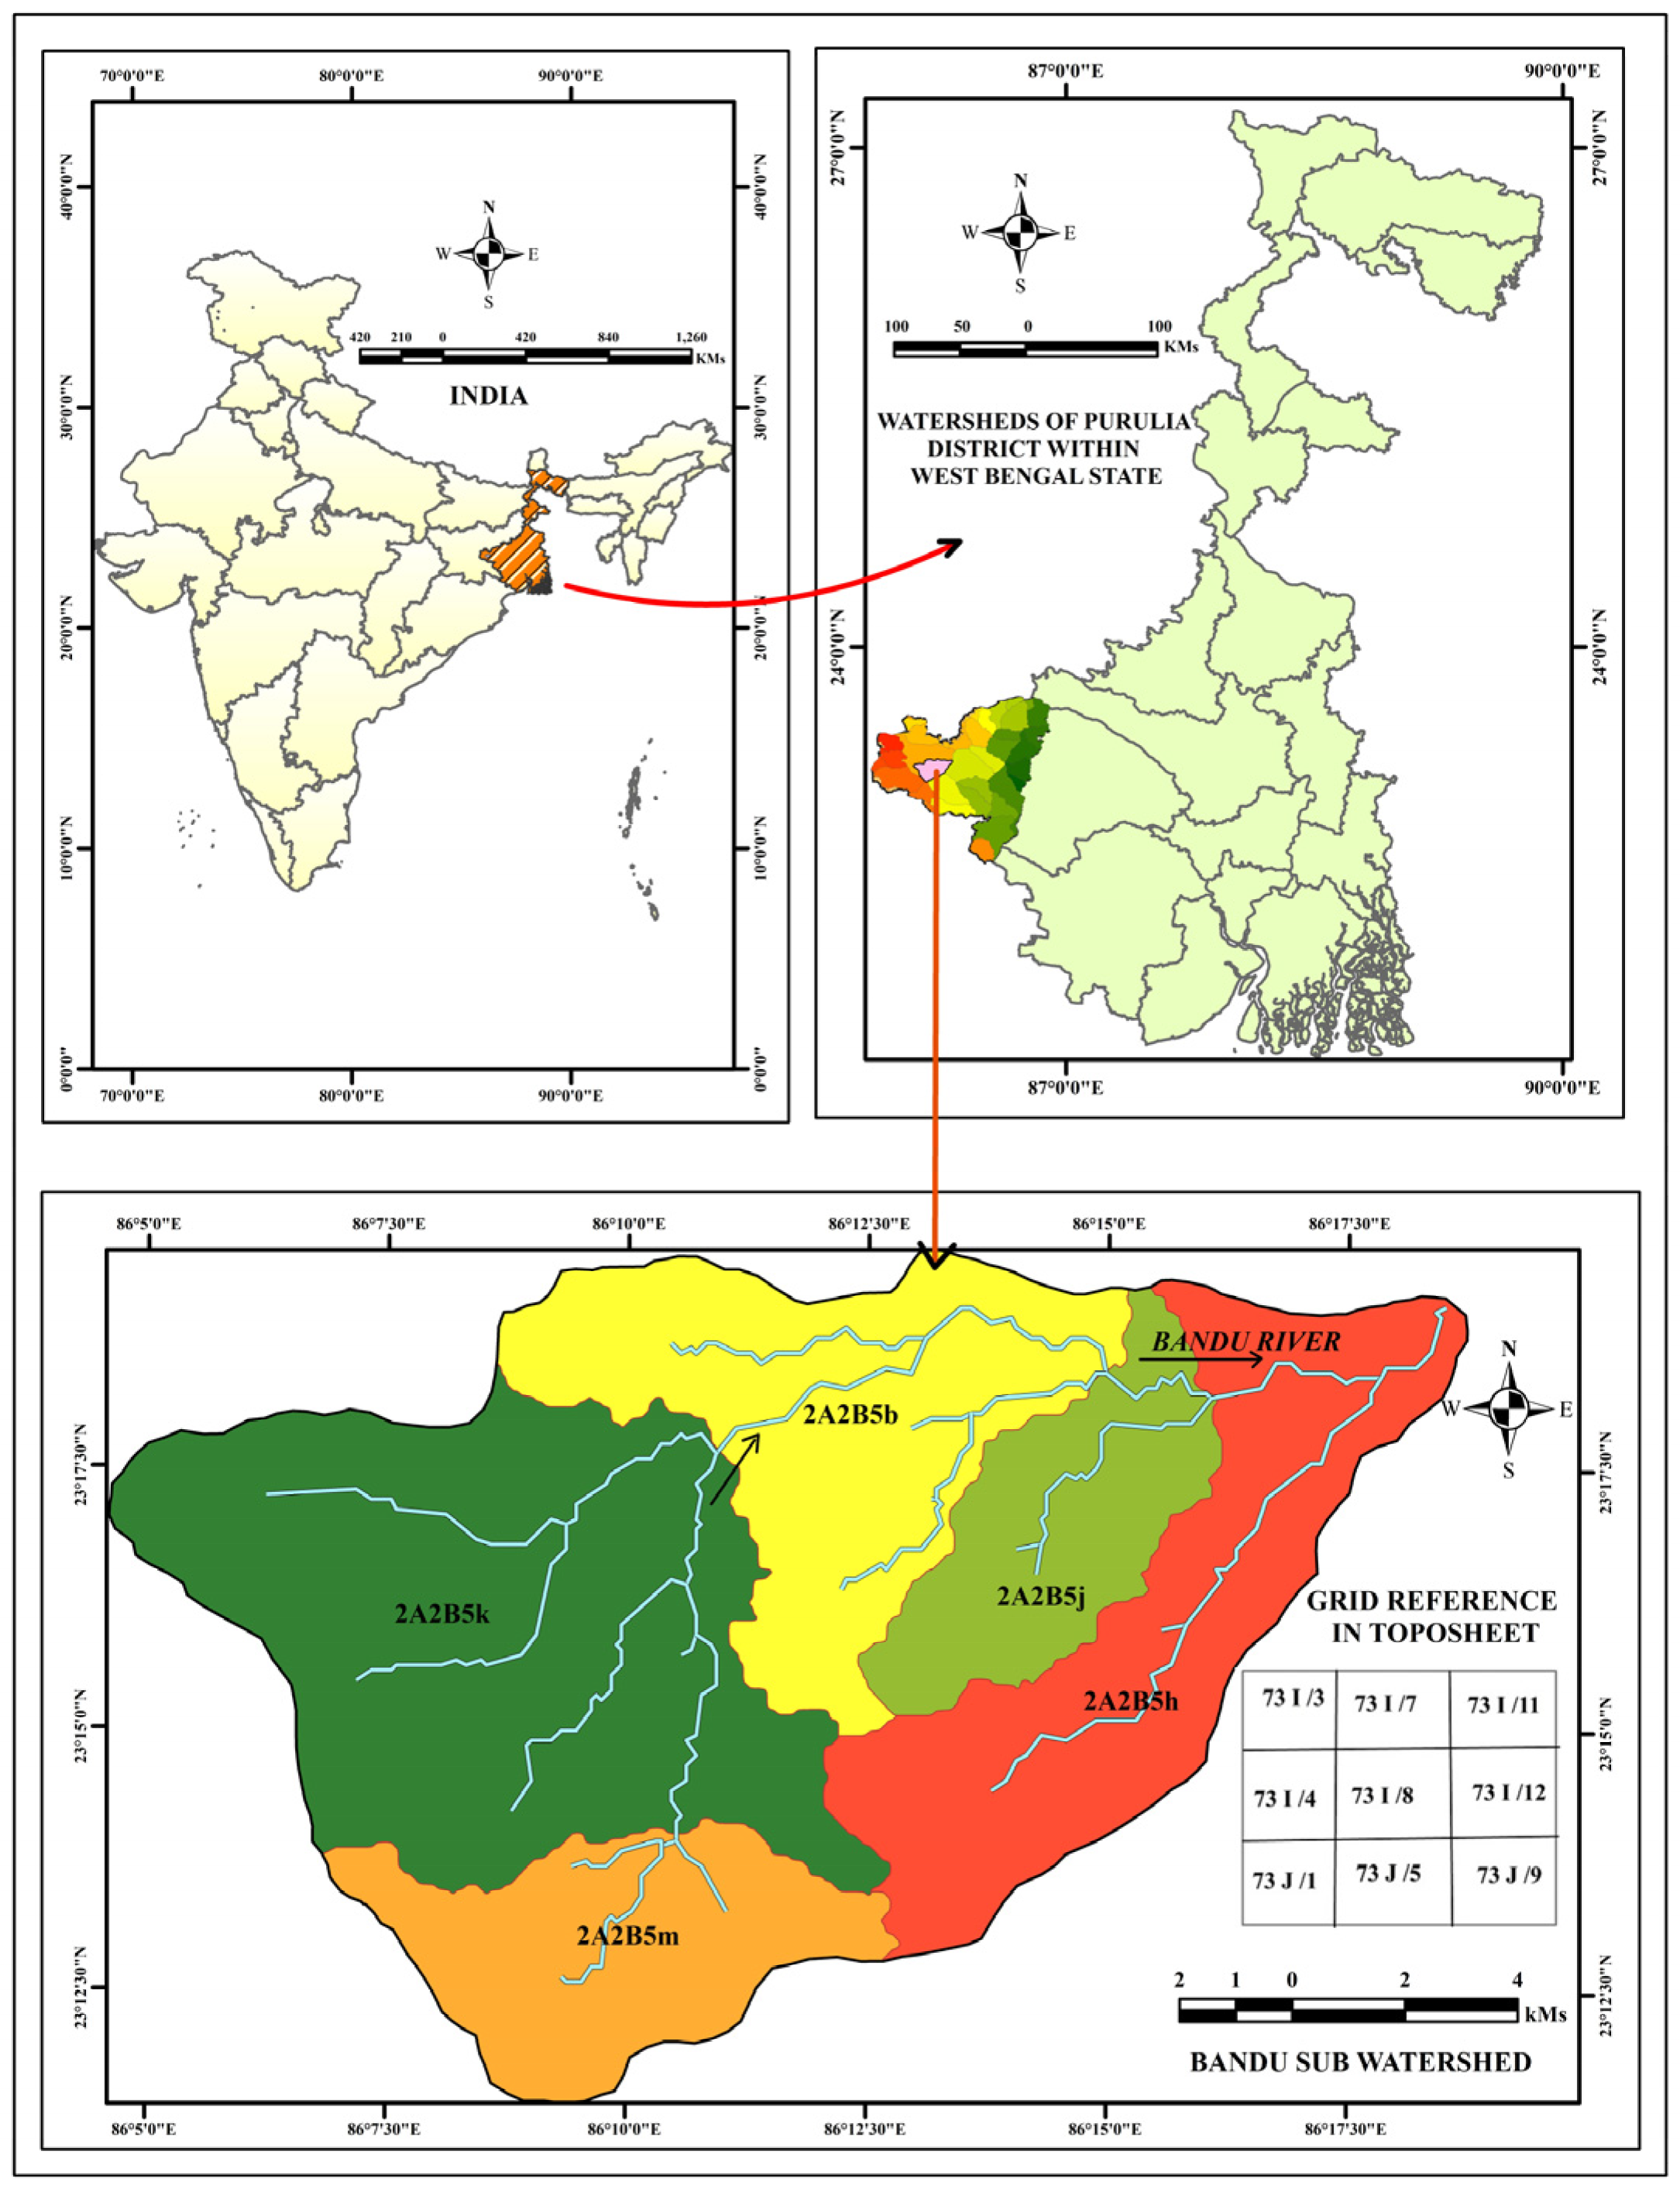
2. Study Area
3. Materials and Methods
3.1. Data Sets Used
- The data from the Landsat-9 Operational Land Imager (OLI) and Thermal Infrared Sensor (TIRS) was utilized. This sensor provides an excellent spatial resolution of 30 m over 11 spectral bands. These scenes, which were taken in the dry, pre-monsoon period of early April 2023 under clear atmospheric conditions, were crucial sources of information.
- Four 1:50,000 scale Survey of India (SOI) topographic sheets (73E/14, 73E/15, 73E/16, and 73I/3) were used to chart the Bandu sub-watershed in detail. These maps functioned as ground truth references in addition to helping with the geometric correction of satellite photos. With a root mean square error (RMSE) of 0.40 to 0.50 pixels, the map image-to-map registration demonstrated exceptional accuracy, while the image-to-image registration obtained an astounding 0.10 to 0.14.
- The Digital Elevation Model (DEM) data from the Shuttle Radar Topography Mission (SRTM) was used for accurate morphometric analysis. SRTM’s 30 m of spatial resolution and advanced computational capabilities, when combined with its C-band interferometric radar setup [41,42] allowed for quick determination of morphometric parameters. Additionally, vector data encompassing Lithology and hydrogeomorphology at a scale of 1:250,000 were sourced from the Geological Survey of India’s official website, Bhukosh [41]. Table 1 provides data sources used in the study.
3.2. Methodology Used
3.2.1. The Methodology for Morphometric Analysis
3.2.2. The Methodology for Quantifying Various Risk Parameters
- Soil erosion risk:
- 2.
- Groundwater Recharge Potential:
- 3.
- Hydro geomorphological risk:
- 4.
- Lithological risk:
- 5.
- Land Use and Land Cover:
3.2.3. Methodology to Develop Watershed Prioritization Approach Considering Various Risk Parameters
- AHP methodology
- 2.
- TOPSIS methodology
4. Analysis and Results
4.1. Estimation of Morphometric Parameters
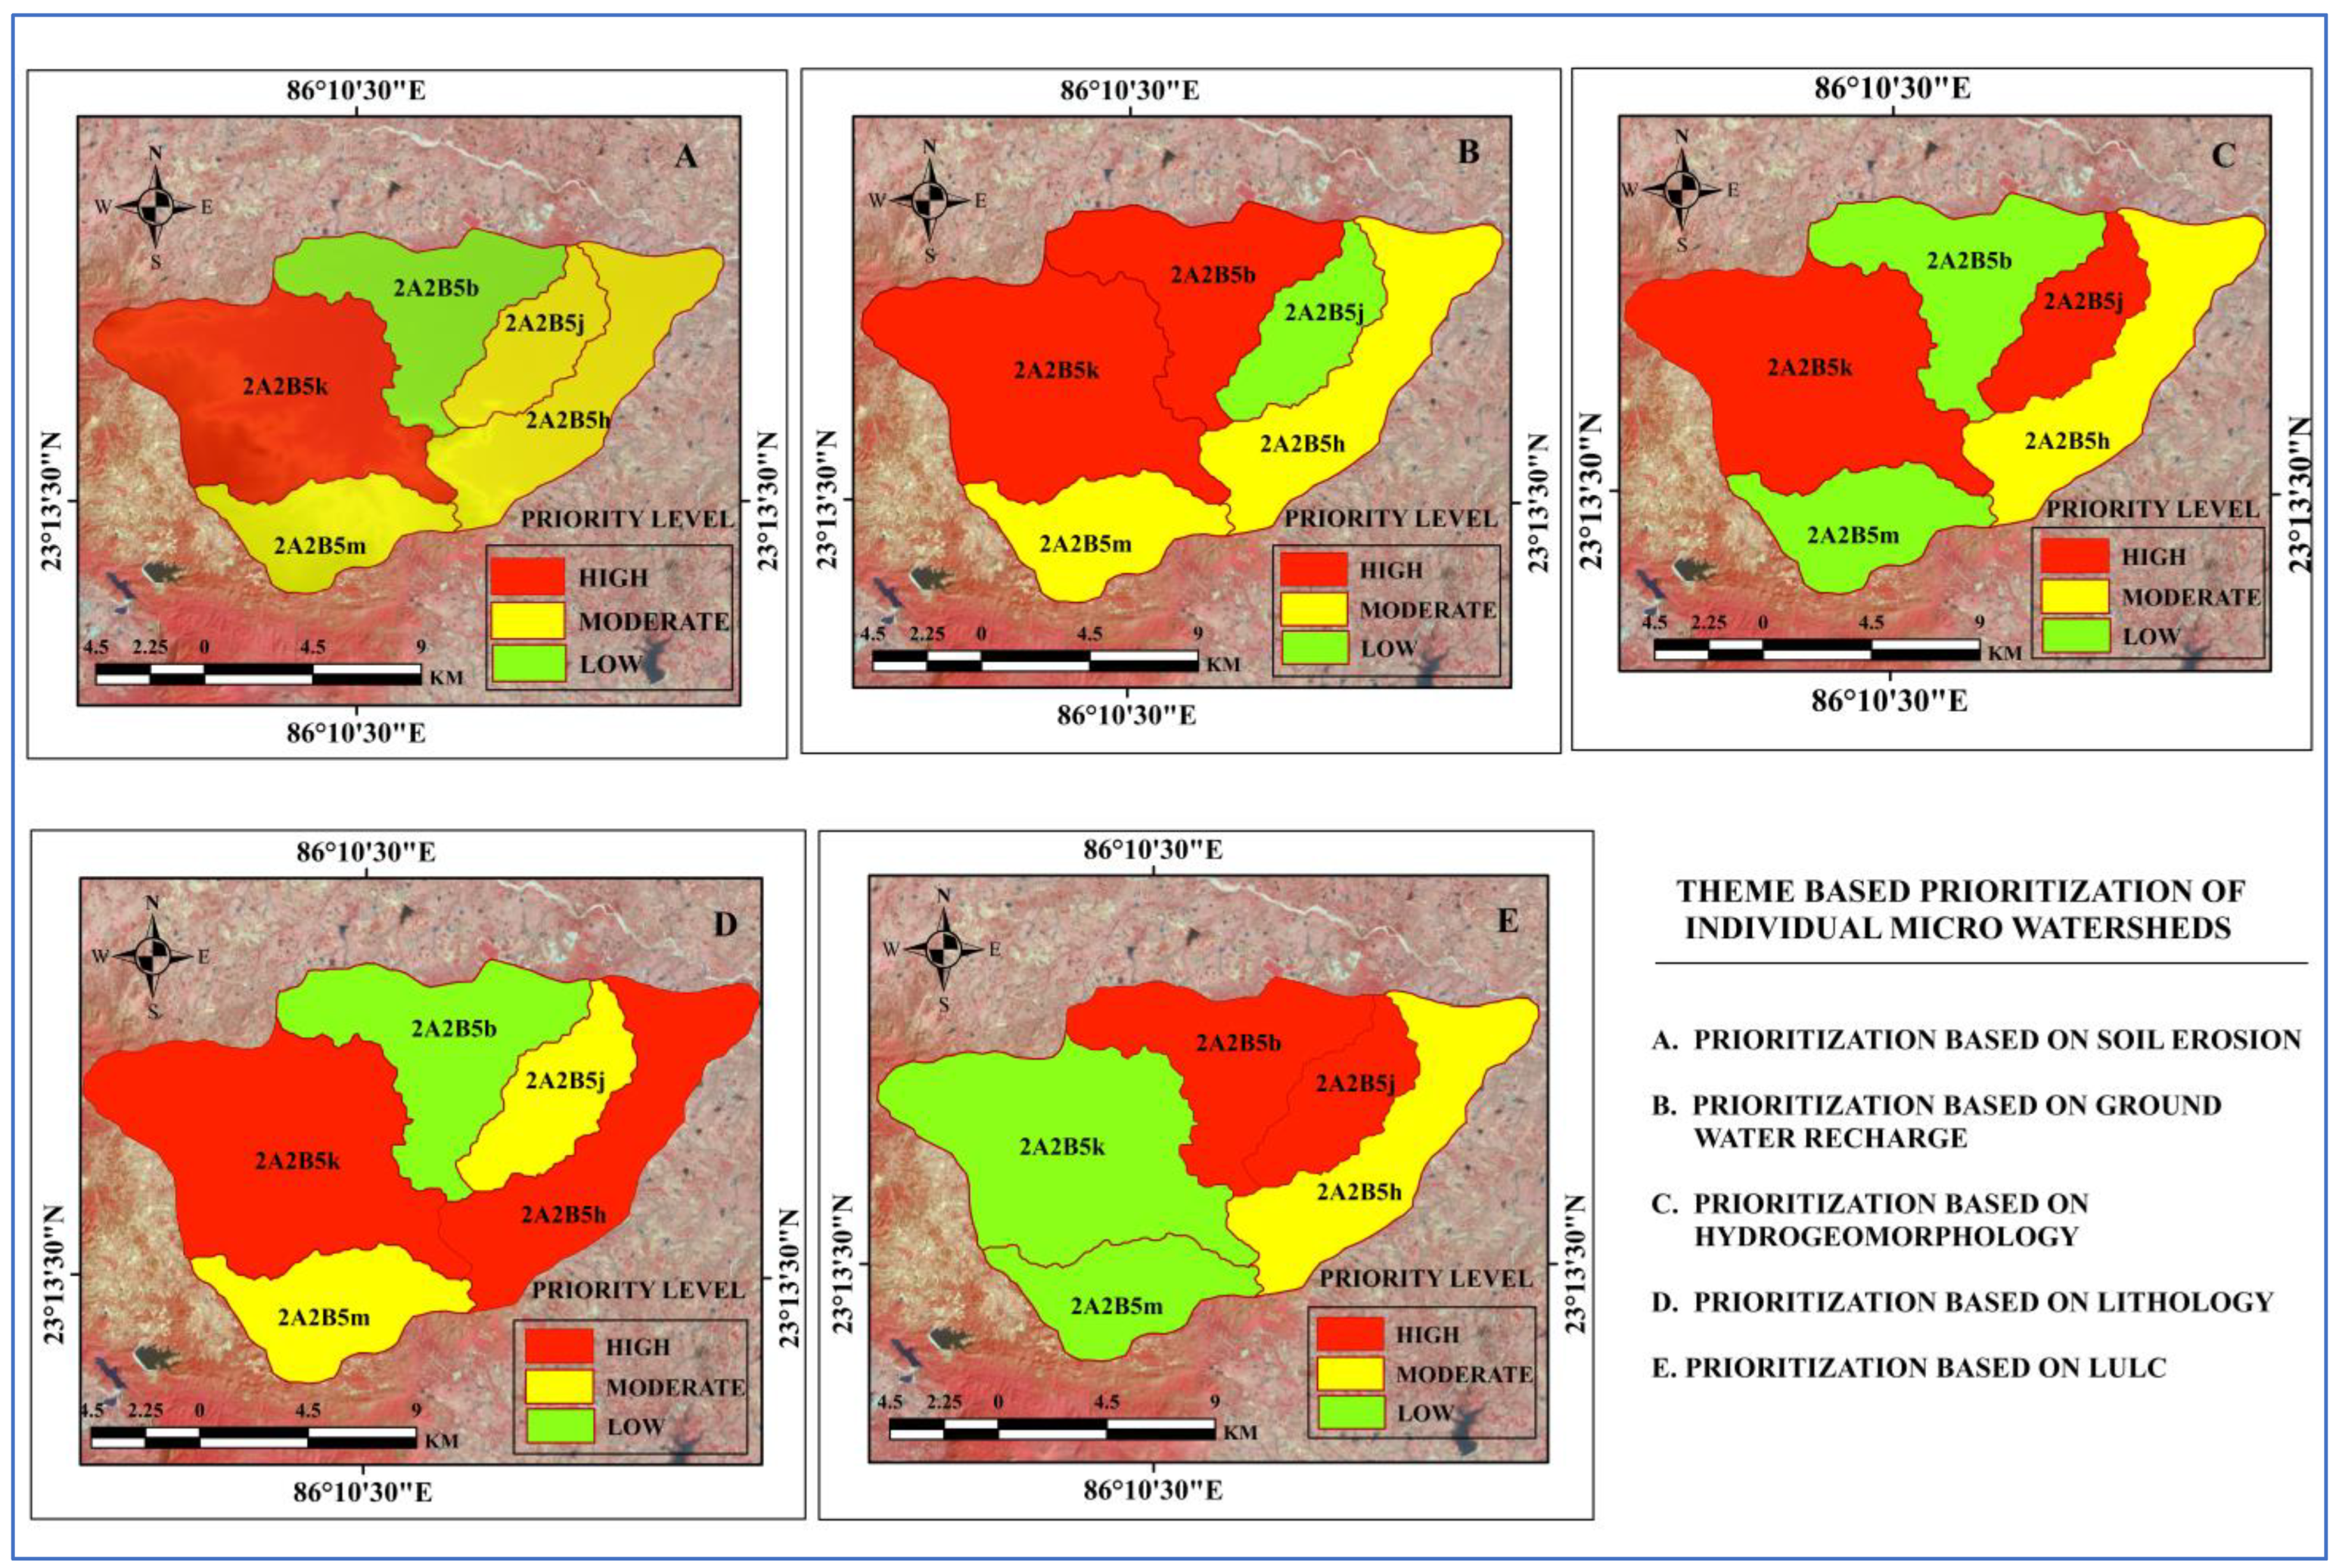
4.2. Compound Scores of Individual Micro Watersheds and Prioritization
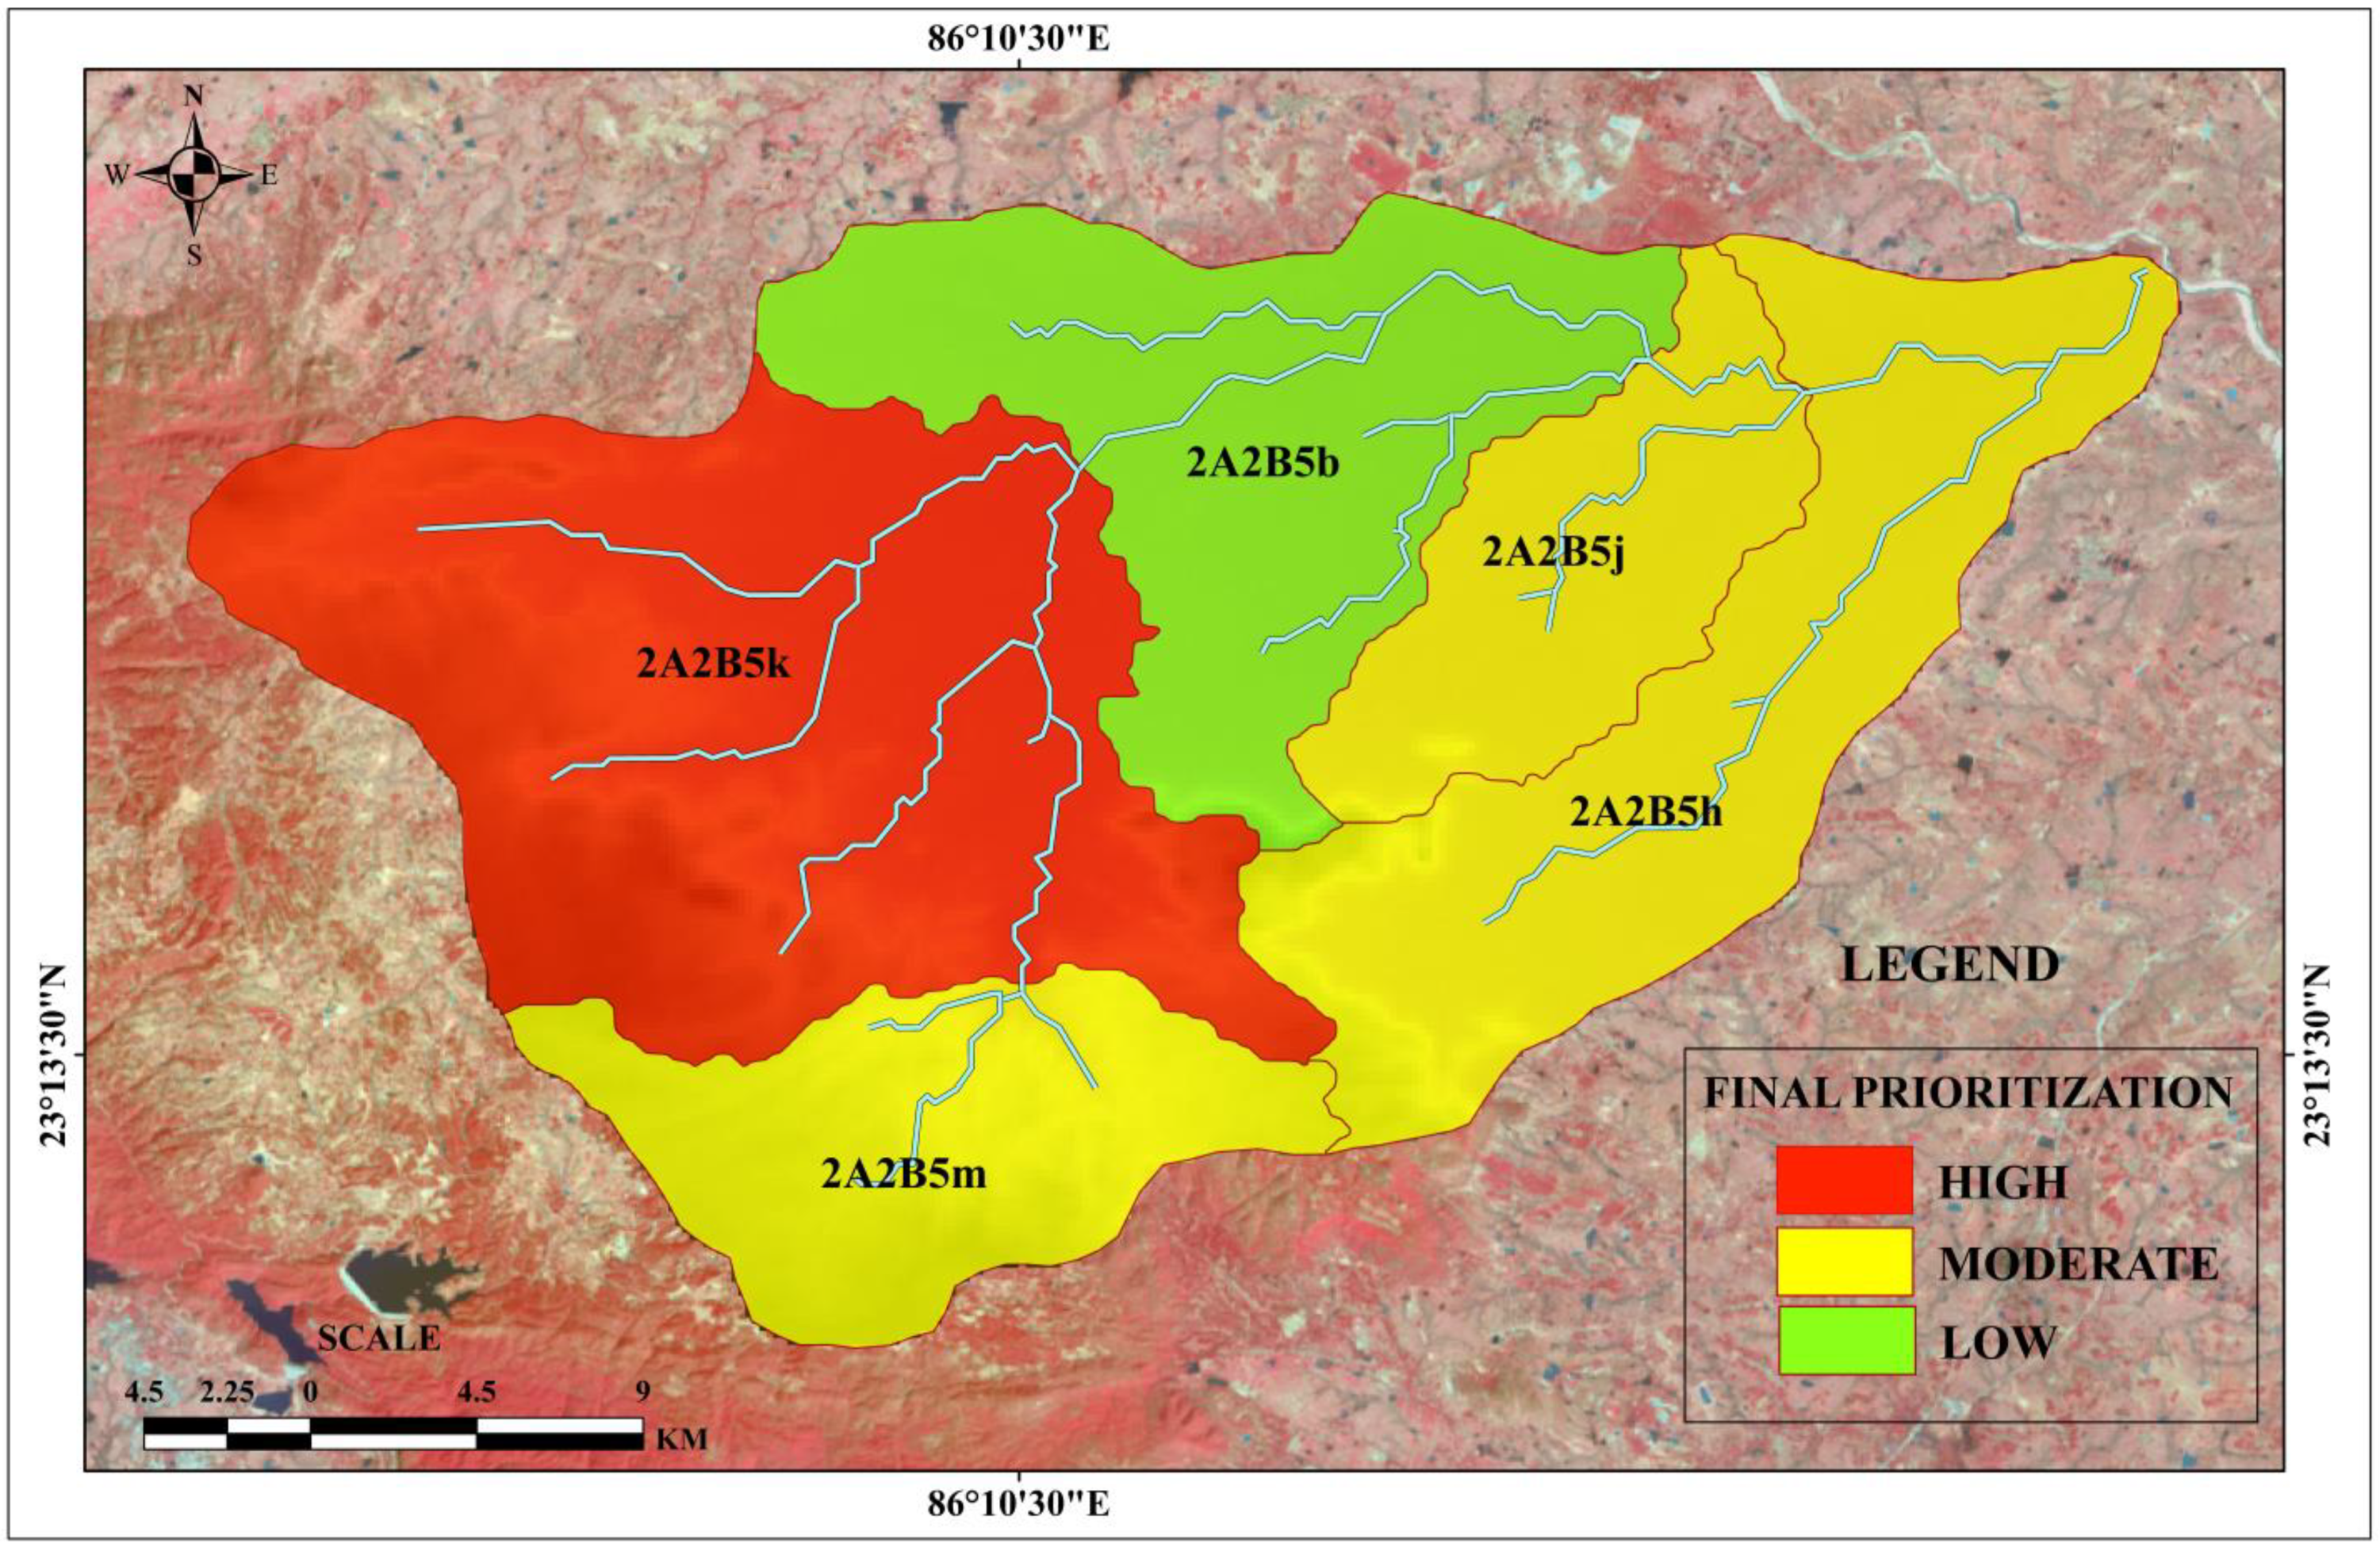
4.3. Final Prioritization Based on AHP-TOPSIS Model
5. Model Validation
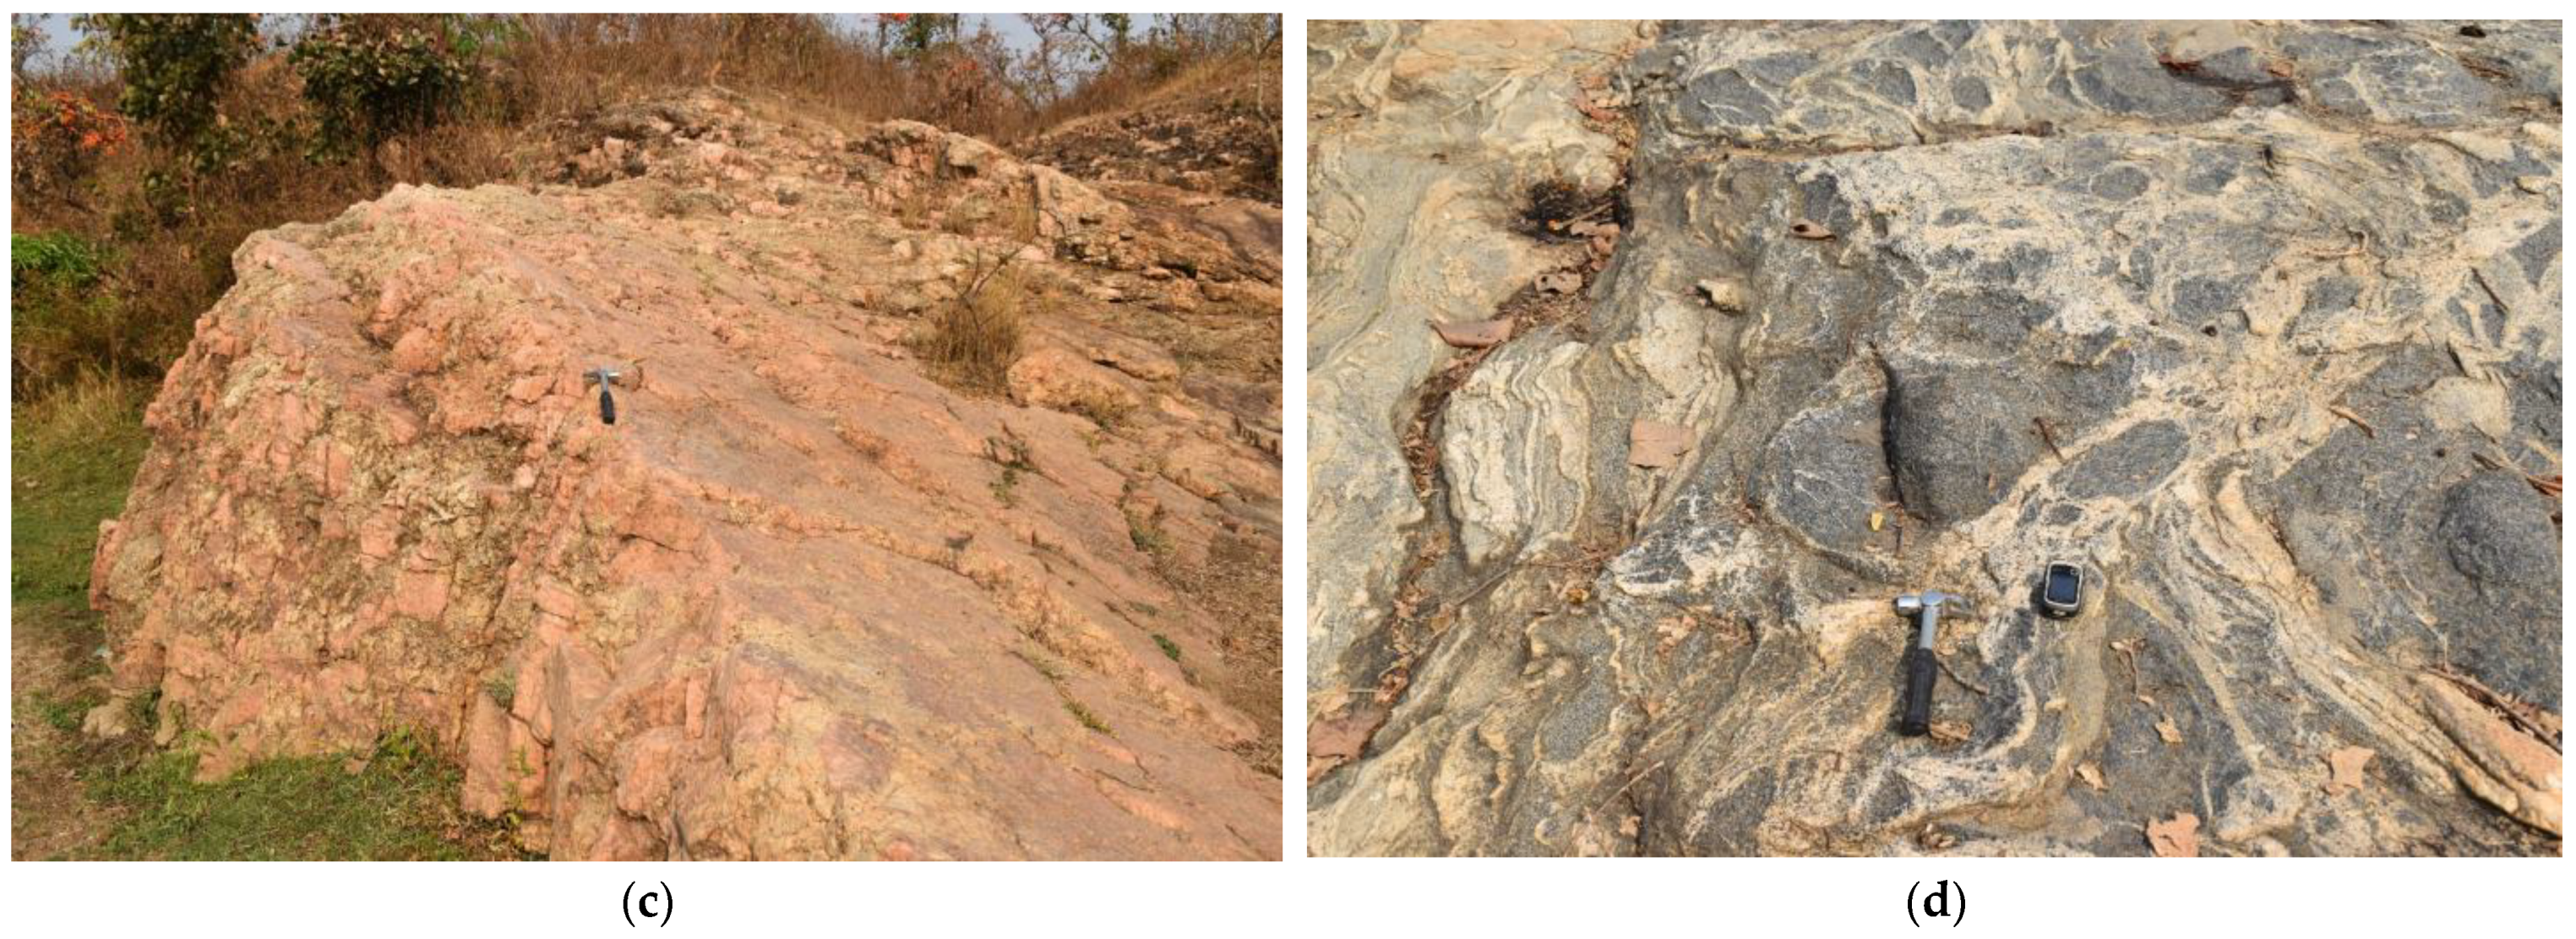
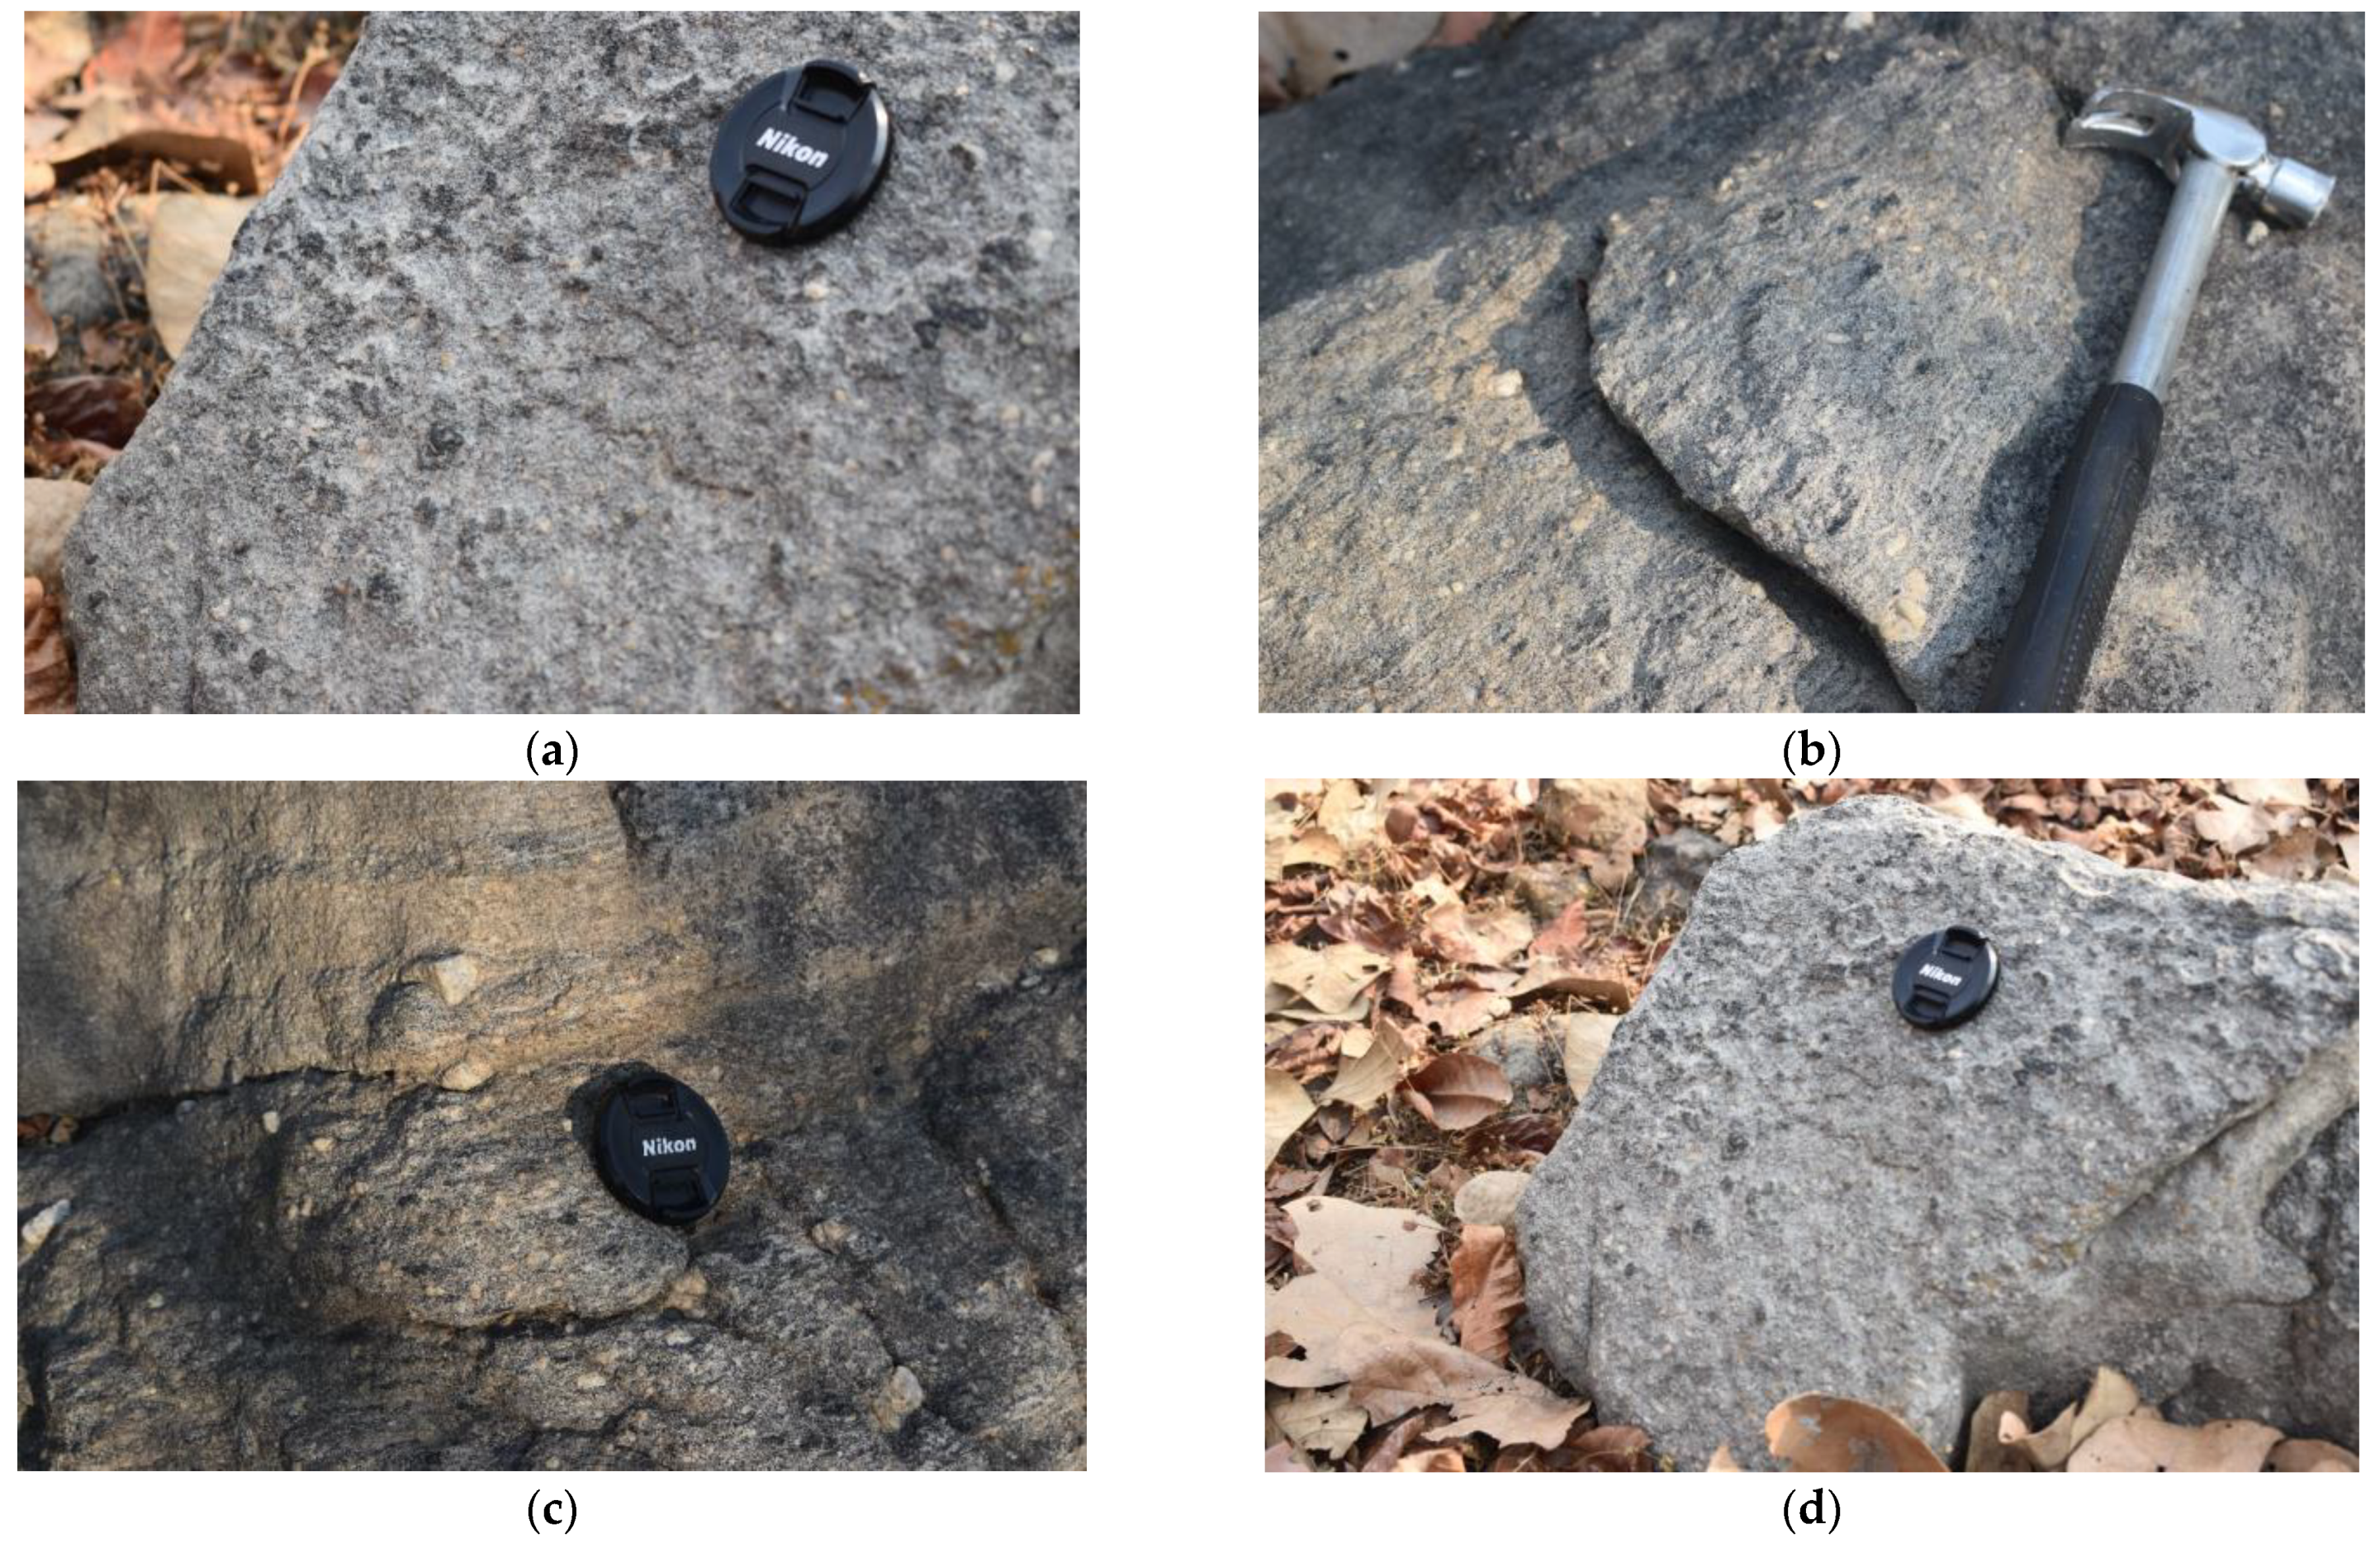
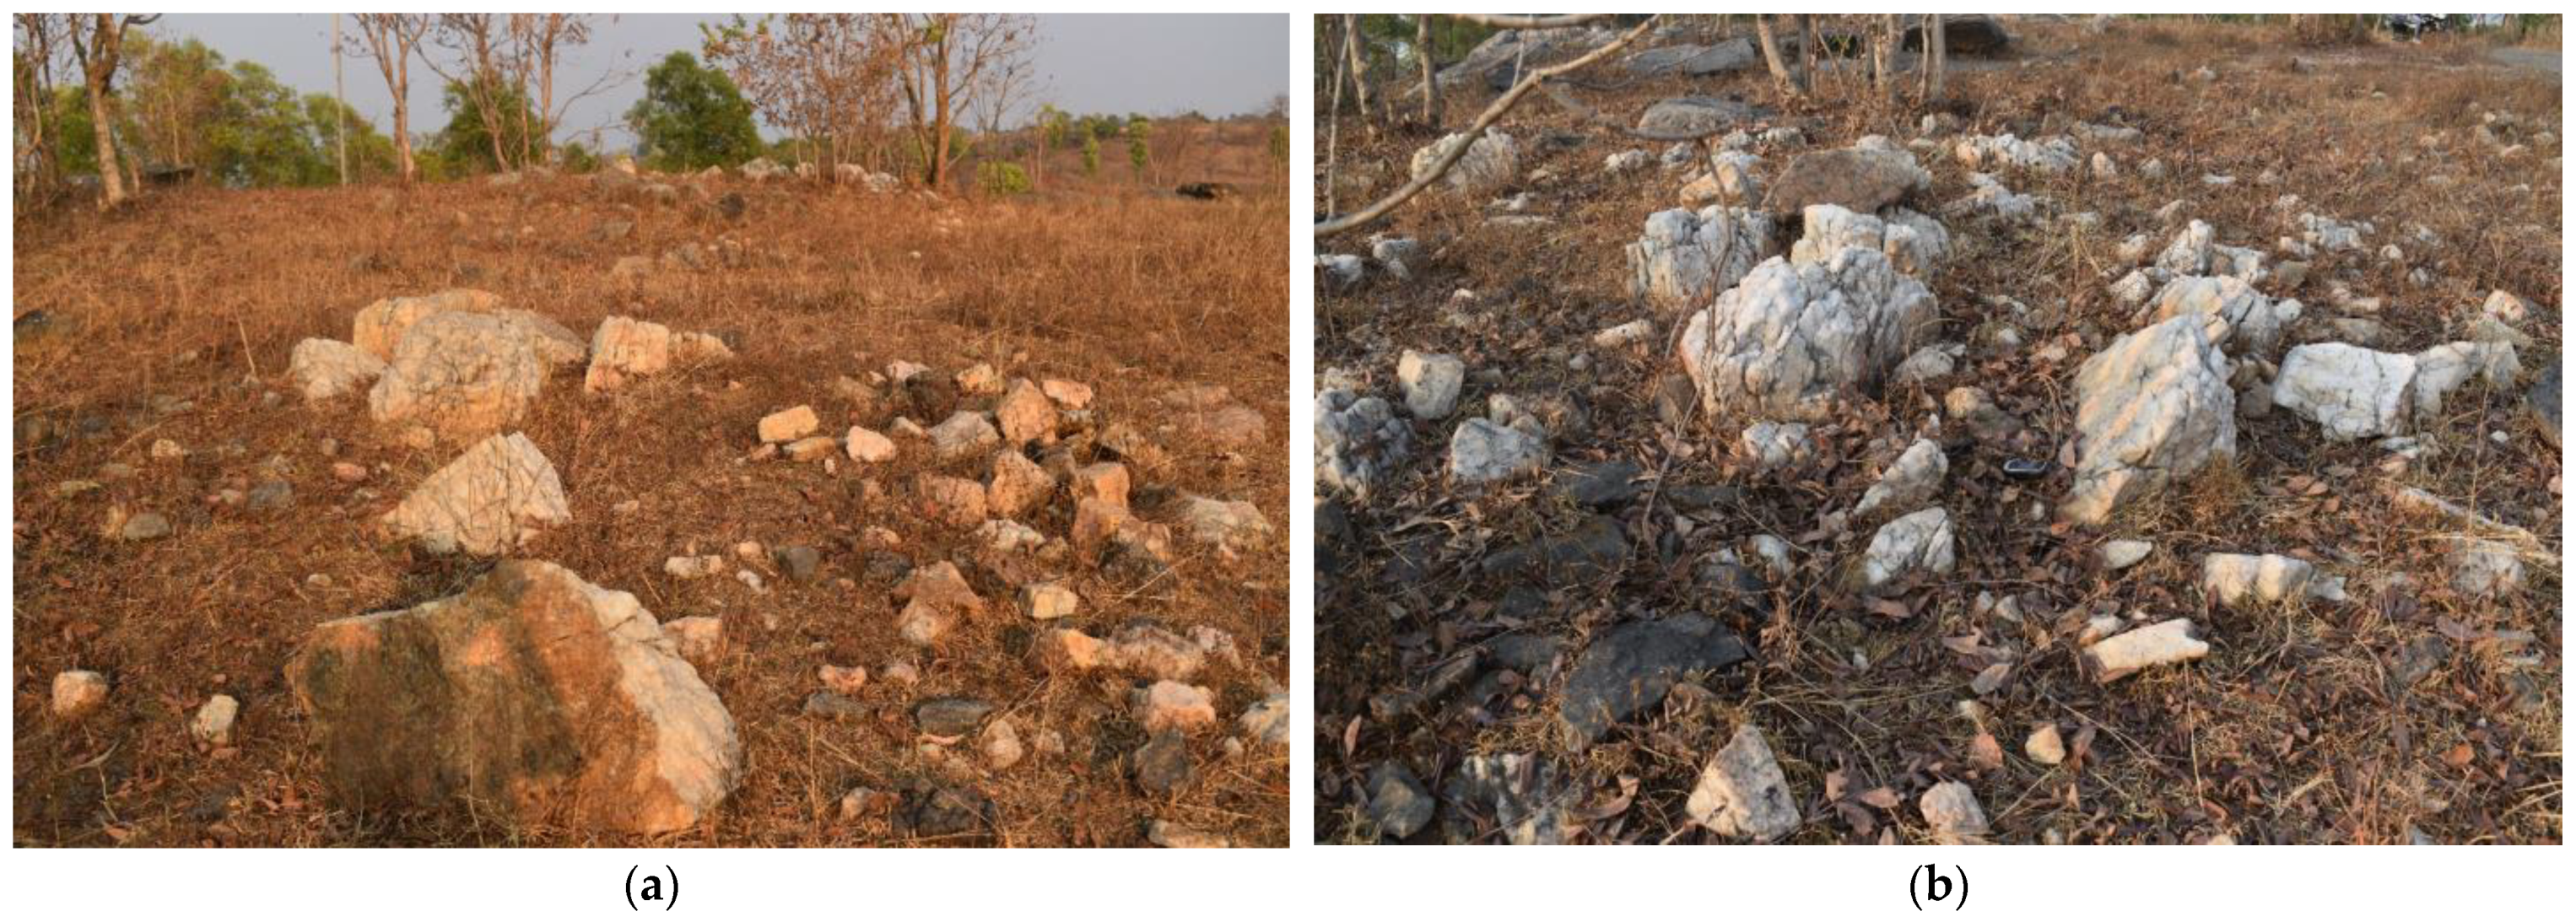
5.1. Interpreting Geological Data with Reference to Field
5.1.1. Angular Unconformity Exposure
5.1.2. East-West Aligned Granitic Gneiss Mass
5.1.3. Isolated Ledge of Gneissic Rock
5.1.4. Large Scale Silicification Accompanied by Brecciation
5.1.5. Principal Rock Types and Lithological Imprints
5.2. Interpreting a Report of CGWB
6. Discussion
- High priority
- 2.
- Medium priority
- 3.
- Low priority
7. Conclusions
Supplementary Materials
Author Contributions
Funding
Institutional Review Board Statement
Informed Consent Statement
Data Availability Statement
Acknowledgments
Conflicts of Interest
References
- Tiwari, R.N.; Kushwaha, V.K. Watershed Prioritization Based on Morphometric Parameters and PCA Technique: A Case Study of Deonar River Sub Basin, Sidhi Area, Madhya Pradesh, India. J. Geol. Soc. India 2021, 97, 396–404. [Google Scholar] [CrossRef]
- Agarwal, C.S. Study of Drainage Pattern through Aerial Data in Naugarh Area of Varanasi District, U.P. J. Indian Soc. Remote Sens. 1998, 26, 169–175. [Google Scholar] [CrossRef]
- Choudhari, P.P.; Nigam, G.; Singh, S.; Thakur, S. Morphometric Based Prioritization of Watershed for Groundwater Potential of Mula River Basin, Maharashtra, India. Geol. Ecol. Landsc. 2018, 2, 1–12. [Google Scholar] [CrossRef]
- Clarke, J.J. Morphometry from Maps, Essays in Geomorphology; Elsevier Publishing Company: New York, NY, USA, 1966; pp. 235–274, References—Scientific Research Publishing; Available online: https://www.scirp.org/(S(351jmbntvnsjt1aadkposzje))/reference/ReferencesPapers.aspx?ReferenceID=1152655 (accessed on 30 October 2023).
- Singh, S.; Sing, M.C. Morphometric Analysis of Kanhar River Basin. Natl. Geogr. J. India 1997, 43, 31–43, References—Scientific Research Publishing. Available online: https://www.scirp.org/(S(lz5mqp453edsnp55rrgjct55.))/reference/referencespapers.aspx?referenceid=2029747 (accessed on 30 October 2023).
- Pal, B.; Samanta, S.; Pal, D. Morphometric and Hydrological Analysis and Mapping for Watut Watershed Using Remote Sensing and GIS Techniques. Int. J. Adv. Eng. Technol. 2012, 2, 357–368. [Google Scholar]
- Singh, R.; Bhatt, C.M.; Vajja, H.P. Morphological study of a watershed using remote sensing and GIS techniques. Hydrol. J. 2003, 26, 55–66. [Google Scholar]
- Strahler, A.N. Quantitative Geomorphology of Drainage Basin and Channel Networks. In Handbook of Applied Hydrology; McGraw Hill: New York, NY, USA, 1964. [Google Scholar]
- Wang, G.; Mang, S.; Cai, H.; Liu, S.; Zhang, Z.; Wang, L.; Innes, J.L. Integrated Watershed Management: Evolution, Development and Emerging Trends. J. For. Res. 2016, 27, 967–994. [Google Scholar] [CrossRef]
- Heathcote, I.W. Integrated Watershed Management: Principles and Practice; John Wiley & Sons: Hoboken, NJ, USA, 1998. [Google Scholar]
- Javed, A.; Khanday, M.Y.; Ahmed, R. Prioritization of Sub-Watersheds Based on Morphometric and Land Use Analysis Using Remote Sensing and GIS Techniques. J. Indian Soc. Remote Sens. 2009, 37, 261–274. [Google Scholar] [CrossRef]
- Puno, G.R.; Puno, R.C.C. Watershed Conservation Prioritization Using Geomorphometric and Land Use-Land Cover Parameters. Global J. Environ. Sci. Manag. 2019, 5, 279–294. [Google Scholar] [CrossRef]
- Roy, S.; Sahu, A.S. Effectiveness of Basin Morphometry, Remote Sensing, and Applied Geosciences on Groundwater Recharge Potential Mapping: A Comparative Study within a Small Watershed. Front. Earth Sci. 2016, 10, 274–291. [Google Scholar] [CrossRef]
- Chauhan, P.; Chauniyal, D.; Singh, N.; Tiwari, R. Quantitative Geo-Morphometric and Land Cover-Based Micro-Watershed Prioritization in the Tons River Basin of the Lesser Himalaya. Environ. Earth Sci. 2016, 75, 498. [Google Scholar] [CrossRef]
- Pandey, A.; Chowdary, V.; Mal, B. Identification of Critical Erosion Prone Areas in the Small Agricultural Watershed Using USLE, GIS and Remote Sensing. Water Resour. Manag. 2007, 21, 729–746. [Google Scholar] [CrossRef]
- Bertalan-Balazs, B.; Bíró, T.; Dyke, G.; Singh, S.; Szabo, S. Extracting Water-Related Features Using Reflectance Data and Principal Component Analysis of Landsat Images. Hydrol. Sci. J. 2018, 63, 269–284. [Google Scholar] [CrossRef]
- Colombo, R.; Vogt, J.V.; Soille, P.; Paracchini, M.L.; De Jager, A. Deriving River Networks and Catchments at the European Scale from Medium Resolution Digital Elevation Data. Catena 2007, 70, 296–305. [Google Scholar] [CrossRef]
- Magesh, N.S.; Jitheshlal, K.V.; Chandrasekar, N.; Jini, K.V. Geographical Information System-Based Morphometric Analysis of Bharathapuzha River Basin, Kerala, India. Appl. Water Sci. 2013, 3, 467–477. [Google Scholar] [CrossRef]
- Narsimlu, B.; Gosain, A.; Chahar, B.; Singh, S.; Srivastava, P. SWAT Model Calibration and Uncertainty Analysis for Streamflow Prediction in the Kunwari River Basin, India, Using Sequential Uncertainty Fitting. Environ. Process 2015, 2, 79–95. [Google Scholar] [CrossRef]
- Palanisamy, A.; Padmalal, D. Sub-Watershed Prioritization Based on Drainage Morphometric Analysis: A Case Study of Cauvery River Basin in South India. J. Geol. Soc. India 2020, 95, 25–35. [Google Scholar] [CrossRef]
- Paudel, D.; Thakur, J.K.; Singh, S.; Srivastava, P. Soil Characterization Based on Land Cover Heterogeneity over a Tropical Landscape: An Integrated Approach Using Earth Observation Data-Sets. Geocarto Int. 2014, 30, 1–24. [Google Scholar] [CrossRef]
- Rai, P.; Mishra, V.; Mohan, K. A Study of Morphometric Evaluation of the Son Basin, India Using Geospatial Approach. Remote Sens. Appl. Soc. Environ. 2017, 7, 9–20. [Google Scholar] [CrossRef]
- Brooks, K.; Ffolliott, P.; Magner, J. Hydrology and the Management of Watersheds, 4th ed.; John Wiley & Sons: Hoboken, NJ, USA, 2012; pp. 1–533. [Google Scholar] [CrossRef]
- Fulazzaky, M.A. Challenges of Integrated Water Resources Management in Indonesia. Water 2014, 6, 2000–2020. [Google Scholar] [CrossRef]
- He, C.; Harden, C.P.; Liu, Y. Comparison of Water Resources Management between China and the United States. Geogr. Sustain. 2020, 1, 98–108. [Google Scholar] [CrossRef]
- Zhang, X.; Shao, M.; Li, S.; Peng, K. A Review of Soil and Water Conservation in China. J. Geogr. Sci. 2004, 14, 259–274. [Google Scholar] [CrossRef]
- Joshi, P.; Shiferaw, B.; Wani, S.; Bouma, J.; Scott, C. Watershed Development in India: Synthesis of Past Experiences and Needs for Future Research. Indian J. Agric. Econ. 2004, 59, 303–320. [Google Scholar]
- Mondal, B.K.; Das, R.; Das, R. Watershed Prioritization Based on Morphometric Analysis Using Geospatial Technique in the Upper Kasai Sub-Watershed of Purulia District, West Bengal (India). In Fluvial Systems in the Anthropocene: Process, Response and Modelling; Islam, A., Das, P., Ghosh, S., Mukhopadhyay, A., Das Gupta, A., Kumar Singh, A., Eds.; Springer International Publishing: Cham, Switzerland, 2022; pp. 193–226. [Google Scholar] [CrossRef]
- Dolui, G.; Das, K.; Das Chatterjee, N.; Bhattacharya, R. Multi-Criteria-Based Morphometric Prioritization for Soil Erosion Susceptibility and Denudation Rate Assessment of Purulia District, India. In Drainage Basin Dynamics: An Introduction to Morphology, Landscape and Modelling; Springer: Berlin/Heidelberg, Germany, 2022; pp. 477–502. [Google Scholar] [CrossRef]
- Saha, A. GIS Based Soil Erosion Estimation Using Rusle Model: A Case Study of Upper Kangsabati Watershed, West Bengal, India. Int. J. Environ. Sci. Nat. Resour. 2018, 13, 001–008. [Google Scholar] [CrossRef]
- Saini, K.M.; Deb, T.K.; Mitra, P.P.; Ghatol, S.G.; Sen, A.K.; Saha, N.C.; Das, S.N. Assessment of Degraded Lands of Puruliya District, West Bengal Using Remotely Sensed Data. J. Indian Soc. Remote Sens. 1999, 27, 23–30. [Google Scholar] [CrossRef]
- Manna, M.; Mondal, B. The Emerging Issue of Forest Degradation in Purulia District. West Bengal Geoinform. Sustain. Environ. Manag. 2017, 1, 137–156. [Google Scholar]
- Mondal, S. Remote Sensing and GIS Based Ground Water Potential Mapping of Kangshabati Irrigation Command Area, West Bengal. J. Geograp Natur. Disast 2012, 01, 1–8. [Google Scholar] [CrossRef]
- Patel, P.; Gupta, D. Mapping Groundwater Level Fluctuation and Utilisation in Puruliya District, West Bengal. In Geostatistics and Geospatial Technologies for Groundwater Resources in India; Springer: Berlin/Heidelberg, Germany, 2021. [Google Scholar]
- Dolui, S.; Chakraborty, S. Selection of Preferable Eco-Tourism Destinations Using Analytical Hierarchy Process in Purulia District, West Bengal (India); Research Square: Durham, CA, USA, 2022. [Google Scholar] [CrossRef]
- Bera, B.; Bhattacharjee, S.; Chamling, M.; Ghosh, A.; Sengupta, N.; Ghosh, S. Fluoride Dynamics in Precambrian Hard Rock Terrain of North Singhbhum Craton and Effect of Fluorosis on Human Health and Society. In Groundwater and Society: Applications of Geospatial Technology; Shit, P.K., Bhunia, G.S., Adhikary, P.P., Dash, C.J., Eds.; Springer International Publishing: Cham, Swirerland, 2021; pp. 319–348. [Google Scholar] [CrossRef]
- Roy, A. Viability of Rainwater Harvesting in Drought Prone Areas of West. Bengal: An Empirical Study on Bandu River Basin in Purulia District. Int. J. Soc. Sci. Humanit. Invent. 2014, 1, 155–164. [Google Scholar]
- Kundu, A.; Nag, S. Assessment of Groundwater Quality in Kashipur Block, Purulia District, West Bengal. Appl. Water Sci. 2018, 8, 33. [Google Scholar] [CrossRef]
- Nag, S. Application of Lineament Density and Hydrogeomorphology to Delineate Groundwater Potential Zones of Baghmundi Block in Purulia District, West Bengal. J. Indian Soc. Remote Sens. 2005, 33, 521–529. [Google Scholar] [CrossRef]
- Choudhury, A.; Ezung, Z.; Barua, M. NAQUIM Report of Purulia District West Bengal; ReseachGate: Berlin, Germany, 2023. [Google Scholar]
- Bhuyan, M.J.; Deka, N. Delineation of Groundwater Potential Zones at Micro-Spatial Units of Nagaon District in Assam, India, Using GIS-Based MCDA and AHP Techniques. Environ. Sci. Pollut. Res. 2022, 29, 1–22. [Google Scholar] [CrossRef] [PubMed]
- Dolui, G.; Das, N.; Guchhait, S.; Roy, S. Multi-Criteria Decision-Making Approach Using Remote Sensing and GIS for Assessment of Groundwater Resources; Springer: Berlin/Heidelberg, Germany, 2021; pp. 59–79. [Google Scholar] [CrossRef]
- Modak, S.; Das, D. A Study on Groundwater Level Fluctuation in Water Scare Region of Upper Catchment Area of Kumari River Basin in Purulia District, West Bengal; ReseachGate: Berlin, Germany, 2018; pp. 18–25. [Google Scholar]
- Haokip, P.; Khan, M.; Choudhari, P.P.; Cimusa Kulimushi, L.; Qaraev, I. Identification of Erosion-Prone Areas Using Morphometric Parameters, Land Use Land Cover and Multi-Criteria Decision-Making Method: Geo-Informatics Approach. Environ. Dev. Sustain. 2022, 24, 527–557. [Google Scholar] [CrossRef]
- Ansari, Z.R.; Rao, L.A.K.; Yusuf, A. GIS Based Morphometric Analysis of Yamuna Drainage Network in Parts of Fatehabad Area of Agra District, Uttar Pradesh. J. Geol. Soc. India 2012, 79, 505–514. [Google Scholar] [CrossRef]
- Biswas, S.; Sudhakar, S.; Desai, V. Prioritisation of Subwatersheds Based on Morphometric Analysis of Drainage Basin: A Remote Sensing and GIS Approach. J. Indian Soc. Remote Sens. 1999, 27, 155–166. [Google Scholar] [CrossRef]
- Horton, R.E. Erosional Development of Streams and Their Drainage Basins; Hydrophysical Approach to Quantitative Morphology. Geol. Soc. Am. Bull. 1945, 56, 275–370. [Google Scholar] [CrossRef]
- Avinash, K.; Deepika, B.; Jayappa, K.S. Basin Geomorphology and Drainage Morphometry Parameters Used as Indicators for Groundwater Prospect: Insight from Geographical Information System (GIS) Technique. J. Earth Sci. 2014, 25, 1018–1032. [Google Scholar] [CrossRef]
- Pakhmode, V.; Kulkarni, H.; Deolankar, S.B. Hydrological-Drainage Analysis in Watershed-Programme Planning: A Case from the Deccan Basalt, India. Hydrogeol. J. 2003, 11, 595–604. [Google Scholar] [CrossRef]
- Vittala, S.S.; Govindaiah, S.; Gowda, H.H. Prioritization of Sub-Watersheds for Sustainable Development and Management of Natural Resources: An Integrated Approach Using Remote Sensing, GIS and Socio-Economic Data. Curr. Sci. 2008, 95, 345–354. [Google Scholar]
- Schumm, S.A. Evolution of Drainage Systems and Slopes in Badlands at Perth Amboy, New Jersey. Geol. Soc. Am. Bull. 1956, 67, 597–646. [Google Scholar] [CrossRef]
- Faniran, A. The Index of Drainage Intensity: A Provisional New Drainage Factor. Aust. J. Sci. 1968, 31, 326–330. [Google Scholar]
- Miller, V.C. A quantitative geomorphic study of drainage basin characteristics in the clinch mountain area Virginia and Tennessee; Columbia Univ: New York, NY, USA, 1953. [Google Scholar]
- Gravelius, H. Morphometry of Drainage Bassins; Elsevier: Amsterdam, The Netherlands, 1914; References—Scientific Research Publishing; Available online: https://www.scirp.org/(S(lz5mqp453edsnp55rrgjct55.))/reference/referencespapers.aspx?referenceid=2852054 (accessed on 31 October 2023).
- Pingale, S.M.; Chandra, H.; Sharma, H.; Mishra, S.S. Morphometric Analysis of Maun Watershed in Tehri-Garhwal District of Uttarakhand Using GIS. Int. J. Geomat. Geosci. 2012, 3, 373–387. [Google Scholar]
- Horton, R.E. Drainage-Basin Characteristics. Trans. Am. Geophys. Union 1932, 13, 350–361. [Google Scholar]
- Melton, M.A. An Analysis of the Relations among Elements of Climate, Surface Properties, and Geomorphology; Columbia Univ: New York, NY, USA, 1957. [Google Scholar]
- Smith, G.-H. The Relative Relief of Ohio. Geogr. Rev. 1935, 25, 272–284. [Google Scholar] [CrossRef]
- Hembram, T.K.; Saha, S. Prioritization of Sub-Watersheds for Soil Erosion Based on Morphometric Attributes Using Fuzzy AHP and Compound Factor in Jainti River Basin, Jharkhand, Eastern India. Environ. Dev. Sustain. 2020, 22, 1241–1268. [Google Scholar] [CrossRef]
- Balasubramanian, A.; Duraisamy, K.; Thirumalaisamy, S.; Krishnaraj, S.; Yatheendradasan, R.K. Prioritization of Subwatersheds Based on Quantitative Morphometric Analysis in Lower Bhavani Basin, Tamil Nadu, India Using DEM and GIS Techniques. Arab. J. Geosci. 2017, 10, 1–18. [Google Scholar] [CrossRef]
- Patel, D.; Dholakia, M.; Nandhakumar, N.; Srivastava, P. Water Harvesting Structure Positioning by Using Geo-Visualization Concept and Prioritization of Mini-Watersheds Through Morphometric Analysis in the Lower Tapi Basin. J. Indian Soc. Remote Sens. 2012, 40, 299–312. [Google Scholar] [CrossRef]
- Khare, D.; Mondal, A.; Mishra, P.; Kundu, S.; Meena, P. Morphometric Analysis for Prioritization Using Remote Sensing and GIS Techniques in a Hilly Catchment in the State of Uttarakhand, India. Indian J. Sci. Technol. 2014, 7, 1650–1662. [Google Scholar] [CrossRef]
- Langbein, W.B. Topographic Characteristics of Drainage Basins; US Geological Survey Water-Supply Paper, 968-C; USGPO: Washington, DC, USA, 1947; pp. 125–157.
- Chandrashekar, H.; Lokesh, K.V.; Sameena, M.; Roopa, J.; Ranganna, G. GIS –Based Morphometric Analysis of Two Reservoir Catchments of Arkavati River, Ramanagaram District, Karnataka. Aquat. Procedia 2015, 4, 1345–1353. [Google Scholar] [CrossRef]
- Rama, V.A. Drainage Basin Analysis for Characterization of 3rd Order Watersheds Using Geographic Information System (GIS) and ASTER Data. J. Geomat. 2014, 8, 200–210. [Google Scholar]
- Kottagoda, S.D.; Abeysingha, N. Morphometric Analysis of Watersheds in Kelani River Basin for Soil and Water Conservation. J. Natl. Sci. Found. Sri Lanka 2017, 3, 273–285. [Google Scholar] [CrossRef]
- Avinash, K.; Jayappa, K.S.; Deepika, B. Prioritization of Sub-Basins Based on Geomorphology and Morphometricanalysis Using Remote Sensing and Geographic Information System (GIS) Techniques. Geocarto Int. 2011, 26, 1–24. [Google Scholar] [CrossRef]
- Rao, N.; Chakradhar, G.; Srinivas, V. Identification of Groundwater Potential Zones Using Remote Sensing Techniques in and Around Guntur Town, Andhra Pradesh, India. J. Indian Soc. Remote Sens. 2001, 29, 69–78. [Google Scholar] [CrossRef]
- Smith, K.G. Stand Grading Texture Erosional Topography. Am. J. Sci. 1950, 248, 655–668. [Google Scholar] [CrossRef]
- Acharya, T.; Nag, S. Study of Groundwater Prospects of the Crystalline Rocks in Purulia District, West Bengal, India Using Remote Sensing Data. Earth Resour. 2013, 1, 54–59. [Google Scholar] [CrossRef]
- Nag, S. Delineation of Groundwater Potential Zones in Hard Rock Terrain in Kashipur Block, Purulia District, West Bengal, Using Geospatial Techniques. Int. J. Waste Resour. 2016, 6, 1000201. [Google Scholar] [CrossRef]
- Das, S. Delineation of Groundwater Potential Zone in Hard Rock Terrain in Gangajalghati Block, Bankura District, India Using Remote Sensing and GIS Techniques. Model. Earth Syst. Environ. 2017, 3, 1589–1599. [Google Scholar] [CrossRef]
- Ghosh, A.; Adhikary, P.P.; Bera, B.; Bhunia, G.; Shit, P. Assessment of Groundwater Potential Zone Using MCDA and AHP Techniques: Case Study from a Tropical River Basin of India. Appl. Water Sci. 2022, 12, 1–22. [Google Scholar] [CrossRef]
- Jasrotia, A.; Bhagat, B.; Taloor, A.; Kumar, R. Remote Sensing and GIS Approach for Delineation of Groundwater Potential and Groundwater Quality Zones of Western Doon Valley, Uttarakhand, India. J. Indian Soc. Remote Sens. 2013, 41, 365–377. [Google Scholar] [CrossRef]
- Sikdar, P.; Chakraborty, S.; Adhya, E.; Paul, P. Land Use/Land Cover Changes and Groundwater Potential Zoning in and around Raniganj Coal Mining Area, Bardhaman District, West Bengal—A GIS and Remote Sensing Approach. J. Spat. Hydrol. 2004, 4, 1–24. [Google Scholar]
- Goyo, S.L.; Puno, G. Usage of Land Use/Land Cover and Anthropogenic Parameters in Prioritizing Conservation in Sub Watersheds of Upper Pulangi River. East Asian J. Multidiscip. Res. 2023, 2, 2081–2098. [Google Scholar] [CrossRef]
- Diwakar, A.; Singh, S.; Pramanik, M.; Chaudhary, S.; Negi, M. Soil Erodibility Mapping Using Watershed Prioritization and Morphometric Parameters in Conjunction with WSA, SPR and AHP-TOPSIS Models in Mandakini Basin, India. Int. J. River Basin Manag. 2022, 1–67. [Google Scholar] [CrossRef]
- Harker, P.; Vargas, L. The Theory of Ratio Scale Estimation: Saaty’s Analytic Hierarchy Process. Manag. Sci. 1987, 33, 1383–1403. [Google Scholar] [CrossRef]
- Hwang, C.-L.; Yoon, K. Methods for Multiple Attribute Decision Making. In Multiple Attribute Decision Making: Methods and Applications A State-of-the-Art Survey; Hwang, C.-L., Yoon, K., Eds.; Lecture Notes in Economics and Mathematical Systems; Springer: Berlin/Heidelberg, Germany, 1981; pp. 58–191. [Google Scholar] [CrossRef]
- Saaty, T.L. The Analytic Hierarchy Process: Decision Making in Complex Environments. In Quantitative Assessment in Arms Control: Mathematical Modeling and Simulation in the Analysis of Arms Control Problems; Avenhaus, R., Huber, R.K., Eds.; Springer: Boston, MA, USA, 1984; pp. 285–308. [Google Scholar] [CrossRef]
- Saaty, T.L. Decision Making with the Analytic Hierarchy Process. IJSSCI 2008, 1, 83. [Google Scholar] [CrossRef]
- Berdie, A.D.; Osaci, M.; Muscalagiu, I.; Barz, C. A Combined Approach of AHP and TOPSIS Methods Applied in the Field of Integrated Software Systems. IOP Conf. Ser. Mater. Sci. Eng. 2017, 200, 012041. [Google Scholar] [CrossRef]
- Huang, I.B.; Keisler, J.; Linkov, I. Multi-Criteria Decision Analysis in Environmental Sciences: Ten Years of Applications and Trends. Sci. Total Environ. 2011, 409, 3578–3594. [Google Scholar] [CrossRef]
- Jadidi, O.; Firouzi, F.; Bagliery, E. TOPSIS Method for Supplier Selection Problem. World Acad. Sci. Eng. Technol. 2010, 47, 956–958. [Google Scholar]
- Hudait, M.; Patel, P.P. Site Suitability Assessment for Traditional Betel Vine Cultivation and Crop Acreage Expansion in Tamluk Subdivision of Eastern India Using. AHP-Based Multi-Criteria Decision Making Approach. Comput. Electron. Agric. 2022, 200, 107220. [Google Scholar] [CrossRef]
- Silva López, J.O.; Salas López, R.; Rojas Briceño, N.B.; Gómez Fernández, D.; Terrones Murga, R.E.; Iliquín Trigoso, D.; Barboza Castillo, E.; Oliva Cruz, M.; Barrena Gurbillón, M.Á. Analytic Hierarchy Process (AHP) for a Landfill Site Selection in Chachapoyas and Huancas (NW Peru): Modeling in a GIS-RS Environment. Adv. Civ. Eng. 2022, 2022, e9733322. [Google Scholar] [CrossRef]
- Mahato, N. Environment and Migration, Purulia, West Bengal. Policies Pract. 2010, 32. Available online: https://www.researchgate.net/publication/315799602_Environment_and_Migration_Purulia_West_Bengal (accessed on 17 March 2024).
- Roy, A. Deforestation in social context: A case study of Purulia district in West Bengal, India introduction. Res. World–J. Arts Sci. Commer. 2014, 5, 114–120. [Google Scholar]
- Weiland, S.; Hickmann, T.; Lederer, M.; Marquardt, J.; Schwindenhammer, S. The 2030 Agenda for Sustainable Development: Transformative Change through Sustainable Development Goals? Politics Gov. 2021, 9, 90–95. [Google Scholar] [CrossRef]


| Data | Purpose | Resolution/Scale | Year | Source |
|---|---|---|---|---|
| Landsat-9 | LULC | 30 mt | Early April, 2023 | (http://earthexplorer.usgs.gov/, accessed on 17 March 2024) [42] |
| SRTM-DEM | Drainage morphometry | 30 mt | Early April 2023 | (http://earthexplorer.usgs.gov/, accessed on 17 March 2024) [42] |
| Toposheet | Delineation of watershed | 1:250,000 | 1961 | Survey of India (SOI), Kolkata [43] |
| Lithology | Lithological units | 1:250,000 | 2023 | (https://bhukosh.gsi.gov.in/Bhukosh/Public, accessed on 17 March 2024) [44] |
| Geomorphology | Geomorphic divisions | 1:250,000 | 2020 | (https://bhukosh.gsi.gov.in/Bhukosh/Public, accessed on 17 March 2024) [44] |
| Geomorphometric Units | Formula | References |
|---|---|---|
| Linear parameters | ||
| Stream order (U) | Hierarchical rank | [8] |
| Stream number (Nu) | Nu1 + Nu2… + Nun | [47] |
| Stream length (Lu) | Lu1 + Lu2… + Lun | [47] |
| Mean stream Length (Lsm) | Average of stream length of all orders | [47] |
| Stream Length Ratio (Lur) | Lu/Lu−1 Lu = total stream length of ‘U’ order, Lu−1 = the total stream length of next lower order | [47] |
| Mean Stream Length Ratio (Rlsm) | Average of stream length ratios of all orders | [51] |
| Bifurcation Ratio (Rb) | Nu/Nu+1 Nu = total number of streams of ‘U’, Nu+1 = number of streams of next higher order | [51] |
| Mean bifurcation Ratio (Rbm) | average of bifurcation ratios of all orders | [8] |
| Areal Parameters | ||
| Basin area (A) | Analysis in GIS environment | |
| Basin perimeter (p) | Analysis in GIS environment | |
| Basin length (Lb) | Distance between outlet and farthest point on basin boundary | |
| Relative perimeter | A/P | |
| Mean basin width | A/Lb | |
| Drainage density (Dd) | Lu/A | [47] |
| Stream Frequency (Fs) | Nu/A | [51] |
| Drainage texture (Dt) | Nu/P | [51] |
| Drainage Intensity (Di) | Fs/Dd | [52] |
| Elongation Ratio (Re) | 1.128(A)0.5/Lar | [51] |
| Infiltration Number (If) | Dd × Fs | [52] |
| Circularity Ratio (Rc) | 4πA/P2 | [53] |
| Form factor (Rf) | A/Lar2 | [47] |
| Length of overland flow (Lg) | 1/(2 × Dd) | [51] |
| Constant of channel maintenance (c) | 1/Dd | [51] |
| Compactness coefficient (Cc) | 0.2821 × P/(A)0.5 | [54] |
| Shape factor (Ru) | Lar2/A | [53] |
| Fineness ratio (Rfn) | Lar/p | [55] |
| Texture ratio (Rt) | Nu1/P Nu1 = stream number of 1st order | [56] |
| Relief Parameters | ||
| Maximum elevation of the area (Me) | Extracted from DEM | |
| Minimum elevation of the area (Mm) | Extracted from DEM | |
| Basin relief (H) | Me − Mm | [47] |
| Relief ratio (Rh) | H/Lar | [47] |
| Ruggedness number (Rn) | (H × Dd)/1000 | [51] |
| Melton Ruggedness number (MRn) | H/(A)0.5 | [57] |
| Relative relief (Rr) | H/P | [58] |
| Dissection Index | H/M | [57] |
| n | 1 | 2 | 3 | 4 | 5 | 6 | 7 | 8 | 9 | 10 | 11 | 12 | 13 |
|---|---|---|---|---|---|---|---|---|---|---|---|---|---|
| RI | 0 | 0 | 0.58 | 0.90 | 1.12 | 1.24 | 1.32 | 1.41 | 1.45 | 1.49 | 1.51 | 1.53 | 1.56 |
| Geomorphometric Units | 2A2B5k | 2A2B5b | 2A2B5j | 2A2B5h | 2A2B5m |
|---|---|---|---|---|---|
| Total no. of stream order | 54 | 33 | 41 | 23 | 15 |
| Number of stream order 1 | 50 | 31 | 39 | 22 | 13 |
| Number of stream order 2 | 2 | 2 | 2 | 1 | 1 |
| Number of stream order 3 | 2 | 0 | 0 | 0 | 1 |
| Length of stream order 1 in mt. | 35,769.50 | 14,315.60 | 17,938.00 | 14,599.50 | 13,086.50 |
| Length of stream order 2 in mt. | 13,547.20 | 2246.41 | 3630.78 | 2469.55 | 7256.89 |
| Length of stream order 3 in mt. | 1274.57 | 0 | 0 | 0 | 455.61 |
| Total length of streams in mt. | 50,591.42 | 16,562.0 | 21,568.81 | 17,069.1 | 20,799.09 |
| Stream length ratio | 13.27 | 6.37 | 4.94 | 5.91 | 17.73 |
| Bifurcation ratio | 13 | 15.50 | 19.50 | 22 | 7 |
| Area in square-km | 75.85 | 43.47 | 22.09 | 43.68 | 27.31 |
| Perimeter in km | 44.83 | 38.42 | 23.94 | 41.82 | 26.92 |
| Fineness ratio | 0.29 | 0.16 | 0.20 | 0.14 | 0.65 |
| Form factor | 0.43 | 1.07 | 0.90 | 1.24 | 0.08 |
| Shape Factor Ratio | 2.32 | 0.93 | 1.10 | 0.80 | 11.51 |
| Drainage Texture | 1.20 | 0.85 | 1.71 | 0.54 | 0.55 |
| Compactness Coefficient | 1.45 | 1.64 | 1.44 | 1.79 | 1.48 |
| Circularity ratio | 0.48 | 0.37 | 0.49 | 0.31 | 0.47 |
| Elongation ratio | 0.74 | 1.16 | 1.07 | 1.26 | 0.33 |
| Drainage density in km/km2 | 0.66 | 0.38 | 0.97 | 0.39 | 1.85 |
| Stream frequency | 0.71 | 0.75 | 1.85 | 0.52 | 0.54 |
| Constant of channel maintenance | 1.49 | 2.62 | 1.02 | 2.55 | 0.53 |
| Infiltration Number | 0.47 | 0.28 | 1.81 | 0.20 | 1.01 |
| Drainage Intensity | 1.06 | 1.9 | 1.90 | 1.34 | 0.29 |
| Average Length of Overland Flow (km) | 0.74 | 1.31 | 0.51 | 1.27 | 0.26 |
| Total Basin Relief (H) m | 336 | 342 | 345 | 372 | 309 |
| Relief Ratio | 25.32 | 53.66 | 69.83 | 62.92 | 17.42 |
| Relative Relief Ratio | 7.49 | 8.90 | 14.41 | 8.89 | 11.47 |
| Ruggedness Number | 0.22 | 0.13 | 0.33 | 0.14 | 0.57 |
| Height of Basin outlet (m) | 270 | 240 | 233 | 219 | 307 |
| Maximum Height of basin (m) | 606 | 582 | 578 | 591 | 616 |
| Dissection index | 0.55 | 0.58 | 0.59 | 0.62 | 0.50 |
| Micro Watersheds | Br | Dd | Sf | Dt | Lof | Tsl | CCm | Ff | Cr | Er | CS | Priority |
|---|---|---|---|---|---|---|---|---|---|---|---|---|
| 2A2B5k | 4 | 3 | 3 | 2 | 3 | 1 | 1 | 2 | 4 | 2 | 2.5 | high |
| 2A2B5b | 3 | 5 | 2 | 3 | 1 | 5 | 4 | 4 | 2 | 4 | 3.3 | moderate |
| 2A2B5j | 2 | 2 | 1 | 1 | 4 | 2 | 2 | 3 | 5 | 3 | 2.5 | high |
| 2A2B5h | 1 | 4 | 5 | 5 | 2 | 4 | 3 | 5 | 1 | 5 | 3.5 | low |
| 2A2B5m | 5 | 1 | 4 | 4 | 5 | 3 | 2 | 1 | 3 | 1 | 2.9 | high |
| Micro Watersheds | Lof | CC | Sf | CCm | Dd | Dt | Br | Ff | Er | Cr | Rr | CS | Priority |
|---|---|---|---|---|---|---|---|---|---|---|---|---|---|
| 2A2B5k | 3 | 3 | 3 | 3 | 3 | 4 | 2 | 2 | 2 | 4 | 2 | 2.77 | high |
| 2A2B5b | 1 | 2 | 2 | 1 | 1 | 3 | 3 | 4 | 4 | 2 | 3 | 2.31 | high |
| 2A2B5j | 4 | 4 | 1 | 4 | 4 | 5 | 4 | 3 | 3 | 5 | 5 | 3.85 | low |
| 2A2B5h | 2 | 1 | 5 | 2 | 2 | 1 | 5 | 5 | 5 | 1 | 4 | 3.08 | moderate |
| 2A2B5m | 5 | 5 | 4 | 5 | 5 | 2 | 1 | 1 | 1 | 3 | 1 | 3 | moderate |
| Micro Watersheds | I | Pt | Pn | Pb | Rh | MDh | Vf | W | P | R | HDh | CS | Priority |
|---|---|---|---|---|---|---|---|---|---|---|---|---|---|
| 2A2B5k | 2 | 4 | 1 | 1 | 2 | 2 | 2 | 1 | - | - | - | 1.87 | high |
| 2A2B5b | - | 2 | 4 | 4 | - | 3 | 3 | 4 | - | - | - | 3.17 | low |
| 2A2B5j | - | 1 | 2 | 2 | 3 | 4 | 1 | 2 | 1 | 1 | - | 1.78 | high |
| 2A2B5h | - | 3 | 3 | 3 | 4 | 5 | 4 | 3 | 2 | 2 | 2 | 3 | moderate |
| 2A2B5m | 1 | 5 | 5 | 5 | 1 | 1 | 5 | 5 | 3 | 3 | 1 | 3.18 | low |
| Micro Watersheds | BG | GG | HS, A, MU | P | MS | CG, G | Gss | CS | Priority |
|---|---|---|---|---|---|---|---|---|---|
| 2A2B5k | 2 | 1 | 1 | 2 | - | - | - | 1.5 | high |
| 2A2B5b | - | 3 | 5 | - | 3 | - | - | 3.67 | low |
| 2A2B5j | - | 5 | 4 | 1 | 1 | 2 | - | 2.6 | moderate |
| 2A2B5h | - | 2 | 3 | - | 2 | 1 | 1 | 1.8 | high |
| 2A2B5m | 1 | 4 | 2 | - | - | - | - | 2.33 | moderate |
| Micro Watersheds | Ag | S | W | Lu | Sh | Pl | AgF | R | Df | Bl | CS | Priority |
|---|---|---|---|---|---|---|---|---|---|---|---|---|
| 2A2B5k | 4 | 5 | 3 | 2 | 4 | 4 | 4 | 2 | 4 | 2 | 3.4 | low |
| 2A2B5b | 1 | 1 | 1 | 5 | 3 | 2 | 1 | 4 | 1 | 5 | 2.4 | high |
| 2A2B5j | 2 | 2 | 4 | 3 | 2 | 3 | 2 | 3 | 2 | 1 | 2.4 | high |
| 2A2B5h | 3 | 3 | 5 | 4 | 1 | 1 | 3 | 5 | 3 | 4 | 3.2 | moderate |
| 2A2B5m | 5 | 4 | 2 | 1 | 5 | 5 | 5 | 1 | 5 | 3 | 3.6 | low |
| Criteria | Soil Erosion | Ground Water Recharge | LULC | Hydro Geomorphology | Lithology | Geometric Mean | Relative Weights |
|---|---|---|---|---|---|---|---|
| Soil Erosion | 1 | 1.28 | 1.28 | 1.8 | 3 | 1.54 | 0.29 |
| Ground Water Recharge | 0.77 | 1 | 1 | 1.4 | 2.33 | 1.20 | 0.22 |
| LULC | 0.77 | 1 | 1 | 1.4 | 2.33 | 1.20 | 0.22 |
| Hydro Geomorphology | 0.55 | 0.71 | 0.71 | 1 | 1.66 | 0.86 | 0.16 |
| Lithology | 0.33 | 0.42 | 0.42 | 0.6 | 1 | 0.51 | 0.09 |
| Micro Watersheds | Final Rank | Final Prioritization | |||
|---|---|---|---|---|---|
| 2A2B5k | 0.0184 | 0.0030 | 0.1382 | 1 | high |
| 2A2B5b | 0.0078 | 0.0174 | 0.6902 | 5 | low |
| 2A2B5j | 0.0120 | 0.0107 | 0.4698 | 3 | moderate |
| 2A2B5h | 0.0138 | 0.0097 | 0.4126 | 2 | moderate |
| 2A2B5m | 0.0110 | 0.0098 | 0.4713 | 4 | moderate |
Disclaimer/Publisher’s Note: The statements, opinions and data contained in all publications are solely those of the individual author(s) and contributor(s) and not of MDPI and/or the editor(s). MDPI and/or the editor(s) disclaim responsibility for any injury to people or property resulting from any ideas, methods, instructions or products referred to in the content. |
© 2024 by the authors. Licensee MDPI, Basel, Switzerland. This article is an open access article distributed under the terms and conditions of the Creative Commons Attribution (CC BY) license (https://creativecommons.org/licenses/by/4.0/).
Share and Cite
Halder, S.; RoyChowdhury, A.; Kar, S.; Ray, D.; Bhandari, G. Critical Watershed Prioritization through Multi-Criteria Decision-Making Techniques and Geographical Information System Integration for Watershed Management. Sustainability 2024, 16, 3467. https://doi.org/10.3390/su16083467
Halder S, RoyChowdhury A, Kar S, Ray D, Bhandari G. Critical Watershed Prioritization through Multi-Criteria Decision-Making Techniques and Geographical Information System Integration for Watershed Management. Sustainability. 2024; 16(8):3467. https://doi.org/10.3390/su16083467
Chicago/Turabian StyleHalder, Sudipto, Abhishek RoyChowdhury, Sayanti Kar, Debdas Ray, and Gupinath Bhandari. 2024. "Critical Watershed Prioritization through Multi-Criteria Decision-Making Techniques and Geographical Information System Integration for Watershed Management" Sustainability 16, no. 8: 3467. https://doi.org/10.3390/su16083467