Article

A Biodiversity Monitoring Case Study in Viticulture: Manual and Digitalized Collaborative Methodology to Pursue the European Commission’s Sustainable Challenges

1
Department of Agriculture, Food and Environment, University of Pisa, Via del Borghetto 80, 56124 Pisa, Italy
2
Department of Agriculture, Food, Environment and Forestry, University of Florence, Piazzale delle Cascine 15, 50144 Florence, Italy
*
Author to whom correspondence should be addressed.
Sustainability 2024, 16(8), 3469; https://doi.org/10.3390/su16083469
Submission received: 23 February 2024 / Revised: 16 April 2024 / Accepted: 18 April 2024 / Published: 21 April 2024

Abstract

:
The European Commission (EC) promotes policies addressing the needs of a growing human population while adhering to ecological principles that ensure ecosystem sustainability. Viticulture, one of the most widespread cultivations in the world, is, at the same time, one of the most environmentally impactful cultivations. Many studies have been conducted worldwide to identify more sustainable practices because vine monoculture, when repeated for long periods in the same territory, combined with low attention to the agronomic balance of vineyards, is causing biodiversity loss. The study aims to implement analytics for the accounting of biodiversity supported by digital tools like smart applications and digital platforms. Two farms were analyzed in a vacated area for red wine production in the center of Tuscany (Italy). A conventional biodiversity assessment protocol was used to evaluate the magnitude of biodiversity. Smartphone applications and a digital database creation platform supported this. The results highlighted an overall low level of biodiversity from a biodiversity perspective, while the use of smart applications and digital platforms represents an efficient tool for mitigating recognition errors in flora and fauna assessments and a powerful instrument for monitoring and tracking farm biodiversity. The study provides an overview of biodiversity status in a wine production area and a methodology to make its assessment easier and more reliable.

1. Introduction

As one of the primary land uses influenced by natural and human processes, agriculture requires reprogramming [1]. Farming is a widespread practice in Europe, and it must address the needs of a growing human population while adhering to ecological principles that ensure ecosystem sustainability [2]. Additionally, understanding how conventional agricultural practices impact the ecosystem services provided by crop soils, including biodiversity, is crucial, making it increasingly urgent to revise management strategies [3]. In recent years, discussions at the European level on the links between digitalization and the environment have intensified. Several strategies included in the European Green Deal, such as the new Circular Economy Action Plan, the “From producer to consumer” strategy and the EU Biodiversity Strategy for 2030, use digital tools to achieve their environmental and climate objectives to respond to the issue in a coherent manner. The key principle of the Green Deal is that sustainable precision farming can represent the implementation of Best Agricultural Practices (BAPs) in specific production contexts for the achievement of sustainability declined in its three pillars: social (respect for man), environmental (protection of natural resources) and economic (growth that improves the quality of life while respecting the environment).

1.1. The Agriculture Role towards the Digital Transformation and the Green Transition

In this context, the agricultural sector faces a dual challenge: digital transformation and green transition. Due to these challenges, the entire production system must address critical issues such as providing food security and increased productivity through sustainable agricultural management. These requirements call for a shift and adaptation of traditional farming practices to mitigate the effects of climate change and promote the sustainable use of natural resources [4]. Agriculture is expected to play a multifunctional role in terms of socioeconomic and environmental value, including the need to plan agricultural activities based primarily on ecological principles to ensure ecosystem sustainability [5]. Preserving biodiversity is also a component of achieving these important goals. Creating synergistic functional interactions between the structural aspects of the agroecosystem involves conserving biodiversity through the establishment and management of heterogeneous environments both within and outside cultivated fields [6]. To enhance and sustain biodiversity in agroecosystems such as vineyards and olive orchards, it may be beneficial to integrate various types of biological infrastructure that can improve both production and landscape quality through intelligent management. This can be achieved through the functional biodiversity approach, which provides different services and promotes biological control by manipulating the ecological infrastructure within and beyond the farm boundaries, thereby significantly impacting pest regulation and soil fertility improvement [7]. In this regard, biodiversity plays a key role in maintaining the ecological balance and sustainability of agricultural landscapes, and its role is fundamental for vineyards, which rely on a different array of organisms to support the growth of grapevines. According to Mazzocchi et al. [8], many factors highlight the need to overcome the traditional productive vision of viticulture and promote the biodiversity of the viticulture ecosystem. In this regard, vineyards have many specific characteristics suitable for agricultural practices aimed at biodiversity preservation [9]. One of these characteristics is the presence of cover crops, which, while protecting soil erosion, regulating vine growth and improving soil stricture and fertility, promote the biological diversity in the root zones and provide habitat for many beneficial organisms. In addition, all the agricultural practices aimed at preserving biodiversity promote a high number of insects and plant species able to ensure higher fertility, better soil structure and water quality and decrease the runoff, erosion, salinity and all the risks connected to [10].

1.2. Integrating Digital Technologies for Biodiversity Monitoring in Agriculture

From the perspective of ecosystem services and nature contributions, many wildlife species play vital roles in various agricultural contexts. However, intensive practices and techniques endanger biodiversity in the EU. These techniques, known for their impact on soil and water pollution, can deplete natural resources to a critical degree [11]. In this context, another factor to consider alongside the depletion of biodiversity is landscape simplification, which holds economic significance in a country like Italy [12]. Landscape simplification, resulting from high-intensity farming models and the abandonment of marginal and less productive areas, leads to the loss of natural habitats. The availability of cultural ecosystem services, which are valuable for both the quality of human life and the economic evaluation and planning of farms and landscapes, is also influenced by this high-intensity model [13].
In this scenario, tracking biodiversity could help farmers to evaluate the composition, abundance and interactions of different organisms, which directly influence the vigor and quality of grapevines [14]. Digitalization can enhance biodiversity tracking in the vineyards by integrating innovative digital technologies (i.e., remote and proximal sensing, geographic information system, automatic data collection), and it can enable farmers to collect and analyze a large amount of data on biodiversity parameters functional to monitor and assess the health of vineyards [15]. In this way, farmers could make informed decisions to support biodiversity and promote ecosystem services. According to Balogun et al. [16] and Ceipek et al. [17], these technologies have useful applications in socioeconomic, environmental, sustainable, and climate studies that aim to enhance productivity and efficiency in systems with high demands for food, feed, and clean energy.
This study aimed to evaluate variations in the biodiversity rates of two farms in the upper Orcia Valley. This zone is characterized by a badlands landscape. The strong action of water runoff across clayey bedrock land caused this type of intensely dissected landscape. In fact, most of the mountains and hills along Italy’s Apennine chain have this characteristic bedrock, where the degradation effects can be amplified by different vegetation covers, land uses, and wet–dry Mediterranean climate [18]. In this regard, it is critical to consider the interaction between vegetation and geomorphic dynamics. Site-specific conditions may play an important role; for example, in a cultivated zone, such as a vineyard, vegetation cover may help mitigate soil erosion, but water runoff may cause vegetation disturbance [19].
All these aspects have been thoroughly considered to analyze the collected data and explore future measures to digitize and automatize the biodiversity data collection. The assessment of traditional quantifying biodiversity methods and the evaluation of the presence and abundance of species correlated to the geographical location of the two farms have been considered to detect the pivotal features that should be monitored through the use of a digital and automated system.

2. Materials and Methods

2.1. Study Area

The present study was carried out from March to October of 2021 and 2022 in the agricultural hinterland of Siena in Tuscany, the Orcia Valley, an area made up of small-scale developments that produce typical crops, such as vineyards [20].
The climate in the zone of interest, around the municipality of Trequanda (Siena), is warm and temperate, and according to the Köppen and Geiger classification, it can be classified as Mediterranean climate subtype Csa. This classification corresponds to the hot summer Mediterranean climate with at least one month with an average temperature above 22 °C, the coldest month with an average temperature above 0 °C, and at least four months with an average temperature above 10 °C. During the trial, it had an annual rainfall of 812 mm and an average temperature of 13.6 °C.
Two organic farms, Farm A (43.1821 N, 11.6540 E) and B (43.1646 N, 11.6719 E), belonging to the Orcia Controlled Designation of Origin (DOC) area were selected to monitor, evaluate and track agrobiodiversity. These two farms are in two of the twelve municipalities identified in the denomination DOC, Trequanda and Montalcino (SI), established on 14 February 2000 to protect and promote the image of wine and its territory.
In agreement with the identified farms, the vineyards, where the samplings of agrobiodiversity were carried out, were selected. The sampling was carried out three times a year in May (27 May 2021 and 27 May 2022), June (26 June 2021 and 28 June 2022) and September (1 October 2021 and 1 October 2022).
Table 1 shows the main characteristics of the farms.

2.2. Selected Farms

Concerning Farm A, the samples were taken in a vineyard (Figure 1), with an area of 1 hectare cultivated with Sangiovese. In contrast, in the case of Farm B, a 1-hectare vineyard was divided into plots of Sangiovese, Pinot Nero, Pinot Bianco and Viognier (Figure 1)

2.3. Biodiversity Framework

The biodiversity of the two studied farms was examined in terms of their geographical contexts, i.e., the Orcia Valley was examined using digital metadata. This was carried out through the Web Map Service (WMS) metadata contained in the Geoscope, the webGIS tool of the Tuscany region, where thematic information was chosen to frame the farms in a broader and more generalized reality characterized by precise areal, reticular and punctual characteristics. In this way, the components of biodiversity can be identified through an analysis that begins with the definition of territorial order and then moves on to land and cultivation. In this regard, the level of areal diversification between farms was necessary, considering not only the soil, hydrography, land use and cover characteristics but also the landscape and presence of protected areas. All of this was carried out to identify homogeneous areas at the slope level, water availability and soil types that could be linked to the company’s quality and type of production.
Thanks to the Web Map Service (WMS), a series of online data were collected and visualized as layers on the free and open-source geographic information system QGIS to obtain georeferred data (Table 2). These were used to highlight the farms’ boundaries and create informative thematic maps. The layers were selected based on the components of the Orcia Valley’s territorial and landscape heritage, which consists of a collection of long-lasting structures resulting from the co-evolution of the natural environment to be preserved and human settlements to be enhanced [21].
In this regard, it has been recognized that the basic characteristics of this territory are the result of the coexistence of interconnected landscapes and territorial characteristics such as the historical settlement system, hydro-geomorphological support, ecological systems and agroforestry territories [22]. The informative layers in Table 2 were chosen based on characteristics thought to be useful for quantifying biodiversity, both from a vegetational and a faunistic point of view, to improve it and make it a valuable resource for preserving the territory and increasing its production value. The second stage included biodiversity analysis at the farm level to understand and describe its structural aspects. Agrobiodiversity was described using data retrieved from the Statistical Yearbook, Agricultural Census, territorial surveys, aerial photography or company surveys. The project specifically studied structural agrobiodiversity, relying on data provided by the companies themselves regarding the definition of the farmland system (plots of ecological infrastructures, etc.) and the definition of the crop system over time. The components of biodiversity studied concerned both the flora and fauna of the agroecosystem and made it possible to identify the relationships between the agricultural structure and the species to which different functions can be attributed (herbaceous and arboreal species, nitrogen-fixing soil microorganisms, decomposers, earthworms, useful arthropods, pollinators, etc.).
The timeline of the data collection conducted in the farmlands is detailed in Table 3. The information sources necessary for the corporate biodiversity survey are shown in Table 2 [23].
According to information relating to company owners and the ISPRA monitoring guidelines manual [23], six indicators were used to evaluate structural biodiversity (Table 4).
The layers indicated in Table 2 were used to create a specific QGIS project to characterize the area where the companies are in the Val D’Orcia context. In addition to the QGIS data derived from the monitoring activity in Farm A and Farm B, thematic maps representing the biodiversity indices were generated.

2.4. Biodiversity Assessments in Study Farms

To evaluate biodiversity and its potential for sustainability, it is preferable to use specific indicators and indices that allow for numerical data to catalog and characterize the diversity of fragmented habitats and agroecosystems. In the case of Orcia Valley, which consists of complex landscape structures and various historic settlement systems, it was important to emphasize its naturalistic value, which is at risk due to its anthropic presence. The complexity of the landscape is firstly due to the geomorphological characteristics of the badland, which affect the structure of the land in different ways due to different geomorphic processes, such as rilling, gullying, piping and gravitational mass movements [22].
Following the ISPRA manual [23], several indexes have been identified: (a) composition indicators, (b) fragmentation indicators, (c) connection indicators and (d) protection indicators. Due to the purpose of this study, only the composition indices were calculated; those were used to estimate fundamental characteristics of diversity, richness and evenness. There are many applications in this case involving the study of ecotype richness and similarity, such as the study of different cover soil classes and their spatial distributions to determine aggregation and isolation cases. As a result, it appeared necessary to use different indices to evaluate diversity because each index has a different sensibility to richness and species distribution. Within the composition indices, the Shannon Diversity Index (H′) was chosen because, as evident from the literature, it measures diversity in terms of richness, with a moderate discriminating ability and low dependence on sample size [23,24]. The Shannon index principle foresees a positive linear regression, i.e., as one increases, the other also increases.

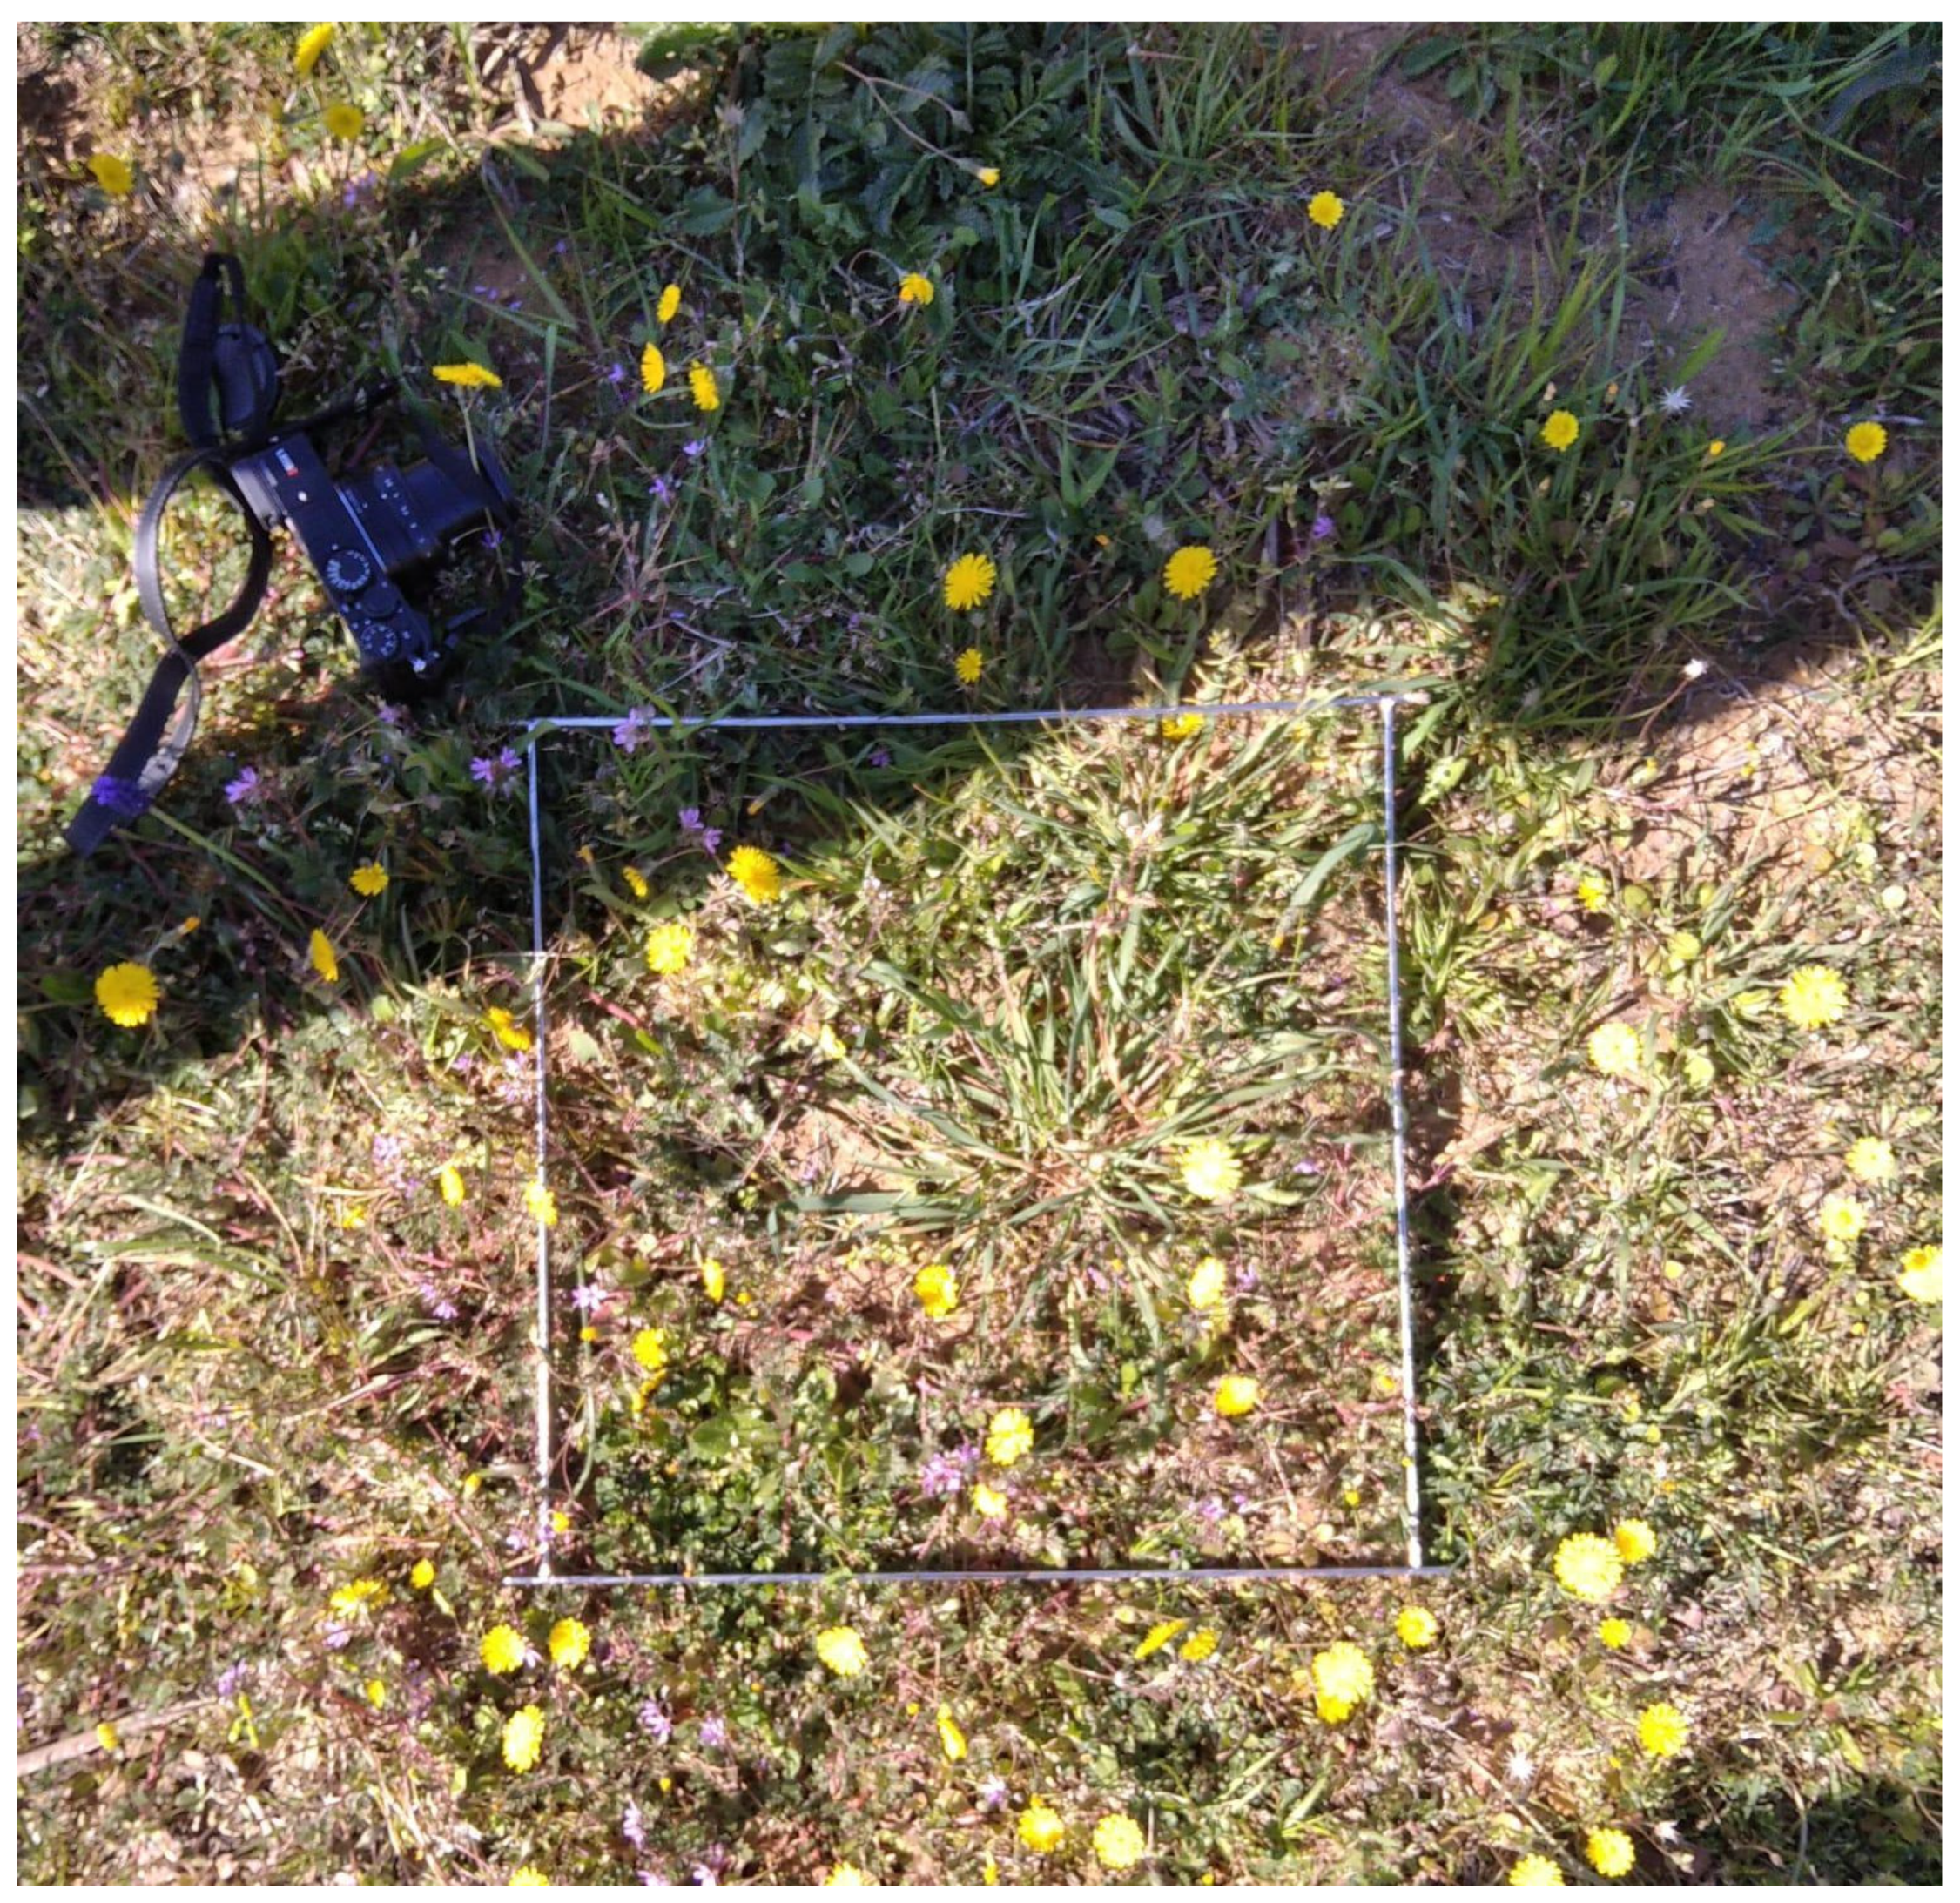
2.5. Plant Species Monitoring Survey

Several methods may be used when sampling herbaceous species; in this study, the Raunkiaer method was used [23]. It consists of a visual estimation of the different species present in a field in terms of abundance and dominance. The frequency of a species is recorded by randomly throwing an iron frame of fixed dimension (a square of 0.50 × 0.50 m) on the field and counting and classifying the species inside (Figure 2). The accuracy of the method depends on the number of samples, which should, theoretically, be indefinitely carried out as long as there are no new species; however, in this case, we used the simplified methodology with a fixed number of 9 samples. This method required a deep knowledge of spontaneous flora and the support of interactive identification tools to analyze the cultivated environment across different stages of development. Specifically, two-step verification was carried out. Firstly, an expert agronomist performed a visual assessment that provided the species, and then Google Lens and PlantNet applications were used to perform digitally supervised recognition. The survey protocol included the photographing of plants in situ without removal or disturbance. The pictures were acquired at a height of 0.5 m from the ground and positioned on the center of the iron frame. Within the frame, three shots were taken of any individual species. Finally, the images were processed with the two applications, and qualitative recognition was carried out. This method was intended to replicate the realistic use of plant-identification smart applications; therefore, no images were pre-processed, i.e., cropping or adjusting the brightness or contrast settings. Then, a comparison in terms of success rate (%) in species recognition was carried out by comparing human visual assessment and image analysis via applications. Baseline analysis involved quantifying the descriptive statistics to summarize the accuracy of each throw.
Finally, the difference and the richness of herbaceous species in the vineyard were calculated through the use of two indicators: ecological field diversity (EFD) and ecological field richness species (EFR). Throughout the EFD, all of the species in different plots were identified, which is fundamental for the estimation of the Shannon index (H′); in contrast, by summarizing all the different species identified (EFR), the index of species richness (ISR) can be obtained.

2.6. Invertebrates Monitoring Survey

According to the protocols of Observatoire Agricole Biodiversité (OaB) [25], the entomofauna and terrestrial invertebrates were sampled, monitored and recognized, with particular attention given to annelids (Lumbricus terrestris L., 1758, of the Lumbricidae family within the Ophisthopora order), arthropods (the Carabidae family within the Coleoptera order; the Cercopidae family within the Hemiptera order; the Pentatomidae family within the Heteroptera order; the families of Pieridae, Lycaenidae and Nymphalidae within the Lepidoptera order; and Apidae and Vespidae within the Hymenoptera order) and Mollusca (Lehmannia spp. Heynemann, 1863, belonging to the Limacidae family within the Stylommatophora order, and Cornu aspersum Müller belonging to the Helicidae family within the Stylommatophora order).

2.6.1. Annelids

Annelid sampling was carried out as provided by the Observatoire Agricole de la Biodiversité (OaB), which follows the objectives of the Participatory Observatory of Earthworms, which proposes a simplified assessment tool for animal biodiversity using earthworms in agricultural or natural soils. This soil biodiversity self-assessment tool helps to evaluate the impact of current agricultural practices and their evolution.
Within the framework of this observatory, the classification of earthworms according to three functional groups is outlined:
-
Spligs: small-sized and very colorful; they live on the surface of the soil, in the leaf litter or any heap of decaying organic waste (a manure heap or compost, for example) that they decompose;
-
Anectics: large, living in the soil in +/− vertical galleries and feeding on the surface of decaying organic matter. There are two groups in the anecious: the epi-anecious and the strict anecious;
-
Endogenous: ranging from pink to very pale; they live within the soil and do not rise to the surface.
This method involves watering three 1 m2 squared plots with a combination of diluted water and mustard. The earthworms rise to the surface due to irritation. All that is left to do is collect, count and identify them before washing them in clean water. This should be repeated at least every three years to assess the fertility of the soil. For the operational part, the two vineyards were split into two sections, and three 1 m2 areas were chosen for each of the 2 sections, which were spaced 6 m apart and 10 m from the plot’s edge. The procedure was performed three times, once every fifteen minutes for each region, shaking the soil (approximately 20 cm) in each location. Mustard is used because it contains an active ingredient, Allyl Isothiocyanate (AITC), which has an urticant action on the epidermis of earthworms, and the application of the same type of mustard during all repetitions is fundamental when comparing all the results of the surveys. The mustard extraction method, proposed by OPVT, does not make it possible to raise all the earthworms present under the irrigated area, but it makes it possible to characterize the functional structure of the earthworm stand of the plot. To classify the specimens found, the mini-guide “Determining earthworms” provided by the OaB was consulted [26].

2.6.2. Arthropods

For the operational part, each of the two vineyards was divided into two sections and in each of the two sections were selected 3 georeferenced and temporally independent test points. Blank poplar boards measuring 0.3 × 0.5 m, 50 m apart, were affixed to each test point. The same two-step verification was carried out as that used for plant species survey monitoring. First, an expert entomologist performed a visual assessment to identify the species. Then, species recognition was carried out using open-source apps, such as “INaturalist” and “Seek”. As for the herbaceous species, data on sampling and monitoring of the entomofauna, specifically Lepidoptera and arthropods, were used to calculate the Shannon Index (H′) and determine species diversity at the vineyard level. The RSA was also calculated for the entomofauna to determine the species richness observed within the sampled vineyards.

2.7. Statistical Analysis

The data regarding herbaceous species biodiversity were analyzed through the use of multivariate analysis of variance (MANOVA). The data were analyzed using the statistical software SPSS (IBM Corp. Released 2019, Version 26.0. Armonk, NY, USA: IBM Corp.). Wilks’ lambda, Pillai’s trace, Hotelling’s trace and Roy’s largest root were calculated to assess how the model terms contribute to the overall covariance. The Bonferroni method was employed for pairwise comparison. Biodiversity indicators (number of species, Shannon index and evenness) for each family group on the farm system level were calculated to analyze the biodiversity level of herbaceous species and to verify if any differences occurred. The multivariate analysis of variance was conducted on the mean values of the number of species, which were clustered by family group.
Due to the low amount of data regarding insect families, a chi-square test was conducted to assess their frequency variation related to farm characteristics and location. A measure of statistical significance in relation to the variables under study was evaluated through the use of a total chi-square, and then each piece of observed data was compared with the expected one. The degrees of freedom were calculated based on the number of categories in both analyses, and due to the small size of the dataset, a significance level of 0.05 was used to determine the critical value of the test. All of the data regarding the frequency of insect families were analyzed through the use of the Microsoft Excel plugin XLSTAT.

3. Results

3.1. Herbaceous Families Biodiversity

The data related to comparing the visual detection conducted by an expert agronomist and the applications used highlighted a recognition success rate of 100%. No errors were observed, probably thanks to the presence of characteristic elements, such as flowers and inflorescences, and thanks to the low density of spontaneous herbaceous species, which highlighted the contrast between plants and soil. Multivariate analysis of variance was conducted on the number of species clustered by family groups and Shannon index values. This analysis revealed significant differences (p < 0.05) between family groups for Euphorbiaceae, Lamiaceae, Plantaginaceae and Brassicaceae at the farm level. Regarding the Shannon index, significant differences (p < 0.05) in family groups were detected for Euphorbiaceae, Lamiaceae, Plantaginaceae and Brassicaceae, Rosaceae at the farm level (Table 5). From Table 6, significant differences are evident in the mean values between the farms for the same families found in previous analysis, except for Asparagaceae, which did not show evident differences in terms of mean values at the farm level for both dependent variables; however, in this case, it revealed significant differences for the number of species clustered by family.

3.2. Entomofauna Biodiversity Indicators

The data related to comparing the visual detection conducted by an expert entomologist and the applications used highlighted a recognition success rate of 100%. Biodiversity indicators at the farm system level were calculated to analyze the level of biodiversity in terms of entomofauna. From the ESD (Entomological Species Diversity) value, the H′ was calculated with the established threshold of x > 2. Both classes are lower than the threshold value, with lower values observed for arthropods. An opposite trend was detected for the ESR (Entomological Richness Species), with a higher number of arthropods and higher values than the established threshold value of x > 25. The total χ2 value for the entire test is very low (1.4814 × 10−44), indicating that, overall, there is strong statistical evidence to assert that there are significant differences or associations between the groups under study and the variable of interest. The chi-square analysis revealed that there are no significant differences between the Insecta families detected in the two farms with a total χ2 smaller than the tabulated values. Despite this, the family comparison at the individual data level revealed differences at the 0.05 level for the families Pieridae, Nymphalidae, Formicidae, Pentatomidae, Armadillidiidae, the class of Arachnida and the order of Coleoptera (Table 7).
No significant data in terms of abundance were collected regarding annelids during the trial period. In general, a higher number of annelids was detected in Farm 1, with twenty-nine individuals being identified, and only two were identified in Farm 2.

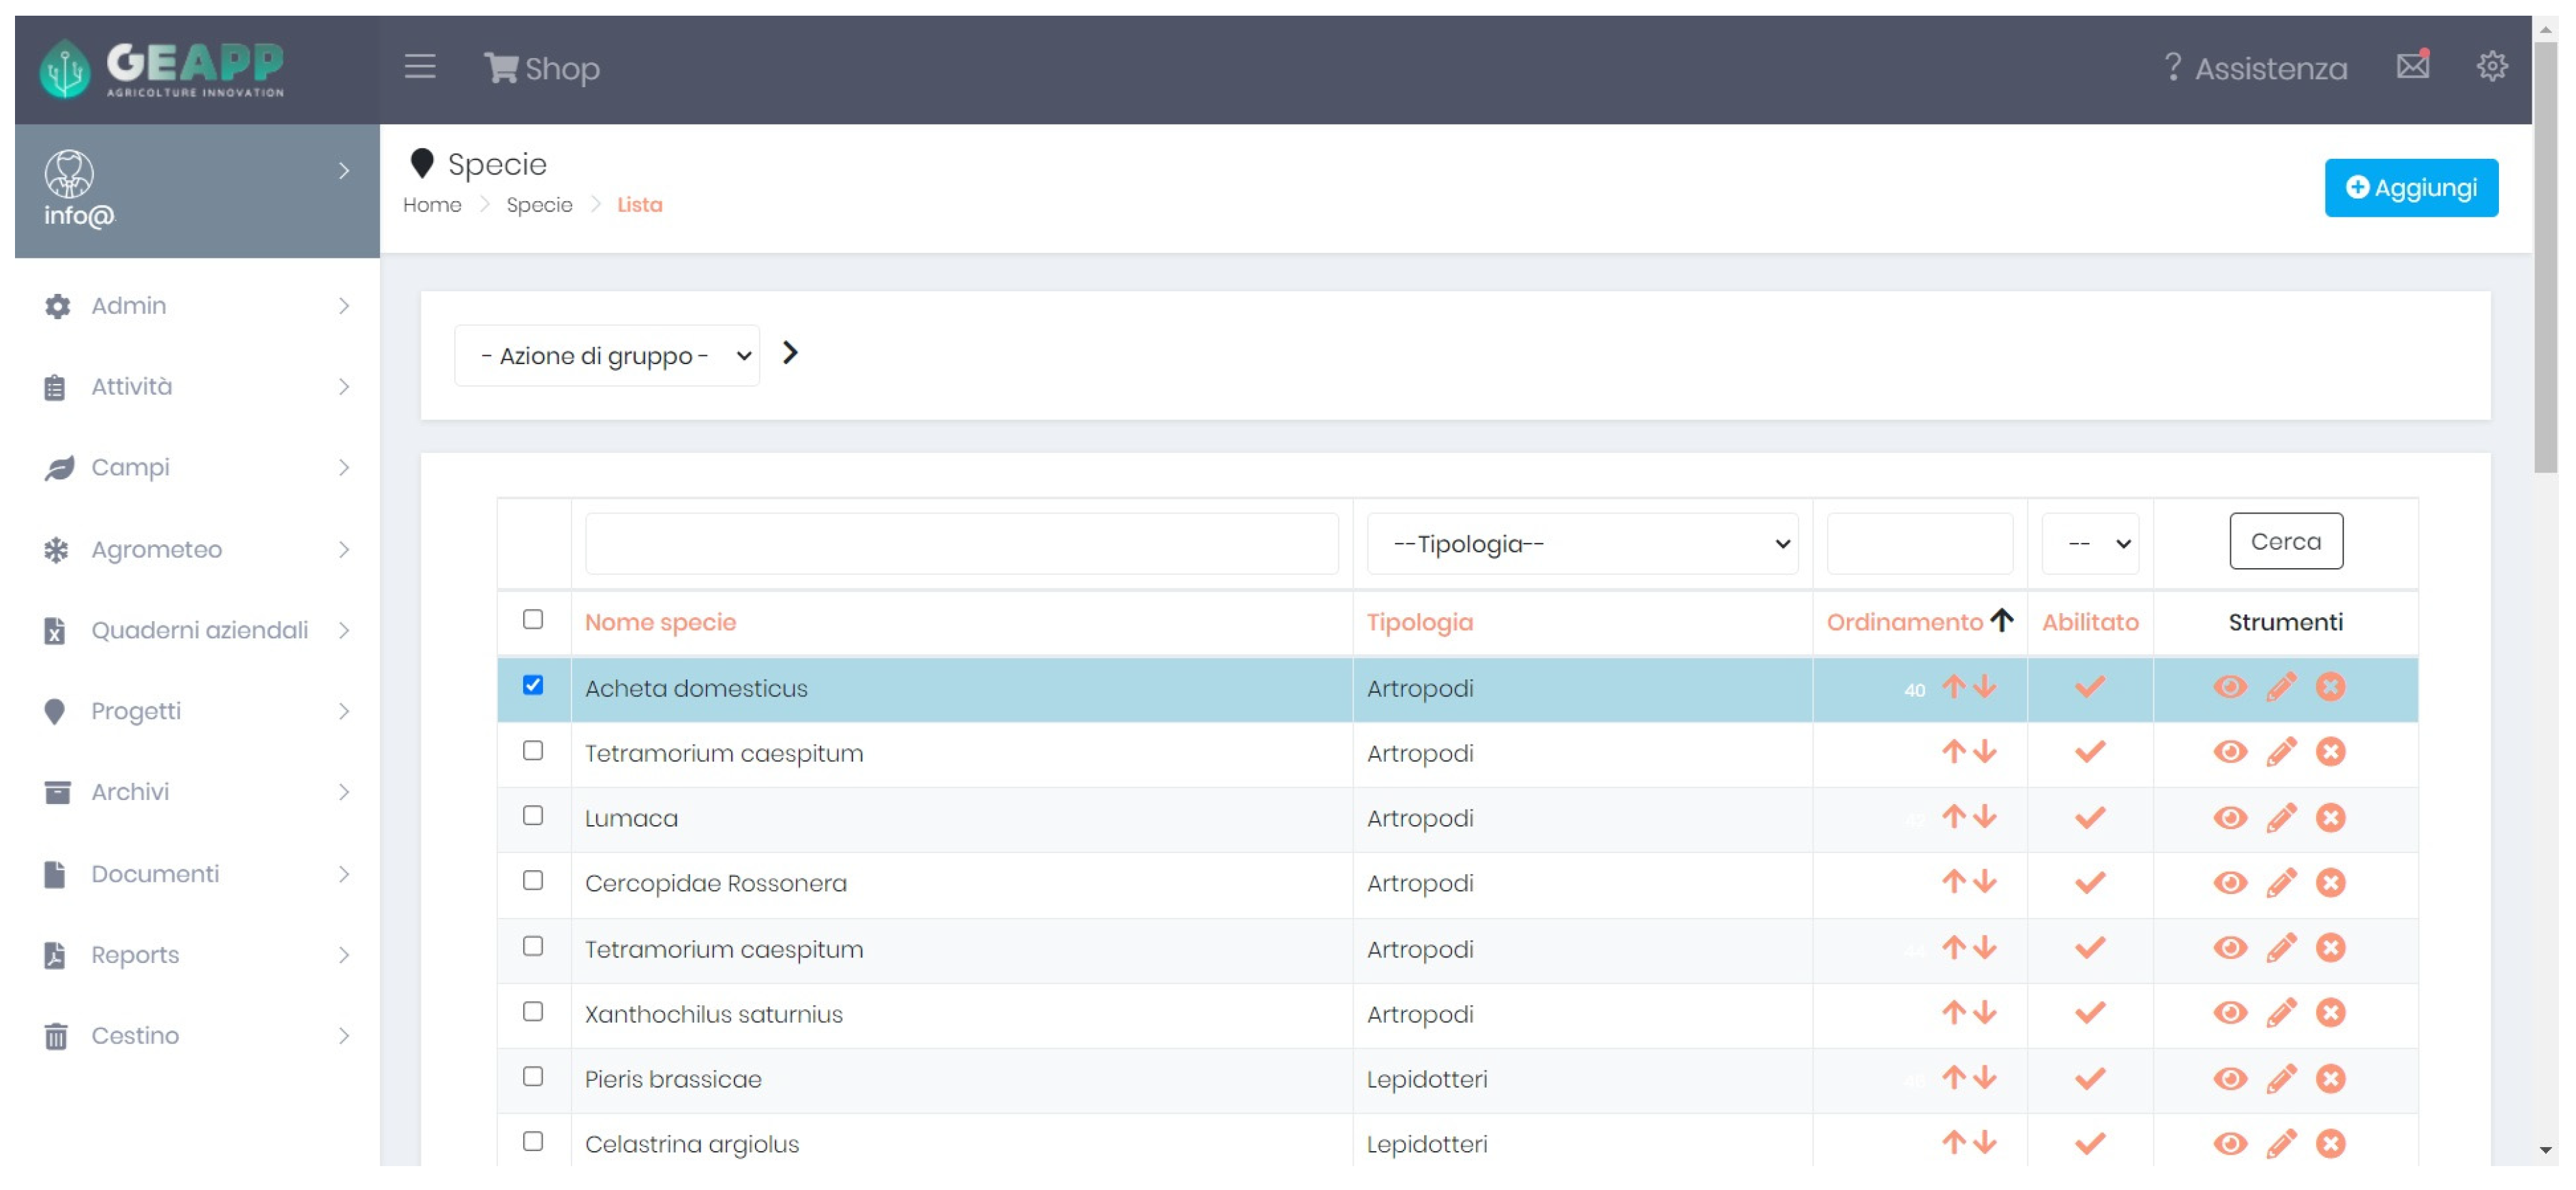
3.3. Digital Platform

All of the information collected during the survey was inserted into an online integrated platform for agriculture called GeApp (https://www.geapp.net/, accessed on 4 April 2024), allowing for a comparative and cross-sectional analysis of the data, which is a useful starting point for the digitalization of farm management toward sustainability (Figure 3). The platform summarized and visualized updated thematic layers about different characteristics of the farms, permitted the monitoring and tracking of the internal processes of the companies, and characterized the farms from an agro-environmental point of view (Figure 4). According to the data on biodiversity and pedoclimatic characteristics, thematic maps were created [27]:
-
Thematic territorial maps;
-
Site-specific layers created based on field activities;
-
Company-specific agro-pedological data, digitized and made available on a GIS system;
-
Weather forecast data;
-
Graphical crop plan;
-
Satellite data from the Sentinel constellation, expressed as vegetation indices, particularly:
-
NDVI—Normalized Difference Vegetation Index;
-
NDWI—Normalized Difference Water Index;
-
NDRE—Normalized Difference Red Edge;
-
Shannon index values.

4. Discussion

4.1. Biodiversity Indicators

The analysis of the number of species within each family group provided valuable insights into assessing the ecological richness of the selected vineyards. Additionally, ecological diversity was evaluated using Shannon index estimation. These assessments were conducted using a response–effect functional framework on the spontaneous plant species found in both organic farms. The goal was to determine if the specific pedoclimatic conditions of the area, combined with the optimal exposure of the vineyards in this district and similar farming practices, not only supported the vegetative and productive functions of the main crop but also influenced the overall trend of the biodiversity rates [28].
Quantitative estimation revealed a slightly higher number of herbaceous plants sampled in Farm 1 (137 plants) compared to Farm 2 (108 plants). The Asteraceae family had the highest total number of individual plants (83 plants). Further analysis using the MANOVA method allowed for a deeper understanding of how each family contributed to variations in biodiversity parameters while considering the effects of other plants in the model (Table 5). The results showed that the Plantaginaceae family significantly contributed to both the number of plants and the Shannon index. Detailed information about the estimates of the number of plants and Shannon index means and precision for different plant families revealed interesting insights (Table 6). The overall trend seen in the estimated means for each dependent variable and condition was similar between the two farms, except for the family of Asparagaceae, which exhibited significant differences in the mean number of species but not in the Shannon index. According to Maclaren et al. [29], such observations, which estimate specific and functional diversity, are crucial for assessing the impact of agricultural management on agroecosystem response. The number of species and the Shannon index reflect different aspects of biological diversity in ecological communities and elucidate the links between biodiversity, ecosystem and farming [30]. The number of species provides information about the types of plants present in the sampled vineyard, while the Shannon index considers both species richness and how species are distributed. Functional diversity plays a key role, with its indices directly related to plant responses to the environment [28]. In this case, the evenness component of functional diversity could explain the significant differences observed. Evenness quantifies how individuals are distributed over trait space, indicating a relatively uniform distribution of species within the Asparagaceae family in Farm 1 (0.045) and complete uniformity in Farm 2 (0). This explains the lack of significance in the data regarding the Shannon index, suggesting that the total diversity of species within this family is very low and driven primarily by a few abundant species rather than overall species diversity [31].

4.2. Entomofauna Indicators

The conversion of heterogeneous habitats into simplified and managed agricultural systems, such as vineyards, is a primary cause of habitat loss and fragmentation [32]. Habitat fragmentation, which is always linked with habitat loss in agricultural settings, poses challenges when analyzing biodiversity responses [33]. However, studies suggest that invertebrate abundance is significantly affected by both habitat area and fragmentation [34]. The impact of fragmentation is closely tied to the total habitat area, with a decrease in species diversity observed in smaller total areas [31]. Research indicates that the rapid decline in insect populations is largely driven by factors associated with agricultural simplification [35]. Thus, the results of χ-test analysis could offer insights not only into insect conservation but also into the correlation with ecosystem services. The analysis revealed a very low χ-value, indicating either correlation or disparity among family groups and farms (Table 7). Comparing family levels is crucial for understanding any emerging discrepancies or correlations and for rejecting the null hypothesis, showing that observed differences or correlations are not occurring by chance. Different plant communities may positively impact ecosystem functioning, resilience and the presence of entomofauna [34]. However, when it comes to arthropod biodiversity, a contrasting trend is evident in terms of diversity and species number, which does not reflect the low presence of entomofauna in the vineyards but rather the limited diversity of species detected and observed. This aligns with studies highlighting the negative impact of intensified agricultural practices on insect diversity and abundance [36]. Individual data comparisons via chi-square analysis support previous findings on the sensitivity of certain insect families to agricultural practices and environmental characteristics [34]. Studies also suggest that the presence of green cover within vineyards can provide essential resources for beneficial arthropods [37]. The scarcity of the collected data prevented further analysis to understand the reasons for species distribution within similar families in depth. Habitat area, fragmentation and ground vegetation density are known to have variable and difficult-to-detect effects on insect groups in vineyards. Additionally, the species-specific responses of species richness and abundance pose challenges, which could potentially be addressed by enhancing the combination of stratification design and species distribution models [34].

4.3. Digital Platform and Mobile Application Potential

The on-farm utilization of a digital platform for comprehensive farm assessment has demonstrated significant potential in digitalizing biodiversity, site-specific layers, agro-pedological data, and crop characterization. These data play a crucial role in sensing the status of production units and facilitating changes in management practices towards integrated and sustainable farming [38]. The nature of biodiversity has a profound impact on living organisms, and precise environmental monitoring can greatly enhance crop growth and development cycles, along with associated activities [39]. Studies on digital image analysis have highlighted the immense potential of machine vision technologies in terms of collecting vast amounts of data and recognizing and classifying different plants. In vineyard settings, challenges may arise in image classification due to complex background settings; however, promising results have been achieved through various versions of single-shot detection algorithms like YOLO (You Only Look Once) [40]. The integration of smart applications based on image analysis with digital platforms offers a potential solution to bridge the digital divide with the aim of increasing biodiversity. These tools can serve as strategies to adopt the best agricultural practices necessary for ecosystem preservation and transparency toward consumers’ rights from the initial stages of the wine lifecycle. Factors such as land, landscape, flora and fauna, when thoroughly investigated along with their interactions, can be instrumental in assessing the environmental impact of the wine lifecycle using a Life Cycle Assessment (LCA), thereby paving the way for potential improvements [41].

5. Conclusions

One of the greatest values for farms that want to survive in an increasingly dynamic and competitive market is the ability to innovate and adapt themselves to the environment. Technology is one of the main elements that allows us to face these challenges. The increasing variability of consumer needs as a result of a society that has increasing access to information requires the digitalization of monitoring and control activities. The digitalization of biodiversity tracking could facilitate a greater understanding of specific interactions between plants and arthropod families in the context of vineyard cultivation and grapevine and wine production in the territory of Val d’Orcia. This study has highlighted how the use of digital tools can support the necessary monitoring of biodiversity. Open smart applications, data collection platforms and the analytical quantification of biodiversity are solutions to be implemented and integrated into a self-assessment process of agronomic management performance. In addition, it could provide helpful insights into grapevine productivity.

Author Contributions

Conceptualization, G.B., S.M.L. and S.L.; methodology, G.B., S.L. and D.S.; software, S.M.L.; validation, D.S. and M.V.; formal analysis, S.M.L. and C.F.; investigation, S.M.L., G.B. and R.L.; resources, D.S. and M.V.; data curation, S.M.L., D.S. and G.B.; writing—original draft preparation, S.M.L.; writing—review and editing, D.S. and A.P.; visualization, D.S. and S.M.L.; supervision, M.V.; project administration, M.V.; funding acquisition, M.V. All authors have read and agreed to the published version of the manuscript.

Funding

This research was supported by Tuscany Region PSR 2014–2020—Misura 16.2 PS-GO 2017—Sostegno a progetti pilota e di cooperazione—Iniziale. Reg (UE) 1305/2013—PS-GO2017 PS-GO n. 62/2017 Q.U.I., DUA n. 2016PSRINVD00000012796804800480176327, CUP ARTEA 910722.

Institutional Review Board Statement

Not applicable.

Informed Consent Statement

Not applicable.

Data Availability Statement

Data are contained within the article.

Acknowledgments

The authors would like to thank Copernico srl for their technical support and the development of the digital platform GEAPP and all the farm staff involved in the project for hosting the field experiments and their technical support.

Conflicts of Interest

The authors declare no conflict of interest.

References

  1. Kanianska, R. Agriculture and Its Impact on Land-Use, Environment, and Ecosystem Services. In Landscape Ecology—The Influences of Land Use and Anthropogenic Impacts of Landscape Creation; InTech: London, UK, 2016. [Google Scholar] [CrossRef]
  2. Adamowicz, M. Green Deal, Green Growth and Green Economy as a Means of Support for Attaining the Sustainable Development Goals. Sustainability 2022, 14, 5901. [Google Scholar] [CrossRef]
  3. Bernués, A.; Tenza-Peral, A.; Gómez-Baggethun, E.; Clemetsen, M.; Eik, L.O.; Martín-Collado, D. Targeting best agricultural practices to enhance ecosystem services in European mountains. J. Environ. Manag. 2022, 316, 115255. [Google Scholar] [CrossRef] [PubMed]
  4. Available online: https://www.fao.org/3/I8429EN/i8429en.pdf (accessed on 4 April 2024).
  5. Gargano, G.; Licciardo, F.; Verrascina, M.; Zanetti, B. The agroecological approach as a model for multifunctional agriculture and farming towards the European green deal 2030—Some evidence from the Italian experience. Sustainability 2021, 13, 2215. [Google Scholar] [CrossRef]
  6. Duru, M.; Therond, O.; Martin, G.; Martin-Clouaire, R.; Magne, M.A.; Justes, E.; Journet, E.P.; Aubertot, J.N.; Savary, S.; Bergez, J.E.; et al. How to implement biodiversity-based agriculture to enhance ecosystem services: A review. Agron. Sustain. Dev. 2015, 35, 1259–1281. [Google Scholar] [CrossRef]
  7. Cappelli, S.L.; Domeignoz-Horta, L.A.; Loaiza, V.; Laine, A.L. Plant biodiversity promotes sustainable agriculture directly and via belowground effects. Trends Plant Sci. 2022, 27, 674–687. [Google Scholar] [CrossRef] [PubMed]
  8. Mazzocchi, C.; Ruggeri, G.; Corsi, S. Consumers’ preferences for biodiversity in vineyards: A choice experiment on wine. Wine Econ. Policy 2019, 8, 155–164. [Google Scholar] [CrossRef]
  9. Froidevaux, J.S.P.; Louboutin, B.; Jones, G. Does organic farming enhance biodiversity in Mediterranean vineyards? A case study with bats and arachnids. Agric. Ecosyst. Environ. 2017, 249, 112–122. [Google Scholar] [CrossRef] [PubMed]
  10. Chou, M.Y.; vanden Heuvel, J.; Bell, T.H.; Panke-Buisse, K.; Kao-Kniffin, J. Vineyard under-vine floor management alters soil microbial composition, while the fruit microbiome shows no corresponding shifts. Sci. Rep. 2018, 8, 11039. [Google Scholar] [CrossRef]
  11. Santiago-Freijanes, J.J.; Mosquera-Losada, M.R.; Rois-Díaz, M.; Ferreiro-Domínguez, N.; Pantera, A.; Aldrey, J.A.; Rigueiro-Rodríguez, A. Global and European policies to foster agricultural sustainability: Agroforestry. Agrofor. Syst. 2021, 95, 775–790. [Google Scholar] [CrossRef]
  12. Agnoletti, M. The degradation of traditional landscape in a mountain area of Tuscany during the 19th and 20th centuries: Implications for biodiversity and sustainable management. For. Ecol. Manag. 2007, 249, 5–17. [Google Scholar] [CrossRef]
  13. Assandri, G.; Bogliani, G.; Pedrini, P.; Brambilla, M. Beautiful agricultural landscapes promote cultural ecosystem services and biodiversity conservation. Agric. Ecosyst. Environ. 2018, 256, 200–210. [Google Scholar] [CrossRef]
  14. Steiner, M.; Grace, J.B.; Bacher, S. Biodiversity effects on grape quality depend on variety and management intensity. J. Appl. Ecol. 2021, 58, 1442–1454. [Google Scholar] [CrossRef] [PubMed]
  15. Hedrick, B.P.; Heberling, J.M.; Meineke, E.K.; Turner, K.G.; Grassa, C.J.; Park, D.S.; Kennedy, D.; Clarke, J.D.; Blackburn, J.A.G.; Davis, V.B. Digitization and the future of natural history collections. BioScience 2020, 70, 243–251. [Google Scholar] [CrossRef]
  16. Balogun, A.L.; Marks, D.; Sharma, R.; Shekhar, H.; Balmes, C.; Maheng, D.; Arshad, A.; Salehi, P. Assessing the Potentials of Digitalization as a Tool for Climate Change Adaptation and Sustainable Development in Urban Centres. Sustain. Cities Soc. 2020, 53, 101888. [Google Scholar] [CrossRef]
  17. Ceipek, R.; Hautz, J.; Petruzzelli, A.M.; de Massis, A.; Matzler, K. A motivation and ability perspective on engagement in emerging digital technologies: The case of Internet of Things solutions. Long Range Plan. 2021, 54, 101991. [Google Scholar] [CrossRef]
  18. Vergari, F.; della Seta, M.; del Monte, M.; Barbieri, M. Badlands denudation “hot spots”: The role of parent material properties on geomorphic processes in 20-years monitored sites of Southern Tuscany (Italy). Catena 2013, 106, 31–41. [Google Scholar] [CrossRef]
  19. Giffard, B.; Winter, S.; Guidoni, S.; Nicolai, A.; Castaldini, M.; Cluzeau, D.; Coll, P.; Cortet, J.; le Cadre, E.; d’Errico, G.; et al. Vineyard Management and Its Impacts on Soil Biodiversity, Functions, and Ecosystem Services. Front. Ecol. Evol. 2022, 10, 850272. [Google Scholar] [CrossRef]
  20. Neugirg, F.; Stark, M.; Kaiser, A.; Vlacilova, M.; della Seta, M.; Vergari, F.; Schmidt, J.; Becht, M.; Haas, F. Erosion processes in calanchi in the Upper Orcia Valley, Southern Tuscany, Italy based on multitemporal high-resolution terrestrial LiDAR and UAV surveys. Geomorphology 2016, 269, 8–22. [Google Scholar] [CrossRef]
  21. Available online: https://whc.unesco.org/en/convention/ (accessed on 4 April 2024).
  22. Venturi, M.; Piras, F.; Corrieri, F.; Fiore, B.; Santoro, A.; Agnoletti, M. Assessment of tuscany landscape structure according to the regional landscape plan partition. Sustainability 2021, 13, 5424. [Google Scholar] [CrossRef]
  23. Caporali, F. Indicatori di biodiversità per la sostenibilità in agricoltura: Linee guida, strumenti e metodi per la valutazione della qualità degli agroecosistemi. ISPRA: Rome, Italy, 2009. [Google Scholar]
  24. Kunakh, O.M.; Volkova, A.M.; Tutova, G.F.; Zhukov, O.v. Diversity of diversity indices: Which diversity measure is better? Biosyst. Divers. 2023, 31, 131–146. [Google Scholar] [CrossRef]
  25. Available online: https://www.observatoire-agricole-biodiversite.fr/ (accessed on 4 April 2024).
  26. Available online: https://www.observatoire-agricole-biodiversite.fr/les-protocoles/vers-de-terre (accessed on 4 April 2024).
  27. Available online: https://www.geapp.net (accessed on 4 April 2024).
  28. Rotchés-Ribalta, R.; Marull, J.; Pino, J. Organic farming increases functional diversity and ecosystem service provision of spontaneous vegetation in Mediterranean vineyards. Ecol. Indic. 2023, 147, 110023. [Google Scholar] [CrossRef]
  29. Maclaren, C.; Storkey, J.; Menegat, A.; Metcalfe, H.; Dehnen-Schmutz, K. An ecological future for weed science to sustain crop production and the environment. A review. Agron. Sustain. Dev. 2020, 40, 1–29. [Google Scholar] [CrossRef]
  30. Granata, E.; Pedrini, P.; Marchesi, L.; Fedrigotti, C.; Biella, P.; Ronchi, S.; Brambilla, M. Environmental and management factors drive biological communities and ecosystem services in agroecosystems along an urban-natural gradient. Agric. Ecosyst. Environ. 2023, 357, 108693. [Google Scholar] [CrossRef]
  31. Rybicki, J.; Hanski, I. Species-area relationships and extinctions caused by habitat loss and fragmentation. Ecol. Lett. 2013, 16 (Suppl. S1), 27–38. [Google Scholar] [CrossRef] [PubMed]
  32. Bosco, L.; Moser, V.; Jones, M.M.; Opedal, Ø.; Ovaskainen, O.; Sonja, G.; van Klink, R.; Cushman, S.A.; Arlettaz, R.; Jacot, A. Habitat area and local habitat conditions outweigh fragmentation effects on insect communities in vineyards. Ecol. Solut. Evid. 2023, 4, e12193. [Google Scholar] [CrossRef]
  33. Thompson, C.M.; Mcgarigal, K. The Influence of Research Scale on Bald Eagle Habitat Selection along the Lower Hudson River, New York (USA). Landscape Ecol. 2002, 17, 569–586. [Google Scholar]
  34. Bosco, L.; Siegenthaler, D.; Ruzzante, L.; Jacot, A.; Arlettaz, R. Varying Responses of Invertebrates to Biodynamic, Organic and Conventional Viticulture. Front. Conserv. Sci. 2022, 3, 837551. [Google Scholar] [CrossRef]
  35. Wagner, D.L.; Grames, E.M.; Forister, M.L.; Berenbaum, M.R.; Stopak, D. Insect decline in the Anthropocene: Death by a thousand cuts. Proc. Natl. Acad. Sci. USA 2021, 118, e2023989118. [Google Scholar] [CrossRef]
  36. Haddad, N.M.; Gonzalez, A.; Brudvig, L.A.; Burt, M.A.; Levey, D.J.; Damschen, E.I. Experimental evidence does not support the Habitat Amount Hypothesis. Ecography 2017, 40, 48–55. [Google Scholar] [CrossRef]
  37. Zanettin, G.; Bullo, A.; Pozzebon, A.; Burgio, G.; Duso, C. Influence of vineyard inter-row groundcover vegetation management on arthropod assemblages in the vineyards of north-eastern Italy. Insects 2021, 12, 349. [Google Scholar] [CrossRef]
  38. Dhanaraju, M.; Chenniappan, P.; Ramalingam, K.; Pazhanivelan, S.; Kaliaperumal, R. Smart Farming: Internet of Things (IoT)-Based Sustainable Agriculture. Agriculture 2022, 12, 1745. [Google Scholar] [CrossRef]
  39. Latake, P.T.; Pawar, P.; Ranveer, A.C. The Greenhouse Effect and Its Impacts on Environment. Int. J. Innov. Res. Creat. Technol. 2015, 1, 333–337. [Google Scholar]
  40. Sportelli, M.; Apolo-Apolo, O.E.; Fontanelli, M.; Frasconi, C.; Raffaelli, M.; Peruzzi, A.; Perez-Ruiz, M. Evaluation of YOLO Object Detectors for Weed Detection in Different Turfgrass Scenarios. Appl. Sci. 2023, 13, 8502. [Google Scholar] [CrossRef]
  41. Mancuso, T.; Arfo, S.; di Mauro, M.; Matarazzo, A.; Froio, A.P.; Scuderi, A. Application of SOSTAIN to Wine Sector in Sicily as Sustainability Management Tool. J. Biomed. Res. Environ. Sci. 2022, 3, 302–306. [Google Scholar] [CrossRef]
Figure 1. The figure shows the localization of Farm A and Farm B.
Sustainability 16 03469 g001
Figure 2. The figure shows the iron frame used for the plant species monitoring survey.
Sustainability 16 03469 g002
Figure 3. The figure shows an example of the interface for the manual insertion of new species for creating and updating the dataset. The accounting function for the herbaceous species, annelids, arthropods, Lepidoptera and pollinating insects observed during survey operations in the vineyard is shown.
Sustainability 16 03469 g003
Figure 4. The figure shows the layers available on the GEAPP platform: on the left, the activated layers are shown in dark green, i.e., “Campi” parcel, “Essenze erbacee” herbaceous species, “Artropodi” arthropods, “Lepidotteri” Lepidopter). The lower part shows the “biodiversity sustainability parameters” layers. The view highlights the chemical fertility of the surface horizon (the scale ranges from 1 “buona” good to 4 “bassa” poor). On the right, the descriptive synthesis of the relative and total frequencies of each species recorded and the counting of the relative and total for the measurement of the Shannon index H′ and a range scale viewer.
Sustainability 16 03469 g004
Table 1. The table shows the main characteristics of the farms.
CharacteristicsFarm AFarm B
Total area (ha)33670
Cultivated area (ha)2361
Crop rotationNoNo
FertilizationOrganicOrganic
ManagementOrganicOrganic
Table 2. The table shows selected layers and sources according to the macro-area indagated.
Macro-AreaLayersSource
Protected areasRegional nature reserves
Protected natural areas of local interest
Habitat—HaSCITu
https://www.regione.toscana.it/-/geoscopio (accessed on 1 April 2024)
Cultural heritage and landscapeArchitectural property protected under part II of Legislative Decree no. 42/2004
Pedology and soil use capacityAvailable soil water capacity Landscaper Unity
Potential erosion (t/ha)
Superficial horizon salinity
Surface horizon chemical fertility
Roots useful depth (cm) Surface stoniness (%)
Rocks percentage (%)
Internal drainage
Capacity of use and fertility of soils
Soil use and coveragewoodlands/woody areas/wood lands 2019–1954
DOP/IGP and wine production areasWine production areas—Orcia
Table 3. The table shows the detection mode, frequency and period of data collection according to the type of detection.
Type of Detection Detection ModeFrequencyPeriod
Farmland structure: plots, hydraulic–agricultural structures, and infrastructureDirect data collection at the beginning of the crop year—Interview with the ownerUna tantum-Annual check January
Crop sorting: business production processesDirect data collection at the beginning of the crop year—Interview with the ownerUna tantum-Annual check January
Components of biodiversity: flora and fauna (entomofauna)On-field monitoring of vegetation
On-field monitoring of entomofauna
Annual check
Once every 15 days
April–June
March–July
Table 4. The table shows the indicators used to evaluate structural biodiversity.
Agri-Environmental IndicatorsUnit of MeasureEI *
Density of herbaceous cropIndividuals × ha−1X
Density of arboreal cropsIndividuals × ha−1X
Density of leguminous crops;Individuals × ha−1X
Density of poly-annual leguminous crops;Individuals × ha−1X
Number of farm animal speciesIndividuals × ha−1X
Plot areahaX
* Essential indicator.
Table 5. The table shows the mean square, F value and p value of the MANOVA conducted on the number of plants (NP)and SH according to the family.
SourceNP Mean SquareFSign.SH Mean SquareFSign.
FarmAsteraceae9.3891.6290.2380.0246.6350.033
Apiaceae2.0004.0000.0810.0011.3210.284
Euphorbiaceae4.50012.0000.0090.00513.2290.007
Lamiaceae2.0008.0000.0220.0026.9050.030
Plantaginaceae14.22219.6920.0020.01222.1120.002
Poaceae2.0000.8890.3733.799 × 10−50.0240.882
Leguminosae0.0560.0530.8240.0021.3040.287
Caryophyllaceae2.0004.0000.0810.0012.0940.186
Brassicaceae3.5568.2580.0210.0048.8020.018
Rosaceae2.0005.3330.0500.0025.6860.044
Geraniaceae2.0002.6670.1410.0054.8420.059
Asparagaceae2.0005.3330.0500.0024.2430.073
SampleAsteraceae5.8471.0140.4920.0030.9580.523
Apiaceae0.7221.4440.3080.0011.5700.269
Euphorbiaceae0.3751.0000.5000.0001.0000.500
Lamiaceae0.5562.2220.1400.0012.7530.087
Plantaginaceae0.7221.0000.5000.0011.0000.500
Poaceae3.2501.4440.3080.0031.9410.184
Leguminosae2.4722.3420.1250.0032.3100.129
Caryophyllaceae0.5561.1110.4430.0011.0920.452
Brassicaceae0.4311.0000.5000.0001.0000.500
Rosaceae0.3751.0000.5000.0001.0000.500
Geraniaceae0.5000.6670.7100.0010.6960.690
Asparagaceae0.4311.1480.4250.0011.3060.357
Table 6. The table shows a comparison between the average value of the number of plants (NP) in the two different farms and a comparison between the average SH the two different farms.
Mean NPStandard ErrorConfidence Interval 95%Mean SHStd ErrorConfidence Interval 95%Evenness Value
Lower LimitUpper LimitLower LimitUpper Limit
Asteraceaea13.8890.8002.0435.7340.0980.0200.0530.1440.573
a25.3330.8003.4887.1790.1720.0200.1250.2180.
Apiaceaea11.2220.2360.6791.7660.0400.0080.0210.0590.042
a20.5560.2360.0121.0990.0270.0080.0070.0460.032
Euphorbiaceaea11.0000.2040.5291.4710.0330.0060.0180.0470.068
a23.469 × 10−170.204−0.4710.4718.674 × 10−180.006−0.0150.0150
Lamiaceaea10.7780.1670.3931.1620.0260.0050.0130.0380.045
a20.1110.167−0.2730.4950.0060.005−0.0070.0180
Plantaginaceaea11.7780.2831.1252.4310.0520.0080.0340.0710.127
a2−4.163 × 10−170.283−0.6530.6530.0000.008−0.0180.0180
Poaceaea11.6670.5000.5142.8200.0450.0130.0140.0760.080
a21.0000.500−0.1532.1530.0420.0130.0110.0730.058
Leguminosaea11.3330.3420.5442.1230.0400.0110.0140.0670.084
a21.4440.3420.6552.2340.0590.0110.0320.0850.116
Caryophyllaceaea10.8890.2360.3451.4320.0290.0080.0090.0480.068
a20.2220.236−0.3210.7660.0110.008−0.0080.0310
Brassicaceaea10.8890.2190.3851.3930.0290.0070.0130.0440.068
a2−6.939 × 10−180.219−0.5040.504−4.337 × 10−190.007−0.0160.0160
Rosaceaea10.6670.2040.1961.1370.0220.0060.0070.0370.045
a25.551 × 10−170.204−0.4710.4711.735 × 10−180.006−0.0150.0150
Geraniaceaea10.3330.289−0.3320.9990.0110.011−0.0150.0370.023
a21.0000.2890.3341.6660.0460.0110.0200.0710.095
Asparagaceaea10.7780.2040.3071.2480.0260.0070.0100.0420.045
a20.1110.204−0.3600.5820.0060.007−0.0100.0220
Table 7. The table shows a test according to family, class or order.
Family/Class/Orderχ²
Pieridae9.6173 × 10−9
Lycaenidae0.124927123
Nymphalidae1.94079 × 10−6
Formicidae1.21185 × 10−8
Coleoptera1.18989 × 10−11
Gryllidae0.54874631
Cercopidae0.786834047
Arachnida5.77336 × 10−8
Pentatomidae0.018352005
Armadillidiidae2.13518 × 10−14
χ2 tot1.4814 × 10−44
Disclaimer/Publisher’s Note: The statements, opinions and data contained in all publications are solely those of the individual author(s) and contributor(s) and not of MDPI and/or the editor(s). MDPI and/or the editor(s) disclaim responsibility for any injury to people or property resulting from any ideas, methods, instructions or products referred to in the content.

