Article

Condition Information Entropy and Rough Set Method Based on Particle Swarm Optimization Applied in the Natural Quality Evaluation of Cultivated Land

1
Science and Technology on Complex Land System Simulation Laboratory, Beijing 100012, China
2
School of Geography and Information Engineering, China University of Geosciences, Wuhan 430074, China
*
Author to whom correspondence should be addressed.
Sustainability 2024, 16(8), 3484; https://doi.org/10.3390/su16083484
Submission received: 16 January 2024 / Revised: 16 April 2024 / Accepted: 17 April 2024 / Published: 22 April 2024

Abstract

:
The evaluation of the natural quality of cultivated land is crucial for preserving arable land and achieving a balance between the quantity and quality of arable land. Therefore, a timely assessment of the natural quality of cultivated land is needed to monitor its changes. However, current methods often focus on a single specified crop, neglecting the variations that occur across different specified crops. Since the indicator weight recognition method is only suitable for a single crop, this paper proposes a novel model evaluating the natural quality of cultivated land based on the method of “hidden light–temperature index and yield ratio coefficient”. In addition, the condition information entropy and rough set method based on particle swarm optimization (CIERS-PSO) were proposed to evaluate the natural quality of cultivated land in Enshi. Firstly, condition information entropy and rough set are adopted to determine the importance of the indicator automatically. Then, particle swarm optimization (PSO) is utilized to obtain the optimal weights of the first-level and second-level indicators. Finally, the proposed model and evaluation method were adopted to evaluate the natural qualities of the cultivated land. The experimental results demonstrated that the combination of the “hidden light–temperature index and yield ratio coefficient” model and the CIERS-PSO method can automatically identify the indicator weights for the evaluation of natural quality in multi-crop cultivated land. It could obtain better evaluation accuracy even if the sample size is small.

1. Introduction

At present, China’s cultivated land is experiencing a maldistribution and a decline in both quantity and quality. Moreover, some cultivated lands are polluted to varying degrees and suffer from soil damage, ground subsidence, and other adverse effects [1,2]. The evaluation of natural quality is significant for protection and promotion, as well as achieving a balance between the quantity and quality of cultivated land [3,4].
Based on the differences in hydrothermal conditions in various regions, China’s natural resource departments have formulated a standard tillage system. This system is designed for designated crops and multiple-cropping types in various counties [5].
Most counties have designated more than one crop [6,7,8]. If only one designated crop is used to determine the natural quality of cultivated land, there would be a certain deviation in characterizing the production capacity of the cultivated land. The type of multiple-cropping is mainly determined by local light and temperature conditions. These conditions have a significant influence on the local natural production potential and are important factors in the grading of cultivated land [9,10,11,12]. Therefore, it is necessary to evaluate the natural quality of cultivated land based on the local tillage system and multiple designated crops. This could represent the production level of cultivated land in one region more accurately.
The evaluation of cultivated land quality is a comprehensive embodiment of maintaining crop productivity and improving the environmental quality of cultivated land. The quality of cultivated land cannot be directly quantified, and the physical, chemical, and biological properties of cultivated land need to be comprehensively evaluated [13]. At present, in addition to the usually used methods such as the Delphi method, analytic hierarchy process (AHP) method, etc., intelligent methods are also gradually being applied to research on cultivated land quality evaluation, both at home and abroad. These methods include principal component analysis (PCA), fuzzy comprehensive evaluation, the entropy method, support vector machine (SVM), BP neural network, and technique for order preference by similarity to an ideal solution (TOPSIS) [14,15,16,17,18,19]. However, current methods typically ignore the fact that the score of each indicator varies with different designated crops. They often concentrate on single designated crop areas. In addition, they usually require a large sample size, and the evaluation accuracies rely on sample qualities as well.
In an area of multiple designated crops, differences in the indicator scores between different crops would directly affect the natural quality evaluation scores of the cultivated land. Additionally, the light–temperature index and yield ratio coefficients of different crops could influence their natural quality indexes [20]. All of these factors ultimately contribute to the results of the natural quality evaluation of cultivated land. However, indicator scores, light–temperature indexes, and yield ratio coefficients have different effects on the natural quality of cultivated land [20,21]. Therefore, existing methods cannot directly take the indicator scores, light–temperature indexes, yield ratio coefficients, and national natural classes under different specified crops as the input layer, and identify the indicator weights.
The “hidden light–temperature index and yield ratio coefficient” method employs mathematical transformations to hide the light–temperature index and yield ratio coefficients of multiple designated crops into the indicator weights. This method doubles the number of evaluation indicators for the natural quality of cultivated land, and the hierarchical processing of the indicator model is considered here.
The rough set (RS) theory was proposed by the Polish mathematician Z. Pawlak in 1982 for superior knowledge simplification in the field of uncertainty and ambiguity [22]. Combining the RS algorithm with the conditional information entropy could overcome the sensitivity of RS to noise [23,24]. Considering that the conditional information entropy and rough set (CIERS) method is not sensitive to the information of the first-level indicator when the indicators are stratified, this paper proposes to optimize the CIERS method based on the PSO algorithm [25].
In this paper, the “hidden light–temperature index and yield ratio coefficient” method is proposed to construct a novel evaluation mode. Then, the indicator weights are calculated based on the proposed condition information entropy and rough set method based on the PSO (CIERS-PSO) method for the natural quality evaluation of cultivated land.

2. Study Area and Data Sources

2.1. Overview of the Study Area

Enshi is situated in the southwestern of Hubei Province, which is an east extension of the Yunnan–Guizhou Plateau and is adjacent to the edge of the Sichuan Basin. The total land area of the city is 39.673 ten thousand hectares, accounting for 16.6% of the total area of Enshi Prefecture.
The terrain of Enshi city varies greatly, exhibiting complex and diverse landforms, and an uneven distribution of light, rain, and heat. These factors are reflected in land use, resulting in the land use mode of low hills, medium-high mountains, and high mountains, and demonstrating the unique “three-dimensional” characteristics of land use in mountainous areas. The location and terrain of the study area are shown in Figure 1.
According to the land use change survey data of Enshi city in recent years, the total area of the cultivated land in Enshi is 8.146 ten thousand hectares, accounting for 20.53% of the total area [26]. However, the reserve resources of cultivated land are few, and the area of suitable agricultural wasteland that could be developed into cultivated land is extremely limited.
Therefore, the evaluation method for the natural quality of cultivated land in Enshi city is being studied to achieve an intensive utilization of land resources by equally managing both the quantity and quality. This research will provide technical support for land resource management decision making in Enshi, and have important theoretical and practical value in promoting its economic development.

2.2. Data Preparation and Pre-Processing

According to the policy documents from the Enshi Land and Resources Bureau, the designated crops in Enshi are determined to be midseason rice and wheat, with a biannual replanting cycle. The light–temperature production potential and yield ratio coefficients of midseason rice are 1161 and 1, and those of wheat are 648 and 3.08, respectively. The indicators for evaluating the natural quality of cultivated land in the Enshi area include effective soil thickness, topsoil texture, soil organic matter content, soil acidity and alkalinity, topographic slope, irrigation guarantee rate, surface rock outcrop, and soil erosion. The weights of these indicators are as follows: effective soil thickness (0.23), topsoil texture (0.09), soil organic matter content (0.07), soil acidity and alkalinity (0.07), topographic slope (0.2), irrigation guarantee rate (0.14), surface rock outcrop (0.11), and soil erosion (0.09) [27].
The land use status map of Enshi was overlaid with the topographic map and soil map of the same scale (1:2000). It was then adjusted according to the grading criteria, and the study area was divided into 73,909 units. The natural grade index of each evaluation unit is calculated based on the regional distribution of the actual state values of the graded factors. Finally, 1% of the data in each grade were randomly selected as the training samples, and the remaining data were used as the test samples to verify accuracy.

3. Research Methodology

The process of evaluating the natural quality of cultivated land in Enshi using CIERS-PSO is shown in Figure 2 which consists of the following: (1) constructing a novel model for evaluating the natural quality of cultivated land using the “hidden light–temperature index and yield ratio coefficient” method; (2) preliminary determination of attribute importance and attribute weights at each level using the rough set conditional information entropy theory; (3) establishing an objective function that meets the optimization requirements, optimizes the primary indicator weights with the PSO algorithms, and hierarchically refines the secondary indicator weights; (4) natural quality grading of the test sample cultivated land using indicator weights determined by the CIERS-PSO method; and (5) result verification and accuracy analysis of the natural quality grade evaluation of cultivated land.

3.1. The ”Hidden Light–Temperature Index and Yield Ratio Coefficient” Method

Usually, for the natural quality evaluation of cultivated land, the model for calculating the natural grade index for each unit is shown in Equation (1):
w 1 F 11 + + w n F 1 n x 1 + + w 1 F m 1 + + w n F m n x m / k = R
where xm is the product of the light–temperature index of the m-th designated crop and the yield ratio coefficient (for simplicity, which is hereinafter referred to as the light–temperature index and yield ratio coefficient), and there are a total of M designated crops, m= (1,2,3….M). wn is the weight of the n-th indicator, and there are a total of N evaluation indicators, n= (1,2,3….N). Fmn is the score of the evaluation unit when the base crop is m and the indicator is n. k is a constant influenced by the type of replanting. If the cropping system of the area is three crops in two years, k takes 2; for others, such as one-year one-cropping, one-year two-cropping, and other cropping systems, the k value is 1. R is the natural quality grade index of the evaluation unit. As seen in Equation (1), the evaluation results of the natural quality grade index of each evaluation unit are determined by the score of each indicator, the light–temperature index and yield ratio coefficient, and the indicator weights of the base crop in the evaluation unit.
If the model as Equation (1) is utilized to evaluate the natural quality of the cultivated land, the scores of the indicators, the light–temperature index and yield ratio coefficient, and the indicator weights are inputted as the parameters. However, because those parameters have different degrees on the natural quality grade index of the evaluation unit, it results in the complexity of the indicator weight solving model. As a consequence, the weights of the indicators determined in this way lack practical significance.
Considering the above issues, this paper proposes a cultivated land quality evaluation model based on the method of “hidden light–temperature index and yield ratio coefficient”. Based on Equation (1), according to different designated crop types, each indicator weight of natural quality evaluation is multiplied by the proportion factor of the light temperature index and yield ratio coefficient of different designated crops. This proportion factor is referred to as the “designated crop indicator weight” in this paper, as shown in Equation (2):
w m n = w n x m / x 1 + + x m , ( m = 1 , 2 , 3 M ; n = 1 , 2 , 3 N )
where x m / ( x 1 + + x m ) represents the proportion factor of the light–temperature index and the yield ratio coefficient of the m-th designated crop to the sum of the light temperature index and the yield ratio coefficient of all the designated crops. w m n represents the n-th indicator weight of the m-th designated crop, and the sum of the indicator weights of all the designated crops’ is 1, as shown in Equation (3):
w 11 + + w 1 n + + w m 1 + + w m n = 1
Accordingly, the light temperature index and yield ratio coefficient of each designated crop are hidden in the “designated crop indicator weight”. This allows for their influence on the cultivated quality evaluation of different crops to be indirectly reflected by the designated crop indicator weight. This method is referred to as the “hidden light–temperature index and yield ratio coefficient” approach.
According to Equation (1) and the “hidden light–temperature index and yield ratio coefficient” method, the natural quality evaluation model of cultivated land is established. This model is represented by Equation (4):
w 11 F 11 + + w 1 n F 1 n + + w m 1 F m 1 + + w m n F m n = R / g , ( m = 1 , 2 , 3 M ; n = 1 , 2 , 3 N )
where g is a constant and satisfies g = x 1 + + x m / k ; xm, Fmn, and R have the same practical significance as Equation (1).
From Equation (4), it can be seen that the value of R/g depends on the score of each factor and the indicator weights. Because the national natural quality grade is derived from the natural quality grade index of the evaluation unit, the indicator weights could be considered the hidden factors. The indicator scores, along with the national natural quality grade, could be used as inputs to identify the indicator weights using intelligent methods.
As shown in Equations (3) and (4), each designated crop has a set of evaluation indicators in the “hidden light–temperature index and yield ratio coefficient”. Then, the total number of indicators in the proposed evaluation model is M times of the original evaluation model, where M is the number of designated crops. Therefore, in the proposed evaluation model, the evaluation indicators can be treated according to different designated crops. This treatment takes into account that the same evaluation factor affects the natural quality of arable land to a similar extent under different designated crops. As a result, the indicator set will be divided into blocks.
According to the actual situation of Enshi city, two first-level indicator sets, C1 and C2, were established. These indicator factors, respectively, represent the degree of influence on the cultivated land natural quality of cultivated land under wheat and rice cultivation. Each first-level indicator set was subdivided into eight second-level indicators, such as “effective soil layer thickness” and “surface soil texture”, determined in Section 2.2. [28].

3.2. Rough Set Conditional Information Entropy Methods

According to the RS theory, knowledge is defined as the ability to classify things [29]. Some researchers have applied the RS theory to the identification study of land evaluation indicator weights [30,31,32]. However, due to the sensitivity of the RS theory to noise, this paper proposes a combination of conditional information entropy with the RS theory to overcome this limitation. From the information theory perspective, if information is expressed with information entropy and conditional entropy, the knowledge comprehensibility could be enhanced. Therefore, this paper chooses the RS and conditional information entropy theories to study the classification of the natural quality of cultivated land.

3.2.1. Constructing a Decision Table

According to the evaluation model of the RS conditional information entropy theory, a decision table composed of conditional attributes and decision attributes has to be established. The decision table requires the decision attributes to entirely depend on the conditional attributes. Otherwise, the decision table is an incomplete information system, and an evaluation model established on such a system lacks reliability.
In this paper, the set of indicator scores under different designated crops are considered the conditional attributes, and the natural quality grades are taken as the decision attribute. This is the way in which the decision table is constructed.

3.2.2. Determination of Indicator Weights

According to the RS conditional information entropy theory, this paper defines the decision table S = U , C , D , where C = C 1 , C 2 , C k is the conditional attribute set, and Ck is the set of indicator scores of different designated crops in the k-th evaluation unit. D = D 1 , D 2 , D m is the decision attribute set, where D m represents the m-th national natural quality grade. U is a set of objects composed of conditional attribute set C and decision attribute set D. I D | C is the conditional information entropy of the decision attribute set relative to the conditional attribute set, which is defined as shown in Equation (5) [16]:
I D | C = i = 1 m | C i | 2 | U | 2 j = 1 k | D j C i | | C i | 1 | D j C i | | C i |
where P ( C i ) = | C i | | U | denotes the distribution of Ci over U, referring to the probability of the evaluation unit of which the indicator score set is Ci. P D j | C i = | D j C i | | C i | indicates the probability of Dj occurring under the condition of occurrence of Ci. This refers to the probability of the national natural quality grade being Dj when the indicator score set of the evaluation unit is Ci.
Additionally, for c C , the importance of attribute c is defined as Equation (6) [16]:
N e w S i g c = I D | C c I D | C + I D | c
Then, the importance of the attribute C i of the first-level indicator sets is as follows:
N e w S i g C i = I D | C C i I D | C + I D | C i
The definition of the importance of attribute c considers not only c’s importance in the conditional attribute set C, but also the importance of c itself. This makes the weight of each attribute non-zero and the weight calculation more reasonable.
However, the rough set conditional information entropy method could not accurately identify the weights of the first-level indicator. To address this issue, this paper proposes the CIERS-PSO method.

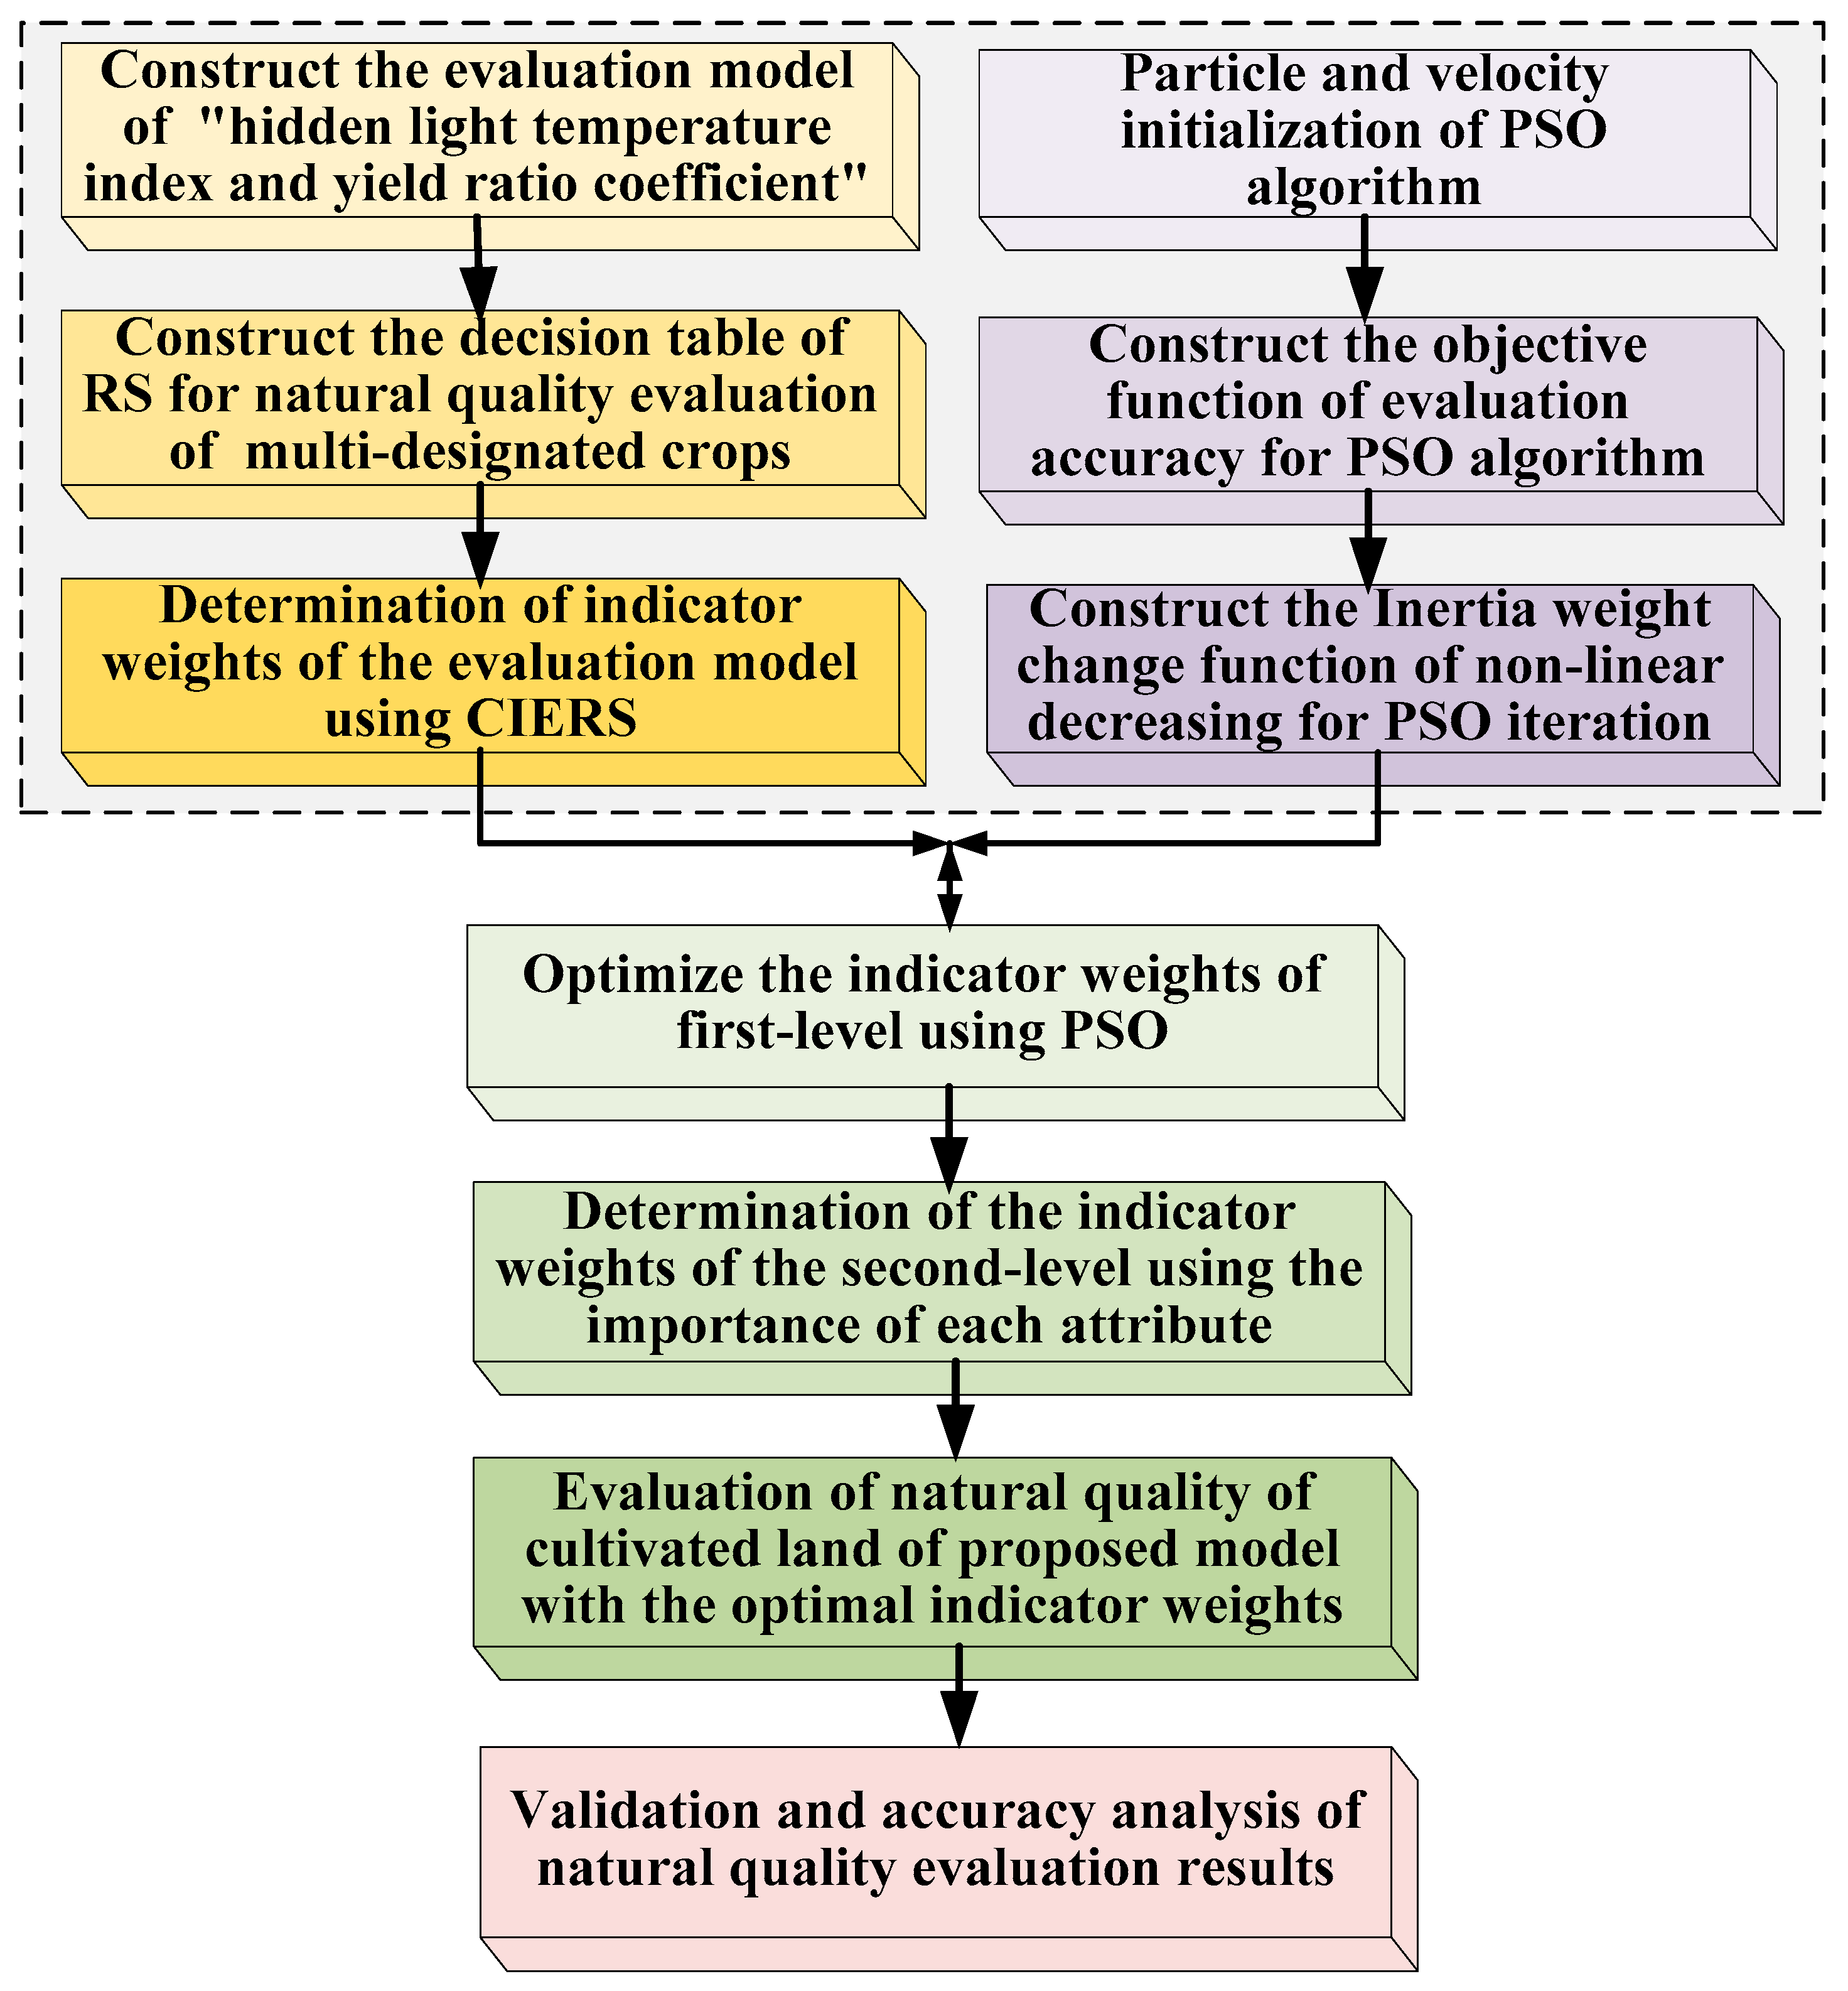
3.3. The Rough Set Conditional Information Entropy Evaluation Method Based on Particle Swarm Optimization

The PSO algorithm has a strong global stochastic search capability. It can efficiently and rapidly find the global optimal solution in a large, non-differential, and multiple-peak vector space. In the PSO algorithm, the system first initializes a set of random solutions called particles. During each iteration, the particles update their position and velocity by tracking individual optima and global optima. The velocity and position update Equations are as follows [25]:
V i d k + 1 = P w V i d k + c 1 r 1 P i d k X i d k + c 2 r 2 P g d k X g d k
X i d k + 1 = X i d k + V i d k + 1
where Pw is the inertia weight, reflecting the ability of the particle to inherit previous velocities. k is the number of current iterations. Vid is the velocity of the particle. c1 and c2 are non-negative constants called acceleration factors, generally taking the value 1.494. r1 and r2 are random values distributed in the interval [0, 1].

3.3.1. Constructing the Objective Function

In this research, the PSO algorithm was adopted to find the optimal first-level indicator weights. This approach addresses the issue of the rough set conditional information entropy method’s inaccuracy in characterizing the importance of first-level indicator attributes. In this paper, the proposed objective function of the PSO algorithm is defined as Equation (10):
A c c u r a c y = Verify C l a s s i f y x 1 w 1 f 1 + + w 8 f 8 + + x n w 9 f 9 + + w 16 f 16
where xn is the weight value of the n-th first-level indicator and which satisfies x 1 + + x n = 1 . “Classify” represents the classification function. This function determines the natural grade index based on the indicator weights and the score of each factor. It then classifies the natural quality of the cultivated land of the evaluation unit. Verify() is the validation function. This function calculates the evaluation accuracy of the proposed evaluation method. It compares the national natural grade evaluated according to the proposed method with the actual grade of the evaluation unit. Accuracy() is the function calculating the evaluation accuracy of the proposed method.

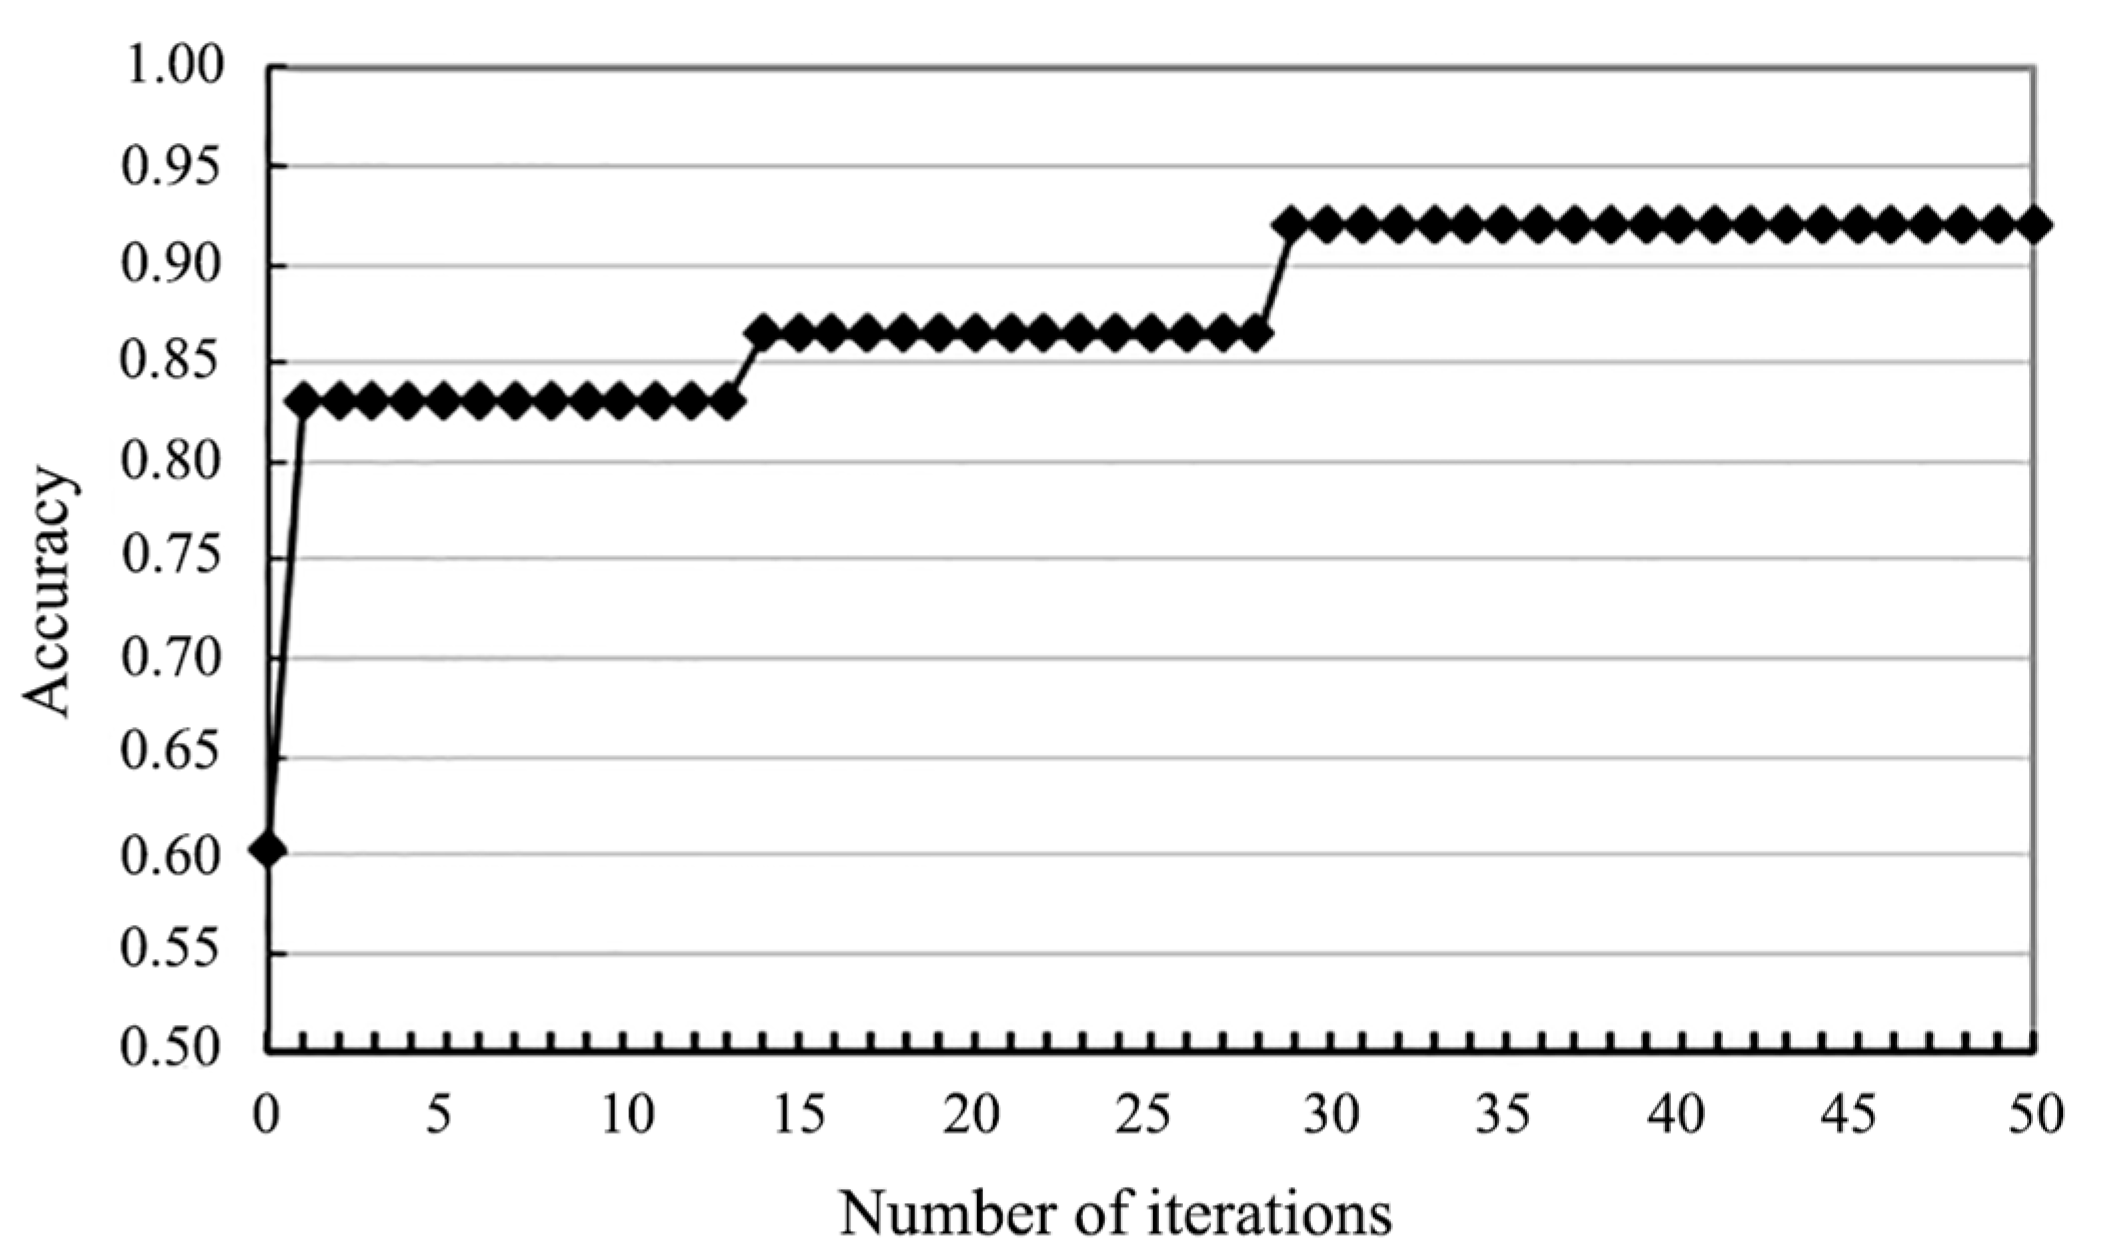
3.3.2. Optimizing First-Level Indicator Weights by PSO

In this study, twenty particles were randomly initialized in the PSO algorithm. The positions of the particles were set to be within [0, 1], which represents the values of the first-level indicator weights. In addition, the particles’ velocities were set to be within [0.2, −0.2]. Furthermore, the iteration number of the PSO algorithm was set to 50.
To better balance the PSO’s global search and local search ability and avoid falling into local optimal solutions, a non-linear decreasing approach was adopted here to change the inertia weight Pw, as shown in Equation (11):
P w k = P w s t a r t P w s t a r t P w e n d k T max 2
where Pwstart is the initial inertia weight and Pwend is the inertia weight at the maximum number of PSO iterations. k is the current number of PSO iterations and Tmax is the maximum number of PSO iterations. In general, the algorithm performs the best with inertia weights Pwstart = 0.9 and Pwend = 0.4.
The PSO algorithm conducts 50 iterations to optimize first-level indicator weights. We recorded the changes in the fitness value of the objective function at each iteration. The changes in the accuracy of the natural quality evaluation of the cultivated land are shown in Figure 3.
As shown in Figure 3, initially, before the optimization iteration of first-level indicator weights by the PSO algorithm, the natural quality evaluation accuracy only achieves 60.2% by the RS conditional information entropy method. Fortunately, the optimal value of the natural quality evaluation accuracy achieves 91.98% after the 29th optimization iteration of first-level indicator weights by the PSO algorithm. Obviously, the RS conditional information entropy method based on PSO has a significant improvement in evaluation accuracy compared to the RS conditional information entropy method. The weights of the indicators calculated by the method of RS conditional information entropy based on PSO are shown in Table 1.
From Table 1, it can be observed that, for the same evaluation factor indicators of different crops, their weight values calculated by the RS conditional information entropy method based on PSO differ significantly.
This phenomenon is due to the effect of the differences in the light–temperature index and yield ratio coefficients of different designated crops. The “hidden light–temperature index and yield ratio coefficient” method proposed in this paper ensures that the differences in the light–temperature and yield ratio coefficients of different crops are reflected in the differences in the final indicator weights.

4. Results

The indicator weights obtained from the RS conditional information entropy method based on the PSO were applied to evaluate the natural quality of cultivated land in Enshi. The evaluation results are shown in Table 2.
As seen in Table 2, the method proposed in this paper achieves an overall accuracy of 91.98% in the natural quality evaluation of cultivated land in Enshi. The evaluation accuracies are higher than 80% for all national nature grade categories, except for the 13th national nature grade. This is because there are fewer evaluation units of the 13th national nature grade in the study area, and only two samples of the 13th national nature grade were selected for training in this experiment. This led to poor test results for this category.
A comparison of the evaluation results of the RS conditional information entropy method and the RS conditional information entropy method based on PSO is shown in Figure 4.
According to Figure 4, the evaluation accuracy of the RS conditional information entropy method based on PSO has been significantly improved compared to that of the RS conditional information entropy method. The RS conditional information entropy method based on PSO can achieve better overall results in a short time, even when sampling 1% of all the samples.
Figure 5 shows a symbolic representation of the evaluation results of the RS conditional information entropy model based on PSO for the city of Enshi.
The statistical results of the natural quality evaluation of cultivated land by the RS conditional information entropy method based on PSO are as follows: the total area of cultivated land in Enshi is 8.146 ten thousand hectares, and the national natural grades of the cultivated land are concentrated within the 10th–13th grade. Among them, the cultivated land area of the 10th national natural grade is 1.228 ten thousand hectares, accounting for 15.07% of the total cultivated land in Enshi. The cultivated land area of the 11th national natural grade is 5.218 ten thousand hectares, accounting for 64.05% of the total cultivated land. The cultivated land area of the 12th national natural grade is 1.676 ten thousand hectares, accounting for 20.58% of the total cultivated land. The cultivated land area of the 13th national natural grade is 0.024 ten thousand hectares, accounting for 0.30% of the total cultivated land. In summary, there are a total of 8.122 ten thousand hectares of medium-quality cultivated land, accounting for 99.70% of the total cultivated land. Additionally, there are approximately 0.024 ten thousand hectares of low-quality cultivated land, accounting for 0.30% of the total cultivated land in Enshi.

5. Discussion

This paper considers stratifying evaluation indicators. Then, it uses the CIERS-PSO method to calculate the weights of the indicators which are used for assessing the natural quality of cultivated land. From Table 2, it is seen that the CIERS-PSO proposed in this paper performs well in the evaluation of the natural quality of cultivated land in Enshi city, with an overall accuracy of 91.98%. This indicates that the proposed method has high reliability and effectiveness in evaluating the natural quality of cultivated land. It is particularly noteworthy that the method achieves a classification accuracy of over 80% when classifying cultivated land with grades 10 to 12. This further validates its feasibility and accuracy within the common grade range.
The comparison results show that the CIERS-PSO method has significantly improved classification accuracy compared to the RS conditional information entropy method. This indicates that the PSO technique holds certain advantages. It is used to optimize model parameters, achieve better data fitting, enhance the model’s generalization ability, and improve the efficiency of problem solving.
To verify the efficiency of the PSO algorithm, the number of training and testing samples were set according to Table 2, and two methods were used to evaluate the national nature grade categories in Enshi separately. The CIERS-PSO method took 20 seconds to run. The RS conditional information entropy method took 37 seconds to run. Therefore, the CIERS-PSO method was faster than the RS conditional information entropy method. When the number of training samples increases to 3000, the CIERS-PSO method takes 28 seconds to run, and the RS conditional information entropy method takes 178 seconds. This indicates that the CIERS-PSO method achieves good evaluation accuracy in a relatively short time. This is significant for handling large-scale data.
We combined the topography of Enshi city to analyze the results of the national natural grade evaluation of cultivated land in Enshi city. The results show a close relationship between topography and the quality of arable land. The cultivated land with the national natural grade of 10 is primarily distributed in the central and eastern regions of Enshi. The cultivated land of grade 13 is mainly located in the higher altitude areas of Banqiao township in the west of Enshi, and Baiguo township in the south of Enshi. The cultivated land with the national natural grades of 11 and 12 is scattered throughout Enshi city, while the area proportion in the east is significantly larger than that in the west. The main reason may be related to the topography of Enshi. The northwestern and southern flanks of Enshi are high, similar to mountainous plain landforms, while the central area is a collapsed basin. Thus, the high altitude in the northwestern and southern Enshi results in the decreasing agricultural productivity of those regions.
The CIERS-PSO method proposed in this paper is designed for regions with multi-crop cultivation. It addresses the issue of indicator weight identification methods being applicable only to a single crop. If the region only has one designated national crop, the indicator weight identification method can be directly applied for evaluation.
In summary, the CIERS-PSO method demonstrates high accuracy and efficiency in evaluating the natural quality of cultivated land in Enshi city. It provides a reliable new approach for cultivated land quality assessment.

6. Conclusions

Aiming to address the problems that current intelligent methods usually do not consider relating to the influence of the different light–temperature indexes and yield ratio coefficients of different crops, a novel method, “hidden light–temperature index and yield ratio coefficient”, was developed. This method was developed for establishing the evaluation model of the natural quality of cultivated land in multi-designated crop areas. Then, the RS conditional information entropy method based on PSO was adopted to evaluate the natural quality of cultivated land in Enshi city. The experimental results proved that the proposed “hidden light–temperature index and yield ratio coefficient” model and the RS conditional information entropy method based on PSO are valid. It achieved an overall accuracy of 91.98% in the natural quality evaluation of cultivated land in Enshi city. The following conclusions were drawn from the above study:
(1)
The “hidden light–temperature index and yield ratio coefficient” method was used to transform the original cultivated land natural quality evaluation model mathematically. It is conducive to adopting the RS conditional information entropy method in the evaluation of the natural quality of cultivated land.
(2)
The RS conditional information entropy method based on PSO can achieve a high evaluation accuracy even with a small sample. It overcomes the limitation of the RS conditional information entropy method being insensitive to the first-level indicator, and makes the evaluation results of the natural quality of cultivated land more accurate and reliable.
(3)
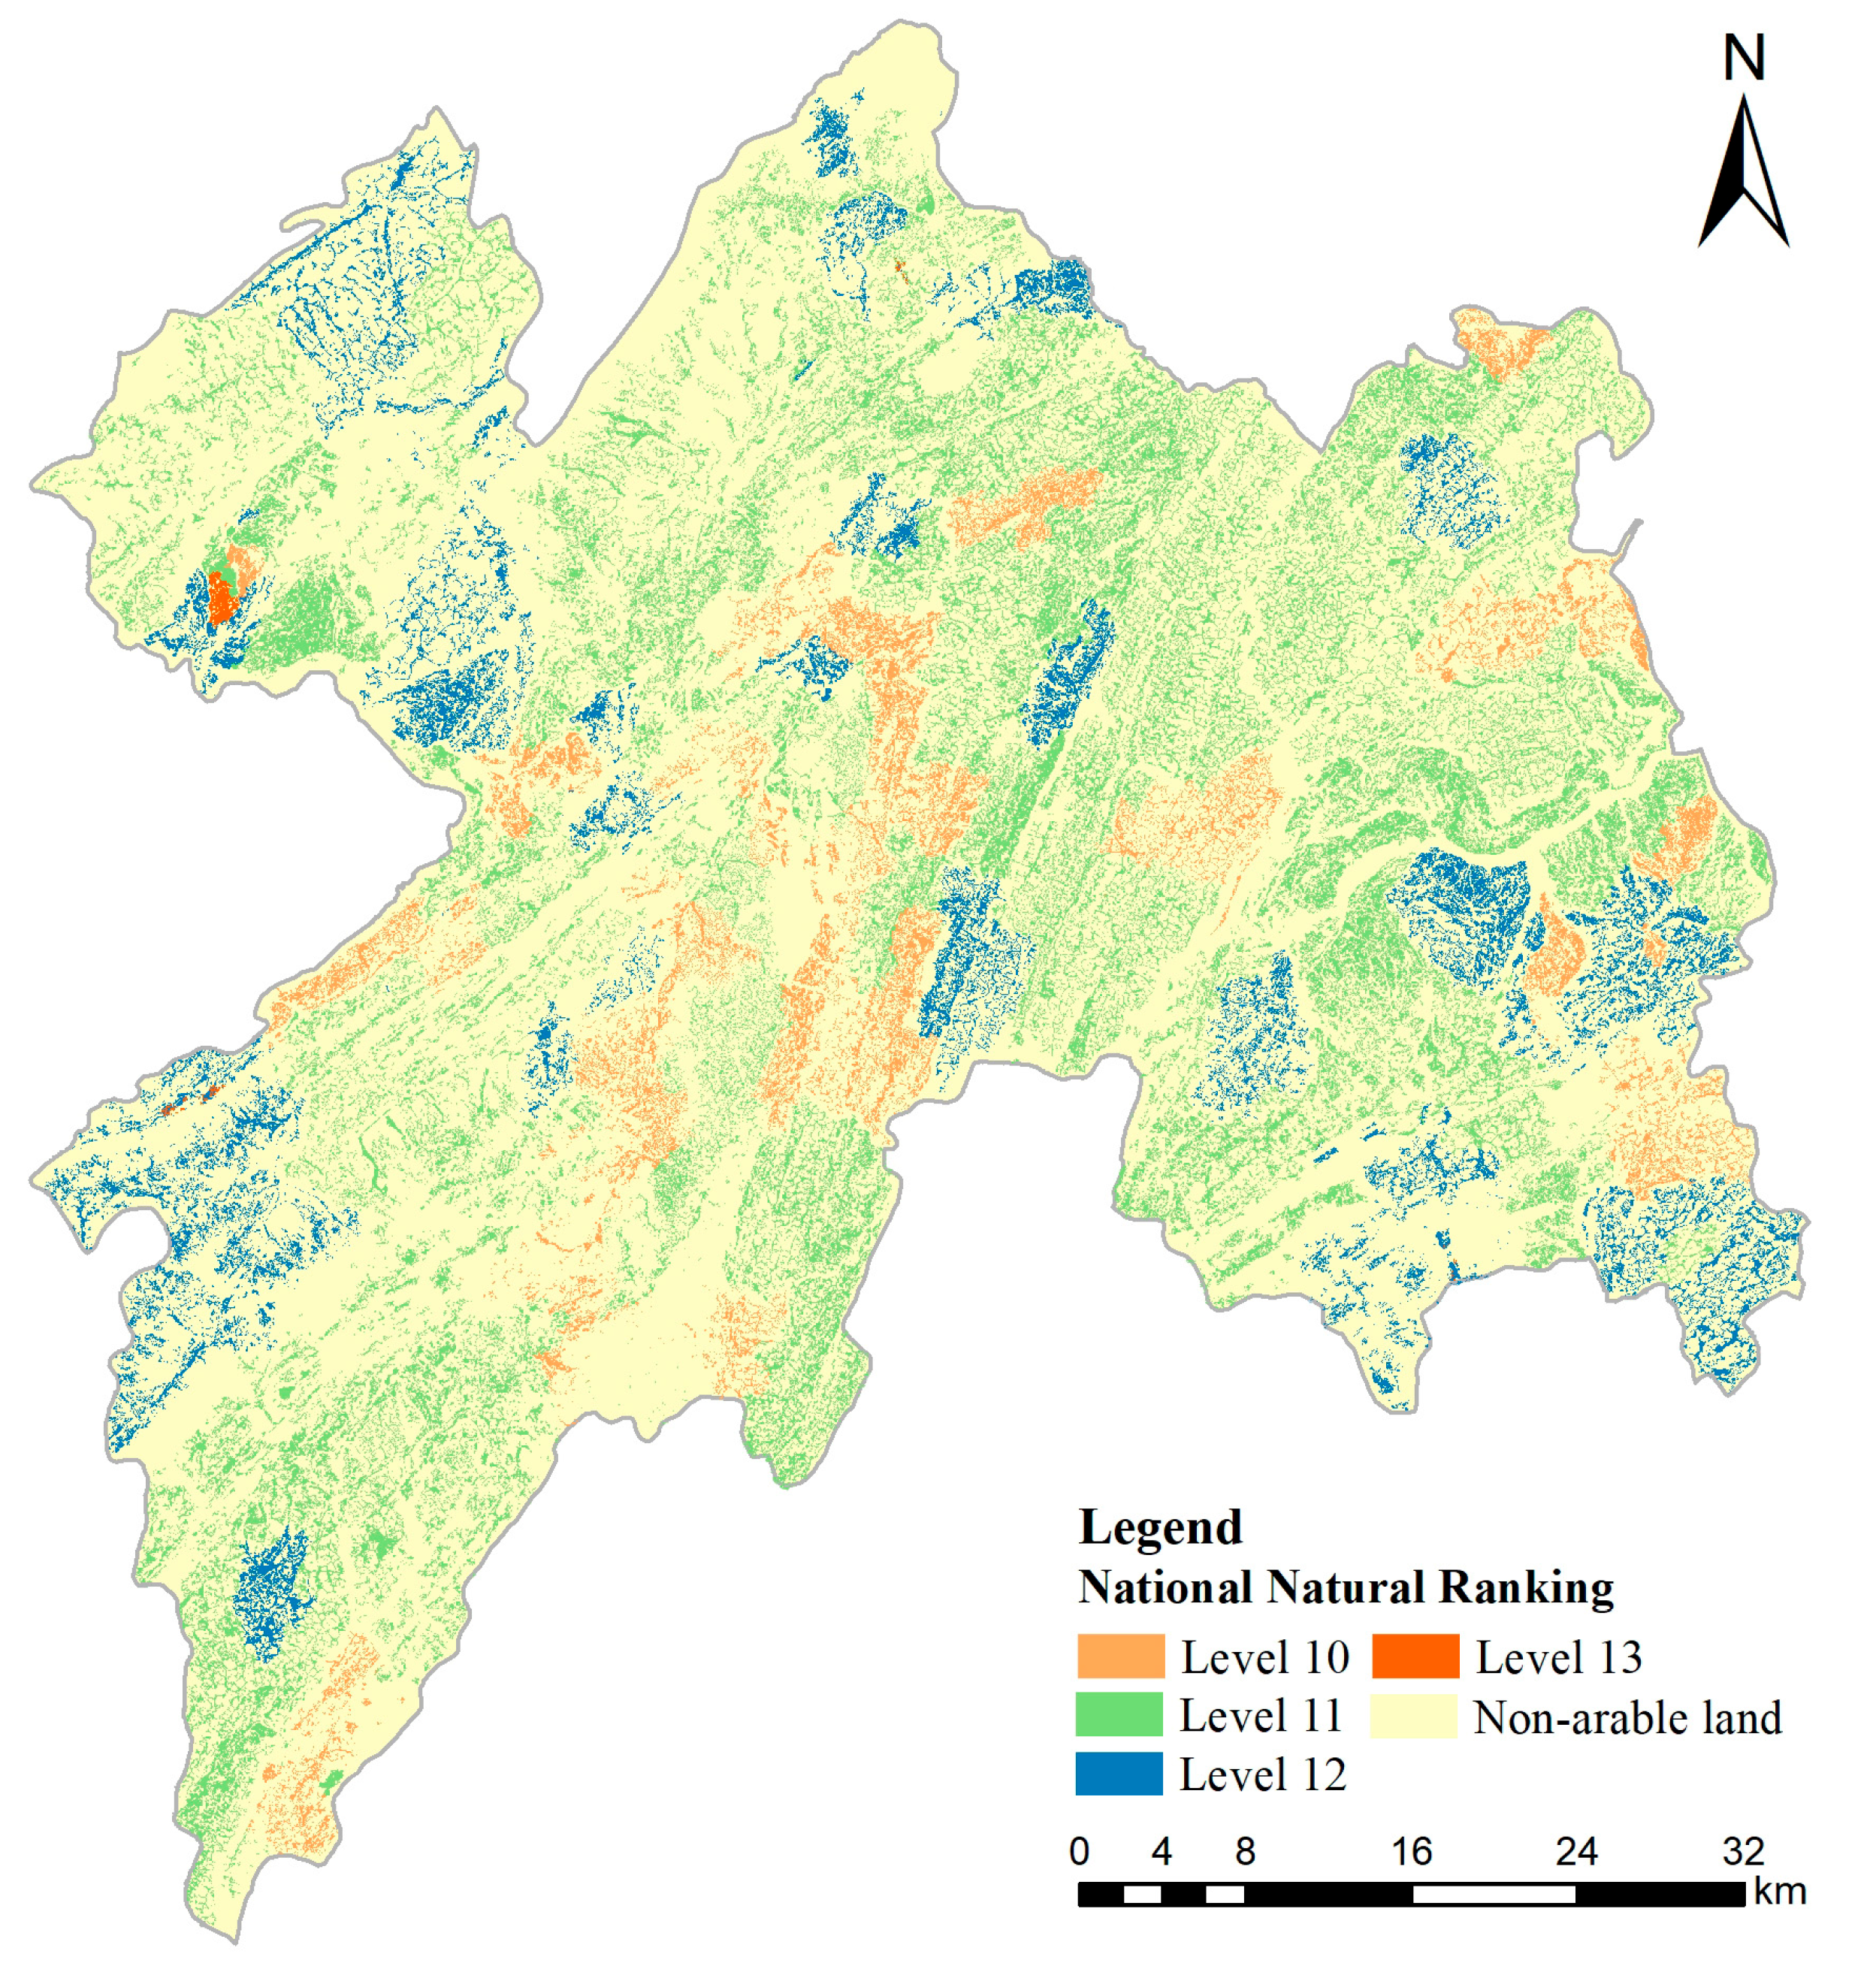
The spatial distribution of the cultivated land in Enshi is largely affected by the local topography. Cultivated land in high-altitude areas has poor quality, and the condition of cultivated land resources is not promising.

Author Contributions

Conceptualization, H.Y. and X.Z.; Methodology, H.Y. and X.Z.; writing—original draft X.Z. and H.Y.; writing—review and editing Z.Y. All authors have read and agreed to the published version of the manuscript.

Funding

This research was funded by the Public Welfare Industry Scientific Research Project of Ministry of Land and Resources: Research on the management and control system of land use transition, grant number 201511004-5.

Institutional Review Board Statement

Not applicable.

Informed Consent Statement

Not applicable.

Data Availability Statement

Data are available on request.

Conflicts of Interest

The authors declare no conflicts of interest.

References

  1. Ministry of Natural Resources of the People’s Republic of China. Available online: https://www.mnr.gov.cn/dt/ywbb/202108/t20210826_2678340.html (accessed on 8 January 2024).
  2. The Central People’s Government of the People’s Republic of China. Available online: http://www.gov.cn/zhengce/2017-01/23/content_5162649.htm (accessed on 8 January 2024).
  3. Li, Y.H.; Li, Y.R.; Westlund, H.; Liu, Y.S. Urban–rural transformation in relation to cultivated land conversion in China: Implications for optimizing land use and balanced regional development. Land Use Policy 2015, 47, 218–224. [Google Scholar] [CrossRef]
  4. Han, B.; Jin, X.B.; Jin, J.X.; Xu, W.Y.; Ren, J.; Zhou, Y.K. Monitoring and classifying cropland productivity degradation to support implementing land degradation neutrality: The case of china. Environ. Impact Asses. 2023, 99, 107000. [Google Scholar]
  5. Regulation for Gradation on Agriculture Land Quality; Standards Press of China: Beijing, China, 2012.
  6. Zhao, D.; Dong, J.Y.; Ji, S.P.; Huang, M.S.; Quan, Q.; Liu, J. Effects of Contemporary Land Use Types and Conversions from Wetland to Paddy Field or Dry Land on Soil Organic Carbon Fractions. Sustainability 2020, 12, 2094. [Google Scholar] [CrossRef]
  7. Li, Y.S.; Chang, C.Y.; Zhao, Y.C.; Wang, Z.R.; Li, T.; Li, J.W.; Dou, J.; Fan, R.; Wang, Q.; Yang, J.; et al. Evaluation System Transformation of Multi-Scale Cultivated Land Quality and Analysis of Its Spatio-Temporal Variability. Sustainability 2021, 13, 10100. [Google Scholar] [CrossRef]
  8. Tang, M.M.; Wang, C.T.; Ying, C.Y.; Mei, S.; Tong, T.; Ma, Y.H.; Qing, W. Research on Cultivated Land Quality Restriction Factors Based on Cultivated Land Quality Level Evaluation. Sustainability 2023, 15, 7567. [Google Scholar] [CrossRef]
  9. An, P.L.; Chen, S.Y.; Meng, L.J.; Jiang, L. Determination of standard farming system in cultivated land classification of the third national land survey. J. China Agric. Univ. 2020, 25, 61–72. (In Chinese) [Google Scholar]
  10. Zhou, J.; Li, P.P.; Wang, J.Z. Effects of Light Intensity and Temperature on the Photosynthesis Characteristics and Yield of Lettuce. Horticulturae 2022, 8, 178. [Google Scholar] [CrossRef]
  11. Hwang, H.; An, S.; Pham, M.D.; Cui, M.Y.; Chun, C. The Combined Conditions of Photoperiod, Light Intensity, and Air Temperature Control the Growth and Development of Tomato and Red Pepper Seedlings in a Closed Transplant Production System. Sustainability 2020, 12, 9939. [Google Scholar] [CrossRef]
  12. Zhao, H.W.; Zhu, Y.Q.; Li, M.; Yang, H.M. The correlation of light—Temperature indexes and light—Temperature potential productivity of spring maize. In Proceedings of the 2015 23rd International Conference on Geoinformatics, Wuhan, China, 19–21 June 2015. [Google Scholar]
  13. Qian, F.K.; Lal, R.; Wang, Q.B. Land evaluation and site assessment for the basic farmland protection in Lingyuan County, Northeast China. J. Clean. Prod. 2021, 314, 128097. [Google Scholar] [CrossRef]
  14. Shaloo; Bisht, H.; Jain, R.; Singh, R.P. Cropland suitability assessment using multi criteria evaluation techniques and geo-spatial technology: A review. Indian J. Agric. 2022, 92, 554–562. [Google Scholar] [CrossRef]
  15. Shokr, M.S.; Abdellatif, M.A.; Baroudy, A.A.E.; Elnashar, A.; Ali, E.F.; Belal, A.A.; Attia, W.; Ahmed, M.; Aldosari, A.A.; Szantoi, Z.; et al. Development of a spatial model for soil quality assessment under arid and semi-arid condition-s. Sustainability 2021, 13, 2893. [Google Scholar] [CrossRef]
  16. Jiang, Y.; Wang, J.; Teng, H.; Li, H.L. Coupling coordination analysis of the quality evaluation of cultivated land and soil erosion in typical black soil areas using TOPSIS method. Trans. CSAE 2023, 39, 82–94. (In Chinese) [Google Scholar]
  17. Samaei, F.; Emami, H.; Lakzian, A. Assessing soil quality of pasture and agriculture land uses in Shandiz county, northwestern Iran. Ecol. Indic. 2022, 139, 108974. [Google Scholar] [CrossRef]
  18. Zhao, R.; Wu, K.; Li, X.L.; Gao, N.; Yu, M. Discussion on the unified survey and evaluation of cultivated land quality at county scale for china’s 3rd national land survey: A case study of wen county, henan province. Sustainability 2021, 13, 2513. [Google Scholar] [CrossRef]
  19. Zhang, Y.H.; Wang, L.; Jiang, J.; Zhang, J.C.; Zhang, Z.M.; Zhang, M.X. Application of soil quality index to determine the effects of different vegetation types on soil quality in the Yellow River Delta wetland. Ecol. Indic. 2022, 141, 109116. [Google Scholar] [CrossRef]
  20. Gao, N.; Hu, Q.; Wu, K.N. Study on grade of cultivated land in cold region of black soil Based on yield ratio coefficient. Chin. J. Agric. Resour. Reg. Plan. 2021, 42, 51–57. (In Chinese) [Google Scholar]
  21. Li, J.Y.; Wu, K.N.; Song, W. Farmland quality classification based on productive ratio coefficient modified by crop nutrition equivalent unit. Trans. Chin. Soc. Agric. Eng. 2019, 35, 238–245. (In Chinese) [Google Scholar]
  22. Campagner, A.; Ciucci, D.; Denoeux, T. Belief functions and rough sets: Survey and new insights. Int. J. Approx. Reason. 2022, 143, 192–215. [Google Scholar] [CrossRef]
  23. Zhang, X.; Mei, C.L.; Chen, D.G.; Yang, Y.Y.; Li, J.H. Active incremental feature selection using a fuzzy-rough-set-based information entropy. IEEE Trans. Fuzzy Syst. 2020, 28, 901–915. [Google Scholar] [CrossRef]
  24. Yang, X.L.; Chen, H.M.; Li, T.R.; Luo, C. A noise-aware fuzzy rough set approach for feature selection. Knowl.-Based Syst. 2022, 250, 109092. [Google Scholar] [CrossRef]
  25. Eltamaly, A.M. A novel strategy for optimal PSO control parameters determination for pv energy systems. Sustainability 2021, 13, 1008. [Google Scholar] [CrossRef]
  26. Enshi Municipal People’s Government. Available online: http://www.es.gov.cn/zjes/sqgk/202202/t20220214_1243634.shtml (accessed on 8 January 2024).
  27. Technical Program for the Evaluation of Cultivated Land Quality Grade and the Preparation of its Change Table in Hubei Province; Hubei, China, 2016. Available online: https://www.doc88.com/p-49829705969676.html (accessed on 8 January 2024).
  28. Mao, T.T.; Xiao, K.; Zou, K. A Research on Multiple-indicators Comprehensive EvaluationMethod Based on Rough Set and Conditional Information Entropy. Stat. Res. 2014, 31, 92–96. (In Chinese) [Google Scholar]
  29. Pawlak, Z. Rough set. Int. J. Comput. Inf. Sci. 1982, 11, 341–356. [Google Scholar] [CrossRef]
  30. Wang, C.Z.; Huang, Y.; Shao, M.W.; Hu, Q.H.; Chen, D.G. Feature selection based on neighborhood self-information. IEEE Trans. Cybern. 2020, 50, 4031–4042. [Google Scholar] [CrossRef] [PubMed]
  31. Sang, B.B.; Yang, L.; Chen, H.M.; Xu, W.H.; Zhang, X.Y. Fuzzy rough feature selection using a robust non-linear vague quantifier for ordinal classification. Expert Syst. Appl. 2023, 230, 120480. [Google Scholar] [CrossRef]
  32. Sun, L.; Yin, T.Y.; Ding, W.P.; Qian, Y.H.; Xu, J.C. Feature selection with missing labels using multilabel fuzzy neighborhood rough sets and maximum relevance minimum redundancy. IEEE Trans. Fuzzy Syst. 2022, 30, 1197–1211. [Google Scholar] [CrossRef]
Figure 1. Location and terrain of the study area.
Sustainability 16 03484 g001
Figure 2. Flowchart of the natural quality evaluation of cultivated land based on the CIERS-PSO method.
Sustainability 16 03484 g002
Figure 3. Precision convergence curve of the RS conditional information entropy method based on PSO.
Sustainability 16 03484 g003
Figure 4. Comparison of the evaluation results between the RS conditional information entropy method based on PSO and the RS conditional information entropy method.
Sustainability 16 03484 g004
Figure 5. National natural grade evaluation results of cultivated land in Enshi obtained by the proposed method.
Sustainability 16 03484 g005
Table 1. The weight of indicators calculated employing the RS conditional information entropy method based on PSO.
FactorWheatMiddle Rice
Effective soil thickness0.0350.171
Surface soil texture0.0310.099
Soil organic matter content0.0110.072
Soil pH0.0290.078
Slope of the terrain0.0450.083
Irrigation guarantee rate0.0100.042
Surface rock outcrop degree0.0170.122
Soil erosion0.0330.123
Total0.2110.789
Table 2. The results of the evaluation employing the RS conditional information entropy method based on PSO.
Natural Quality Class of Arable LandNumber of Training Sample Units (pcs)Number of Sample Units Tested (pcs)Number of Correctly Classified Test Samples (pcs)Classification Accuracy (%)
Level 1013112,97210,66182.18
Level 1148147,61145,12194.77
Level 1212512,37411,42192.3
Level 1322139846.04
Total73973,17067,30191.98
Disclaimer/Publisher’s Note: The statements, opinions and data contained in all publications are solely those of the individual author(s) and contributor(s) and not of MDPI and/or the editor(s). MDPI and/or the editor(s) disclaim responsibility for any injury to people or property resulting from any ideas, methods, instructions or products referred to in the content.

