Article

Quantifying the Sustainability of Football (Soccer) Pitches: A Comparison of Artificial and Natural Turf Pitches with a Focus on Microplastics and Their Environmental Impacts

1
Institute for Chemical Technology of Organic Materials (CTO), Johannes Kepler University Linz, 4040 Linz, Austria
2
Institute of Polymeric Materials and Testing (IPMT), Johannes Kepler University Linz, 4040 Linz, Austria
3
Energieinstitut an der Johannes Kepler Universität Linz, 4040 Linz, Austria
4
GOE-Ip Production AS, 4046 Hafrsfjord, Norway
*
Author to whom correspondence should be addressed.
Deceased author.
Sustainability 2024, 16(8), 3487; https://doi.org/10.3390/su16083487
Submission received: 11 March 2024 / Revised: 1 April 2024 / Accepted: 9 April 2024 / Published: 22 April 2024
(This article belongs to the Special Issue Microplastic Pollution and Impact)

Abstract

:
Recently, the European Commission announced their intention to restrict intentionally added microplastics to reduce the amount emitted by 0.5 million tons per year. Findings on microplastics indicate toxic behavior for biota, yet many mechanisms remain in the dark. Microplastics also pose a challenge in life cycle assessment as methods are actively being developed. Considering this recent decision, an anticipatory life cycle assessment was performed, comparing the impacts of natural grass pitches with artificial grass pitches using bio-based infill materials as well as polymeric ones made from recycled and virgin materials. The aim was to confirm if microplastics are in fact a considerable environmental hazard when compared to more traditional impacts. The microplastics’ impact was modeled after the MarILCA group’s work on the new midpoint of physical effects on biota. The results showed that the influence of the microplastics remains negligible when using the method provided. For most midpoint categories, the wood-based infill showed the best results, often closely tied with the infill made from recycled rubber from tires. A sensitivity analysis revealed that neither the physical effects on biota nor the greenhouse gas emissions from degradation in a marine environment are deciding factors when assessing the endpoint of ecosystem damage.

1. Introduction

The International Organization for Standardization (ISO) defines microplastics (MPs) as solid particles made from plastic which are insoluble in water and have a size between 1 µm and 1 mm for the longest dimension of the particle [1]. Other authors refer to plastic particles which are smaller than 5 mm in diameter [2,3,4]. These ambiguous definitions already hint at the fact that MPs exist in very different shapes and sizes, and their chemical compositions vary as well. Additionally, MPs are a global phenomenon, with different authors reporting numbers such as 1000–10,000 particles per m3 of sea water in coastal areas, [5] 100,000 pieces per km2 of sea area near Antarctica [4], and 46.5 ng/mL of MPs in the melted snow water of mountain peaks in the Austrian Alps over 3000 meters above sea level [6]. While recent research suggests that the relationship between shape and transport pathways needs further investigation [7], it has been shown before that MPs infer ecotoxicological damage via pathways such as free radical generation by oxidation, endocrine disruption, and reproductive abnormalities in affected species [8]. It is not only the MPs that can be hazardous; the same is true for additives used in their production [9]. Physical pathways also cause damage as ingestion is common with MPs [10]. The consequences are manifold; some examples are reduced feeding rates, starvation, and weight loss [11,12]. As environmental consequences are evident, the need for the implementation of MPs in life cycle assessment (LCA), one of the most renowned sustainability assessment tools, was first acknowledged in 2017. The Medellín declaration was published, which acknowledged the lack of means of assessing MPs in LCAs, finding inventory data, and translating those results into environmental impact [13]. Briefly after, the MariLCA (Marine Impacts in Life Cycle Assessment) group was formed to derive reliable characterization factors (CFs) which link the life cycle inventory (LCI) result of kg of MPs emitted to a final result on the midpoint level to account for microplastics in an LCA [14]. When assessing toxicity, one needs to know three different figures and calculate the CF by multiplying these three. They are the fate factor (FF), describing how long the substance of interest stays in a certain compartment; the exposure factor (XF), describing how much of the substance is available to the species in question; and, finally, the effect factor (EF), quantifying the ecological damage to the species [15]. In one of the first studies within the MarILCA project, Lavoie et al. tried to find differences in effect factors among different virgin micro- and nanoplastics (MNPs) with varying sizes and surfaces. No differences were found, and, for the time being, the use of a generic effect factor independent of polymer type was recommended [16]. This highlights the complexity of the task at hand as a large number of different polymers exist which need individual EFs for a precise description. In a subsequent study, Corella-Puertas et al. attempted to find a fate factor for MNPs by treating the ocean as a single compartment, combining it with the generic exposure and EF found by Lavoie et al. and establishing a way to calculate damage at the midpoint level [17]. For this, a new midpoint was postulated: physical effects on biota (PEBs) [14]. In the work of Corella-Puertas et al., a case study was performed by comparing the midpoint and endpoint results of the newly developed MNP indicator with the rest of the product life cycle [17]. This work was later amended and improved by the same group [18] to align with UseTox™, following a recommendation by Owsianiak et al. to use lower effect concentrations to bring the model closer to reality [19], marking the first work assessing the environmental impacts of MPs based upon mass (kg emitted) [20]. This is relevant as the European Chemical Agency (ECHA) estimates that 145,000 tons of microplastics are used annually in the EU/EEA [21]. There are various sources for MPs entering the environment, with artificial turfs (ATs) for sports pitches being the largest single contributor, with 16,000 tons [22] produced annually in Europe by an estimated number of 42,000 pitches [23]. Recently, the European Commission decided to follow the recommendation and will ban microplastics in pitches, giving owners 8 years from the implementation of the ban to change to a different design [24]. Despite this, findings of research on the sustainability of pitches are scarce. Russo et al. compared artificial to natural grass turfs (NTs) within the Product Environmental Footprint framework and found that artificial turfs have reduced impacts in terms of climate change (CC) due to the credit obtained for using end-of-life tires (ELT) [25]. For other mostly toxicity-related categories, natural grass showed advantages. Bertling et al. analyzed several types of artificial turf pitches with different infills in Germany and Switzerland, using a functional unit of 1 h of playtime and considering only global warming potential [26]. Itten et al. investigated artificial turf football pitches in Zürich, Switzerland. Data were compiled from manufacturers of such sports facilities and subjected to an LCA with a functional unit of 1 h of playtime [27]. Synthetic turfs and natural grass were compared, and great sensitivities toward the functional unit and system boundaries were identified which led to mixed results in which each type of pitch showed favorable results at certain times. In another study, Magnusson and Mácsik analyzed greenhouse gas emissions and the primary energy demand for different infill materials [28]. It was once again found that recycling materials helped reduce energy demand and greenhouse gas emissions. However, leachates were recorded for most of the materials, and their inclusion in further studies was demanded. None of the studies dealt with the apparent environmental problem of microplastic pollution in a quantitative way. Using the foundation established by the works of MarILCA, new CFs for rubbers were derived. The framework at hand allows us to address our research question, determining whether MPs have a significant influence in terms of sustainability when comparing artificial turf sports fields to biobased infill or natural grass pitches. To answer this question, three scenarios symbolizing characteristic amounts of MP emissions were derived from the literature and assessed using the MarILCA framework in combination with LCI data from the literature for the remaining part of a football pitch, as well as primary data from a producer of bio-based infill material and a comparison to natural grass. As a large amount of data was sourced from the literature, this LCA can be described as anticipatory, as introduced by Wender et al. [29].

2. Materials and Methods

2.1. Life Cycle Assessment

An LCA was performed in four phases, as demanded by ISO 14044, which are introduced in the following sections [30].

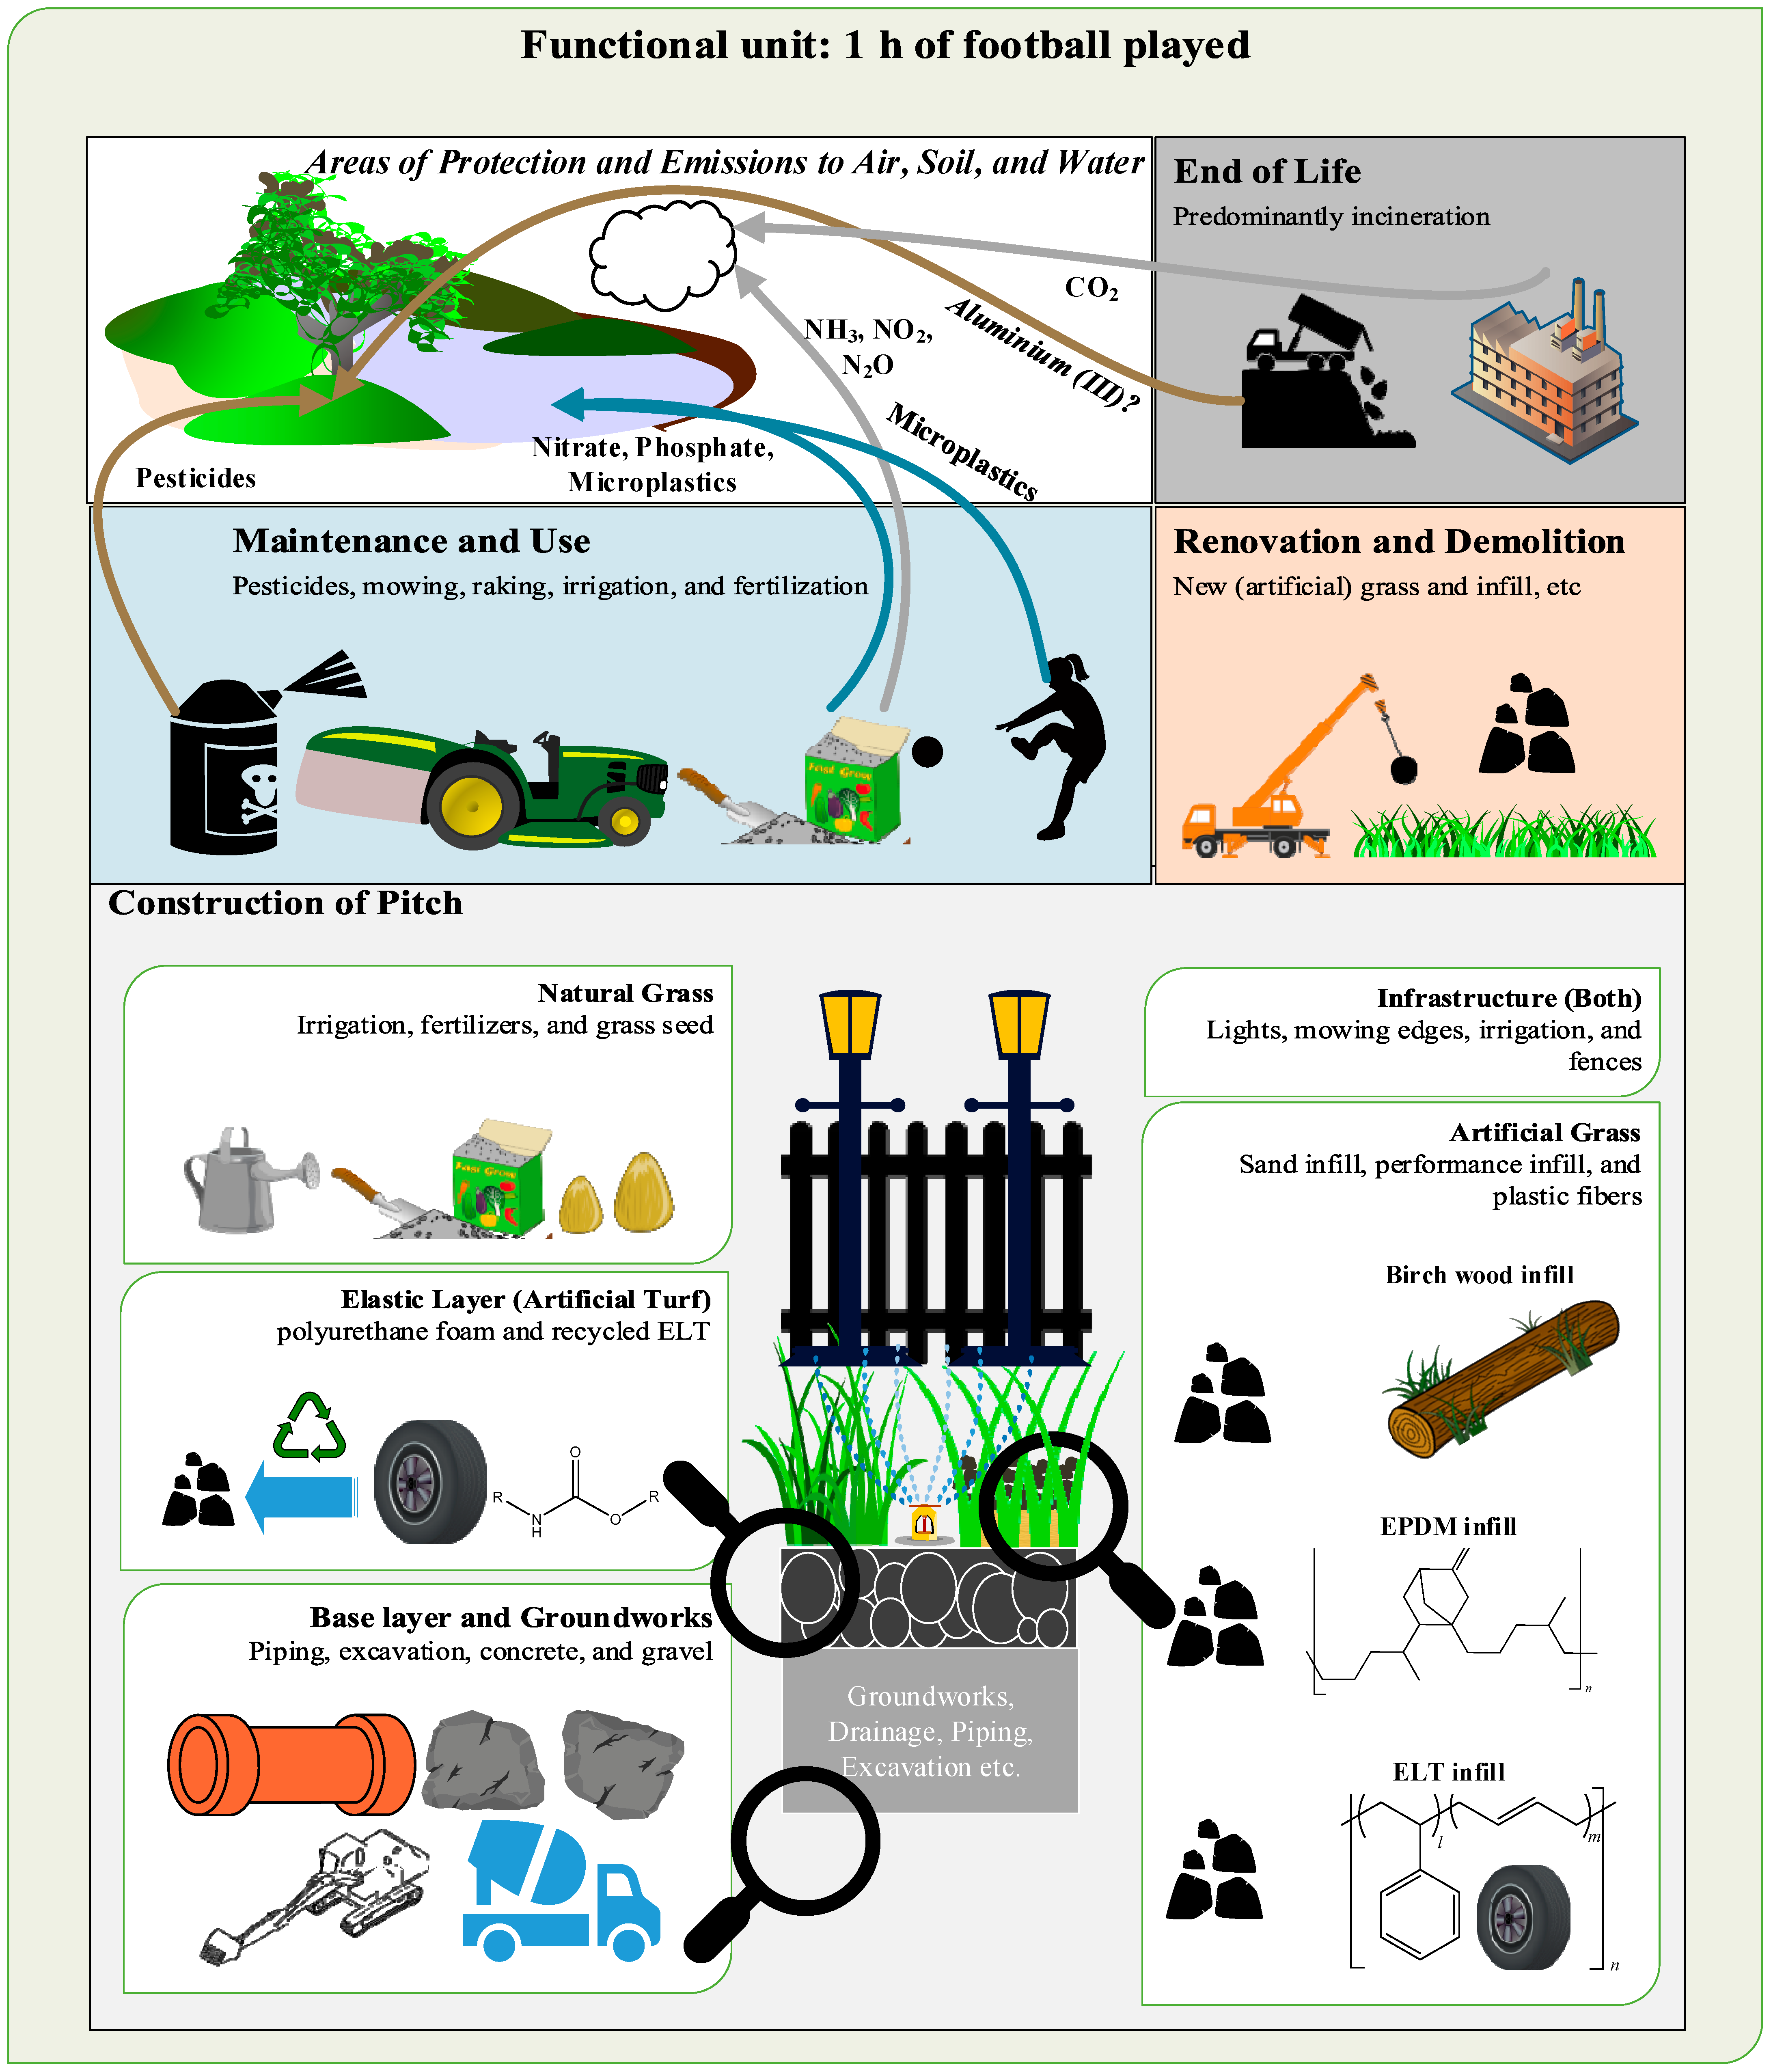
2.1.1. Goal and Scope Definition

The functional unit was 1 h of football played in Norway on a pitch made from artificial grass using wood-based performance infill, ELT, virgin ethylene propylene diene monomer rubber (EDPM), or natural grass. The reason for choosing Norway as the geographical area of interest was because the biobased infill is produced there. Moreover, Norway witnessed a strong increase in the number of artificial turf pitches recently and neared 2000 pitches in 2020 [31].The inventory included the sourcing of pitch materials, pitch deconstruction after a maximum lifetime of 30 years, as well as all maintenance and renovation steps. The usage phase was also analyzed with respect to MP emissions. An important distinction was modeled similarly to the work of Itten et al. as the playing time per year amounted to 800 h for the natural grass pitch, whereas the artificial pitches were available for 1600 h per year [27]. Two different system boundaries (SBs) were applied. SB1 did not account for microplastics emissions and PEBs, whereas SB2 did to produce endpoint results to answer the research question as to whether PEBs by MPs are the main contributors to sports pitches’ impact on marine life. A graphical representation is found in Figure 1.
An important distinction is that SB1 features a full cradle-to-grave analysis as all process steps are accounted for, from sourcing the raw materials, construction, renovation, and maintenance to EoL, except for MPs. For SB2, the EoL of the MPs was also excluded from the results as primary data were not available and data from the literature showed considerable variation. Nonetheless, implications of MP’s EoL are discussed in a sensitivity analysis in the Section 3. An important fact is that the two SBs also act as a division between the levels of the LCIA as SB1 deals with results at the midpoint level, whereas SB2 focuses on endpoints.

2.1.2. Life Cycle Inventory

The life cycle inventory (LCI) was mostly sourced from the work of Itten et al. [27]. The data were originally gathered for the city of Zurich, Switzerland, but we decided to reuse them as primary data because carrying out data collection for Norway was out of the scope of this project as the focus was on the infill produced and not on the overall infrastructure. For the production of the biobased infill, which meets FIFA Quality Pro standards, primary data from the manufacturer, GOE-Ip AS, were used [32]. For the recycling of tires into ELT, the inventory followed the work of Johansson [33]. The annual amount of infill was not modeled after the work of Itten et al. As various sources report different values, it was decided to choose the 2.98 t/a reported by Bertling et al. as they reported the closest value to the 2.8 t/a reported by GOE-Ip AS [26,34,35]. Magnusson and Mácsik compared different infill types and showed the same amount of infill added for different types during the course of pitch renovation, which we also assumed for this study [28]. The question of how many infill MPs enter the aquatic environment was difficult to answer as highly fluctuating numbers were found, with little experimental information available. We used the findings of Løkkegard et al. to derive best-case, base-case, and worst-case scenarios of MPs entering the marine environment [36].

2.1.3. Life Cycle Impact Assessment

The calculations were performed using openLCA software version 1.11, with the ecoinvent cutoff database v.3.9.1 used for background processes [37]. The LCIA method chosen was ImpactWorld+ with the versions “Default_recommended_midpoint 1.29” for midpoints and “Default_recommended_damage 1.47” for endpoints [38]. The results for PEBs were calculated in Microsoft Excel as described in Section 2.2 and later added to the results from openLCA.

2.2. Modeling Impacts of Microplastics

The derivation of CFs followed the work of Corella-Puertas et al. [18]. The three terms shown in Equation (1) were determined individually to derive impacts for PEBs for the rubbers used as infill in the LCA.
Equation (1): The calculation of characterization factors for the midpoint of physical effects on biota. FF describes the fate factor, XF is the exposure factor, and EF is the effect factor, as outlined in the UseTox™ documentation [15].
C F = F F X F E F C F = F F k g   i n   c o m p a r t m e n t k g   e m i t t e d y e a r X F k g   b i o a v a i l a b l e k g   i n   c o m p a r t m e n t E F P A F m 3 k g   b i o a v a i l a b l e = C F P A F m 3 k g   e m i t t e d y e a r
The fate factor was calculated as discussed in Section 2.2.1. The XF was set to 1, as in the original work of the MarILCA framework, assuming that all MPs entering the marine compartment are bioavailable [16,18]. The effect factor (EF) was obtained from the updated work of Corella-Puertas et al., based upon the initial work of Lavoie et al., and was set to 1067.5 PAF * m3/kg [16,18].

2.2.1. Calculation of Fate Factor

Again, the FF was calculated analogously to the works of Corella-Puertas et al. [17,18]. Therefore, the degradation and sedimentation rates were calculated and added together to yield the rate constant k. The constant’s inverse matrix then yielded the FF. Equation (2) describes the calculation if a surface degradation rate ( k d ) can be found. The other terms were the density ( ρ ) and the specific surface a r e a   ( A S S ) _ of the MP particle in question. In the case that no surface degradation rate is available, the decay equation, Equation (3), was used with values from the literature and transformed to find k . As 0 is not a possible value, complete degradation was calculated by assuming a value for A of 1% of the initial mass. The same approach was used to calculate the sedimentation rate, as complete sedimentation was assumed for all cases and different times to reach this state were investigated. Sedimentation rates were obtained from the literature as no experimental data on rubbers were found. No transfer to other compartments was assumed, as carried out by the group of Maga et al., who assumed that no redistribution to other compartments for all types of polymers occurs if they enter marine waters first [39].
Equation (2): the equation originally published by Chamas et al. [40] and modified by Corella-Puertas et al. [17] to calculate the MP degradation rate in the marine compartment.
r d e g r a d a t i o n ( k g m a s s   l o s s k g m i c r o p l a s t i c y e a r ) = k d µ m y e a r ρ k g m 3 A S S m 2 k g
Equation (3): the equation used to describe the degradation of MPs.
ln A   ( k g ) = ln A 0   ( k g ) k t   ( y e a r )

2.2.2. Endpoint Results

The obtained results for PEBs are at a midpoint level. To derive CFs for the endpoint indicator of ecosystem damage, the conversion of factors described by Corella-Puertas et al., as shown and described in Equation (4) and published in their updated framework, was used [18].
Equation (4): to derive the endpoint for PDFs (Potentially disappeared fractions of species), a severity factor of 0.025 was multiplied while dividing by the ocean depth, which was assumed to be 100 m in the case at hand.
C F E n d p o i n t   P E B = C F M i d p o i n t P A F m 3 k g   e m i t t e d y e a r 0.025 O c e a n   d e p t h   m = P D F m 2 y e a r k g   e m i t t e d

2.3. Sensitivity Analysis

As the character of this LCA can be described as anticipatory, a precise sensitivity analysis (SA) is indispensable [29]. The SA was performed by analyzing different scenarios in parts of the LCI and LCIA phases. For the LCI, two different polymer infills were compared to the biobased alternative with three different levels of the percentage of MPs reaching marine waterways, yielding 9 scenarios for the polymeric infills. To characterize these scenarios, a total of 30 CFs for the PEB endpoint were calculated and applied. In SB2, the results are presented without accounting for the EoL of the MPs and the biobased infill entering the sea due to unsatisfying data. Nevertheless, the respective EoLs were explored in the SA, focusing on climate change and the ecosystem damage induced as we assumed that greenhouse gases such as carbon dioxide, methane, and ethylene were the main degradation products for both infill types, which was confirmed by several recent works [41,42,43,44,45].

3. Results

3.1. Life Cycle Inventory

A detailed life cycle inventory for pitch construction, renovation, maintenance, and deconstruction after 30 years is presented in the Supporting Information Table S1. Following the method introduced in Section 2, the mass of MPs ending up in marine waters annually is presented in kg in Table 1, based upon the findings of Løkkegard et al., as introduced in Section 2 [36].
Moreover, for the production for 1 kg of biobased infill, 0.13 kWh of electricity is needed, with an amount of 0.25 kg going to waste, which was modeled to enter incineration using the ecoinvent process the “treatment of waste wood, untreated, municipal incineration|waste wood, untreated|Cutoff, S—RoW” [37]. The production of 1 kg of ELT infill is shown in Table 2, based upon the work of Johansson [33].

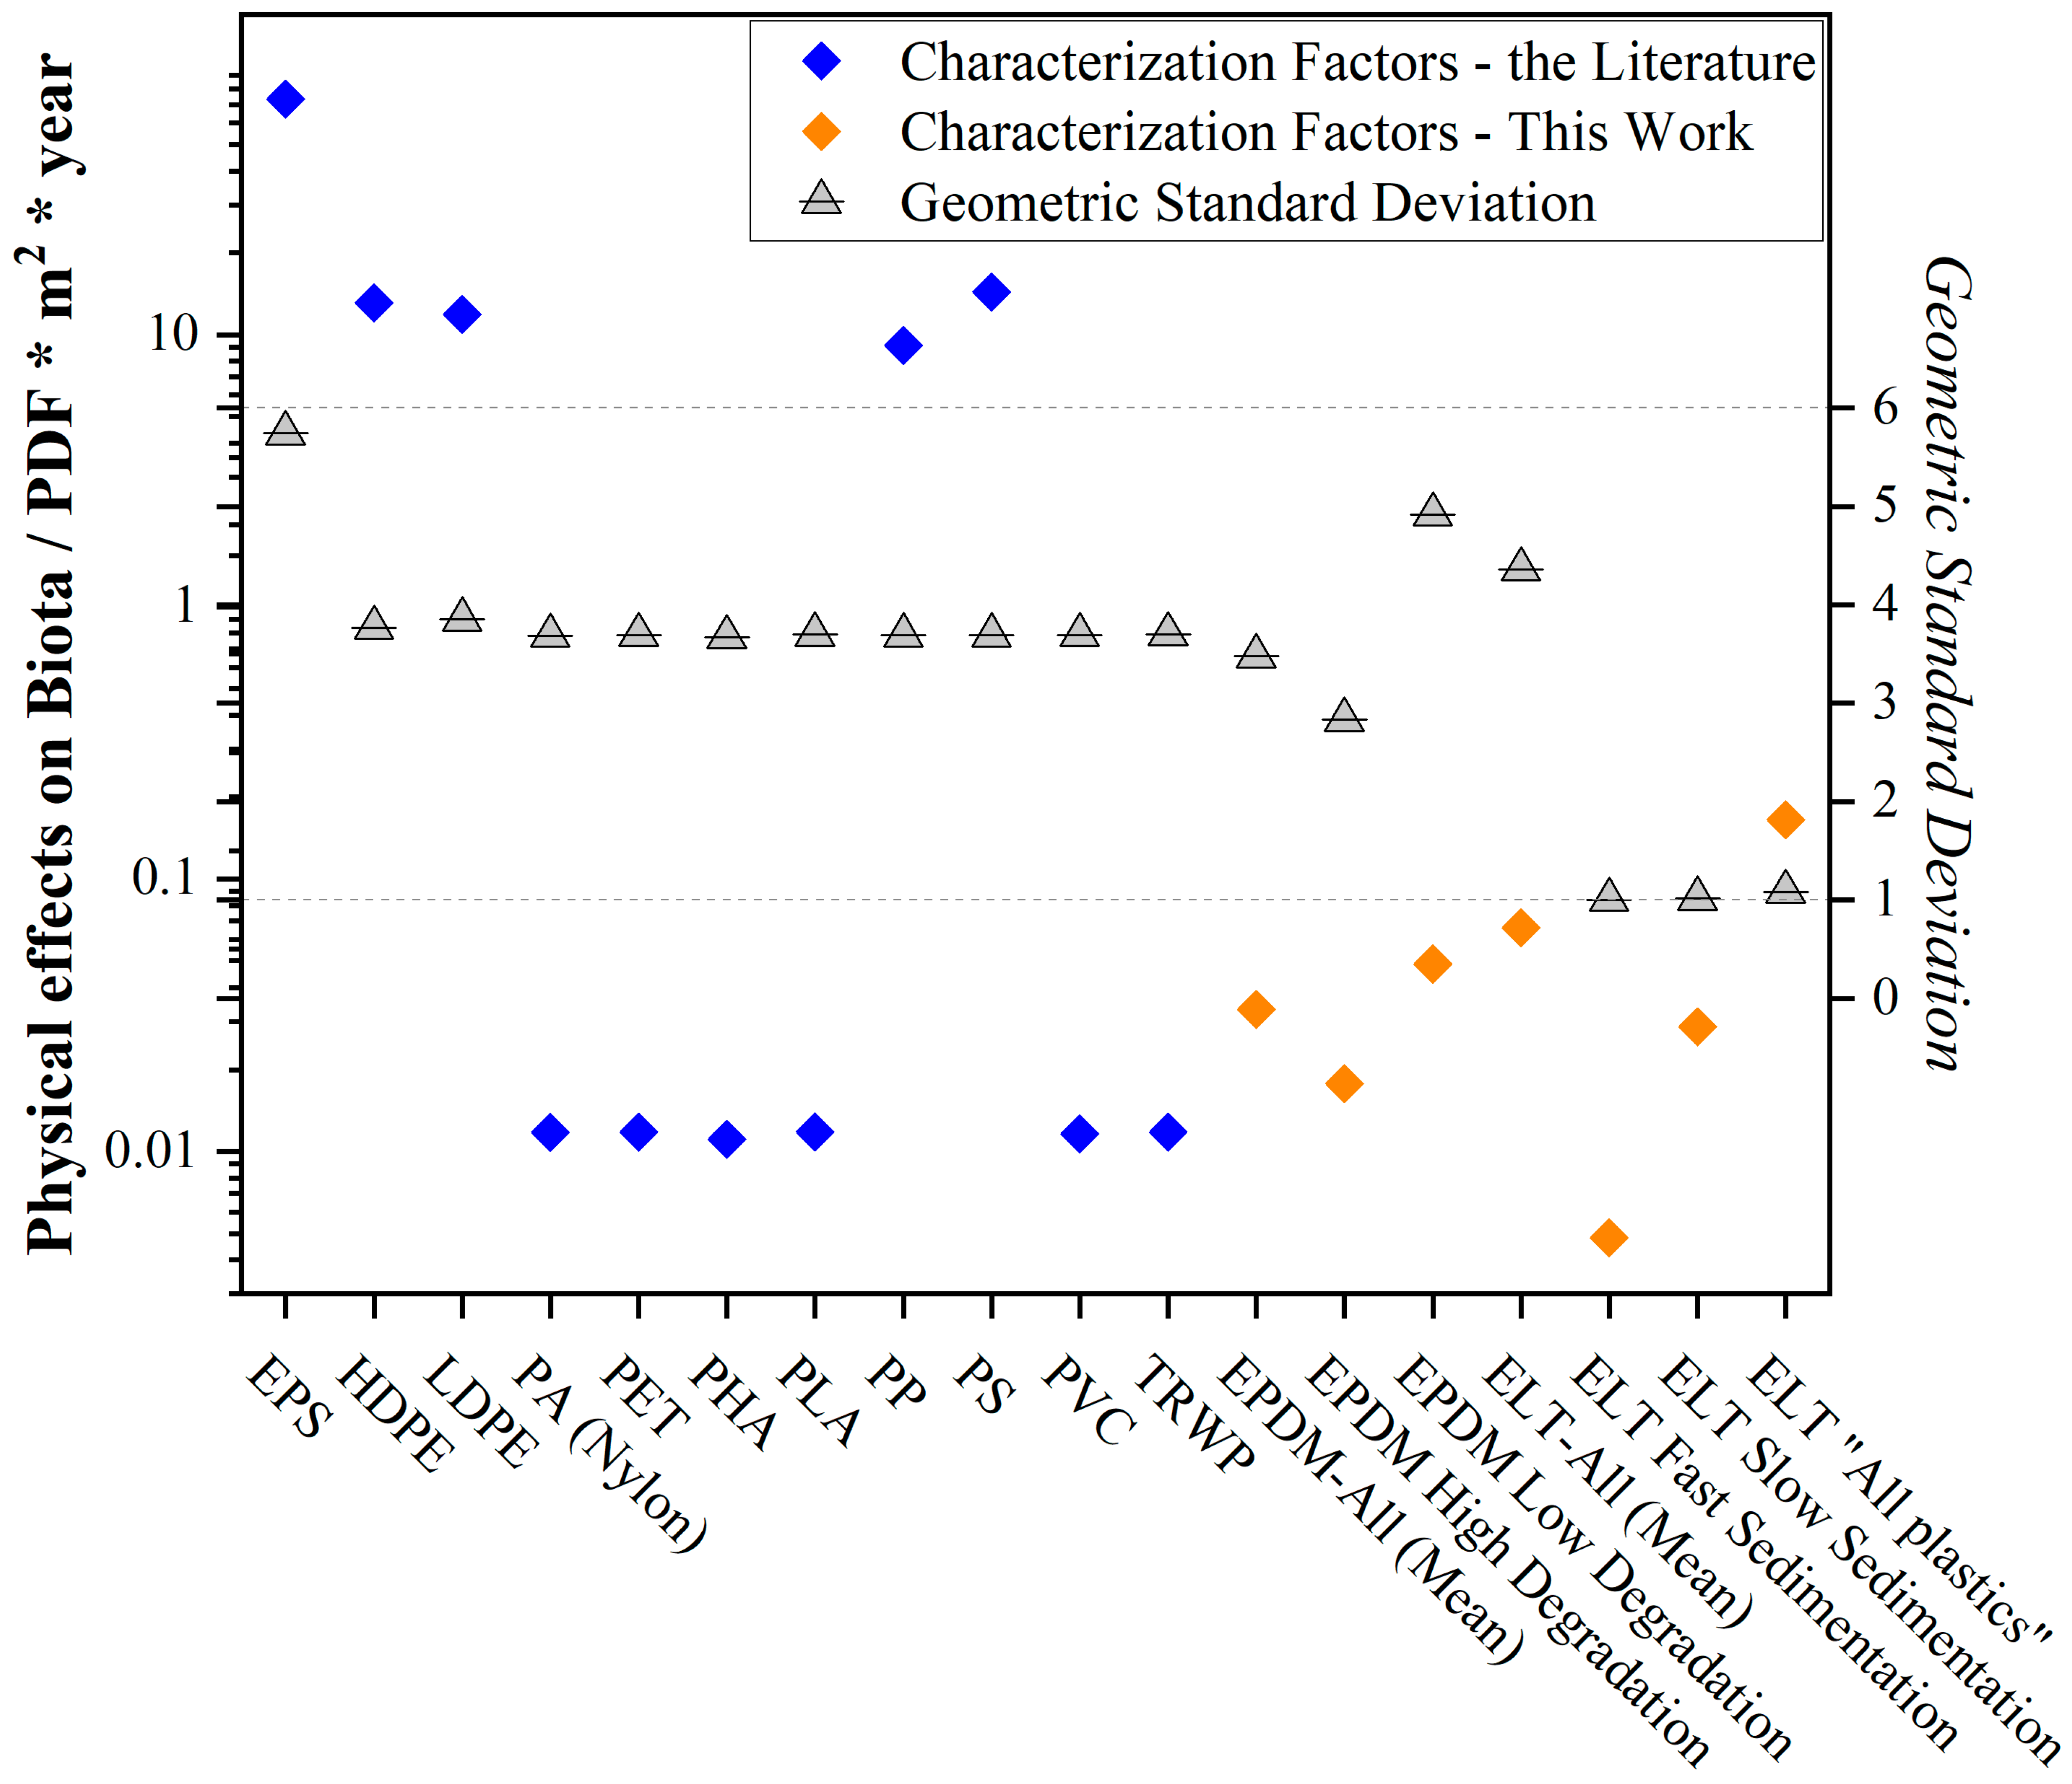
3.2. CFs for MP Rubbers

The results for the CFs for the midpoint (PEBs) and endpoint are presented in Table 3. For EPDM, 6 CFs were calculated, and for ELT, 24 CFs were calculated. This difference is due to experimental data on degradation being available for EPDM, whereas for ELT, no applicable experimental data were found, and it was decided to test a greater range of scenarios. Inputs and calculations are provided in Supporting Information Table S2.

3.3. Life Cycle Impact Assessment—SB1

An overview of the different results at the midpoint level is provided in Figure 2 with the results being normalized to natural grass. Exact data and individual figures with absolute values for the impact categories are found in Supporting Information File S1 and Table S3.

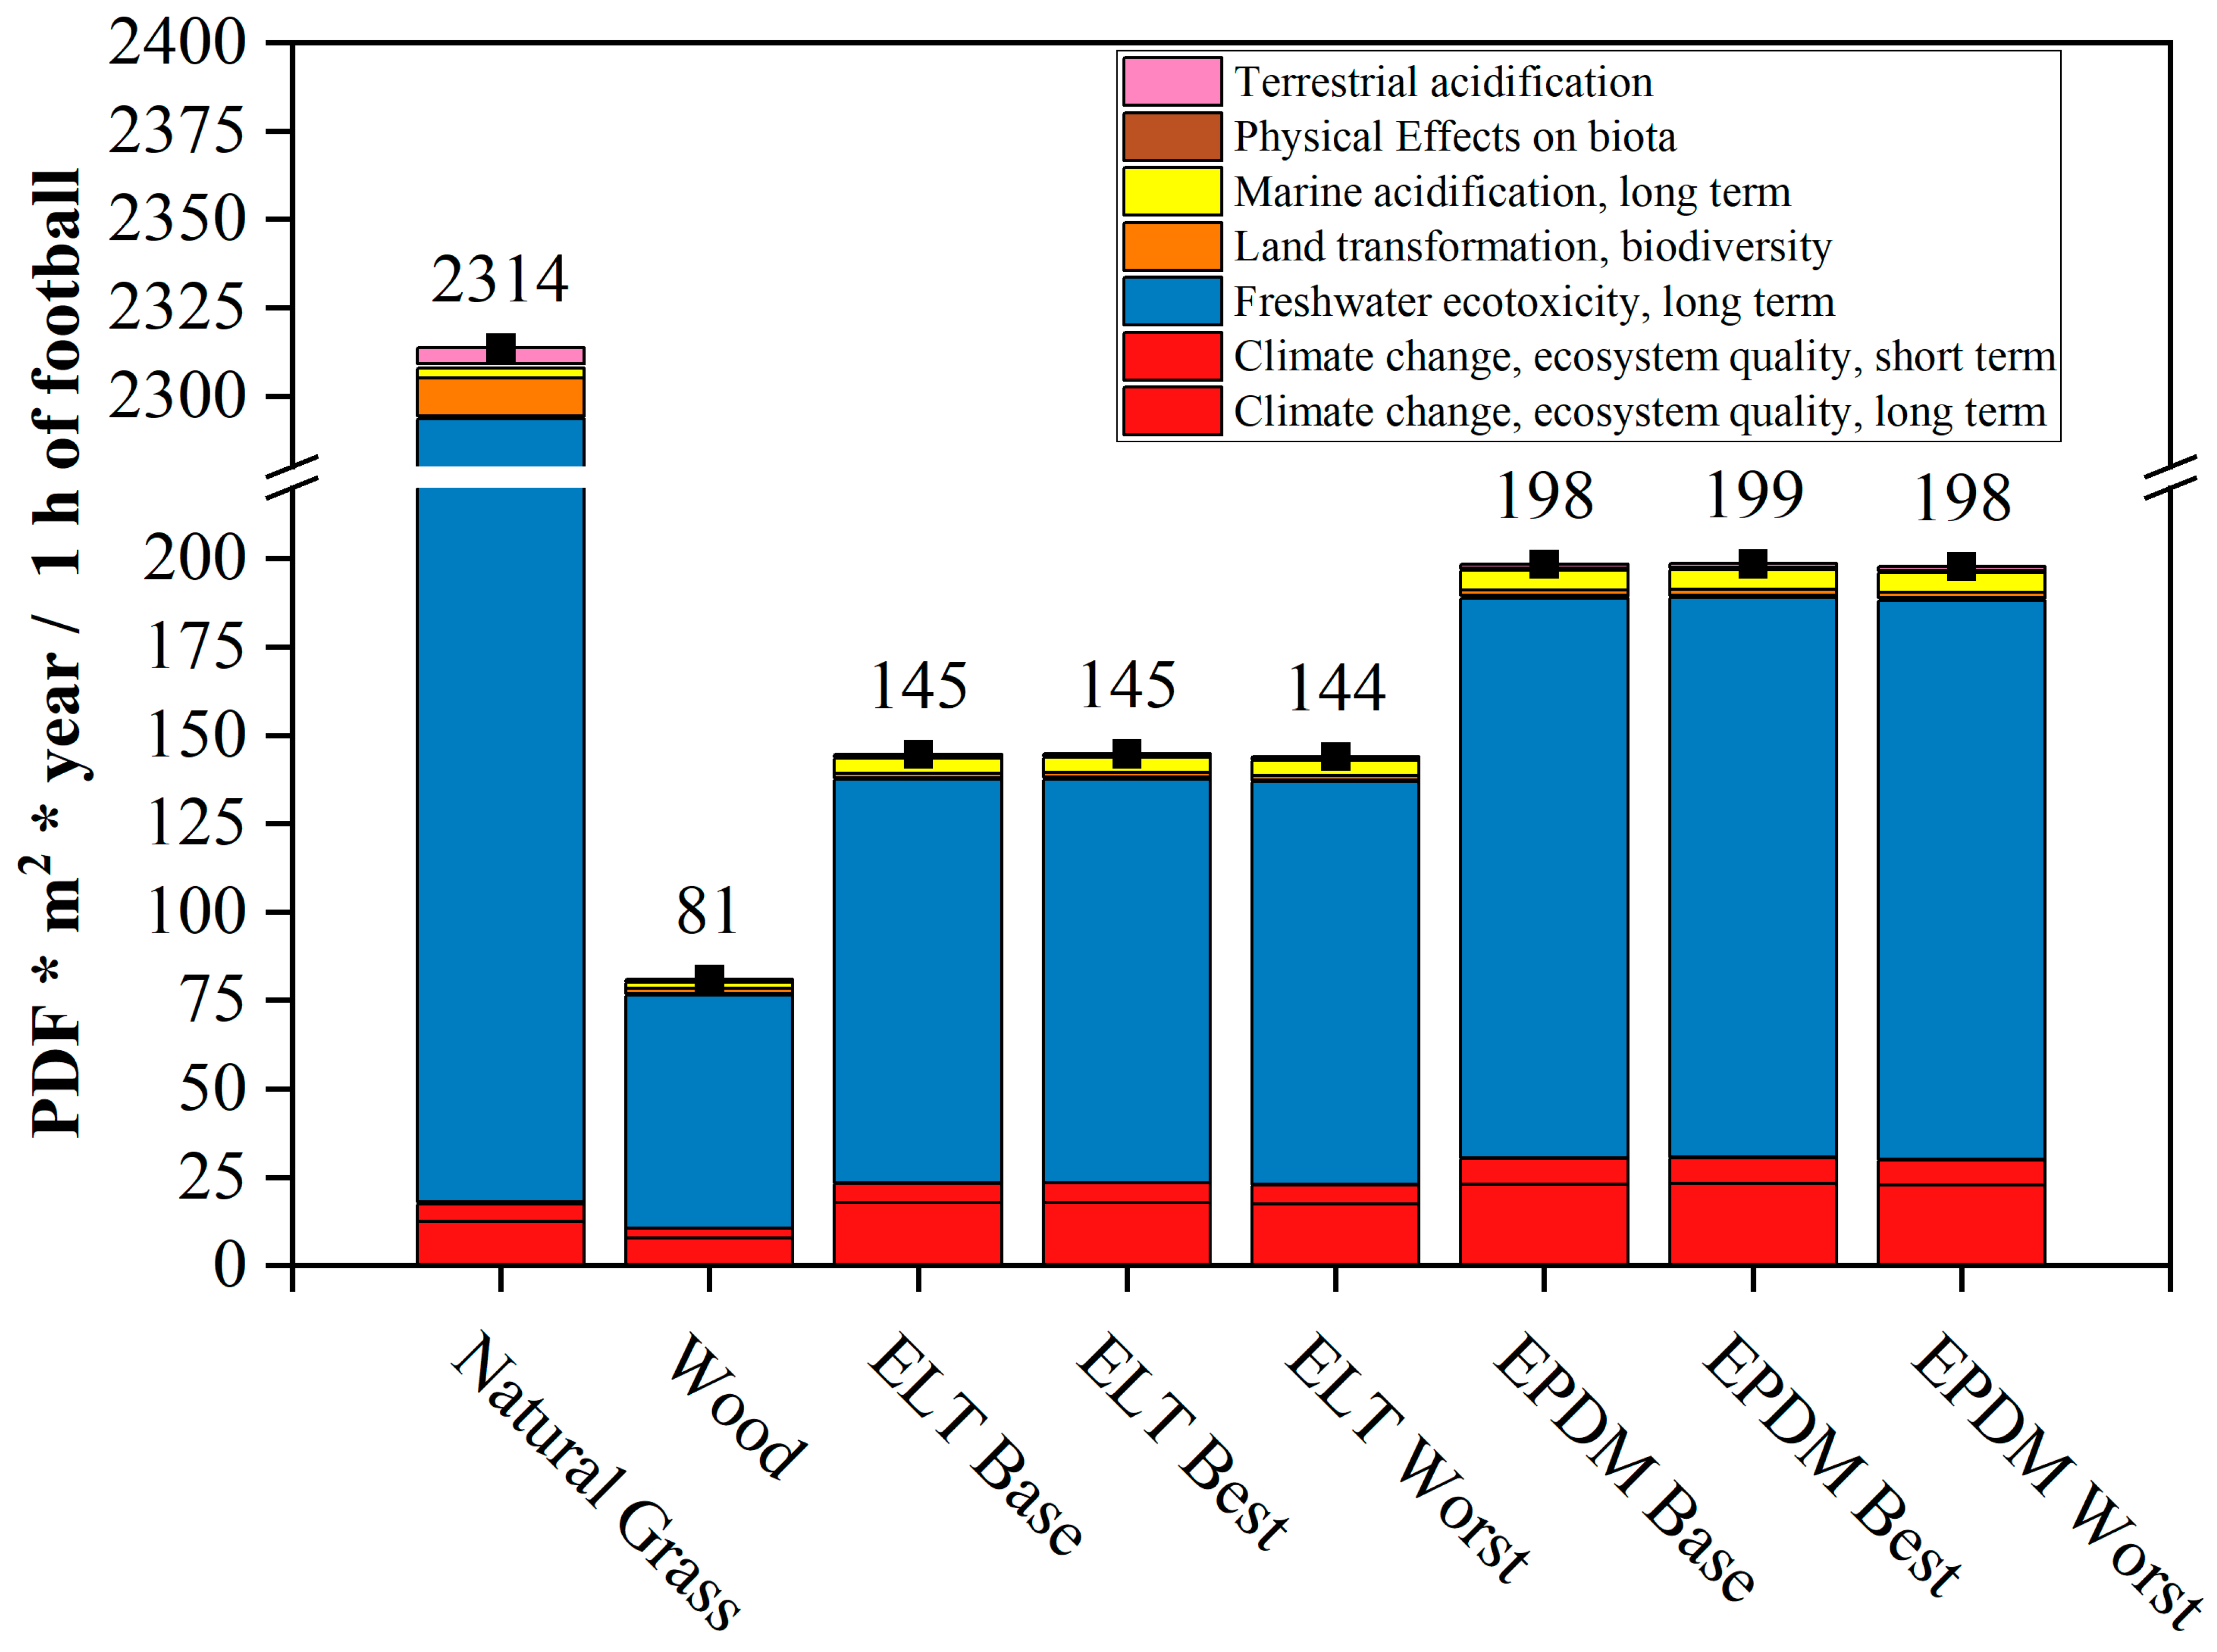
3.4. Life Cycle Impact Assessment—SB2—Ecosystem Damage

Figure 3 shows the results for the microplastics’ damage via the PEB impact category for an FU of 1 h of football played.
Those values are then added together with the damage obtained from the other midpoint categories, with the results visible in Figure 4. For the results presented, mean values were used.
Ultimately, the CFs obtained in this work for the rubber infills were compared with the values obtained for different polymers by Corella-Puerta et al., and the geometrical standard deviations are compared in Figure 5.

4. Discussion

4.1. LCI Generation

The generation of the LCI strongly relied on the work of Itten et al. as it provided a highly detailed inventory [27]. Naturally, primary data for Norway would have been preferable; however data collection was not within the scope of this work. The literature was screened for similar works, and the LCIs reported showed results within the same range. Russo et al. reported a total infill amount of 162 t of ELT for the pitch lifetime, whereas our study found 233 t [25]. This difference likely comes from infill handling during maintenance. Russo et al. reported a maintenance interval of 10 years with an infill need of 4.8 tons. This 0.48 t/a is a very different figure to the 2.98 t/a used in this study, as suggested by Bertling et al. [26]. Varying data represent a common theme in the literature, as Bertling et al. found values for infill loss between 1.29 and 4.67 t/a for Nordic countries. Other sources argue that the infill is not actually lost but rather compacted within the pitch [46]. Verschoor et al. reviewed the literature on ELT infill and found that only 0.6–1.2 t/a would be required to make up for losses due to compaction and actual losses. The authors also stated that losses to the environment can be virtually reduced to zero with additional measures [47]. Similarly, the amount of infill needed or the amount of infill/MPs discharged to waterways are also points of discussion in the literature. In this studies’ LCI, we used a framework from the technical report of Løkkegard et al. to derive base-case, best-case, and worst-case scenarios [36]. The original source used an annual infill of 2.2 t/a, which was adjusted to 2.98 t/a in this work. This approach was chosen as the amount of infill entering waterways depends on a multitude of factors, such as weather condition during usage, the presence of retention installations, sewage installations, and many more. The best-case scenario aims to depict an emission which is almost zero (0.05%), while the worst-case scenario is somewhat close (10.91%) to the first estimates by European authorities which led to the first discussions of banning MPs.

4.2. Microplastics’ Impacts and Developments of CFs

For the sake of simplicity, it was assumed that all MPs entering water systems are discharged into a marine environment, which marks the final compartment; this was also assumed by Maga et al. [39]. This assumption seems acceptable as more than 75% of Norway’s population lives within 16 km from the coastline and thus freshwater impacts are most likely negligible [48]. Following the framework of MarILCA’s work, it was found that finding research data on the degradation and sedimentation rates of rubbers proved to be a challenging endeavor. For the virgin rubber, EPDM, measured degradation rates were found. Nakamura et al. report a surface degradation rate of 13 µm/a for an EPDM (“EPDM_High”) seal under water at temperatures between 25 and 45 °C [49]. This figure is in line with the work of Chamas et al., who reported values of 7.5, 4.3, and 15 µm/a for poly-lactic acid (PLA), high-density polyethylene (HDPE), and low-density polyethylene (LDPE) [40]. Nevertheless, as elevated temperatures above marine levels were reported, an arbitrary degradation rate of 1 µm/a (“EPDM_Low”) was added to test for sensitivity. For the sedimentation of EPDM, no experimental data were found. Koelmans et al. derived a framework for describing the plastic content of the ocean surface layer. They reckoned that in 3 years, all plastic would sink to the seabed if no new particles were added; thus, this timeframe was used for EPDM in order to simulate 99% removal [50]. These scenarios were termed “Allplastic.” To increase the number of scenarios, two values from Corella-Puertas obtained by analyzing tire and road-wear particles (TWRPs) were used to calculate the sedimentation of EPDM, as similar behavior was assumed. The main reason is EPDM’s density, which is higher than that of water, which was also described for the TWRP with its rather fast sedimentation ratio. They assumed full sedimentation in one month in the fast scenario and six months in the slower one, both of which were used in our case study [18]. All the sedimentation scenarios mentioned were also applied for the ELT cases. Unlike EPDM, no experimental data for the degradation of ELT MPs were found in the ocean. A value for whole tires with a full degradation time of 90 years was found by Afrin et al. [51]. In a different experiment, vulcanized rubbers were subjected to different strains of fungi. Andler et al. reported a maximum degradation rate of 7.5% in four weeks [52]. As those values differed heavily and did not account for ELT in marine environments, the values for degradation from the newer work of Corella-Puertas for 5000 µm and 1000 µm spherical TWRP microbeads with slow, medium, and fast degradation times were investigated as well [18]. By investigating Figure 5, one quickly realizes that the CFs vary over circa two ranges of magnitude for both rubbers. This is an amount of uncertainty comparable to those of toxicity-related midpoint categories as those often feature even large levels of uncertainty. It is apparent that the sedimentation rate is the dominant factor as its values are often much higher than for the environmental degradation, once again proving plastic’s longevity in the environment.

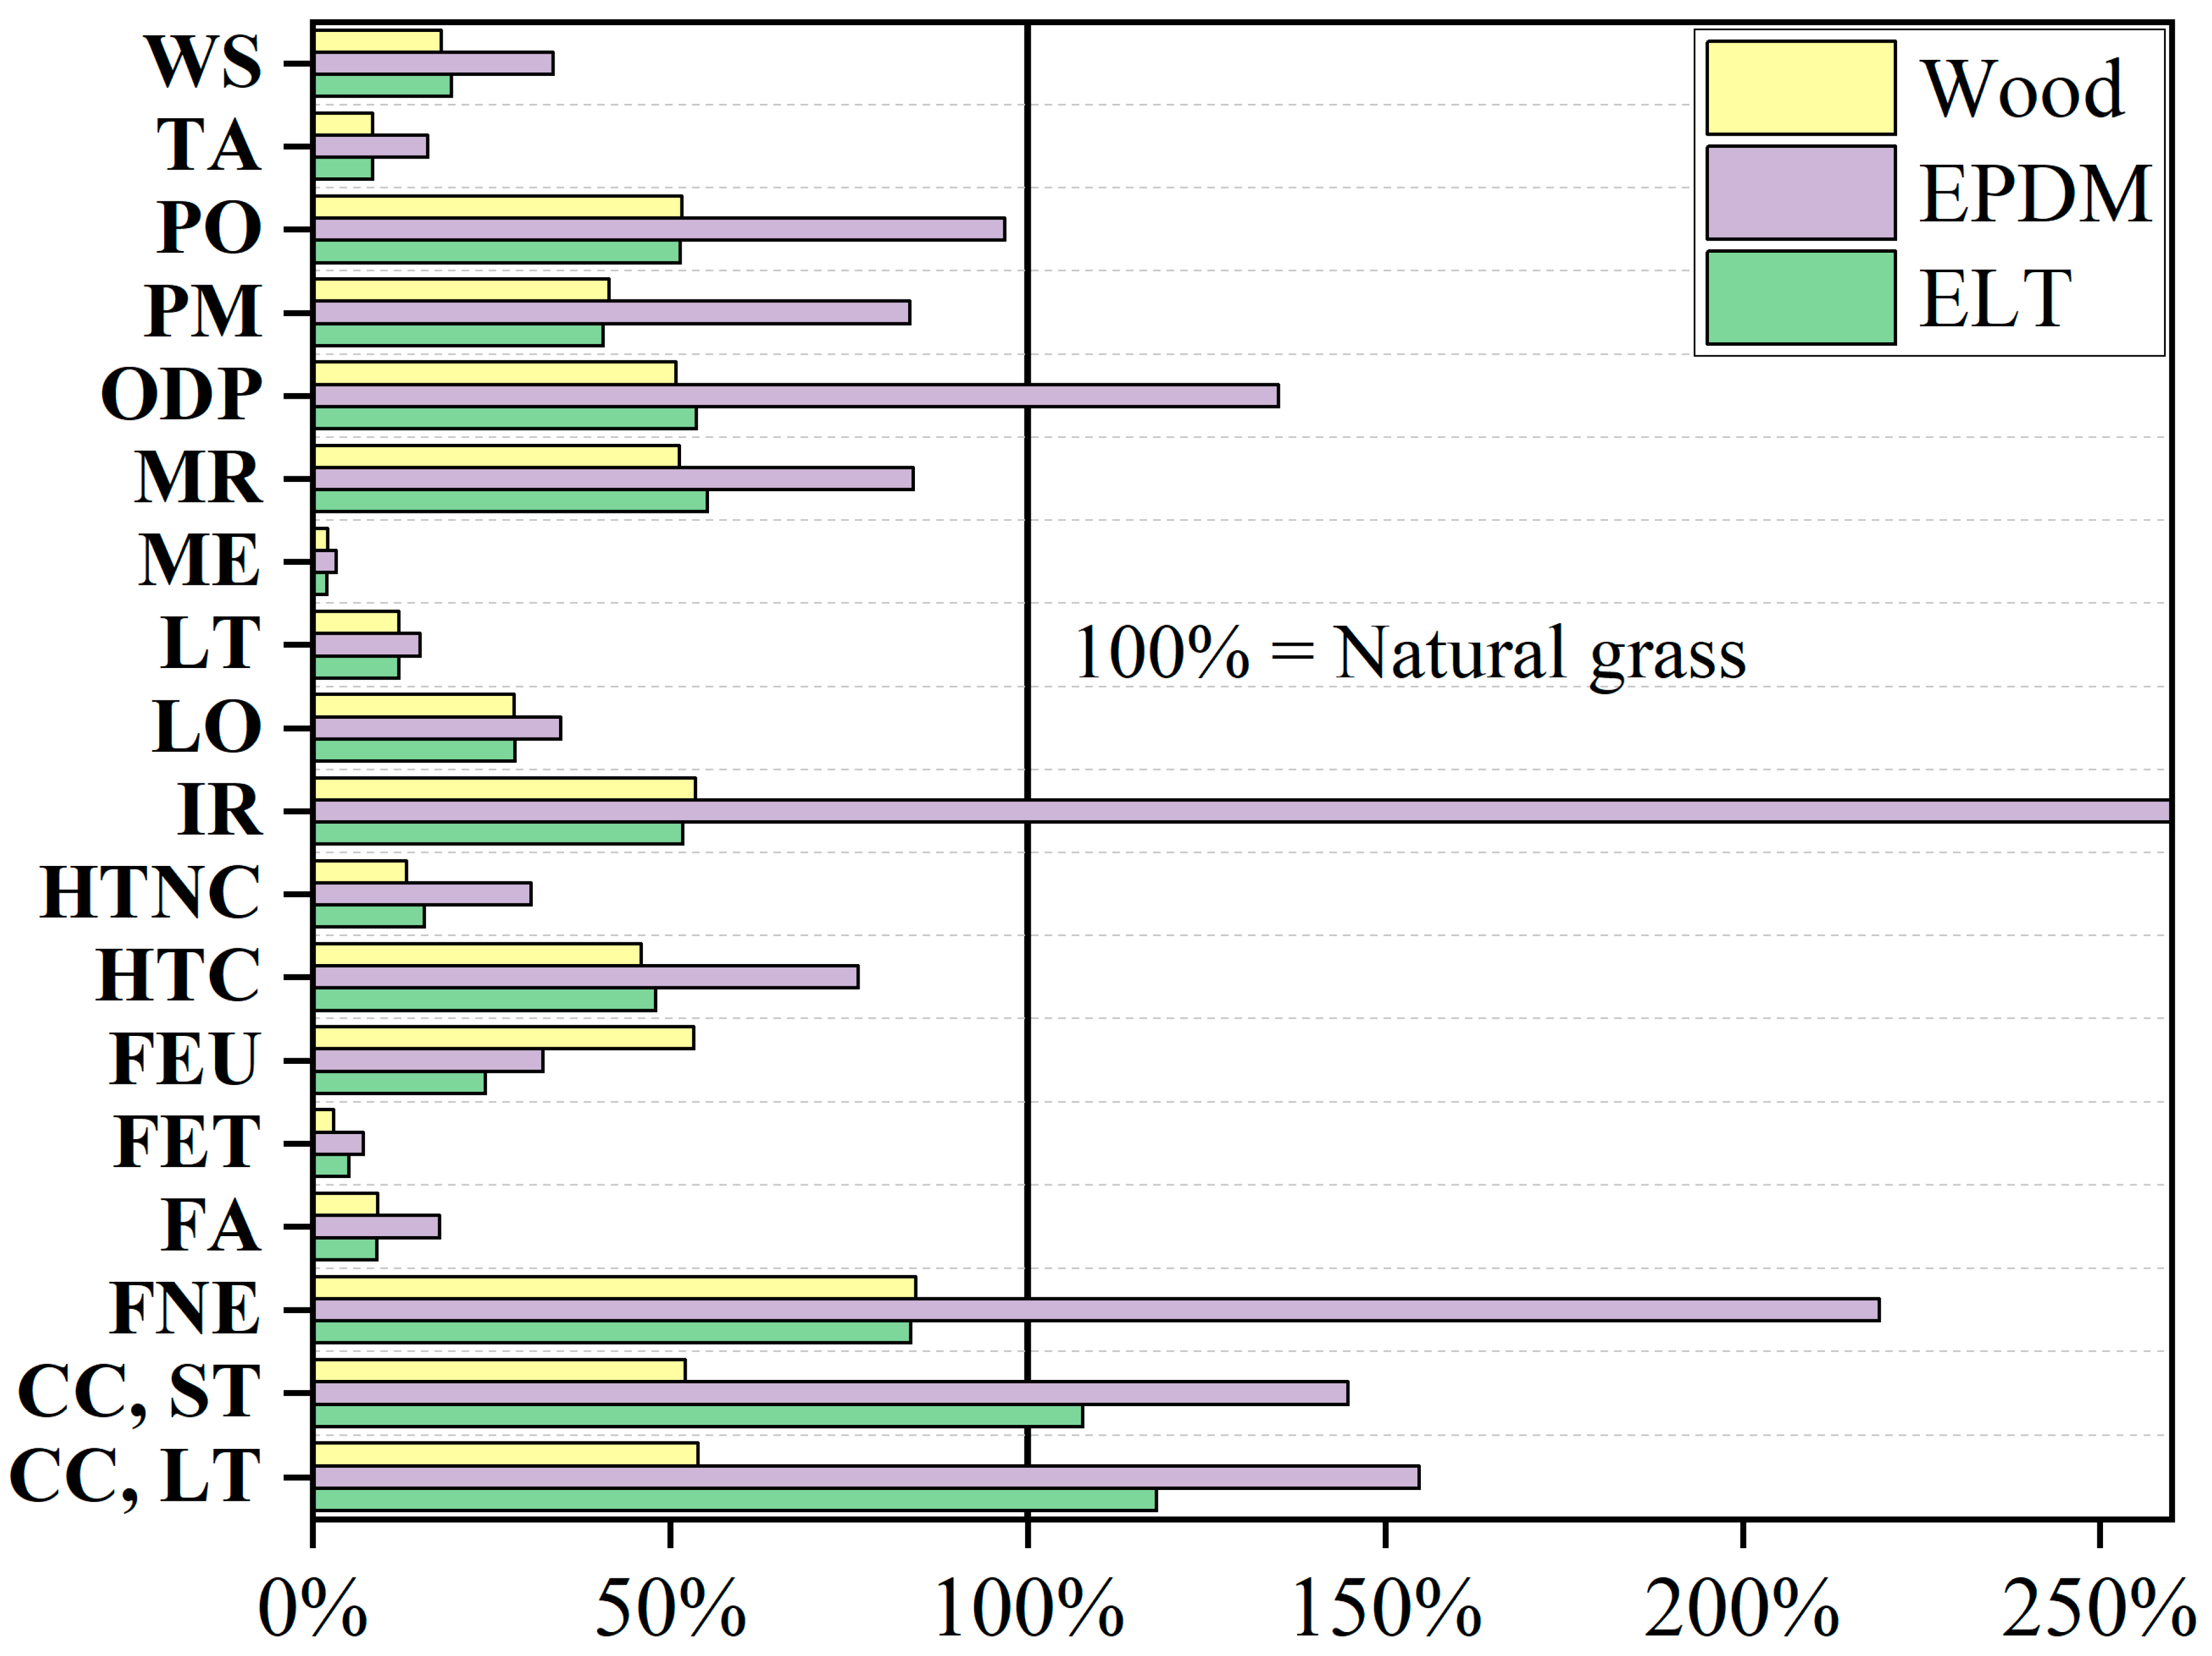
4.3. LCIA at the Midpoint Level

Normalized results for the different pitches are presented in Figure 2. It is apparent that for the ATs, EPDM shows the highest impact for all categories except for freshwater eutrophication. As over the pitches’ lifetime, over 200 t of infill must be produced and treated at their EoLs by incineration, this number is reflected in the LCIA results for EPDM. ELT come burden-free—their production impacts are barely of importance as only the shredding of tires is accounted for. The LCI data for the shredding of tires are in line with values presented in a recent work on the topic [53]. The same work by Maga et al. additionally stresses the fact that ELT represent a growing waste fraction, with a significant percentage being landfilled or only thermally recovered. This justifies the zero-burden approach as the flow can currently be seen as a burden and not as a sought-after fraction with a high market value. The production of the wood-based infill also features comparably low impacts as opposed to virgin rubber production. Due to the bio-based material, the impact on CC is the lowest for the wood-based infill, followed by ELT and EPDM. ELT already have a higher impact than NT due to the high carbon intensity of the thermal valorization of rubber at the end of its lifetime. These findings are in line with other studies and allow for the conclusion of bio-based infill being preferable to polymeric infills, for which recycled input is preferable over virgin materials [25,27,28,54]. For most categories, the results are relatively equal between ELT and the wood-based infill. The same is true for the two infills compared with natural grass once the absolute results are discussed. This discrepancy comes from the design of the functional unit of 1 h, as the NT can only be used for 800 h/a compared to 1600 h/a for the AT. The full results for each midpoint category and the life cycle stages’ influence are presented in the Supporting Information File S1 and Table S3.

4.4. Microplastics and Ecosystem Damage

Using the characterization factors obtained, the damage from 1 h of playing football in the form of physical effects on biota was calculated, as shown in Figure 3. Naturally, the highest damage is recorded for the worst-case scenarios as the highest mass of MPs is released. The opposite is true for the best-case scenarios. The next step was to utilize these findings to calculate the endpoint damage to ecosystem quality. Using Excel, the mean values for the different scenarios were added to the results for the calculation of endpoint damages, as presented in Figure 4. The underlying data are presented in Supporting Information Table S4. The contribution of MPs (physical effects on biota) is hardly visible, which is confirmed by the numbers. Only the two “worst” cases contribute 0.01% to the final result; the others contribute even less. For natural grass, the enormous contribution of aluminum III to freshwater ecotoxicity stands out. The influence of aluminum III results in a value that is more than ten times higher for natural grass than for any of the benchmarks. The percentual share of the aluminum flow to the total result is well over 99%. The flow for aluminum comes from the ecoinvent dataset of the “treatment of inert waste, sanitary landfill”. While patents suggest evidence that aluminum can be found in shock pads for sports fields, it is questionable if this is the case for all and if the material would really enter the groundwater [55,56]. This discussion aside, it is obvious that the PEBs of MPs play no decisive role in any of the case studies for the results for the endpoint of ecosystem damage. Aside from toxicity, climate change also has a sizeable influence on ecosystem damage, which is in line with the original results of the framework [17,18].

4.5. Sensitivity Analysis

4.5.1. CFs

The CFs developed for ELT and EPDM in this work were compared with the work of Corella-Puertas et al.; see Figure 5. [18].The results obtained show similar geometric standard deviations and CFs within a comparable range. Naturally, a higher degradation rate leads to reduced impacts. As in the original work, other popular polymer types were investigated, and it was decided to use those CFs for a sensitivity analysis. Keeping in mind that the artificial grass fibers themselves are mostly made from a complex mixture of several polymers, including PP, PE, PA, and latex, depending on the author [25,27,28], this results in an excellent sensitivity analysis. Bertling estimated that 50–1000 kg of these fibers may be removed from a pitch per year, amounting to 4500–30,000 kg over the entire lifetime of the pitch. [26] Considering that in the worst-case scenario, 9753 kg of infill is assumed to enter maritime waterways, a simple sensitivity analysis can be achieved if another CF is used for this amount. As a proxy for LLDPE, the material of choice for the fibers, the CF for LDPE [57] from Corella-Puertas’ work, with a microplastic film fragment of 100 µm, was used, which amounted to 7.86 PDF * m2 * year/kg emitted. It was assumed that all the MP emissions are not from the infill but from the fibers, a material likely to have a much higher CF [18]. The results are presented in Table 4. The percentual contributions of PEBs greatly improved on a relative scale but stayed around 1% in the worst cases and were much lower in the others.
Upon conducting a comparison, one realizes that the CFs for physical effects on biota for rubbers are rather low. The highest CF (endpoint) for EPDM found in this work was 0.11, and for ELT, it was 0.17, whereas for LDPE, 7.86 PDF * m2 * year/kg was recorded. These values are still low compared to other substances which are known to have high ecotoxicity. For example, aluminum III to water has an impact of 2366, ammonia to air has an impact of 48.6, an iron ion in water has an impact of 93.7, and a copper ion to water has an impact of 5475.3 PDF * m2 * year/kg. These results are not only valid for metal ions; also, 1 kg of CO2 yields 0.628 PDF * m2 * year/kg, while 1 kg of methane yields 6.36 PDF * m2 * year/kg. This leads to the conclusion that MPs breaking down underwater and releasing greenhouse gases has a higher impact on ecosystems than the physical effects on biota themselves, which was tested in the SA.

4.5.2. EoL Emissions

As stated in Section 2 and Section 4, the life cycle of MPs does not end in the marine environment. Eventually, they will be converted into GHGs. In fact, Ford et al. recently pointed out that both issues are often treated in an isolated manner when they are closely linked in reality [58]. Therefore, we set out to enhance the LCA system boundary in the endpoint analysis by comparing the EoL values of the infills to reach a verdict as to whether the impact of PEBs or the climate change impact due to the conversion of MP’s carbon has a greater impact on ecosystem quality. Results for the quantification of GHGs emitted by MPs are scarce. The California Department of Transportation recently compiled a number of peer-reviewed studies and found highly skewed values [43,59,60,61]. Numbers ranged from 2.4 kg CO2-eq./kg MP for polyamide (Nylon) to over 3.5 kg CO2-eq/kg MP for polypropylene and up to 30.3 kg CO2-eq/kg MP for polyethylene terephthalate. However, as some studies did not account for important parameters such as CO2, CH4, or dissolved organic carbon, we decided to test three values without those limitations. These were 3.5, 9.3, and 22.2 kg CO2-eq./kg MP, respectively, for polypropylene, low-density polyethylene, and high-density-polyethylene. Unfortunately, no data for rubbers were available. Another paper by Zhao et al. reports low numbers such as 0.0126 kg CO2-eq/kg MP for fragments, providing a stark contrast [62]. The same is true for the wood-based infill as the degradation of wood in the sea is not well quantified yet. An elemental analysis of birch wood samples revealed that 49.39% of their total mass was from carbon and 6.39% was from hydrogen [63]. If we assume for the sake of simplicity that the remainder, 44.22%, is oxygen, we find that carbon contributes 31.1% to the molar composition. This means that if we assume that for the worst-case scenario, every carbon atom turns into methane, 0.659 kg CH4/kg wood is emitted. Using the endpoint CFs for short-term CC and long-term CC for CO2 and methane, non-fossil, the implications for the endpoint analysis in terms of ecosystem damage were evaluated, as shown in Figure 6.
Evidently, the EoL of the different infill types did not show a significant influence on ecosystem damage. For the wood-based infill, the final score is changed by 1.08% in an alleged scenario in which 10.91% of all infill material ends up in the ocean and every carbon atom is converted into methane, a gas with a much higher CF for both CC and ecosystem damage in comparison to CO2. This presents an interesting result as even with a worst-case assumption, the total infill impact remains negligible. The results for the two fossil infill types showed a similar trend, albeit on a higher level. For ELT, an increase of 2.52% was recorded when using the highest CF for MP degradation in the sea. While ethylene and methane are potent greenhouse gases, a CF of around 30 kg CO2-eq./kg MP in the ocean still seems rather high, considering that most plastics emit around 3 kg CO2-eq./kg upon incineration. Both the biobased and fossil infill types had only a minimal amount of experimental data available to derive CFs, therefore emphasizing the need for further research. The need to account for woody biomass in global carbon accounting has been acknowledged before in the literature [64]. Nonetheless, including the EoL within the SB corrected the results in such a way that the scenarios with the highest level of infill emissions (worst) now have a higher impact than the ones with lower emissions, which was due to the omission of EoL modeling at first.

4.6. The Limitations of This Study

As previously discussed, the lack of primary data for Norwegian pitches can be considered a weakness. Moreover, the omission of transport processes to provide a generic model could be considered a weakness too. A bigger limitation, nonetheless, is the treatment for the EoL stage of all infills entering the ocean. While a breakdown into carbon dioxide, methane, and other GHGs appears probable for both bio-based and fossil infills, experimental data remain scarce. This is why the analysis was shifted to a sensitivity analysis. The same is true for other damage vectors of MPs other than PEBs, such as chemical leaching, wwhich are still under development currently. Moreover, the usage of generic factors in the MarILCA framework remains a weakness as specific data for the polymeric material in question were largely unavailable.

5. Conclusions and Outlook

While the studies’ results are comparatively balanced for some midpoint categories, such as climate change or nuclear and fossil energy use, others strongly favor synthetic turf pitches over natural turf. Examples are acidification- and eutrophication-related results, which is a recurring finding in LCAs dealing with the comparison of fossil resources and biomass-based alternatives [65,66,67]. The same is true for land occupation and transformation; however, one must not forget that the higher number of playing hours per year (1600 for ATs vs. 800 for NTs) accounts for smaller results for the artificial turfs per hour. Often, the results for wood or ELT infill are approximately only half of the results for natural grass, for example, mineral resource depletion or photochemical oxidant formation, showcasing the many similarities between the different LCIs. In all midpoint categories investigated, the lowest results were achieved by either the wood-based infill or ELT. It is no surprise that ELT achieve better results than EPDM because the production of ELT is relatively simple. Moreover, the ELT case profits heavily from the “cut-off” approach used as no burdens are assigned to the scrap tires used as an input stream. However, unlike other authors, no credits or savings achieved via an avoided burden were awarded as in, e.g., Russo et al. [25]. The results for the wood-based infill, which account for the whole life cycle, show that the bio-based alternative is almost always preferable over a virgin polymer material such as EPDM.
In the second part of this study, the methodology for assessing the impact of MPs on ecosystems developed by Corella-Puertas et al. was used to determine if possible improvements in plastic infill come at the cost of negative environmental impacts on aquatic life [17,18]. As it turns out, rubbers such as ELT or EPDM showed much lower CFs than polyolefins such as PP, PE, or (E)PS per kg MP emitted, leading to negligible scores on the total impact on ecosystem quality. As the method currently only applies to “physical effects on biota”, important damage vectors are not included. Therefore, the results are likely to underestimate actual damage as potential toxicological harm from plasticizers, degradation products, or toxicological substances in microplastics have not yet been accounted for. Accurate testing is especially relevant for EPDM and ELT because they are not specific types of polymers such as PET or PP; in fact, they are umbrella terms for a wide array of substances with different chemical compositions. Missing scientific data/consensus from the field is a tremendous issue, particularly with ELT as 90% of all AT pitches use this material; e.g., Mohajerani et al. and Armada et al. highlight that the rubber contains toxic organic substances and metals which are known to leak, whereas Grynkiewicz-Bylina et al. pointed out that at a neutral pH, no toxic leachates were observed [68,69,70]. Although there are studies that show no acute toxicity to aquatic species, those studies also remark that their results are preliminary, need further validation, and may not represent real aquatic conditions, a conclusion that is also drawn in the review by Burns and Boxall [71,72,73]. A review by Massey et al, also concluded that ELT exhibit higher concentrations of potentially harmful chemicals; however, the authors stress that there is no single best solution as some plant-based materials cause respiratory problems in humans. However, they also consider organically treated natural grass a good solution to eliminate artificial turf and the problems related to infill and the turf itself [74].
A sensitivity analysis was performed using the higher CF for LDPE instead of the rubber CFs to account for the simplification of fibers not being included in the analysis. The PEBs of MPs contributed approximately 1% in the worst-case scenario, exhibiting a minor contribution.
In the second step of the SA, the impact on CC was quantified for both infill types and then further transformed into endpoint damage to ecosystems. Using a worst-case scenario of every carbon atom in the wood-based infill turning into methane, which was deemed highly unlikely, the total score was increased by 1% by including the infill’s EoL. For the polymeric materials, generic values from the literature were used, producing results which were negligible; an increase of up to 2.5% for comparably high CFs of over 22 kg CO2-eq./kg MP emitted was recorded in the worst case.
In terms of GHG emission mitigation, the wood-based infill proved to be favorable compared to natural turf and virgin infills in this anticipatory LCA. To mitigate ecosystem damage, the wood-based infill remained the superior option. Disregarding the debate about MP and infills, there are several ways to reduce environmental impacts independently. Numerous midpoint categories are influenced by the diesel used in machinery, such as lawnmowers, or construction-based processes that utilize heavier machinery, such as asphalt or gravel production. The same is true for fertilizers and chemical agents for the maintenance of pitches, where a reduction could result in improved environmental impacts for the natural grass.
While the literature suggests that the public’s knowledge about MPs is rather low, studies also show that once educated, the majority of people becomes worried, see MPs as a serious threat, and want to change their behavior to align with a more sustainable route, even though science suggests the opposite at the moment [75,76,77,78,79]. During our work, a survey was conducted, revealing that the majority of the management and staff of football associations in Norway, Scotland, and Portugal deem sustainability to be “very relevant” or “somewhat relevant” [80]. Ultimately, as new research on the toxicity of MPs surfaces frequently, a cautious course should be maintained until all the consequences of MPs in the environment are well understood [81].

Supplementary Materials

The following supporting information can be downloaded at https://www.mdpi.com/article/10.3390/su16083487/s1, Figure S11: An image of GOE-Ip AS infill made from birch wood; Table S1: Details on the LCI for the pitches and infills used, the number of MPs released, as well as data regarding the components’ lifetimes; Table S2: Details for the calculation of the CFs for midpoint and endpoint damage for physical effects on biota.; File S1: Charts and discussions of the results at the midpoint level.; Table S3: The data behind File S1; Table S4: The data used in Figure 4. Table S5: Calculations for the infill’s EoL pathways and the resulting ecosystem damage. References [25,27,28,54,55,56,82,83,84] are cited in the supplementary materials.

Author Contributions

Conceptualization, L.Z.; methodology, L.Z.; formal analysis, L.Z. and P.F.; investigation, A.R., T.M. and E.G.; data curation, L.Z., P.F. and M.K.; writing—original draft preparation, L.Z.; writing—review and editing, J.L., C.P. and J.F.; visualization, L.Z.; supervision, C.P. and J.F.; project administration, J.L.; funding acquisition, J.L. All authors have read and agreed to the published version of the manuscript.

Funding

This work has received funding from the European Union’s Erasmus+ Program under grant agreement number 622646-EPP-1-2020-1-ES-SPO-SCP, “SDG STRIKER—Scoring Goals for Sustainability”.

Institutional Review Board Statement

Not applicable.

Informed Consent Statement

Not applicable.

Data Availability Statement

The original contributions presented in the study are included in the article/Supplementary Material; further inquiries can be directed to the corresponding author(s).

Acknowledgments

The authors would like to thank all direct and indirect contributors to this work, including the association Energieinstitut an der Johannes Kepler Universität Linz, the support by Johannes Kepler Open Access Publishing Fund, and the federal state of Upper Austria. The authors are also grateful to all the reviewers who helped to improve the quality of the article.

Conflicts of Interest

Authors Asle Ravnås, Trygve Maldal, Eimund Gilje were employed by the company GOE-Ip Production AS. The remaining authors declare that the research was conducted in the absence of any commercial or financial relationships that could be construed as a potential conflict of interest.

References

  1. International Organisation for Standardization (ISO). Definitions of Key Terms for Plastic Pollution; ISO: Geneva, Switzerland, 2023. [Google Scholar]
  2. Dauvergne, P. Why Is the Global Governance of Plastic Failing the Oceans? Glob. Environ. Change 2018, 51, 22–31. [Google Scholar] [CrossRef]
  3. Thushari, G.G.N.; Senevirathna, J.D.M. Plastic Pollution in the Marine Environment. Heliyon 2020, 6, e04709. [Google Scholar] [CrossRef] [PubMed]
  4. Isobe, A.; Uchiyama-Matsumoto, K.; Uchida, K.; Tokai, T. Microplastics in the Southern Ocean. Mar. Pollut. Bull. 2017, 114, 623–626. [Google Scholar] [CrossRef]
  5. Andrady, A.L. The Plastic in Microplastics: A Review. Mar. Pollut. Bull. 2017, 119, 12–22. [Google Scholar] [CrossRef]
  6. Materić, D.; Ludewig, E.; Brunner, D.; Röckmann, T.; Holzinger, R. Nanoplastics Transport to the Remote, High-Altitude Alps. Environ. Pollut. 2021, 288, 117697. [Google Scholar] [CrossRef] [PubMed]
  7. Xiao, S.; Cui, Y.; Brahney, J.; Mahowald, N.M.; Li, Q. Long-Distance Atmospheric Transport of Microplastic Fibres Influenced by Their Shapes. Nat. Geosci. 2023, 16, 863–870. [Google Scholar] [CrossRef]
  8. Alimba, C.G.; Faggio, C. Microplastics in the Marine Environment: Current Trends in Environmental Pollution and Mechanisms of Toxicological Profile. Environ. Toxicol. Pharmacol. 2019, 68, 61–74. [Google Scholar] [CrossRef] [PubMed]
  9. Huang, W.; Song, B.; Liang, J.; Niu, Q.; Zeng, G.; Shen, M.; Deng, J.; Luo, Y.; Wen, X.; Zhang, Y. Microplastics and Associated Contaminants in the Aquatic Environment: A Review on Their Ecotoxicological Effects, Trophic Transfer, and Potential Impacts to Human Health. J. Hazard. Mater. 2021, 405, 124187. [Google Scholar] [CrossRef]
  10. Lehtiniemi, M.; Hartikainen, S.; Näkki, P.; Engström-Öst, J.; Koistinen, A.; Setälä, O. Size Matters More than Shape: Ingestion of Primary and Secondary Microplastics by Small Predators. Food Webs 2018, 17, e00097. [Google Scholar] [CrossRef]
  11. Korez, Š.; Gutow, L.; Saborowski, R. Feeding and Digestion of the Marine Isopod Idotea Emarginata Challenged by Poor Food Quality and Microplastics. Comp. Biochem. Physiol. Part C Toxicol. Pharmacol. 2019, 226, 108586. [Google Scholar] [CrossRef] [PubMed]
  12. Joppien, M.; Westphal, H.; Stuhr, M.; Doo, S.S. Microplastics Alter Feeding Strategies of a Coral Reef Organism. Limnol. Oceanogr. Lett. 2022, 7, 131–139. [Google Scholar] [CrossRef]
  13. Sonnemann, G.; Valdivia, S. Medellin Declaration on Marine Litter in Life Cycle Assessment and Management: Facilitated by the Forum for Sustainability through Life Cycle Innovation (FSLCI) in Close Cooperation with La Red Iberoamericana de Ciclo de Vida (RICV) on Wednesday 14 of June 2017. Int. J. Life Cycle Assess 2017, 22, 1637–1639. [Google Scholar] [CrossRef]
  14. Woods, J.S.; Verones, F.; Jolliet, O.; Vázquez-Rowe, I.; Boulay, A.-M. A Framework for the Assessment of Marine Litter Impacts in Life Cycle Impact Assessment. Ecol. Indic. 2021, 129, 107918. [Google Scholar] [CrossRef]
  15. Fantke, P.; Bijster, M.; Hauschild, M.Z.; Huijbregts, M.; Jolliet, O.; Kounina, A.; Magaud, V.; Margni, M.; McKone, T.E.; Rosenbaum, R.K.; et al. USEtox® 2.0 Documentation, version 1.00; Technical University of Denmark: Kongens Lyngby, Denmark, 2017. [Google Scholar] [CrossRef]
  16. Lavoie, J.; Boulay, A.; Bulle, C. Aquatic Micro- and Nano-plastics in Life Cycle Assessment: Development of an Effect Factor for the Quantification of Their Physical Impact on Biota. J. Ind. Ecol. 2021, 26, 2123–2135. [Google Scholar] [CrossRef]
  17. Corella-Puertas, E.; Guieu, P.; Aufoujal, A.; Bulle, C.; Boulay, A. Development of Simplified Characterization Factors for the Assessment of Expanded Polystyrene and Tire Wear Microplastic Emissions Applied in a Food Container Life Cycle Assessment. J. Ind. Ecol. 2022, 26, 1882–1894. [Google Scholar] [CrossRef]
  18. Corella-Puertas, E.; Hajjar, C.; Lavoie, J.; Boulay, A.-M. MarILCA Characterization Factors for Microplastic Impacts in Life Cycle Assessment: Physical Effects on Biota from Emissions to Aquatic Environments. J. Clean. Prod. 2023, 418, 138197. [Google Scholar] [CrossRef]
  19. Owsianiak, M.; Hauschild, M.Z.; Posthuma, L.; Saouter, E.; Vijver, M.G.; Backhaus, T.; Douziech, M.; Schlekat, T.; Fantke, P. Ecotoxicity Characterization of Chemicals: Global Recommendations and Implementation in USEtox. Chemosphere 2023, 310, 136807. [Google Scholar] [CrossRef] [PubMed]
  20. Hajjar, C.; Bulle, C.; Boulay, A.-M. Life Cycle Impact Assessment Framework for Assessing Physical Effects on Biota of Marine Microplastics Emissions. Int. J. Life Cycle Assess 2023, 29, 25–45. [Google Scholar] [CrossRef]
  21. European Chemical Agency Microplastics—ECHA. Available online: https://echa.europa.eu/hot-topics/microplastics (accessed on 1 March 2023).
  22. Committee for Risk Assessment (RAC); Committee for Socio-Economic Analysis (SEAC). Opinion on an Annex XV Dossier Proposing Restrictions on Intentionally-Added Microplastics; ECHA: Helsinki, Finland, 2020. [Google Scholar]
  23. UEFA.com UEFA HatTrick Development Programme|Inside UEFA. Available online: https://www.uefa.com/insideuefa/football-development/hattrick/ (accessed on 1 March 2023).
  24. Q&A Restriction to Intentionally Added Microplastics. Available online: https://ec.europa.eu/commission/presscorner/detail/en/qanda_23_4602 (accessed on 3 December 2023).
  25. Russo, C.; Cappelletti, G.M.; Nicoletti, G.M. The Product Environmental Footprint Approach to Compare the Environmental Performances of Artificial and Natural Turf. Environ. Impact Assess. Rev. 2022, 95, 106800. [Google Scholar] [CrossRef]
  26. Bertling, J.; Dresen, B.; Bertling, R.; Aryan, V.; Weber, T. Kunstrasenplätze—Systemanalyse unter Berücksichtigung von Mikroplastik- und Treibhausgasemissionen, Recycling, Standorten und Standards, Kosten sowie Spielermeinungen; Springer: Berlin/Heidelberg, Germany, 2021; p. 141. [Google Scholar] [CrossRef]
  27. Itten, R.; Glauser, L.; Stucki, M. Ökobilanzierung von Rasensportfeldern: Natur-, Kunststoff-und Hybridrasen der Stadt Zürich im Vergleich; Zürcher Hochschule für angewandte Wissenschaften, ZHAW: Wädenswil, Switzerland, 2020; p. 124. [Google Scholar]
  28. Magnusson, S.; Mácsik, J. Analysis of Energy Use and Emissions of Greenhouse Gases, Metals and Organic Substances from Construction Materials Used for Artificial Turf. Resour. Conserv. Recycl. 2017, 122, 362–372. [Google Scholar] [CrossRef]
  29. Wender, B.A.; Foley, R.W.; Hottle, T.A.; Sadowski, J.; Prado-Lopez, V.; Eisenberg, D.A.; Laurin, L.; Seager, T.P. Anticipatory Life-Cycle Assessment for Responsible Research and Innovation. J. Responsible Innov. 2014, 1, 200–207. [Google Scholar] [CrossRef]
  30. ISO 14044:2006; Environmental Management—Life Cycle Assessment—Requirements and Guidelines. ISO: Geneva, Switzerland, 2006.
  31. Bø, S.M.; Bohne, R.A.; Aas, B.; Hansen, L.M. Material Flow Analysis for Norway’s Artificial Turfs. IOP Conf. Ser. Earth Environ. Sci. 2020, 588, 042068. [Google Scholar] [CrossRef]
  32. GOE Bio Granulat|GOE Production. Available online: https://www.goe-production.no (accessed on 25 August 2023).
  33. Johansson, K. Life Cycle Assessment of Two End-of-Life Tyre Applications: Artificial Turfs and Asphalt Rubber; Ragn-Sells Däckåtervinning AB: Landskrona, Sweden, 2018. [Google Scholar]
  34. Regnell, F. Dispersal of Microplastic from a Modern Artificial Turf Pitch with Preventive Measures. Kalmar, Sweden, 2019. Available online: https://www.genan.eu/wp-content/uploads/2020/02/MP-dispersal-from-Bergavik-IP-Kalmar-Report.pdf (accessed on 7 April 2023).
  35. Weijer, A.; Knol, J.; Hofstra, U. Verspreiding van Infill en Indicatieve Massabalans; Sweco Nederland B.V.: Rotterdam, The Netherlands; Utrecht, The Netheralands; Amsterdam, The Netherlands; The Hague, The Netheralands, 2017. [Google Scholar]
  36. Løkkegard, H.; Malmgren-Hansen, B.; Nilsson, N.H. Mass Balance of Rubber Granulate Lost from Artificial Turf Fields, Focusing on Discharge to the Aquatic Environment; Danish Technological Institute (DTI): Aarhus, Denmark, 2019. [Google Scholar]
  37. Wernet, G.; Bauer, C.; Steubing, B.; Reinhard, J.; Moreno-Ruiz, E.; Weidema, B. The Ecoinvent Database Version 3 (Part I): Overview and Methodology. Int. J. Life Cycle Assess 2016, 21, 1218–1230. [Google Scholar] [CrossRef]
  38. Bulle, C.; Margni, M.; Patouillard, L.; Boulay, A.-M.; Bourgault, G.; De Bruille, V.; Cao, V.; Hauschild, M.; Henderson, A.; Humbert, S.; et al. IMPACT World+: A Globally Regionalized Life Cycle Impact Assessment Method. Int. J. Life Cycle Assess 2019, 24, 1653–1674. [Google Scholar] [CrossRef]
  39. Maga, D.; Galafton, C.; Blömer, J.; Thonemann, N.; Özdamar, A.; Bertling, J. Methodology to Address Potential Impacts of Plastic Emissions in Life Cycle Assessment. Int. J. Life Cycle Assess 2022, 27, 469–491. [Google Scholar] [CrossRef]
  40. Chamas, A.; Moon, H.; Zheng, J.; Qiu, Y.; Tabassum, T.; Jang, J.H.; Abu-Omar, M.; Scott, S.L.; Suh, S. Degradation Rates of Plastics in the Environment. ACS Sustain. Chem. Eng. 2020, 8, 3494–3511. [Google Scholar] [CrossRef]
  41. Kida, M.; Ziembowicz, S.; Koszelnik, P. CH4 and CO2 Emissions from the Decomposition of Microplastics in the Bottom Sediment—Preliminary Studies. Environments 2022, 9, 91. [Google Scholar] [CrossRef]
  42. Kida, M.; Ziembowicz, S.; Koszelnik, P. Decomposition of Microplastics: Emission of Harmful Substances and Greenhouse Gases in the Environment. J. Environ. Chem. Eng. 2023, 11, 109047. [Google Scholar] [CrossRef]
  43. Royer, S.-J.; Ferrón, S.; Wilson, S.T.; Karl, D.M. Production of Methane and Ethylene from Plastic in the Environment. PLoS ONE 2018, 13, e0200574. [Google Scholar] [CrossRef]
  44. Wang, S.; Zhou, Q.; Hu, X.; Tao, Z. Polyethylene Microplastic-Induced Microbial Shifts Affected Greenhouse Gas Emissions during Litter Decomposition in Coastal Wetland Sediments. Water Res. 2024, 251, 121167. [Google Scholar] [CrossRef]
  45. Shen, M.; Huang, W.; Chen, M.; Song, B.; Zeng, G.; Zhang, Y. (Micro)Plastic Crisis: Un-Ignorable Contribution to Global Greenhouse Gas Emissions and Climate Change. J. Clean. Prod. 2020, 254, 120138. [Google Scholar] [CrossRef]
  46. Fleming, P.R.; Forrester, S.E.; McLaren, N.J. Understanding the Effects of Decompaction Maintenance on the Infill State and Play Performance of Third-Generation Artificial Grass Pitches. Proc. Inst. Mech. Eng. Part P J. Sports Eng. Technol. 2015, 229, 169–182. [Google Scholar] [CrossRef] [PubMed]
  47. Verschoor, A.J.; van Gelderen, A.; Hofstra, U. Fate of Recycled Tyre Granulate Used on Artificial Turf. Environ. Sci. Eur. 2021, 33, 27. [Google Scholar] [CrossRef]
  48. Nations Encyclopedia Norway. Available online: https://www.nationsencyclopedia.com/economies/Europe/Norway.html (accessed on 9 December 2023).
  49. Nakamura, T.; Chaikumpollert, O.; Yamamoto, Y.; Ohtake, Y.; Kawahara, S. Degradation of EPDM Seal Used for Water Supplying System. Polym. Degrad. Stab. 2011, 96, 1236–1241. [Google Scholar] [CrossRef]
  50. Koelmans, A.A.; Kooi, M.; Law, K.L.; Van Sebille, E. All Is Not Lost: Deriving a Top-down Mass Budget of Plastic at Sea. Environ. Res. Lett. 2017, 12, 114028. [Google Scholar] [CrossRef]
  51. Afrin, H.; Huda, N.; Abbasi, R. Study on End-of-Life Tires (ELT) Recycling Strategy and Applications. IOP Conf. Ser. Mater. Sci. Eng. 2021, 1200, 012009. [Google Scholar] [CrossRef]
  52. Andler, R.; D’Afonseca, V.; Pino, J.; Valdés, C.; Salazar-Viedma, M. Assessing the Biodegradation of Vulcanised Rubber Particles by Fungi Using Genetic, Molecular and Surface Analysis. Front. Bioeng. Biotechnol. 2021, 9, 761510. [Google Scholar] [CrossRef]
  53. Maga, D.; Aryan, V.; Blömer, J. A Comparative Life Cycle Assessment of Tyre Recycling Using Pyrolysis Compared to Conventional End-of-Life Pathways. Resour. Conserv. Recycl. 2023, 199, 107255. [Google Scholar] [CrossRef]
  54. Bauer, B.; Egebæk, K.; Aare, A.K. Environmentally Friendly Substitute Products for Rubber Granulates as Infill for Artificial Turf Fields—Miljødirektoratet. Available online: https://www.miljodirektoratet.no/publikasjoner/2018/januar-2018/environmentally-friendly-substitute-products-for-rubber-granulates-as-infill-for-artificial-turf-fields/ (accessed on 25 August 2023).
  55. Emborg, M. Drainage Structure 2020. European Patent Office, EP3670743A1. Available online: https://patents.google.com/patent/EP3670743A1/en (accessed on 1 March 2023).
  56. Vries, L.D. Shock Pad for Artificial Sports Fields. U.S. Patent Application No. 17/295,374, 20 November 2019. [Google Scholar]
  57. Sandkuehler, P.; Torres, E.; Allgeuer, T. Performance Artificial Turf Components—Fibrillated Tape. Procedia Eng. 2010, 2, 3367–3372. [Google Scholar] [CrossRef]
  58. Ford, H.V.; Jones, N.H.; Davies, A.J.; Godley, B.J.; Jambeck, J.R.; Napper, I.E.; Suckling, C.C.; Williams, G.J.; Woodall, L.C.; Koldewey, H.J. The Fundamental Links between Climate Change and Marine Plastic Pollution. Sci. Total Environ. 2022, 806, 150392. [Google Scholar] [CrossRef]
  59. California Department of Transportation. Greenhouse Gas Emissions Arising from Microplastics Pollution; California Department of Transportation: Sacramento, CA, USA, 2023.
  60. Chen, Y.; Gao, B.; Yang, Y.; Pan, Z.; Liu, J.; Sun, K.; Xing, B. Tracking Microplastics Biodegradation through CO2 Emission: Role of Photoaging and Mineral Addition. J. Hazard. Mater. 2022, 439, 129615. [Google Scholar] [CrossRef]
  61. Zhu, L.; Zhao, S.; Bittar, T.B.; Stubbins, A.; Li, D. Photochemical Dissolution of Buoyant Microplastics to Dissolved Organic Carbon: Rates and Microbial Impacts. J. Hazard. Mater. 2020, 383, 121065. [Google Scholar] [CrossRef] [PubMed]
  62. Zhao, X.; You, F. Life Cycle Assessment of Microplastics Reveals Their Greater Environmental Hazards than Mismanaged Polymer Waste Losses. Environ. Sci. Technol. 2022, 56, 11780–11797. [Google Scholar] [CrossRef] [PubMed]
  63. Lachowicz, H.; Sajdak, M.; Paschalis-Jakubowicz, P.; Cichy, W.; Wojtan, R.; Witczak, M. The Influence of Location, Tree Age and Forest Habitat Type on Basic Fuel Properties of the Wood of the Silver Birch (Betula pendula Roth.) in Poland. Bioenergy Res. 2018, 11, 638–651. [Google Scholar] [CrossRef]
  64. Charles, F.; Garrigue, J.; Coston-Guarini, J.; Guarini, J.-M. Estimating the Integrated Degradation Rates of Woody Debris at the Scale of a Mediterranean Coastal Catchment. Sci. Total Environ. 2022, 815, 152810. [Google Scholar] [CrossRef] [PubMed]
  65. Belboom, S.; Léonard, A. Does Biobased Polymer Achieve Better Environmental Impacts than Fossil Polymer? Comparison of Fossil HDPE and Biobased HDPE Produced from Sugar Beet and Wheat. Biomass Bioenergy 2016, 85, 159–167. [Google Scholar] [CrossRef]
  66. Smidt, M.; Den Hollander, J.; Bosch, H.; Xiang, Y.; Van Der Graaf, M.; Lambin, A.; Duda, J. Life Cycle Assessment of Biobased and Fossil-Based Succinic Acid. In Sustainability Assessment of Renewables-Based Products; Dewulf, J., De Meester, S., Alvarenga, R.A.F., Eds.; Wiley: Hoboken, NJ, USA, 2015; pp. 307–321. ISBN 978-1-118-93394-7. [Google Scholar]
  67. Zeilerbauer, L.; Lindorfer, J.; Süss, R.; Kamm, B. Techno-economic and Life-cycle Assessment of a Wood Chips-based Organosolv Biorefinery Concept for Production of Lignin Monomers and Oligomers by Base-catalyzed Depolymerization. Biofuels Bioprod. Bioref. 2021, 16, 370–388. [Google Scholar] [CrossRef]
  68. Grynkiewicz-Bylina, B.; Rakwic, B.; Słomka-Słupik, B. Tests of Rubber Granules Used as Artificial Turf for Football Fields in Terms of Toxicity to Human Health and the Environment. Sci. Rep. 2022, 12, 6683. [Google Scholar] [CrossRef] [PubMed]
  69. Mohajerani, A.; Burnett, L.; Smith, J.V.; Markovski, S.; Rodwell, G.; Rahman, M.T.; Kurmus, H.; Mirzababaei, M.; Arulrajah, A.; Horpibulsuk, S.; et al. Recycling Waste Rubber Tyres in Construction Materials and Associated Environmental Considerations: A. Review. Resour. Conserv. Recycl. 2020, 155, 104679. [Google Scholar] [CrossRef]
  70. Armada, D.; Llompart, M.; Celeiro, M.; Garcia-Castro, P.; Ratola, N.; Dagnac, T.; de Boer, J. Global Evaluation of the Chemical Hazard of Recycled Tire Crumb Rubber Employed on Worldwide Synthetic Turf Football Pitches. Sci. Total Environ. 2022, 812, 152542. [Google Scholar] [CrossRef]
  71. Burns, E.E.; Boxall, A.B.A. Microplastics in the Aquatic Environment: Evidence for or against Adverse Impacts and Major Knowledge Gaps. Environ. Toxicol. Chem. 2018, 37, 2776–2796. [Google Scholar] [CrossRef] [PubMed]
  72. Carrasco-Navarro, V.; Nuutinen, A.; Sorvari, J.; Kukkonen, J.V.K. Toxicity of Tire Rubber Microplastics to Freshwater Sediment Organisms. Arch. Environ. Contam. Toxicol. 2022, 82, 180–190. [Google Scholar] [CrossRef] [PubMed]
  73. Magni, S.; Tediosi, E.; Maggioni, D.; Sbarberi, R.; Noé, F.; Rossetti, F.; Fornai, D.; Persici, V.; Neri, M.C. Ecological Impact of End-of-Life-Tire (ELT)-Derived Rubbers: Acute and Chronic Effects at Organism and Population Levels. Toxics 2022, 10, 201. [Google Scholar] [CrossRef]
  74. Massey, R.; Pollard, L.; Jacobs, M.; Onasch, J.; Harari, H. Artificial Turf Infill: A Comparative Assessment of Chemical Contents. New Solut. 2020, 30, 10–26. [Google Scholar] [CrossRef]
  75. Catarino, A.I.; Kramm, J.; Völker, C.; Henry, T.B.; Everaert, G. Risk Posed by Microplastics: Scientific Evidence and Public Perception. Curr. Opin. Green Sustain. Chem. 2021, 29, 100467. [Google Scholar] [CrossRef]
  76. Deng, L.; Cai, L.; Sun, F.; Li, G.; Che, Y. Public Attitudes towards Microplastics: Perceptions, Behaviors and Policy Implications. Resour. Conserv. Recycl. 2020, 163, 105096. [Google Scholar] [CrossRef]
  77. Dowarah, K.; Duarah, H.; Devipriya, S.P. A Preliminary Survey to Assess the Awareness, Attitudes/Behaviours, and Opinions Pertaining to Plastic and Microplastic Pollution among Students in India. Mar. Policy 2022, 144, 105220. [Google Scholar] [CrossRef]
  78. Garcia-Vazquez, E.; Garcia-Ael, C. The Invisible Enemy. Public Knowledge of Microplastics Is Needed to Face the Current Microplastics Crisis. Sustain. Prod. Consum. 2021, 28, 1076–1089. [Google Scholar] [CrossRef]
  79. Henderson, L.; Green, C. Making Sense of Microplastics? Public Understandings of Plastic Pollution. Mar. Pollut. Bull. 2020, 152, 110908. [Google Scholar] [CrossRef] [PubMed]
  80. Heigl, E.-M.; Knöbl, M.; Lindorfer, J.; Zeilerbauer, L. Practical Guideline to Incorporate and Communicate SDGs in the Sports Organisations; Norges Fotballforbund: Oslo, Norway, 2022. [Google Scholar]
  81. Brynzak-Schreiber, E.; Schögl, E.; Bapp, C.; Cseh, K.; Kopatz, V.; Jakupec, M.A.; Weber, A.; Lange, T.; Toca-Herrera, J.L.; del Favero, G.; et al. Microplastics Role in Cell Migration and Distribution during Cancer Cell Division. Chemosphere 2024, 353, 141463. [Google Scholar] [CrossRef] [PubMed]
  82. Alam, M.; Akram, D.; Sharmin, E.; Zafar, F.; Ahmad, S. Vegetable oil based eco-friendly coating materials: A review article. Arab. J. Chem. 2014, 7, 469–479. [Google Scholar] [CrossRef]
  83. Ifijen, I.H.; Maliki, M.; Odiachi, I.J.; Aghedo, O.N.; Ohiocheoya, E.B. Review on Solvents Based Alkyd Resins and Water Borne Alkyd Resins: Impacts of Modification on Their Coating Properties. Chem. Afr. 2022, 5, 211–225. [Google Scholar] [CrossRef]
  84. Kumar, A.; Vemula, P.K.; Ajayan, P.M.; John, G. Silver-nanoparticle-embedded antimicrobial paints based on vegetable oil. Nat. Mater. 2008, 7, 3. [Google Scholar] [CrossRef] [PubMed]
Figure 1. An overview of the conducted LCA. This figure presents a schematic overview and does not feature all the process steps/flows involved. Please note that the structures of 2-ethylidene-5-norbornene as the third monomer (EPDM) and styrene–butadiene rubber (ELT) are of a representative nature only.
Sustainability 16 03487 g001
Figure 2. Normalized results for AT pitches with different infills compared to NT. CC, LT = climate change, long term; CC, ST = climate change, short term; FNE = fossil and nuclear energy use, FA = freshwater acidification; FET = freshwater ecotoxicity; FEU = freshwater eutrophication; HTC = human toxicity, cancer; HTNC = human toxicity, non-cancer; IR = ionizing radiation, LO = land occupation, biodiversity; LT = land transformation, biodiversity; ME = marine eutrophication; MR = mineral resource use; ODP = ozone layer depletion; PM = particulate matter formulation; PO = photochemical oxidant formation; TA = terrestrial acidification; WS = water scarcity.
Sustainability 16 03487 g002
Figure 3. A boxplot visualization of the distribution of different results for the endpoint of ecosystem damage obtained by playing 1 h of football in different MP emission scenarios. The calculation is found in Supporting Information Table S4.
Sustainability 16 03487 g003
Figure 4. Results obtained for the different scenarios for the endpoint of ecosystem damage. Some categories with minor contributions were left out for the sake of a clearer illustration.
Sustainability 16 03487 g004
Figure 5. A comparison of the characterization factors found by Corella-Puertas and the ones developed in this work. The blue values were taken from Corella-Puertas’ work, and the orange ones are the results for the different rubbers in this work.
Sustainability 16 03487 g005
Figure 6. The results for ecosystem damage for artificial turf with various infill types. The CFs used for the GHGs emitted by MP degradation in the marine compartment as well as the percentual increases in the total results in relation to the values presented in Figure 4 are included in the figure. The calculation and the values are presented in the Supporting Information Table S5.
Sustainability 16 03487 g006
Table 1. The amount of microplastics entering aquatic ecosystems depending upon the scenario.
Mass of MPs Discharged from Infill to Aquatic Ecosystems Annually
Best CaseBase CaseWorst Case
in kg/ain %in kg/ain %in kg/ain %
1.90.06%48.81.64%325.110.91%
Table 2. The LCI used for modeling the shredding of tires to produce ELT.
FlowAmountUnitEcoinvent Dataset
Electricity0.368kWhelectricity, high voltage, production mix|electricity, high voltage|Cutoff, S—NO
Municipal solid waste0.39kgtreatment of municipal solid waste, incineration|municipal solid waste|Cutoff, S—NO
Scrap steel0.34kgmarket for scrap steel|scrap steel|Cutoff, S—Europe without Switzerland
Table 3. The LCI used for modeling the shredding of tires to produce ELT. The scenarios for degradation and sedimentation are discussed in Section 4.2.
Degradation
Pathway
Sedimentation
Pathway
Degradation Rate
(kg/kg * Year)
Sedimentation Rate
(kg/kg * Year)
Removal Rate
(kg/kg * Year)
Fate Factor
(kg * Year/kg)
Midpoint CF
(PAF * m3 * Year/kg)
Endpoint CF
(PDF * m2 * Year/kg)
EPDM
EPDM_HighTWRP_Fast10.2755.2665.530.021.63 × 1014.07× 10−3
EPDM_HighTWRP_Slow9.2110.000.101.07 × 1022.67× 10−2
EPDM_HighAllPlastic1.5411.810.089.04 × 1012.26× 10−2
EPDM_LowTWRP_Fast0.7955.2656.050.021.90× 1014.76 × 10−3
EPDM_LowTWRP_Slow9.2110.000.101.07 × 1022.67× 10−2
EPDM_LowAllPlastic1.542.330.434.59 × 1021.15× 10−1
ELT
5000 µm_FastTWRP_Fast0.07055.2655.330.021.93 × 1014.82× 10−3
5000 µm_FastTWRP_Slow9.219.280.111.15 × 1022.88× 10−2
5000 µm_FastAllPlastic1.541.600.626.65 × 1021.66× 10−1
5000 µm_MediumTWRP_Fast3.34 × 10−455.2655.260.021.93 × 1014.83× 10−3
5000 µm_MediumTWRP_Slow9.219.210.111.16 × 1022.90× 10−2
5000 µm_MediumAllPlastic1.541.540.656.95 × 1021.74× 10−1
5000 µm_SlowTWRP_Fast1.60 × 10−655.2655.260.021.93 × 1014.83× 10−3
5000 µm_SlowTWRP_Slow9.219.210.111.16 × 1022.90× 10−2
5000 µm_SlowAllPlastic1.541.540.656.95 × 1021.74× 10−1
1000 µm_FastTWRP_Fast0.3555.2655.610.055.53 × 1011.38× 10−2
1000 µm_FastTWRP_Slow9.219.560.313.32 × 1028.30× 10−2
1000 µm_FastAllPlastic1.541.881.871.99 × 10³4.98× 10⁻¹
1000 µm_MediumTWRP_Fast1.67 × 10−355.2655.260.021.93 × 1014.83× 10−3
1000 µm_MediumTWRP_Slow9.219.210.111.16 × 1022.90× 10−2
1000 µm_MediumAllPlastic1.541.540.656.95 × 1021.74× 10−1
1000 µm_SlowTWRP_Fast8.00 × 10−655.2655.260.021.93 × 1014.83× 10−3
1000 µm_SlowTWRP_Slow9.219.210.111.16 × 1022.90× 10−2
1000 µm_SlowAllPlastic1.541.540.656.95 × 1021.74× 10−1
ELT_BacteriaTWRP_Fast0.2555.2655.520.021.92 × 1014.81× 10−3
ELT_BacteriaTWRP_Slow9.219.460.111.13 × 1022.82× 10−2
ELT_BacteriaAllPlastic1.541.790.565.97 × 1021.49× 10−1
ELT_TyreTWRP_Fast0.05155.2655.310.021.93 × 1014.82× 10−3
ELT_TyreTWRP_Slow9.219.260.111.15 × 1022.88× 10−2
ELT_TyreAllPlastic1.541.590.636.73 × 1021.68× 10−1
Table 4. The damage on ecosystem quality if instead of the CFs for EPDM and ELT, one for LDPE was used.
ScenarioEPDM BaseEPDM BestEPDM WorstELT BaseELT BestELT Worst
Damage (PDF * m2 * year/kg)9.41 × 10−30.2401.609.41 × 10−30.2401.60
Total damage (PDF * m2 * year)1.98 × 1021.99 × 1021.98 × 1021.45 × 1021.45 × 1021.44 × 102
Damage in %0.0047%0.12%0.81%0.0065%0.17%1.11%
Disclaimer/Publisher’s Note: The statements, opinions and data contained in all publications are solely those of the individual author(s) and contributor(s) and not of MDPI and/or the editor(s). MDPI and/or the editor(s) disclaim responsibility for any injury to people or property resulting from any ideas, methods, instructions or products referred to in the content.

