
Evaluation of Urban Land Suitability under Multiple Sea Level Rise Scenarios

1
Department of Regional and Urban Planning, Zhejiang University, Hangzhou 310058, China
2
Center for Balance Architecture, Zhejiang University, Hangzhou 310058, China
*
Author to whom correspondence should be addressed.
Sustainability 2024, 16(8), 3485; https://doi.org/10.3390/su16083485
Submission received: 11 March 2024
/
Revised: 17 April 2024
/
Accepted: 18 April 2024
/
Published: 22 April 2024
Abstract
:Anticipated sea level rises from global climate change pose a significant flood risk to urban land. Evaluating urban land suitability under sea level rise scenarios is crucial for promoting sustainable development. Recent research has advanced the application of artificial intelligence and the integration of GIS with models, yet the impact of climate change on land suitability has often been overlooked. This study focuses on Xihu District in Hangzhou, utilizing the entropy weight and matter-element model to evaluate land suitability for urban development. The evaluation results were cross-verified with land use plans. A comprehensive analysis of potential flood risk to urban land in 2100 was conducted, considering varying degrees of sea level rise under Sustainable Development Scenario SSP1-2.6 and High-end Emission Scenario SSP5-8.5, as well as the scenario reflecting the most severe sea level rise during extreme climate events. The results indicate that more than half of the land in the study area is suitable for construction, aligning spatially with the current planned urban land. The analysis process of the matter-element model reflects the impact level of each indicator on urban land suitability, conveying information both spatially and numerically, thus enhancing accuracy. Scenario analysis reveals that approximately 10% to 20% of urban land in the study area could face flooding threats due to future sea level rises, primarily in the northern and southeastern regions. Recommendations for future land development and spatial planning strategies to address flood risk are discussed, aiming to alleviate the pressure on urban land in response to future climate change.
1. Introduction
Cities in China have experienced rapid development, with the urbanization rate climbing to 63.89% in 2020, a surge of over 30% in the past two decades. This rapid expansion, however, has resulted in inefficient land use, resource wastage, environmental pollution, and ecological degradation [1,2]. The evaluation of urban land suitability helps to improve the living environment and mitigate the negative impacts of urbanization on natural systems [2]. It addresses specific spatial demands, promotes the optimization of urban spatial patterns, and provides valuable data support for the rational allocation of future land use [3,4]. Despite these advancements, the current technical guidelines for land suitability evaluation in China lack a unified practical framework and technical references. Therefore, it is necessary to introduce new evaluation methods to enhance efficiency and accuracy, thereby providing guidance for spatial planning at different scales.
Climate change creates additional stresses on land, intensifying existing threats to livelihoods, biodiversity, human and ecosystem health, infrastructure, and food systems [5]. According to the Intergovernmental Panel on Climate Change (IPCC), human activities are estimated to have caused approximately 1.0 °C of global warming above pre-industrial levels, with global warming projected to reach 1.5 °C between 2030 and 2052 if it continues at the current rate [6]. Sea level rise, driven by global climate change, will directly affect coastal ecosystems and human activities, increasing the frequency and severity of extreme sea level events such as storm surges, wave inundation, and tidal floods [7]. As a primary human habitat, urban land is likely to face severe flood risks in the future. For this, incorporating climate change scenarios into research is essential for predicting the vulnerability of urban systems in advance.
Extensive global research on land suitability evaluation has advanced technical approaches, particularly in integrating artificial intelligence and advanced modeling with GIS. The use of artificial neural networks, such as the radial basis function neural network and the Back Propagation (BP) neural network, integrated with GIS technology, exemplifies the progressive applications in this field [8,9,10]. Moreover, the Probabilistic Neural Network (PNN) analysis method [11] has been utilized to refine evaluations of land suitability and land use status.
While multi-criteria decision-making (MCDM) methods, such as the analytic hierarchy process (AHP) [12,13], Analytic Network Process (ANP) [14], and Logic Scoring of Preference (LSP) method [15,16], continue to optimize complex indicators for evaluation, the incorporation of more sophisticated models offers significant enhancements. The Ordered Weighted Averaging (OWA) decision-making model, for instance, combines the analytic hierarchy process with fuzzy quantitative methods under a GIS framework to improve land suitability assessments [17,18]. Notably, the integration of fuzzy membership functions with GIS was employed in land evaluation studies in the 1990s [19]. The application of variable fuzzy sets and fuzzy logic theories considerably improved the accuracy and reliability of evaluation practices [20,21], while fuzzy comprehensive evaluation has been frequently utilized in land suitability research [22].
Additionally, the weight-of-evidence model utilizes Bayesian Theory to support decision-making processes in GIS systems [23], facilitating a more streamlined evaluation process [24,25]. Similarly, the practice of building a decision tree model based upon spatial data basic and improved algorithms has proven highly accurate in evaluating land suitability [26,27,28]. Furthermore, innovative approaches like niche models [29] and the matter-element model [30,31,32] demonstrate the continuous evolution and effectiveness of combining knowledge-driven and data-driven approaches in land suitability evaluations. The introduction of the niche models, such as the Maximum Entropy (MaxEnt) model [33], provides a more comprehensive perspective for land assessments. The integration of the matter-element model with AHP, Remote Sensing (RS), and GIS methods has proven effective in practice [34].
To address climate change, cities worldwide have developed local plans or policies in response [35], but few incorporate spatial planning measures [36,37]. Research indicates that urban areas can effectively adapt to and mitigate climate change by implementing strategies, such as adopting compact urban forms [38,39], promoting public transportation [40], enhancing green spaces, and improving infrastructure [41,42]. Additionally, revising land use in areas likely to be flood-prone in the future is considered a key measure in adapting to climate change [43,44,45]. However, the possible negative impacts of climate change have received little attention in land suitability evaluations. A diversity of adaptation responses to coastal impacts and risks, including hard coastal protection infrastructure in coastal cities and deltas, have been implemented around the world [46]. While existing infrastructure can mitigate current coastal risks to some extent, it is inadequate for future flood protection. Proactively including flood risk in urban land suitability evaluations can not only forecast potential flooding to minimize losses, but also bolster urban resilience against natural hazards.
The scenario-based analysis approach has been applied to study the responses of urban land [47,48,49], agriculture [50], hydrology, and ecosystems [51,52] to climate change impacts. Scholars have also evaluated flood risk in urban areas based on land use modeling and climate scenarios [53,54,55]. Although these studies primarily concentrate on simulating future land use [48,49], their analytical perspective and methodology can inform land suitability evaluations.
Drawing on relevant theoretical studies and technical methods, we conducted an empirical study in Xihu District, Hangzhou, using the entropy weight and matter-element model with MATLAB and ArcGIS. Based on the Coupled Model Intercomparison Project (CMIP6) developed by the IPCC, we selected two scenarios, Sustainable Development Scenario SSP1-2.6 and High-end Emission Scenario SSP5-8.5, to estimate the sea level rise in 2100. The scenario analysis also considered extreme sea level events recently observed in coastal Zhejiang. We simulated potential future flooded areas in Xihu District, and the analysis of these results provides technical support and a scientific reference for spatial planning under climate change conditions (Figure 1).
2. Materials and Methods
2.1. Study Area
Xihu District, located in western Hangzhou, covers an area of approximately 311.30 km2. Positioned between latitudes 30°4′49″ and 30°21′28″ N and longitudes 119°59′30″ to 120°10′42″ E, it features a subtropical monsoon climate with distinct seasons and abundant precipitation. Xihu District is renowned for its historical and cultural landmarks, including West Lake, a cultural and esthetic symbol of Hangzhou for centuries. The topography predominantly consists of hills and plains, with the Qiantang River traversing from south to north (Figure 2).
As a central urban area, Xihu District exemplifies urban–rural fringe areas and supports a population of 1.167 million, which has steadily grown over recent years. Its diverse economy spans e-commerce, technology, finance, and traditional industries, alongside tourism, hospitality, and cultural sectors. Located 30 km from Xiaoshan International Airport, a major regional air travel hub, the district is also well connected by high-speed rail and expressways to major cities like Shanghai and Nanjing, enhancing its regional connectivity.
Metropolitan centers and tourist regions are vulnerable to frequent flooding [56]. As a southeastern coastal city in China, Hangzhou is susceptible to climate-related disasters, especially typhoons and heavy rainfall, which often result in flooding and inundation [9]. Statistics indicate that over the past 15 years, Xihu District has sustained the highest direct economic losses due to flood disasters among the city’s main districts [57] and also contends with significant land subsidence issues.
2.2. Data Acquisition
Research data were sourced from open-access data websites and local planning departments. The data sets from 2020 included DEM elevation data derived from the GDEMV2 digital elevation data product of the Geospatial Data Cloud site (http://www.gscloud.cn (accessed on 3 April 2024)), featuring a 30 m resolution. Basic geographic data such as water systems, highways, and railways were vector data obtained from the National Catalogue Service for Geographic Information website (www.webmap.cn (accessed on 3 April 2024)). Meteorological data including monthly mean temperature and relative humidity were sourced from the National Earth System Science Data Center (https://www.geodata.cn (accessed on 3 April 2024)). Geological hazard data were provided by the Hangzhou Bureau of Planning and Natural Resources. High-resolution (10 m) land cover data derived from Sentinel-2 satellite images were acquired from the Esri website (https://livingatlas.arcgis.com/landcover/ (accessed on 3 April 2024)). Road network data were downloaded from the OpenStreetMap website (https://www.openstreetmap.org (accessed on 3 April 2024)). Point of interest (POI) data for transportation hubs such as airports, railway and bus stations, high-speed toll stations, and subway stations were collected from the Autonavi Open Platform. All collected data underwent projection transformation in ArcGIS, and the subsequent analysis was uniformly conducted using the CGCS2000 geodetic coordinate system, converting all data types into a raster format with a 10 m × 10 m precision.
Future sea level rise projections were obtained from the CMIP6 SSP1-2.6 and SSP5-8.5 scenarios as outlined in the IPPC’s Sixth Assessment Report (AR6) [58]. Data on extreme sea level events were sourced from the China Sea Level Bulletin.
2.3. Methods
2.3.1. Establishment of the Evaluation System
- (1)
- Indicator Selection
To evaluate land suitability for urban development, the initial step is to determine the evaluation indicators based on their relevance and influence on urban land, while considering local conditions. The literature typically categorizes indicators into two main perspectives: geographic resource conditions and economic location conditions. Applying the potential–constraint model [59,60], scholars distinguish between geographic constraints, which often limit urban land use as resistance factors, and economic potentials, which indicate the construction potential of urban spaces and serve as drivers for future spatial development (Table 1).
Following standard practices in indicator selection, we adopted the principles of scientific rigor, economic viability, operational feasibility, and measurability, tailored to the urban land context of the study area. We identified six categories of factors using the potential–constraint model, including three constraint factors, topography, climate environment, and disaster risk, and three potential factors: land status, location conditions, and traffic network density.
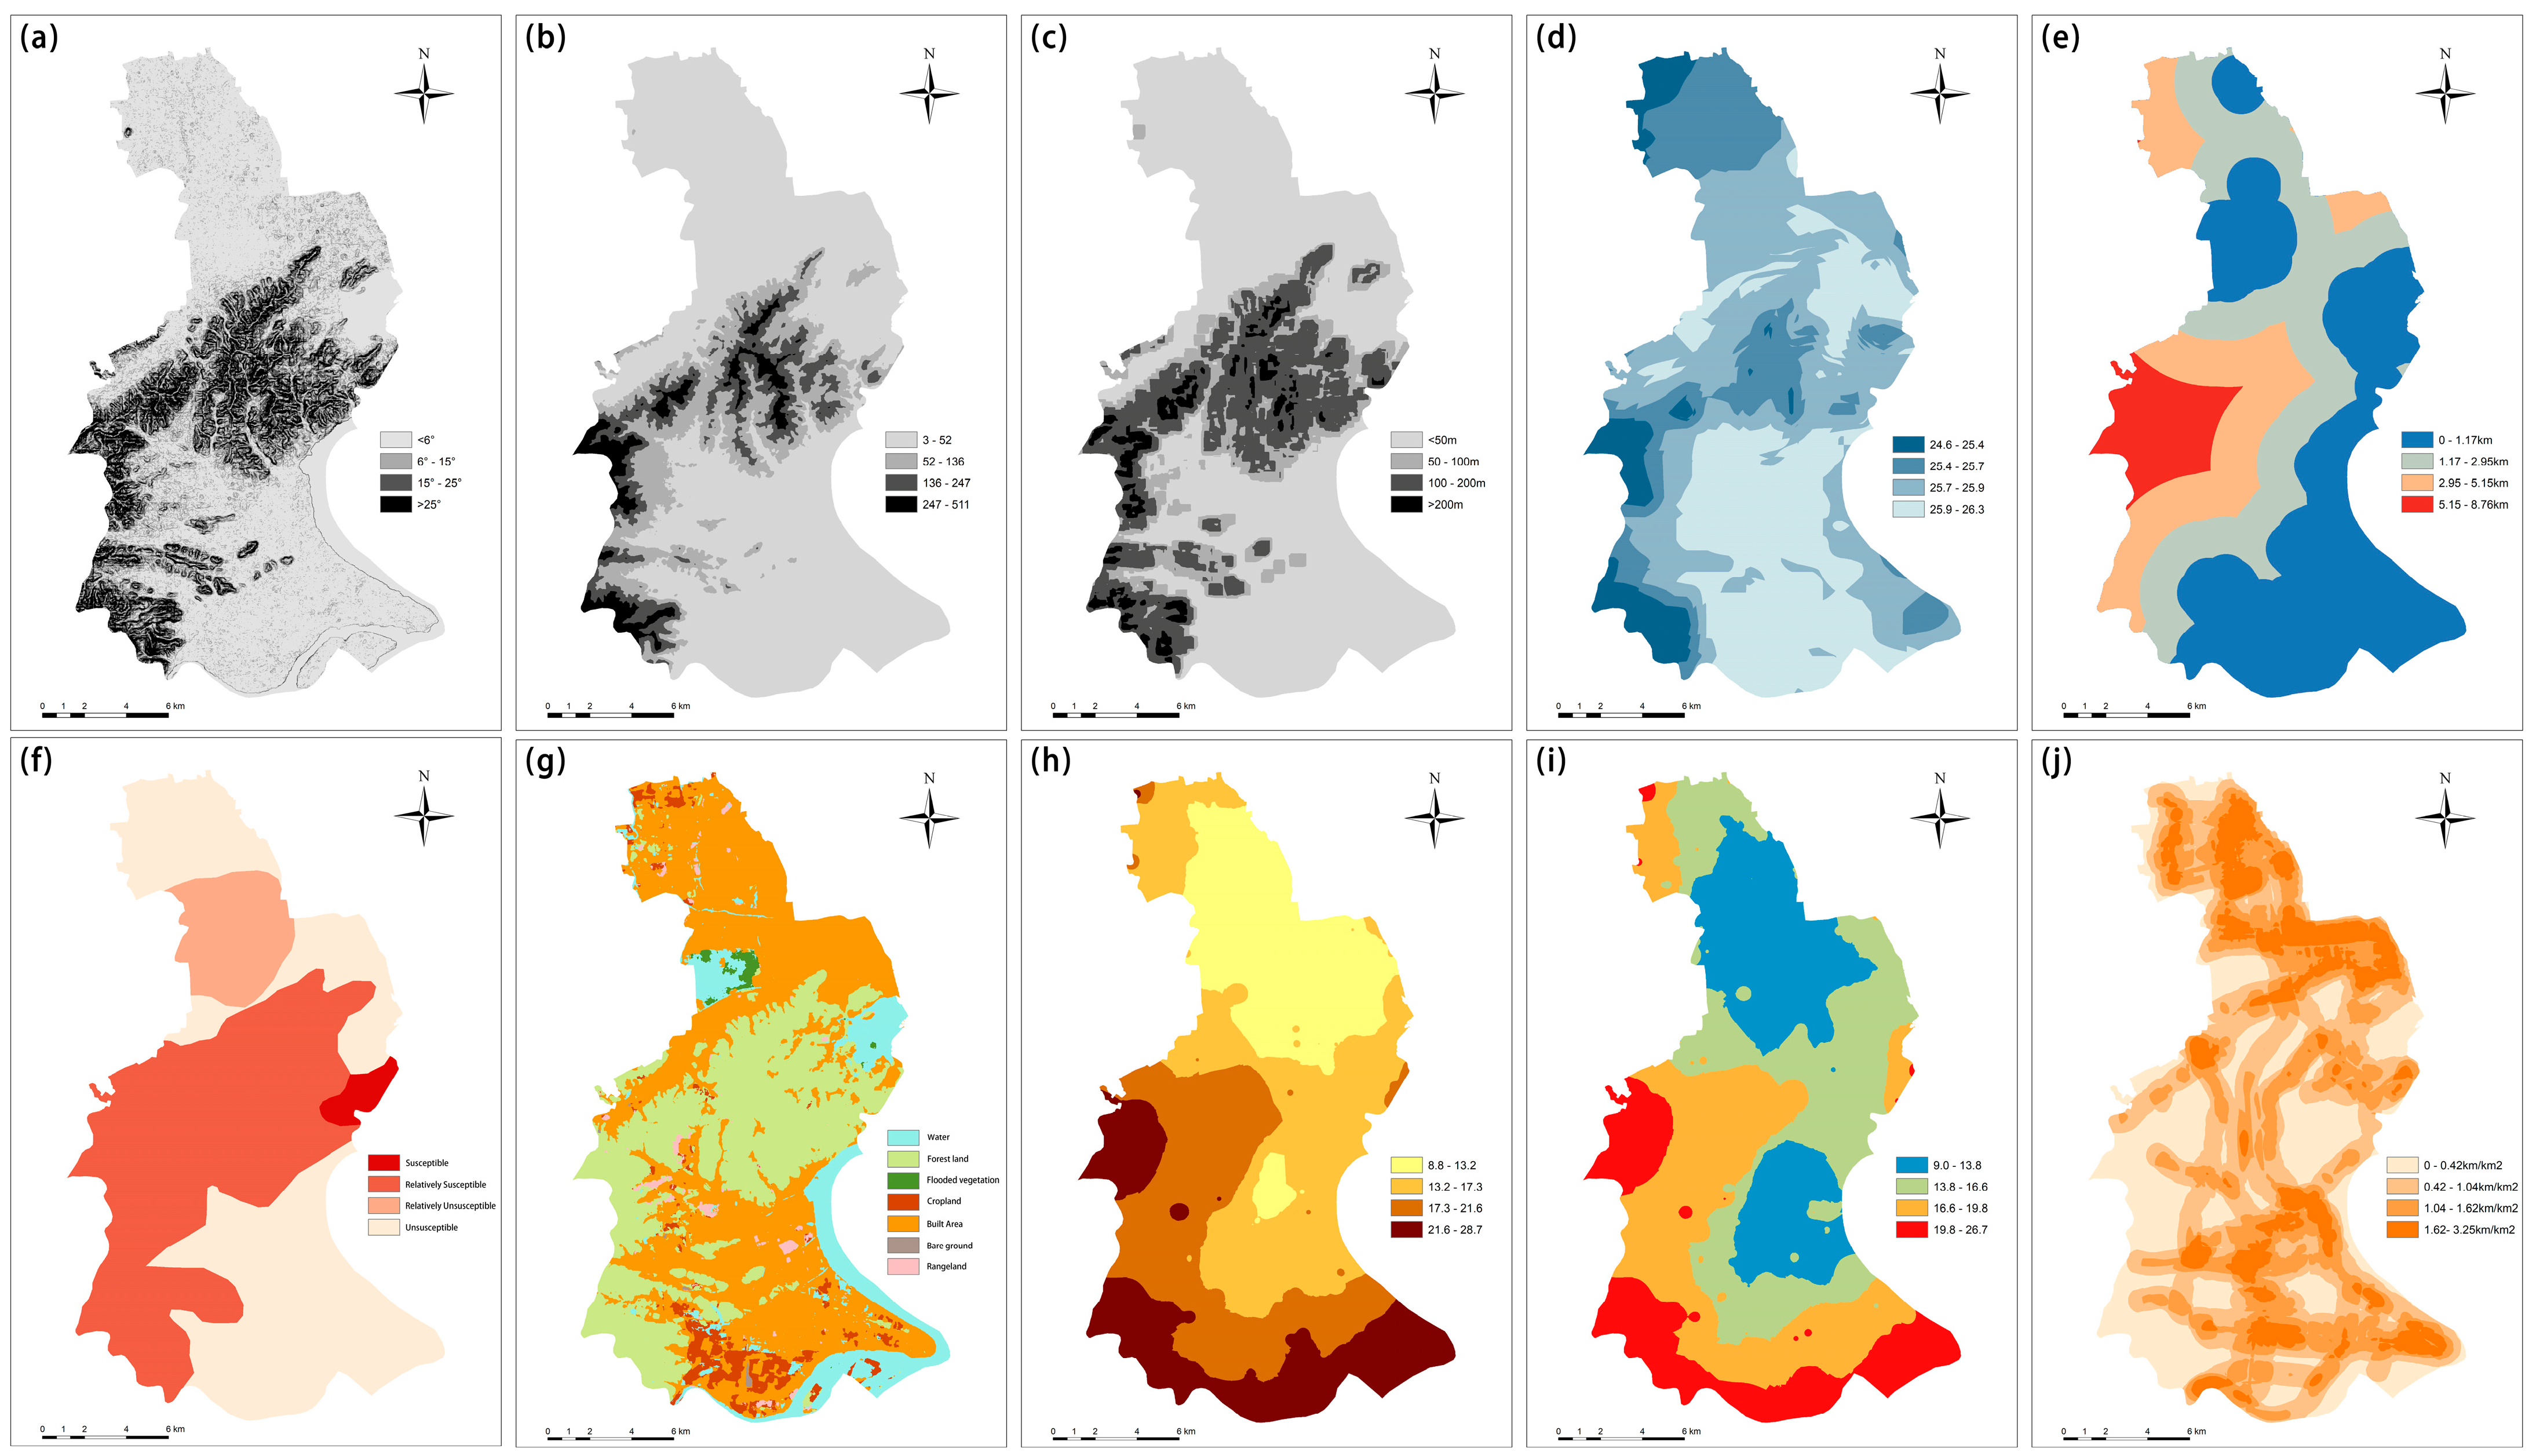
For quantitative analysis, these factors were subdivided into ten indicators: slope, elevation, topographic relief, temperature humidity index, distance from rivers, susceptibility to geological disasters, land cover, accessibility of traffic arteries, accessibility of traffic hubs, and road network density. After establishing the indicators, we processed data to create a unified evaluation map (Figure 3), utilizing ArcGIS for spatial analysis.
- (2)
- Evaluation Grades and Criteria
In accordance with the relevant literature [30,32] and China’s “Guidelines for the Evaluation of Resource and Environmental Carrying Capacity and Suitability for Territorial Spatial Development”, four evaluation grades were adopted in this case study: suitable, relatively suitable, relatively unsuitable, and unsuitable. The classification of each indicator is visualized in Figure 3.
The majority of indicators were graded using Jenk’s natural breaks method. For inherently categorical indicators, such as susceptibility to geological hazards and land cover, categories were defined based on urban development principles [32,63,64]. Adjustments to criteria for specific indicators were made according to national guidelines and standards. Table 2 presents these four grades along with their respective descriptions.
- (3)
- Determination of Weights Based on Entropy Method
The entropy weight method, which allocates weights to indicators based on their information entropy, was used to reduce the subjective biases common to methods such as AHP or the Delphi Method. This method quantifies the uncertainty of indicator data: higher entropy indicates greater disorder and information contribution, thereby assigning higher weight. In the process of constructing the indicator system, this study objectively assigns weights to each indicator using the entropy method (Table 3).
2.3.2. Construction of the Evaluation Model Based on Matter-Element Theory
Developed by the Chinese mathematician Cai Wen in the 1980s, matter-element theory is a branch of the extenics disciplines. It is generally used to solve practical problems that are too complex to express in precise mathematical language, and its essence is to use the correlation function to quantitatively describe the development and changes of the research object in space and time [65]. The suitability of urban land, characterized by typical fuzziness and complexity, is effectively simplified using the matter-element model. Through a quantitative description of the correlation functions of individual indicators, the model captures their interactions and aggregates the impact of multiple factors.
In GIS-based land suitability analysis, diverse methodologies are utilized, including multiple-criteria decision-making methods, fuzzy mathematical techniques, artificial intelligence technology, and diverse modeling applications. The matter-element model amalgamates the strengths of the first two methods. Specifically, it has the ability to deal with uncertainty and integrate multiple criteria and is applicable to complex dynamic systems. Consequently, it offers a robust and transparent decision-making process and a systematic, flexible approach for evaluating urban land suitability. Compared to methods like neural networks, the matter-element model is relatively straightforward, minimizing excessive reliance on data training and enabling the use of programming software to enhance calculation efficiency and accuracy.
The matter-element model employs an ordered triad R = (N,c,v) to describe entities [66]. In this case, N is the grade of its suitability; the characteristic c is the indicator of the evaluation of land suitability, with a total of i indicators; and v is the value of each indicator’s basic unit. A matrix representation for the matter element is adopted here to integrate multidimensional features. It helps to fit subsequent mathematical modeling which would offer convenience in computation and processing. For each basic unit, there is a matter element R = (N,c,v) expressed by the following formula:
The essence of matter-element analysis lies in the matrix calculation of the correlation function between the matter element and the evaluation grade, which assigns each unit to the grade with the highest correlation. This process allows for a detailed differentiation of each indicator, greatly enhancing the accuracy of the evaluation. The specific approach to evaluating urban land suitability based upon the matter-element theory is outlined as follows:
- (1)
- Determination of classical domain and nodal domain.
The classical domain specifies the range of values that indicator i might take in each grade, j, for all of the matter elements studied. For each grade, j, there is a corresponding classical domain matrix, , expressed as
where refers to the suitability grade, is the characteristic value of at level j, and and are the minimum and maximum values among all the values of i at level j, respectively. The explicit values in the domain matrix correspond to the values in Table 3.
The nodal domain outlines the overall ranges of values for an indicator across all studied elements, typically ranged from to for indicator i. The nodal domain matrix, , is expressed as follows:
where refers to all suitability grades; refers to the range of values taken for each indicator for all matter elements. It can be found that .
- (2)
- Determination of Matter elements to Be Evaluated
The matter elements to be evaluated refers to each element of urban land suitability divided according to the raster precision. The study area was divided into fixed numbered 10 m × 10 m raster data units, with a total of 3,119,250 basic units, which were determined as the matter elements evaluated in this model. For each matter element, , it can be expressed by the following matrix:
where the subscript x is the number of matter elements to be evaluated. is the value of the indicator i, and is the actual evaluation grade of the matter element to be solved.
To illustrate the calculation process of the matter-element model better, the object numbered 1 in the study area was selected as an example according to Formula (4), and the matter-element matrix to be evaluated can be expressed as follows:
- (3)
- Calculation of Correlation Between Each Indicator and Evaluation Grade
Correlation functions can describe the characteristics of objects quantitatively, expressed as the membership degrees of the evaluation matter elements that conform to a certain evaluation grade. The correlation calculation begins with distance measures using the following formulas:
These distances are calculated between the matter element, , and the classical and the nodal domains, respectively. The correlation function is then established to calculate the correlation between each matter element and evaluation grade, represented as
where =.
- (4)
- Calculation of Integrated Correlation Degree
The integrated correlation degree between each matter element and different grades is calculated using a weighted average, considering the weight of each indicator:
where represents the integrated correlation degree between the matter element, , and the evaluation grade, j. is the weight of the indicator, i. If , then the matter element belongs to grade , and reflects the level of the matter element that belongs to the grade directly.
For the matter element , correlation functions were calculated using Formulas (5)–(7). The attribution of the maximum correlation value reflects the evaluation grade for each indicator. Correlations between each indicator of and the evaluation grades were obtained as follows (Table 4):
Subsequently, the integrated correlation degree was calculated using Formula (8) and the results are presented in Table 5. It can be found that (). Therefore, the matter element belongs to the suitable grade and the value of the correlation is −0.21.
Before analyzing the value of , it is necessary to clarify the significance of different value ranges in the evaluation model. The potential range of spans the entire real number axis, from −∞ to +∞. This analysis offers more information than traditional mathematical methods. The significance of different ranges of in the evaluation model are as follows: When ≥ 1, it indicates that the evaluated matter element exceeds the standard, with higher values indicating greater future development potential. When 0 ≤ ≤ 1, it signifies that the matter element meets the standard to varying degrees, with higher values indicating closer adherence. Values between −1 and 0 suggest partial compliance with the standard and potential for adjustment to meet the standard fully. Finally, values ≤−1 denote that the matter element falls significantly short of standards, lacking conditions for transformation and development potential.
2.3.3. Analysis of Sea Level Rise under Climate Change Scenarios
Climate change scenarios generally refer to projections of future climate conditions based on different assumptions about greenhouse gas emissions, socioeconomic development, and other factors. According to the IPCC’s AR6, CMIP6 integrated the Shared Socioeconomic Pathways (SSPs) with Representative Concentration Pathways (RCPs) to depict different climate change scenarios. Scenario analysis typically involves various factors such as high temperatures, heavy rainfall, air pollution, sea level rise, and extreme weather events, which may serve as key elements in characterizing climate change impacts. Sea level rise scenarios associated with future climate change exhibit greater certainty compared to other trends observed across numerous climate impact variables [38]. Moreover, there is an increasing trend of direct losses to urban land brought about by flood risk. Managing flood risk is recognized as one of the crucial components of climate change adaption.
This study focuses on sea level rise as the main variable, selecting two representative emission scenarios from the IPCC climate models: SSP1-2.6, which represents a sustainable development scenario with low vulnerability, low mitigation pressure, and low radiative forcing, and SSP5-8.5, a high-end emission scenario driven by a rapid development path based on fossil fuel consumption [58]. Extreme sea levels refer to sea levels that are significantly higher than the same period of a normal year under extreme climate events or ocean phenomena, and the duration is generally several hours or days.
Considering the uncertainties associated with future sea level rises, the analysis was not confined to a single scenario [67]. In addition to the global mean sea level in 2100 under different climate change scenarios, regional extreme climate events were also taken into account. As the coastal areas of Zhejiang are frequently hit by storm surges, the sea level is significantly elevated due to the superposition of seasonal high sea levels and astronomical high tides. Statistics show that the average sea level rise caused by extreme sea level events in the last five years is 0.48 m, with a maximum of 0.94 m, and the sea level change exhibits a fluctuating upward trend (Figure 4). When conducting risk assessments, selecting the worst-case scenario of 0.94 m as the baseline for simulation ensures the effectiveness of early warning. Although Hangzhou has issued a special plan for a sponge city, it remains challenging to assess the effectiveness of current and future flood control facilities. Relevant data indicate that minor ground subsidence in Xihu District occurs around the Xixi Wetland and has not been included in the consideration.
3. Results
3.1. Suitability Analysis of Urban Land
3.1.1. Spatial Distribution and Statistics of Land Suitability
The evaluation results of urban land suitability in the study area were obtained by establishing the matter-element matrix and calculating the correlation function for all matter elements. Statistical analysis reveals that over 50% of the urban land in Xihu District is suitable for development. Areas deemed unsuitable constitute the second largest category, with both relatively suitable and unsuitable lands representing smaller proportions (Table 6).
Upon visualizing the data, it became possible to link the evaluation results of each matter element with its spatial geographic location, providing a more intuitive reflection of the spatial distribution of land suitability for urban development in Xihu District (Figure 5a). The findings suggest that areas suitable for development are concentrated primarily in the north and southeast. In contrast, areas relatively suitable for construction are found on the outskirts of these regions. Spaces categorized as relatively unsuitable for development are fewer and dispersed, whereas the unsuitable regions are primarily situated in the central and southwestern areas, encompassing existing woodlands, mountains, water bodies, wetlands, and so on.
3.1.2. Validation of Rationality Compared with Planned Land Use
The suitability map for urban land in Xihu District, Hangzhou, was superimposed with the land use plans (Figure 5c), excluding areas categorized as unsuitable to enhance clarity. On the whole, the land planned for development aligns well with the areas evaluated as suitable. The northeastern part of the study area is a concentrated urban land adjacent to the urban center, exhibiting a high degree of continuous development. The northwestern and northern areas consist primarily of current croplands and agricultural lands, with significant potential for urban development. However, these areas require further evaluation to maintain a balance between urban land use and ecological protection. The southeastern area, near the Qiantang River, presents greater potential for development.
3.1.3. Distribution of Land Suitability Grade Values
The integrated correlation values of all matter elements to be evaluated were statistically analyzed, summarized, and categorized according to different suitability grades. Table 7 illustrates the results.
The correlation values of all suitability grades range from −1 to 1, with no evaluated elements completely failing to meet the criteria of any grade. The majority of the correlations are negative, with over 90% of these values corresponding to the three grades of suitable, relatively unsuitable, and unsuitable. The proportion of the negative integrated correlation corresponding to the suitable grade is more than 80%, indicating that only 17.27% of the areas fully meet the criteria for this grade. Similarly, most of the elements in the relatively suitable and relatively unsuitable grades tend to be more inclined to the lower grades. Notably, 99.37% of elements in the unsuitable grade exhibit negative correlation values, suggesting that they are nearly completely unsuitable for urban development. However, the few elements within the unsuitable grade that show positive correlations present an opportunity for further investigation to determine if they could be transformed into viable urban spaces under specific conditions.
3.2. Multi-Scenario Analysis of Sea Level Rise under Climate Change
Based on the elevation data of the study area, the analysis overlaid climate change projections from two development paths with data on extreme sea level events to determine sea level rises across four scenarios (Table 8).
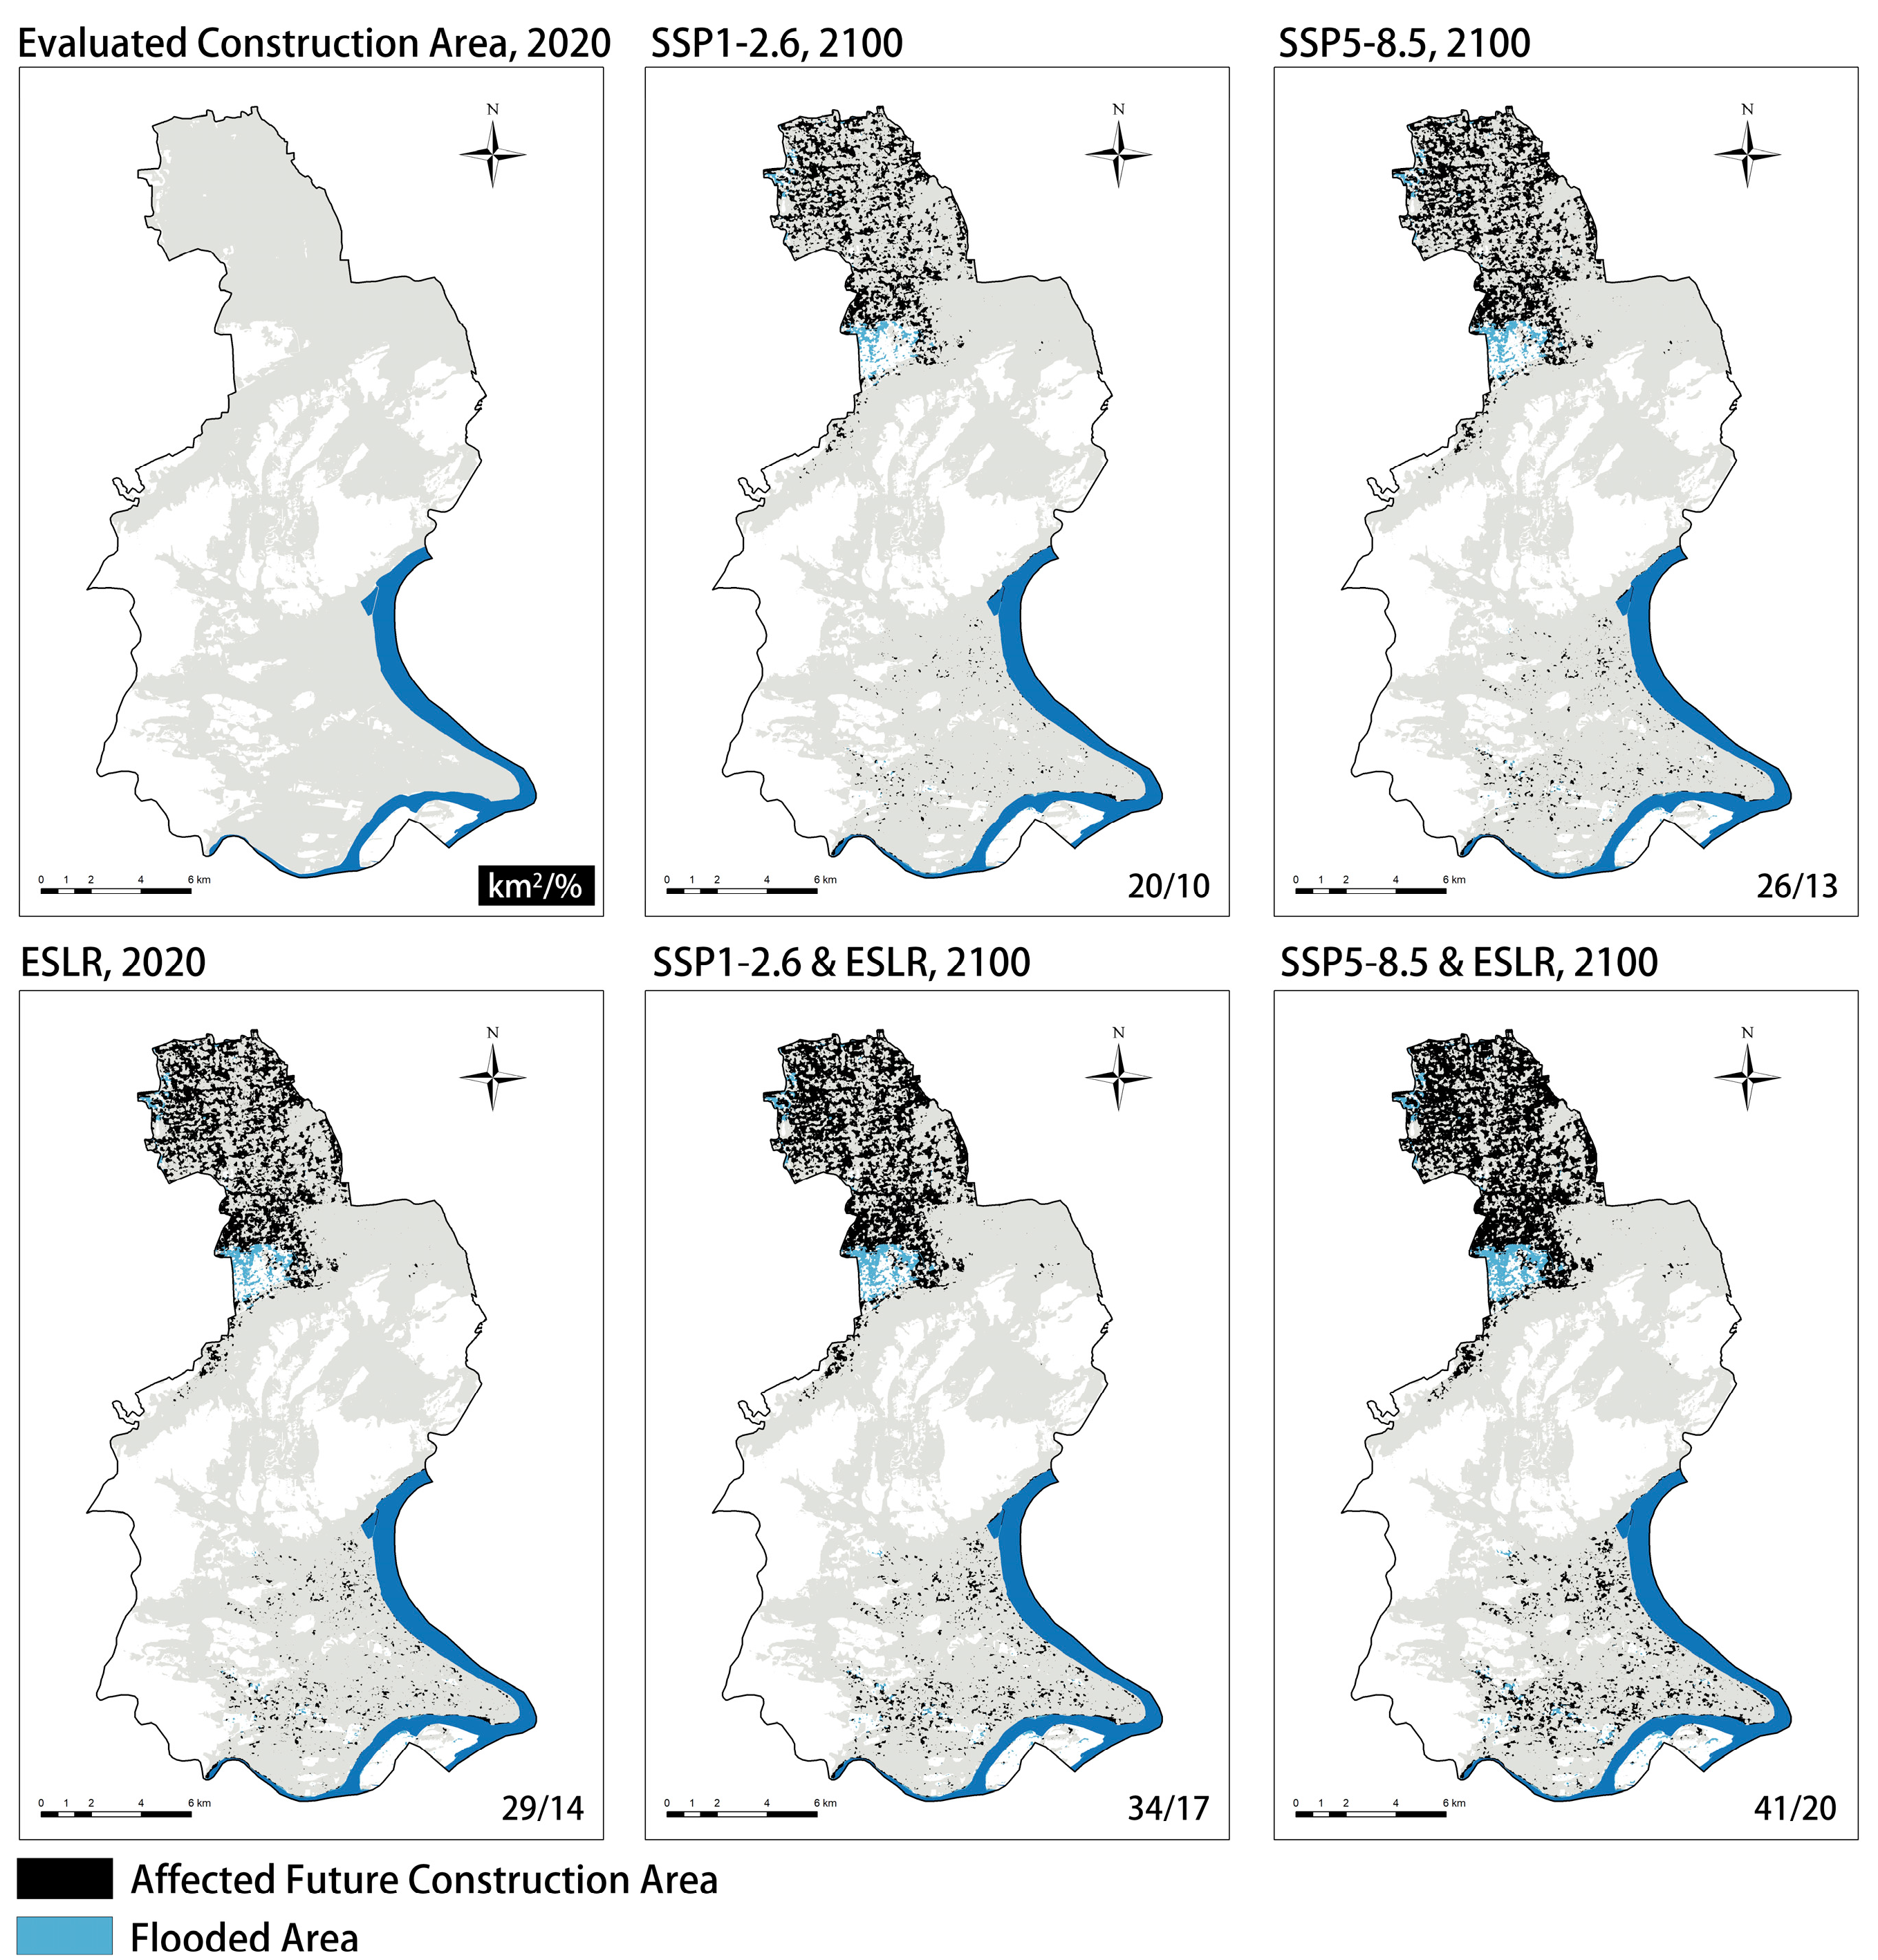
Subsequently, the sea level rise data were combined with the suitability evaluation results, and the areas unsuitable for construction were eliminated. Figure 6 shows the spatial distribution of flood risk in potential future construction areas in Xihu District under different scenarios, along with the area and percentage of land exposed to flooding.
The scenario analysis indicates that if urban development proceeds based on the suitability evaluation results, 14% of the land is already susceptible to flooding during extreme sea level events. Most of the areas are concentrated in the northern part of the Xihu District and the surrounding area of Xixi Wetland, which also experiencemore severe ground subsidence compared to other regions. Areas near the waterfront in the southeastern section of the urban land experience relatively more significant impacts from extreme weather events. Disregarding the occurrence of Extreme Sea Level Rise (ESLR), under the low-emission climate scenario of SSP1-2.6, an estimated 20 km2 of urban land would face the threat of flooding by 2100, accounting for 10% of all developable areas. Under the high-emission conditions of SSP5-8.5, the area exposed to flooding increases to 26 km2, a growth of 3%. In light of future climate scenarios, if sea level rise (SLR) resulting from climate change coincides with an ESLR of 0.94 m, the total exposed construction area will expand to 34 km2 and 41 km2, respectively. Consequently, flood risk in the regions adjacent to the Qiantang River will significantly escalate. In the event of ESLR under the SSP5-8.5 scenario, the area threatened by floods reaches 20% of all construction areas. The most severe climate change scenario could lead to a flood risk exposure level for urban land nearly 1.5 times greater than the current tidal flood risk.
4. Discussion
4.1. Optimization of Methods for Land Suitability Evaluation
In this study, the entropy weight method and matter-element model were used to evaluate the suitability of urban land in Xihu District, Hangzhou. The entropy weight method determines weights according to the distribution of indicator data values, reducing the interference of subjective elements in the process of establishing the indicator system. The matter-element model enables the results to be accurately described both spatially and numerically. The evaluation showed that the percentage of suitable, relatively suitable, relatively unsuitable, and unsuitable land for construction in the study area was 51.62%, 4.44%, 8.23%, and 35.71%, respectively. Cross-validation with the land use plans indicated that the spatial distribution of suitable land overlapped largely with the areas designated for development, affirming the accuracy and reliability of this evaluation model.
In addition, the computational process of the evaluation model yields extensive insights. Weights derived from the entropy weight method demonstrate notable variability within classes, particularly in indicators such as land cover, temperature humidity index, and road network density, which are pivotal in the evaluation system. For each matter-element evaluation unit, detailed correlation analysis can be conducted to identify the primary restrictive factors. Taking the aforementioned land unit as an example, the correlations between each indicator and evaluation grade (Table 4) indicate that, except for road network density, all indicators of meet the criteria of being suitable or relatively suitable. Therefore, it may be necessary to enhance the accessibility of the transportation system in future development. Similarly, the decomposition and assessment of evaluation indicators can be carried out for other land units, which will clearly demonstrate the contradictions among various influencing factors, providing refined and personalized references for land use planning.
4.2. Recommendations for Urban Land Development Based on Suitability Evaluation
Spatially, the central mountains divide the study area into two main regions suitable for development: the north and the south. Areas adjacent to urban centers and major rivers typically show greater development potential, while areas with rich natural resources and complex topography are judged to be unsuitable. Most areas suitable for construction are concentrated in the north and southeast, but their integrated correlations with the suitable grade are mostly negative, indicating that they do not fully meet the suitable criteria for urban development. This discrepancy arises because the northern sector borders the outer urban center, while the southeast primarily consists of cropland, necessitating detailed studies and cautious planning for further spatial development. A considerable portion of the space in the central and southwestern areas is unsuitable for urban development, encompassing water bodies, mountains, woodlands, and important scenic reserves. However, some urban and rural residential lands in these unsuitable areas contradict the evaluation results, suggesting that while they may not be ideal for urban development due to resource limitations, they offer a desirable living environment and serve as recreation areas combined with the surrounding scenic locales. Fewer spaces were evaluated as relatively suitable or unsuitable, with correlations indicating a general inclination towards unsuitability for urban development.
Overall, a significant discrepancy exists between most areas and the urban development suitability criteria. For instance, only 17.27% of the space categorized as suitable fully meets the construction requirements, while the remaining 82.73% have development potential to some extent. This is largely restricted by the natural resources and environmental conditions of the study area, particularly the topography indicator. When formulating land use plans, it is necessary to be very careful and meticulous, judging the advantages and disadvantages of urban development comprehensively. Appropriate transformation of urban spaces into ecological and agricultural spaces should be considered. Following a comprehensive assessment of their positive developmental value, construction should proceed scientifically and sustainably.
4.3. Spatial Planning Strategies Analyzing Flood Risk
Under the comprehensive scenarios of sea level rise due to climate change and extreme climate events, the flood risk in the future built-up areas of the study area was simulated. Based on the results of suitability evaluation and scenario analysis, the northern and southeastern areas, which are suitable for urban development, exhibit varying degrees of flood exposure risk. Spatial planning strategies are proposed for these regions.
The urban built-up areas are predominantly located in the northern part of the study area, with large mountainous terrain to the east, which can to some extent mitigate the impact on urban land during flooding and tidal events. Considering the topography and intensive land use, priority is given to urban development in the northern area over the southeastern area. As one of the most effective planning tools for climate change adaptation and mitigation [38], the combination of green and gray infrastructure can maximize spatial benefits in reducing flood risks for cities [68,69]. This applies to all available land suitable for development within the study area.
In the northern area, a comprehensive flood risk assessment should be conducted initially for the built-up urban center. Several flood control measures need to be implemented, including, but not limited to, the construction of flood control facilities, improvements to drainage systems, and the implementation of an early warning system for meteorological hazards. With the inevitable rise in impervious surfaces resulting from urban land utilization, it is crucial to consider incorporating green infrastructure into streets, public buildings, and open spaces during the development process. Additionally, future land development should focus on the integration of construction land with green spaces and water bodies to promote low-impact development [70]. The proactive implementation of pervious surfaces, green roofs, rain gardens [69], and other infrastructures contributes to enhancing resilience against flooding disasters. For high-risk areas, such as low-lying areas around wetlands, the possibility of converting them into green areas or open spaces should be considered.
For the southeastern area, its topography and location conditions provide ample room for development, but also increase vulnerability to flood threats. Unlike the northern area, this region should prioritize ecological conservation and moderately promote urban development under reasonable guidance. For example, it is necessary to prioritize the protection of riverbank areas and wetlands and establish stream buffer zones, local natural regeneration areas, and rainwater parks [71]. For large tracts of existing cropland, selective fallowing and reforestation should be undertaken to increase forest greening and optimize vegetation structure appropriately. Additionally, the effective utilization of waterfront spaces and the rational planning of canals, wetlands, and ecological parks as water storage and detention areas can both be considered strategies to mitigate flood risk [72].
5. Conclusions
The evaluation of urban land suitability in Hangzhou’s Xihu District and the analysis under multiple climate change scenarios help the urban system better cope with the challenges of climate change. The empirical insights delivered by the evaluation results are as follows: (1) More than half of the land in the study area is suitable for construction, and the spatial distribution is basically consistent with the current planned urban land. (2) The study area has a higher proportion of land unsuitable for construction compared to other urban areas in Hangzhou, necessitating careful planning for non-construction areas based on specific spatial development needs. (3) Approximately 10–20% of the urban land in the study area may be threatened by flooding in the next century, primarily concentrated in the northern and southeastern regions. (4) In addition to coping with flood risk due to climate change, urban land should improve its resilience to extreme weather events.
The application of the entropy weight and matter-element model optimizes the method of land suitability evaluation. It not only accurately displays the spatial distribution, but also analyzes the development strengths and limiting factors of each land unit. Based on evaluation results and flood risk simulations under climate change, this study proposes spatial planning strategies for key research areas, including construction land layout, the implementation of gray–green infrastructure, and land function replacement, providing decision-making references for addressing flood risk and mitigating climate change.
In formulating conclusions from this study, several limitations should be considered. In the process of multi-scenario analysis, predictions of flood risk exposure due to climate change were reliant on existing land suitability zoning. It is rooted in the assumption that land suitability will persist unchanged in the future. However, the dynamism inherent in urban land use patterns challenges this assumption. Concerning the indicators of land suitability, the preferences of planning decision-makers and the role of public participation have been overlooked, presenting potential additional influencing factors.
In future research, careful attention should be devoted to understanding the evolving characteristics of land suitability under various climate change scenarios. Furthermore, expanding relevant research to include broader urban regional scales is recommended.
Author Contributions
Conceptualization, F.W.; methodology, F.W. and C.R.; software, C.R.; formal analysis, C.R.; writing—original draft preparation, C.R.; writing—review and editing, F.W.; visualization, C.R.; project administration, F.W. All authors have read and agreed to the published version of the manuscript.
Funding
This research received no external funding.
Institutional Review Board Statement
Not applicable.
Informed Consent Statement
Not applicable.
Data Availability Statement
The data presented in this study are available on request from the corresponding author.
Conflicts of Interest
The authors declare no conflicts of interest.
References
- Xie, H.; Zhang, Y.; Duan, K. Evolutionary Overview of Urban Expansion Based on Bibliometric Analysis in Web of Science from 1990 to 2019. Habitat Int. 2020, 95, 102100. [Google Scholar] [CrossRef]
- Ustaoglu, E.; Aydinoglu, A.C. Suitability Evaluation of Urban Construction Land in Pendik District of Istanbul, Turkey. Land Use Pol. 2020, 99, 104783. [Google Scholar] [CrossRef]
- Li, Q.; Huang, J.; Wang, C.; Lin, H.; Zhang, J.; Jiang, J.; Wang, B. Land Development Suitability Evaluation of Pingtan Island Based on Scenario Analysis and Landscape Ecological Quality Evaluation. Sustainability 2017, 9, 1292. [Google Scholar] [CrossRef]
- Malczewski, J. GIS-Based Land-Use Suitability Analysis: A Critical Overview. Prog. Plan. 2004, 62, 3–65. [Google Scholar] [CrossRef]
- IPCC. Summary for Policymakers. In Climate Change and Land: IPCC Special Report on Climate Change, Desertification, Land Degradation, Sustainable Land Management, Food Security, and Greenhouse Gas Fluxes in Terrestrial Ecosystems; Cambridge University Press: Cambridge, UK; New York, NY, USA, 2022; pp. 1–36. [Google Scholar] [CrossRef]
- IPCC. Summary for Policymakers. In Global Warming of 1.5 °C. An IPCC Special Report on the Impacts of Global Warming of 1.5 °C above Pre-Industrial Levels and Related Global Greenhouse Gas Emission Pathways, in the Context of Strengthening the Global Response to the Threat of Climate Change, Sustainable Development, and Efforts to Eradicate Poverty; Cambridge University Press: Cambridge, UK; New York, NY, USA, 2018; pp. 3–24. [Google Scholar] [CrossRef]
- Fox-Kemper, B.; Hewitt, H.T.; Xiao, C.; Aðalgeirsdóttir, S.S.; Drijfhout, T.L.; Edwards, N.R.; Golledge, M.; Hemer, R.E.; Kopp, G.; Krinner, A.; et al. Ocean, Cryosphere and Sea Level Change. In Climate Change 2021: The Physical Science Basis. Contribution of Working Group I to the Sixth Assessment Report of the Intergovernmental Panel on Climate Change; Cambridge University Press: Cambridge, UK; New York, NY, USA, 2021; pp. 1211–1362. [Google Scholar] [CrossRef]
- Qing, J.; Wang, Z.; Zhang, Z. Suitability Assessment of Tobacco-Planted Land Based on RBF (Radial Basis Function) Neural Network. J. Southwest Univ. 2008, 30, 122–127. [Google Scholar]
- Fang, X. The Research on Suitability Assessment of Construction Land in Hang Zhou. Master’s Thesis, China University of Geosciences, Wuhan, China, 2008. [Google Scholar]
- Xu, K.; Kong, C.; Li, J.; Zhang, L. GEO-Environmental Suitability Evaluation of Land for Urban Construction Based on A Back-Propagation Neural Network and GIS: A Case Study of Hangzhou. Phys. Geogr. 2012, 33, 457–472. [Google Scholar] [CrossRef]
- Kang, Z.; Wang, S.; Xu, L.; Yang, F.; Zhang, S. Suitability Assessment of Urban Land Use in Dalian, China Using PNN and GIS. Nat. Hazards 2021, 106, 913–936. [Google Scholar] [CrossRef]
- Chen, Y.; Yu, J.; Khan, S. Spatial sensitivity analysis of multi-criteria weights in GIS-based land suitability evaluation. Environ. Modell. Softw. 2010, 25, 1582–1591. [Google Scholar] [CrossRef]
- Zhao, X. Evaluation on Suitability of Cultivated Land Suitability Based on Weights Sensitivity for Analysis Hunan Province. Master’s Thesis, Henan University, Zhengzhou, China, 2014. [Google Scholar]
- Ding, Y. Ecological Suitability Evaluation of Urban Construction Land Based on ANP-GIS Coupling Model—A Case Study of Changchun City. Master’s Thesis, Jilin University, Changchun, China, 2018. [Google Scholar]
- Montgomery, B.; Dragićević, S.; Dujmović, J. Using Soft Computing Logic and the Logic Scoring of Preference Method for Agricultural Land Suitability Evaluation. In Advances in Geocomputation, 13th International Conference on Geocomputation (Geocomputation), Univ Texas Dallas, Dallas, TX, USA, 20–23 May 2015; Griffith, D.A., Chun, Y., Dean, D.J., Eds.; Springer International Publishing: Cham, Switzerland, 2017; pp. 217–227. [Google Scholar]
- Dragićević, S.; Dujmović, J.; Minardi, R. Modeling Urban Land-Use Suitability with Soft Computing: The GIS-LSP Method. In GeoComputational Analysis and Modeling of Regional Systems; Thill, J.-C., Dragicevic, S., Eds.; Advances in Geographic Information Science; Springer International Publishing: Cham, Switzerland, 2018; pp. 257–275. ISBN 978-3-319-59511-5. [Google Scholar]
- Jiang, H.; Eastman, J.R. Application of Fuzzy Measures in Multi-Criteria Evaluation in GIS. Int. J. Geogr. Inf. Sci. 2000, 14, 173–184. [Google Scholar] [CrossRef]
- Mokarram, M.; Mirsoleimani, A. Using Fuzzy-AHP and Order Weight Average (OWA) Methods for Land Suitability Determination for Citrus Cultivation in ArcGIS (Case Study: Fars Province, Iran). Phys. A Stat. Mech. Its Appl. 2018, 508, 506–518. [Google Scholar] [CrossRef]
- Burrough, P.A.; McDonnell, R.A. Principles of Geographical Information Systems; Oxford University Press: Oxford, UK, 1998. [Google Scholar]
- Chen, S.; Chai, C.; Su, Y. Variable fuzzy sets methods and application on land suitability evaluation. Trans. Chin. Soc. Agric. Eng. 2007, 3, 95–97. [Google Scholar]
- Qiu, F.; Chastain, B.; Zhou, Y.; Zhang, C.; Sridharan, H. Modeling Land Suitability/Capability Using Fuzzy Evaluation. GeoJournal 2014, 79, 167–182. [Google Scholar] [CrossRef]
- Li, X.; Wang, J.; Shao, X. Progress in the Application of Fuzzy Mathematics Methods in China Land Resource Evaluation. Prog. Geogr. 2009, 28, 409–416. [Google Scholar]
- Alexander, S.M.; Waters, N.M.; Paquet, P.C. A Probability-Based GIS Model for Identifying Focal Species Linkage Zones across Highways in the Canadian Rocky Mountains. In Applied GIS and Spatial Analysis; John Wiley & Sons, Ltd.: Hoboken, NJ, USA, 2003; pp. 233–255. ISBN 978-0-470-87133-1. [Google Scholar]
- Lv, L. Land Suitability Assessment Model Based on Weights of Evidence Method and Its Application—A Case Study of Jinan, China. Ph.D. Dissertation, China University of Geosciences, Beijing, China, 2013. [Google Scholar]
- Jin, G.; Wang, Z.; Hu, X.; Hu, S.; Zhang, D. Land suitability evaluation in Qinghai-Tibet Plateau based on fuzzy weight of evidence model. Trans. Chin. Soc. Agric. Eng. 2013, 29, 241–250. [Google Scholar]
- Rossiter, D.G. ALES: A Framework for Land Evaluation Using a Microcomputer. Soil Use Manag. 1990, 6, 7–20. [Google Scholar] [CrossRef]
- Wu, T.; Dong, W.; Luo, J.; Sun, Y.; Huang, Q.; Wu, W.; Hu, X. Geo-Parcel-Based Geographical Thematic Mapping Using C5.0 Decision Tree: A Case Study of Evaluating Sugarcane Planting Suitability. Earth Sci. Inf. 2019, 12, 57–70. [Google Scholar] [CrossRef]
- Wang, S.; Liu, Y.; Wang, X.; Wu, C. Suitability evaluation of mining-land reclamation based on improved decision tree model. Sci. Soil Water Conserv. 2016, 14, 35–43. [Google Scholar] [CrossRef]
- Zhang, H.; Guo, Y.; Gao, B. Multi-model Suitability Assessment of Construction Land in Tsinling Mountains Based on the Niche Theory: A Case Study of Shangzhou, Shangluo. Geogr. Geo-Inf. Sci. 2016, 32, 83–89. [Google Scholar]
- Su, H.; Chen, J. The Application of Matter Element Analysis in Land Suitability Evaluation. J. Qufu Norm. Univ. 2005, 31, 115–119. [Google Scholar]
- Wei, H. Matter-element Extension Method and Empirical Study on Land Suitability Evaluation. Master’s Thesis, Guangxi University, Nanning, China, 2006. [Google Scholar]
- Gong, J.; Liu, Y.; Chen, W. Land Suitability Evaluation for Development Using a Matter-Element Model: A Case Study in Zengcheng, Guangzhou, China. Land Use Policy 2012, 29, 464–472. [Google Scholar] [CrossRef]
- Heumann, B.W.; Walsh, S.J.; McDaniel, P.M. Assessing the Application of a Geographic Presence-Only Model for Land Suitability Mapping. Ecol. Inform. 2011, 6, 257–269. [Google Scholar] [CrossRef] [PubMed]
- Seyedmohammadi, J.; Sarmadian, F.; Jafarzadeh, A.A.; McDowell, R.W. Development of a model using matter element, AHP and GIS techniques to assess the suitability of land for agriculture. Geoderma 2019, 352, 80–95. [Google Scholar] [CrossRef]
- Reckien, D.; Salvia, M.; Heidrich, O.; Church, J.M.; Pietrapertosa, F.; De Gregorio-Hurtado, S.; D’Alonzo, V.; Foley, A.; Simoes, S.G.; Krkoška Lorencová, E.; et al. How Are Cities Planning to Respond to Climate Change? Assessment of Local Climate Plans from 885 Cities in the EU-28. J. Clean. Prod. 2018, 191, 207–219. [Google Scholar] [CrossRef]
- Greiving, S.; Fleischhauer, M. National Climate Change Adaptation Strategies of European States from a Spatial Planning and Development Perspective. Eur. Plan. Stud. 2012, 20, 27–48. [Google Scholar] [CrossRef]
- Macintosh, A.; Foerster, A.; McDonald, J. Policy Design, Spatial Planning and Climate Change Adaptation: A Case Study from Australia. J. Environ. Plan. Manag. 2015, 58, 1432–1453. [Google Scholar] [CrossRef]
- Yiannakou, A.; Salata, K.-D. Adaptation to Climate Change through Spatial Planning in Compact Urban Areas: A Case Study in the City of Thessaloniki. Sustainability 2017, 9, 271. [Google Scholar] [CrossRef]
- Leibowicz, B.D. Urban Land Use and Transportation Planning for Climate Change Mitigation: A Theoretical Framework. Eur. J. Oper. Res. 2020, 284, 604–616. [Google Scholar] [CrossRef]
- Andrzejewska, A.K. Challenges of Spatial Planning in Poland in the Context of Global Climate Change—Selected Issues. Buildings 2021, 11, 596. [Google Scholar] [CrossRef]
- Demuzere, M.; Orru, K.; Heidrich, O.; Olazabal, E.; Geneletti, D.; Orru, H.; Bhave, A.G.; Mittal, N.; Feliu, E.; Faehnle, M. Mitigating and Adapting to Climate Change: Multi-Functional and Multi-Scale Assessment of Green Urban Infrastructure. J. Environ. Manag. 2014, 146, 107–115. [Google Scholar] [CrossRef]
- Kabisch, N.; Frantzeskaki, N.; Pauleit, S.; Naumann, S.; Davis, M.; Artmann, M.; Haase, D.; Knapp, S.; Korn, H.; Stadler, J.; et al. Nature-Based Solutions to Climate Change Mitigation and Adaptation in Urban Areas: Perspectives on Indicators, Knowledge Gaps, Barriers, and Opportunities for Action. Ecol. Soc. 2016, 21, 39. [Google Scholar] [CrossRef]
- Sharifi, A. Co-Benefits and Synergies between Urban Climate Change Mitigation and Adaptation Measures: A Literature Review. Sci. Total Environ. 2021, 750, 141642. [Google Scholar] [CrossRef] [PubMed]
- Gurran, N.; Hamin Infield, E.; Norman, B. Planning for Climate Change: Leading Practice Principles and Models for Sea Change Communities in Coastal Australia; Faculty of Architecture, University of Sydney: Sydney, Australia, 2008. [Google Scholar]
- Francesch-Huidobro, M.; Dabrowski, M.; Tai, Y.; Chan, F.; Stead, D. Governance Challenges of Flood-Prone Delta Cities: Integrating Flood Risk Management and Climate Change in Spatial Planning. Prog. Plan. 2017, 114, 1–27. [Google Scholar] [CrossRef]
- IPCC. Summary for Policymakers. In IPCC Special Report on the Ocean and Cryosphere in a Changing Climate; Cambridge University Press: Cambridge, UK; New York, NY, USA, 2019; pp. 3–35. [Google Scholar] [CrossRef]
- Liu, Z.; Yang, Y.; He, C.; Tu, M. Climate change will constrain the rapid urban expansion in drylands: A scenario analysis with the zoned land use scenario dynamics-urban model. Sci. Total Environ. 2019, 651, 2772–2786. [Google Scholar] [CrossRef] [PubMed]
- Chen, G.; Xie, J.; Li, W.; Li, X.; Chung, L.C.H.; Ren, C.; Liu, X. Future “Local Climate Zone” Spatial Change Simulation in Greater Bay Area under the Shared Socioeconomic Pathways and Ecological Control Line. Build. Environ. 2021, 203, 108077. [Google Scholar] [CrossRef]
- Li, S.; Juhász-Horváth, L.; Pedde, S.; Pintér, L.; Rounsevell, M.D.A.; Harrison, P.A. Integrated Modelling of Urban Spatial Development under Uncertain Climate Futures: A Case Study in Hungary. Environ. Model. Softw. 2017, 96, 251–264. [Google Scholar] [CrossRef]
- Yue, Y.; Zhang, P.; Shang, Y. The Potential Global Distribution and Dynamics of Wheat under Multiple Climate Change Scenarios. Sci. Total Environ. 2019, 688, 1308–1318. [Google Scholar] [CrossRef] [PubMed]
- Hung, C.-L.J.; James, L.A.; Carbone, G.J.; Williams, J.M. Impacts of Combined Land-Use and Climate Change on Streamflow in Two Nested Catchments in the Southeastern United States. Ecol. Eng. 2020, 143, 105665. [Google Scholar] [CrossRef]
- Huang, J.; Tang, Z.; Liu, D.; He, J. Ecological Response to Urban Development in a Changing Socio-Economic and Climate Context: Policy Implications for Balancing Regional Development and Habitat Conservation. Land Use Policy 2020, 97, 104772. [Google Scholar] [CrossRef]
- Lv, H.; Guan, X.; Meng, Y. Comprehensive Evaluation of Urban Flood-Bearing Risks Based on Combined Compound Fuzzy Matter-Element and Entropy Weight Model. Nat. Hazards 2020, 103, 1823–1841. [Google Scholar] [CrossRef]
- Avashia, V.; Garg, A. Implications of Land Use Transitions and Climate Change on Local Flooding in Urban Areas: An Assessment of 42 Indian Cities. Land Use Pol. 2020, 95, 104571. [Google Scholar] [CrossRef]
- Muis, S.; Güneralp, B.; Jongman, B.; Aerts, J.C.J.H.; Ward, P.J. Flood Risk and Adaptation Strategies under Climate Change and Urban Expansion: A Probabilistic Analysis Using Global Data. Sci. Total Environ. 2015, 538, 445–457. [Google Scholar] [CrossRef] [PubMed]
- Wei, F.; Zhao, L. The Effect of Flood Risk on Residential Land Prices. Land 2022, 11, 1612. [Google Scholar] [CrossRef]
- Annual Damage Statistics of Natural Disasters in Zhejiang Province. Available online: http://www.rencity.zju.edu.cn/zhejiangDisasterLoss/#FloodSec-eco (accessed on 3 April 2024).
- Lee, J.-Y.; Marotzke, J.; Bala, G.; Cao, L.; Corti, S.; Dunne, J.P.; Engelbrecht, F.; Fischer, E.; Fyfe, J.C.; Jones, C.; et al. Future Global Climate: Scenario-Based Projections and NearTerm Information. In Climate Change 2021: The Physical Science Basis. Contribution of Working Group I to the Sixth Assessment Report of the Intergovernmental Panel on Climate Change; Cambridge University Press: Cambridge, UK; New York, NY, USA, 2021; pp. 553–672. [Google Scholar] [CrossRef]
- Zong, Y.; Wang, R.; Wang, C.; Wang, H.; Zhang, L. Ecological suitability assessment on land use based on potential-constrain approach: The case of urbanized areas in Dalian city, China. Geogr. Res. 2007, 26, 1117–1126+1305. [Google Scholar]
- Luo, X.; Zhou, X.; Yang, J.; Jiang, X.; Zhang, J.; Li, H. Suitability evaluation of land and space development and construction in central Guizhou Economic Zone based on different development situations. Ecol. Sci. 2021, 40, 211–221. [Google Scholar] [CrossRef]
- Zhao, H.; Chen, C. A Positive Study of Urban Construction Suitability Evaluation Based on FLUS Model, Foshan. Planners 2020, 36, 86–92. [Google Scholar]
- Nong, X.; Wu, B.; Chen, T.; Chen, L. Evaluation of National Land Use and Space for Functions of “Production, Life, Ecology”, Liuzhou. Planners 2020, 36, 26–32. [Google Scholar]
- Hoque, I.; Rohatgi, S. Identification of Potential Urban Residential Area by Integrating AHP and WCL in RS and GIS Environment: A Case Study of Siliguri Municipal Corporation and Its Buffer of 7 Km, West Bengal. J. Indian Soc. Remote Sens. 2022, 50, 1437–1456. [Google Scholar] [CrossRef]
- Li, W.; Li, P.; Feng, Z.; Xiao, C. GIS-Based Modeling of Human Settlement Suitability for the Belt and Road Regions. Int. J. Environ. Res. Public Health 2022, 19, 6044. [Google Scholar] [CrossRef] [PubMed]
- Cai, W. Matter-Element Model and Its Application; Science and Technology Literature Press: Beijing, China, 1994. [Google Scholar]
- Cai, W. Extension theory and its application. Chin. Sci. Bull. 1999, 44, 673–682. [Google Scholar] [CrossRef]
- Storch, H.; Downes, N.K. A Scenario-Based Approach to Assess Ho Chi Minh City’s Urban Development Strategies against the Impact of Climate Change. Cities 2011, 28, 517–526. [Google Scholar] [CrossRef]
- Alves, A.; Gersonius, B.; Kapelan, Z.; Vojinovic, Z.; Sanchez, A. Assessing the Co-Benefits of Green-Blue-Grey Infrastructure for Sustainable Urban Flood Risk Management. J. Environ. Manag. 2019, 239, 244–254. [Google Scholar] [CrossRef] [PubMed]
- Chen, W.; Wang, W.; Huang, G.; Wang, Z.; Lai, C.; Yang, Z. The Capacity of Grey Infrastructure in Urban Flood Management: A Comprehensive Analysis of Grey Infrastructure and the Green-Grey Approach. Int. J. Disaster Risk Reduct. 2021, 54, 102045. [Google Scholar] [CrossRef]
- Yang, N. Study on the Land Suitability Evaluation of Small Watershed on Rainfall Flood Safety in Changsha Su Yu Embankment. Master’s Thesis, Hunan University, Changsha, China, 2015. [Google Scholar]
- Apud, A.; Faggian, R.; Sposito, V.; Martino, D. Suitability Analysis and Planning of Green Infrastructure in Montevideo, Uruguay. Sustainability 2020, 12, 9683. [Google Scholar] [CrossRef]
- Jones, S.; Somper, C. The Role of Green Infrastructure in Climate Change Adaptation in London. Geogr. J. 2014, 180, 191–196. [Google Scholar] [CrossRef]
Figure 1.
Research framework.

Figure 2.
Study area.
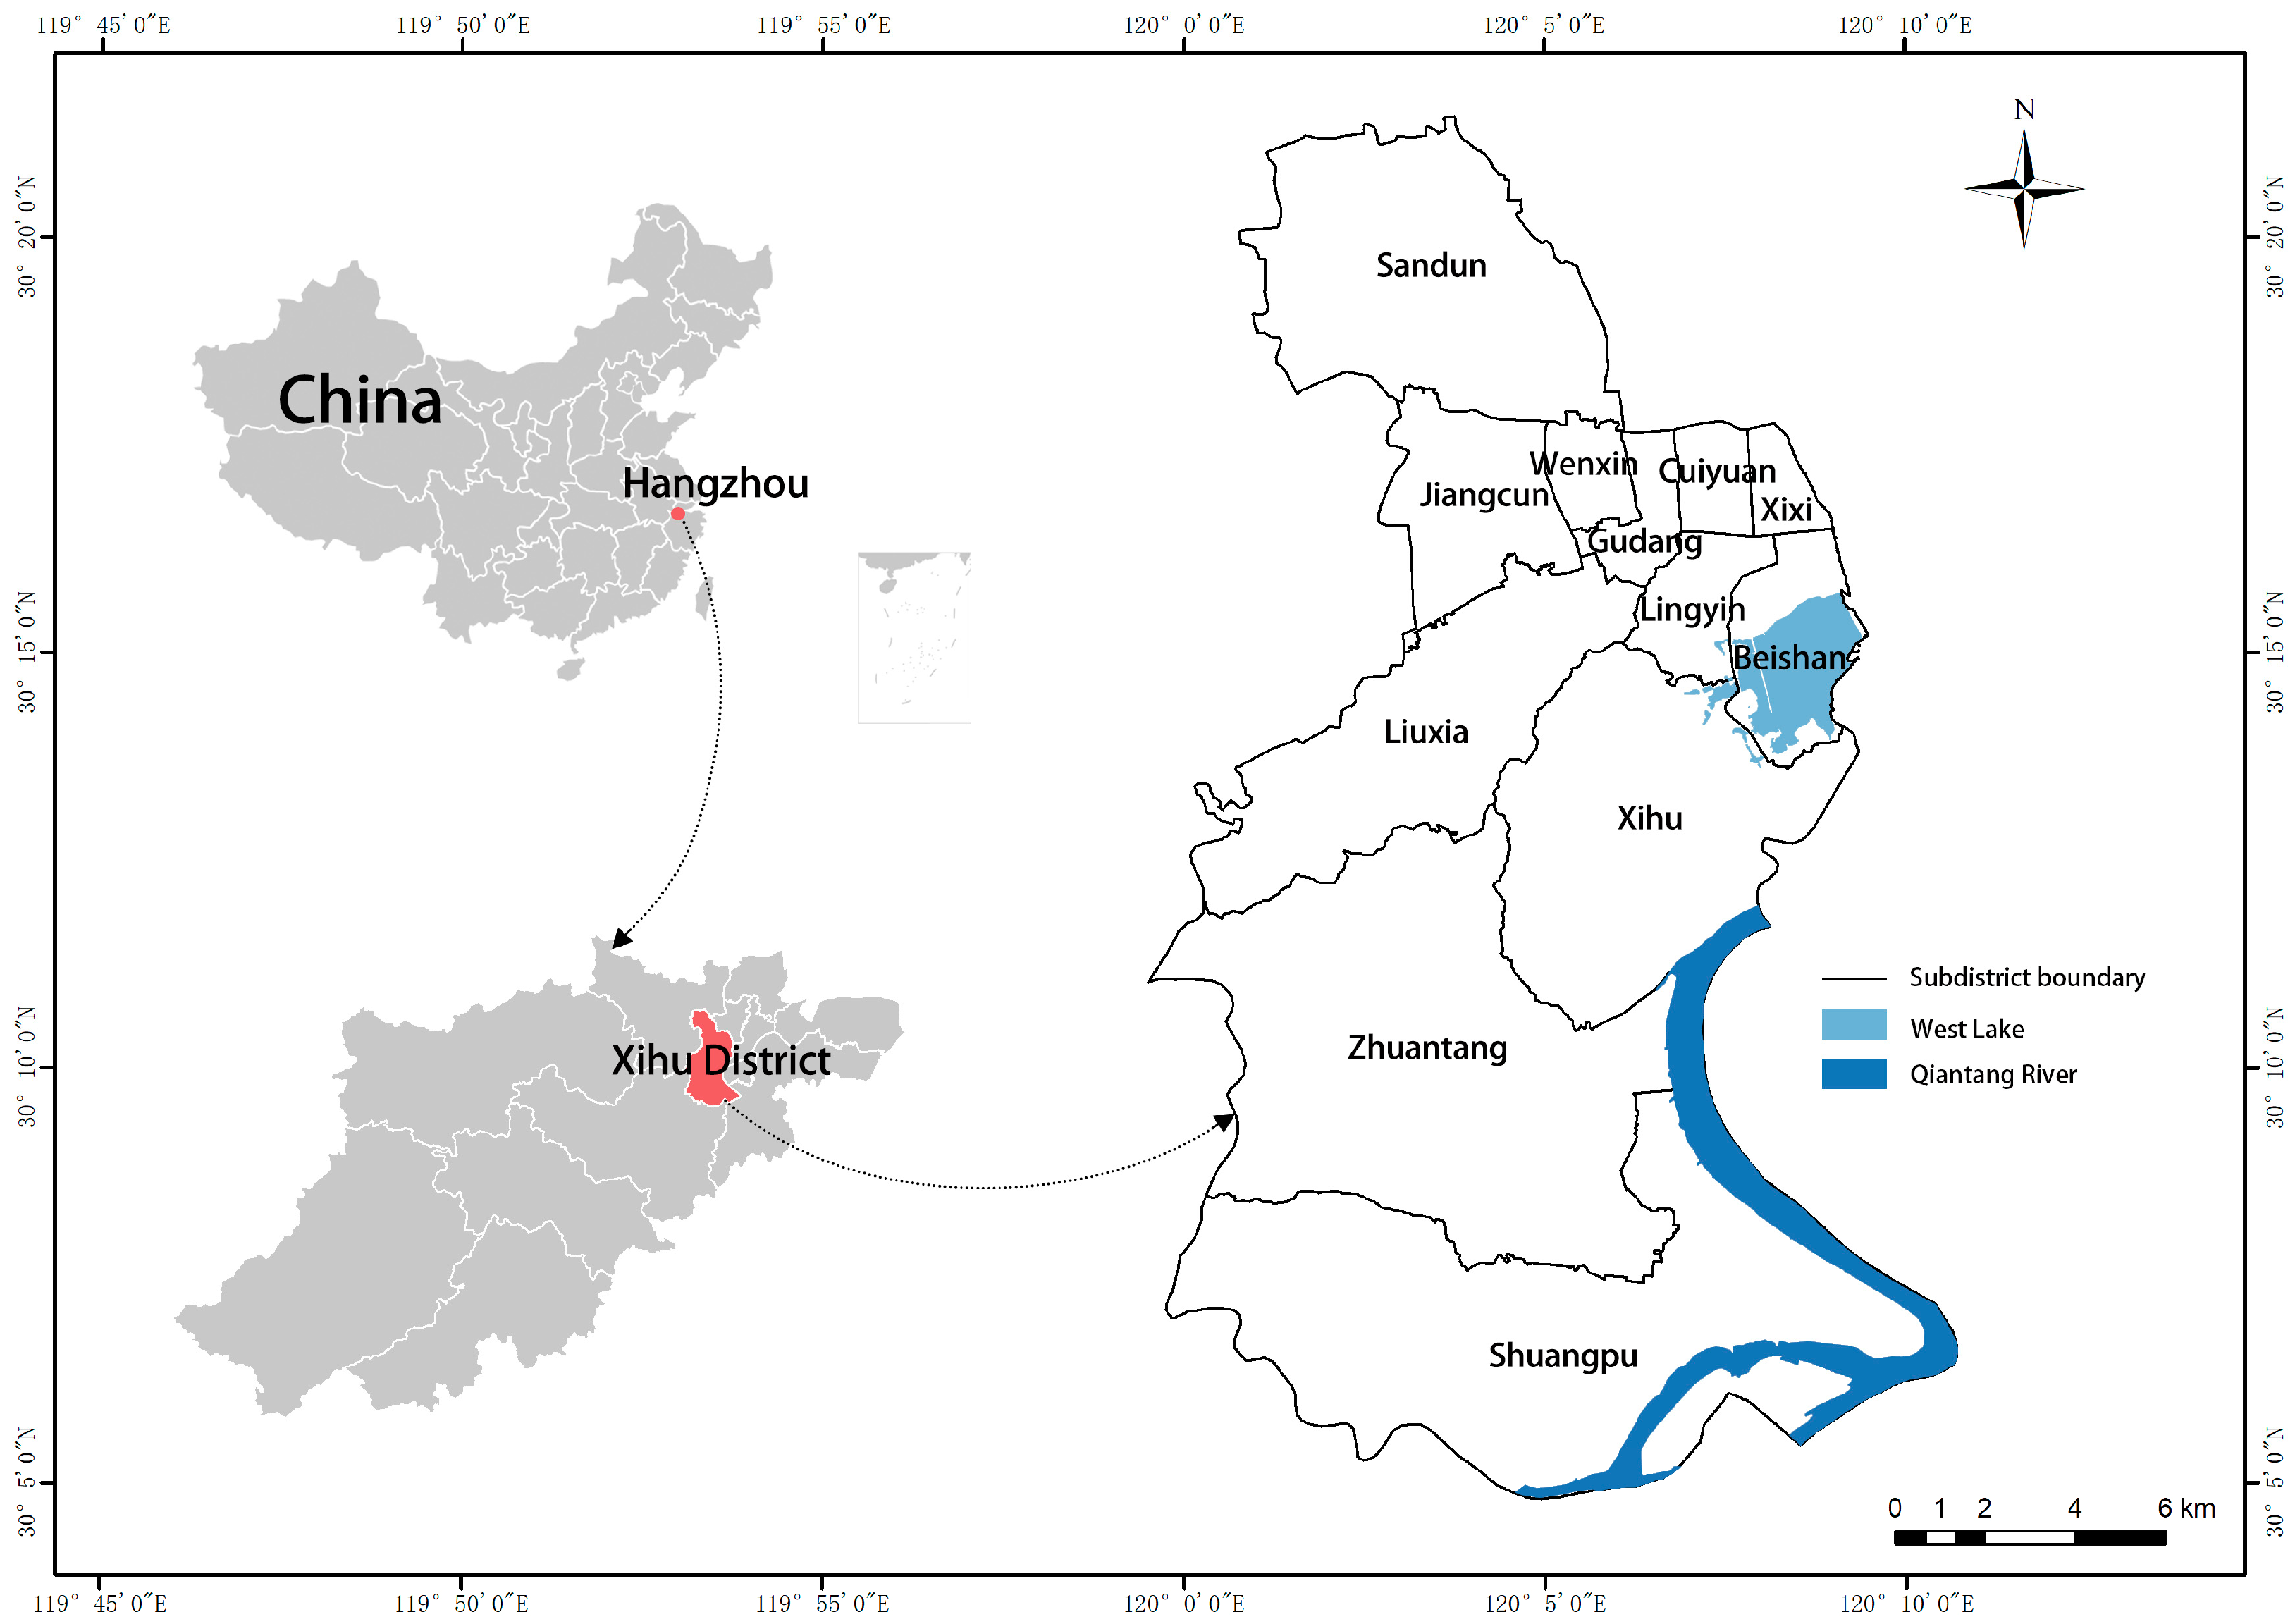
Figure 3.
Single-factor evaluation chart of each indicator: (a) slope, (b) elevation, (c) topographic relief, (d) temperature humidity index, (e) distance from rivers, (f) susceptibility to geological disasters, (g) land cover, (h) accessibility of traffic arteries, (i) accessibility of traffic hubs, and (j) road network density.

Figure 4.
Sea level changes under extreme climate events in Zhejiang Province from 2017 to 2021.
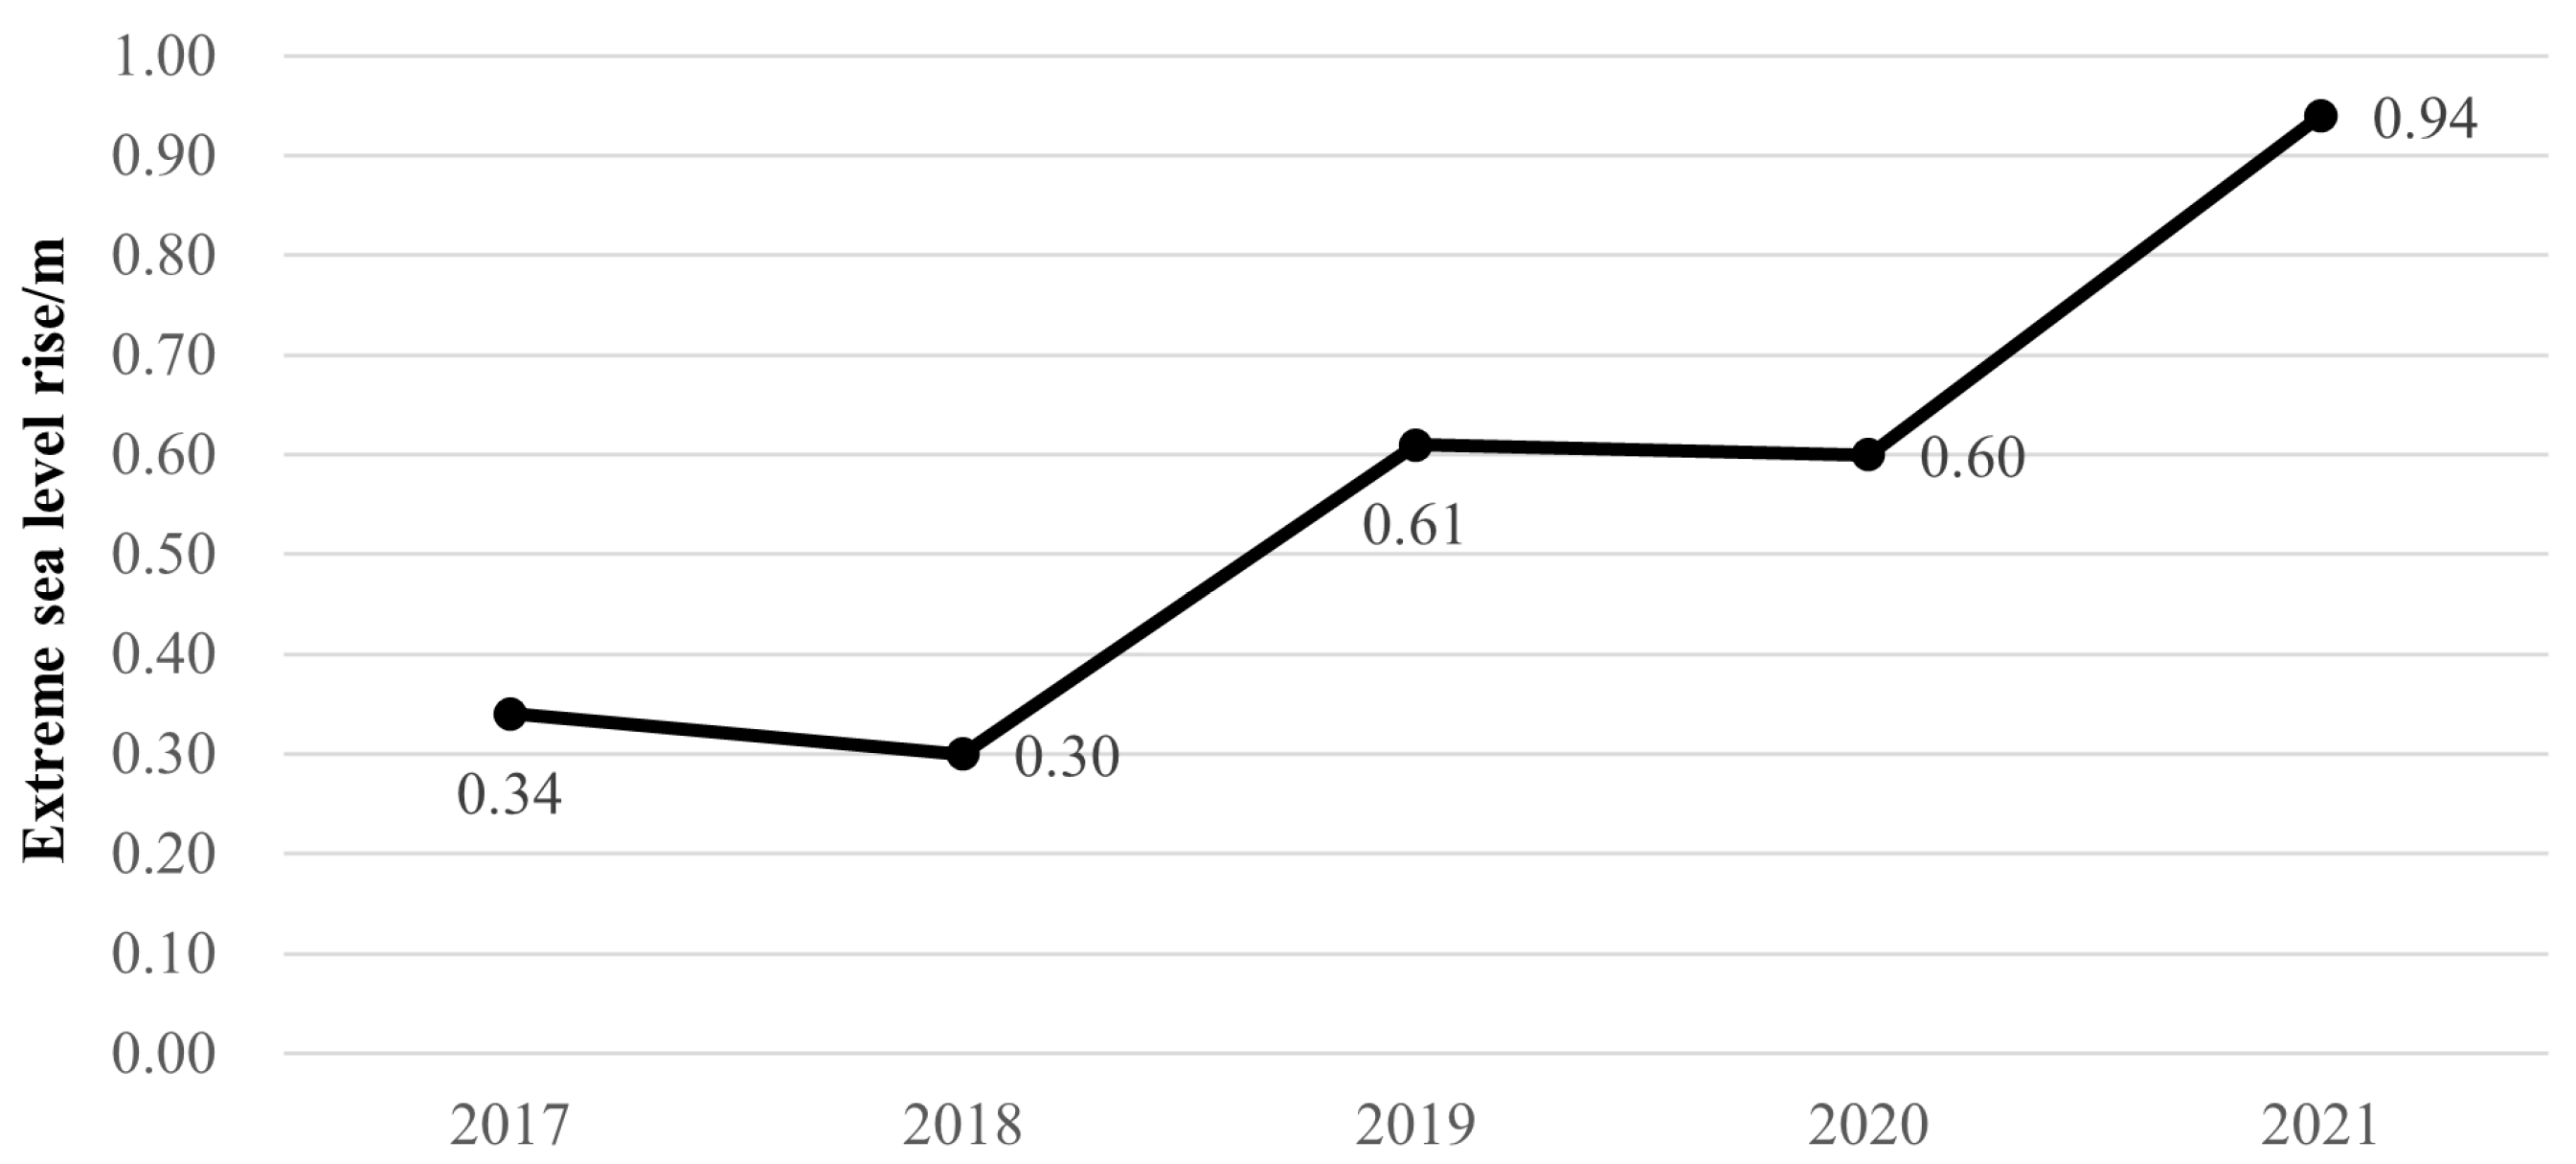
Figure 5.
(a) Distribution of suitability grades of urban land; (b) land use plans of Xihu District, 2020; (c) overlay map of land use plans and evaluation results.
Figure 5.
(a) Distribution of suitability grades of urban land; (b) land use plans of Xihu District, 2020; (c) overlay map of land use plans and evaluation results.
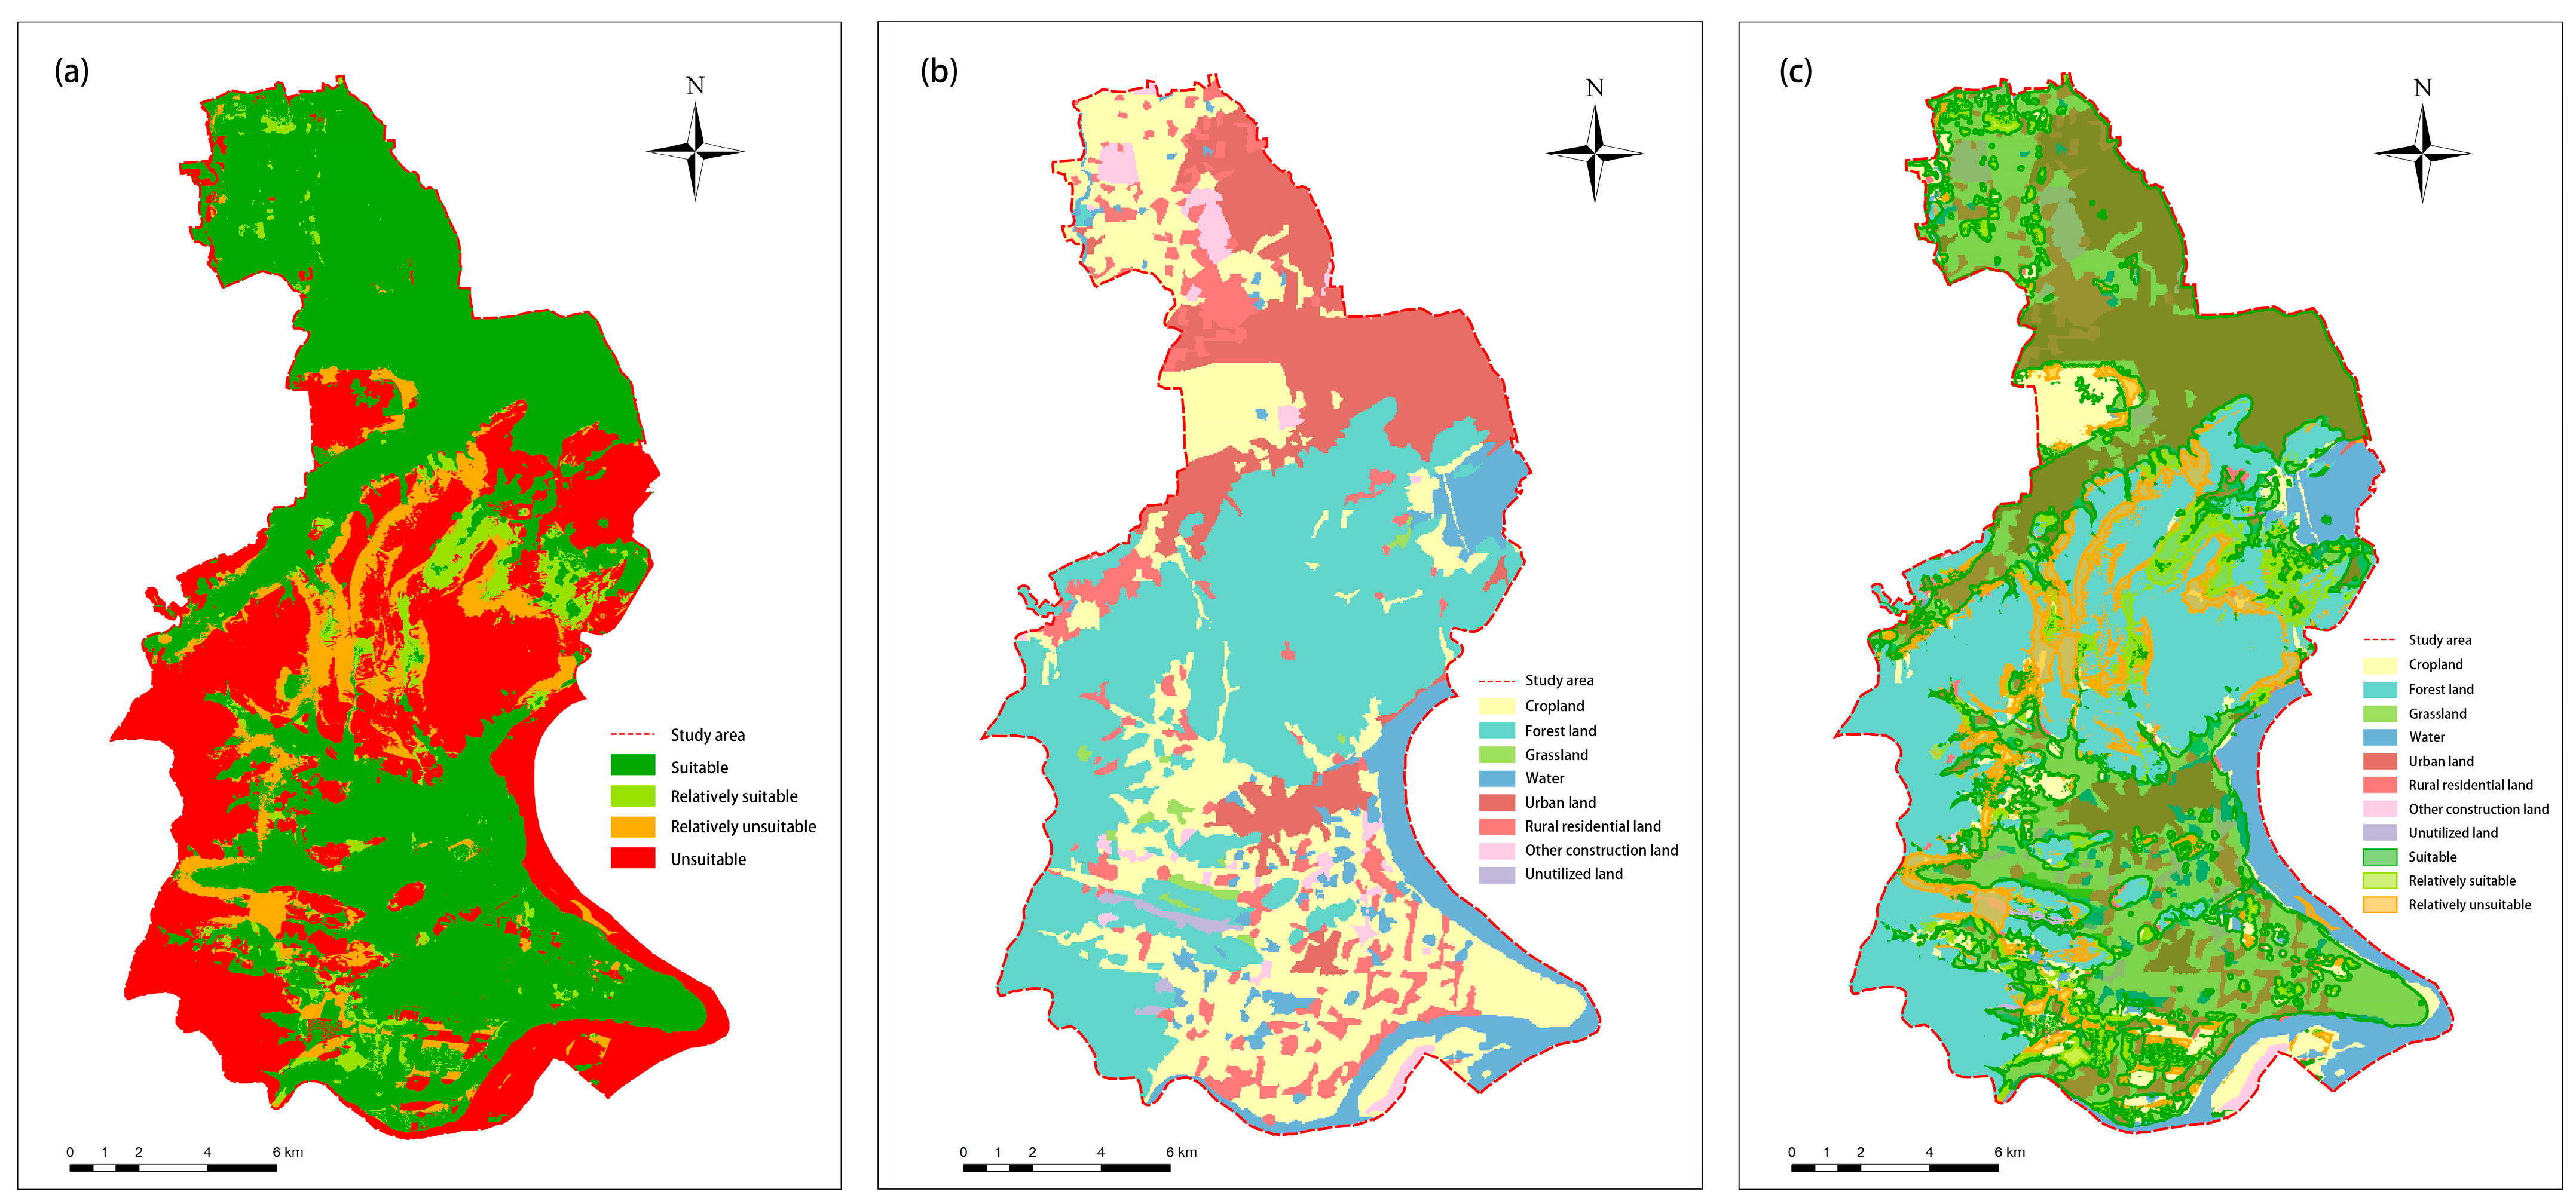
Figure 6.
Spatial distribution of flood risk in future construction areas under different sea level rise scenarios. Note: The values in the lower-right corner of the figure show the built-up areas of towns that may be affected by flooding in the future and their percentage of the total area.
Figure 6.
Spatial distribution of flood risk in future construction areas under different sea level rise scenarios. Note: The values in the lower-right corner of the figure show the built-up areas of towns that may be affected by flooding in the future and their percentage of the total area.

Table 1.
Selection of indicators in the literature for land suitability evaluation.
| Perspectives of Indicator Selection | Types | Indicators |
|---|---|---|
| Geographic Resource Conditions | Topography | Slope, elevation, topographic relief |
| Natural Resources | Vegetation coverage, total water resources, available water resource potential, water sources, ecological reserves | |
| Natural Disasters | Landslides and debris flows, geological hazard susceptibility, ecosystem vulnerability, seismic hazard | |
| Climate Environment | Water area proportion, distance from water, temperature humidity index | |
| Economic Location Conditions | Traffic Location | Distance from built-up areas, distance from major traffic arteries, traffic network density, accessibility of transportation arteries, accessibility of transportation hubs, accessibility of central city |
| Socioeconomic | Economic level, land use, population density, scale of existing developed urban areas, land cover index |
Table 2.
Land suitability grades and quantitative criteria.
| Evaluation Grades | Suitable | Relatively Suitable | Relatively Unsuitable | Unsuitable |
|---|---|---|---|---|
| Slope (°) | <6 | 6–15 | 15–25 | >25 |
| Elevation (m) | <52 | 52–136 | 136–247 | >247 |
| Topographic relief (m) | <50 | 50–100 | 100–200 | >200 |
| Temperature humidity index | 24.6–25.4 | 25.4–25.7 | 25.7–25.9 | 25.9–26.3 |
| Distance from rivers (km) | 0–1.17 | 1.17–2.96 | 2.96–5.15 | 5.15–8.76 |
| Susceptibility to geological disasters | Unsusceptible | Relatively unsusceptible | Relatively susceptible | Susceptible |
| Land cover | Built area, Bare ground | Cropland | Flooded vegetation, Rangeland | Water, Forest land |
| Accessibility of traffic arteries | 8.8–13.2 | 13.2–17.3 | 17.3–21.6 | 21.6–28.7 |
| Accessibility of traffic hubs | 9.0–13.8 | 13.8–16.6 | 16.6–19.8 | 19.8–26.7 |
| Road network density (km/km2) | 1.62–3.25 | 1.04–1.62 | 0.42–1.04 | 0–0.42 |
Table 3.
Suitability evaluation indicator systems.
| Perspectives of Selection | Categories of Factors | Indicators | Weights |
|---|---|---|---|
| Natural Resource Environment (constraint factor) | Topography | . Slope | 0.059 |
| . Elevation | 0.062 | ||
| . Topographic relief | 0.073 | ||
| Climate environment | . Temperature humidity index | 0.134 | |
| . Distance from rivers | 0.035 | ||
| Disaster risk | . Susceptibility to geological disasters | 0.047 | |
| Economic Location Conditions (potential factor) | Land cover | . Land cover | 0.262 |
| Location condition | . Accessibility of traffic arteries | 0.057 | |
| . Accessibility of traffic hubs | 0.038 | ||
| Traffic network density | . Road network density | 0.233 |
Table 4.
Correlations between each indicator of and evaluation grade.
| Indicators | Suitable | Relatively Suitable | Relatively Unsuitable | Unsuitable |
|---|---|---|---|---|
| Slope | 0.31 | −0.31 | −0.72 | −0.83 |
| Elevation | 0.10 | −0.90 | −0.96 | −0.98 |
| Topographic relief | 0.27 | −0.73 | −0.88 | −0.92 |
| Temperature humidity index | −0.10 | 0.32 | −0.19 | −0.36 |
| Distance from rivers | −0.19 | 0.20 | −0.48 | −0.70 |
| Susceptibility to geological disasters | 0 | −1 | −1 | −1 |
| Land cover | 0 | −1 | −1 | −1 |
| Accessibility of traffic arteries | −0.19 | 0.34 | −0.32 | −0.55 |
| Accessibility of traffic hubs | −0.25 | 0.15 | −0.06 | −0.34 |
| Road network density | −0.92 | −0.88 | −0.70 | 0.30 |
Table 5.
Integrated correlation between matter element and evaluation grade.
| Evaluation Grade | Suitable | Relatively Suitable | Relatively Unsuitable | Unsuitable |
|---|---|---|---|---|
| Integrated Correlation | −0.21 | −0.57 | −0.70 | −0.53 |
Table 6.
Area statistics of different suitability grades.
| Evaluation Grade | Suitable | Relatively Suitable | Relatively Unsuitable | Unsuitable |
|---|---|---|---|---|
| Area (km2) | 160.70 | 13.82 | 25.60 | 111.18 |
| Percentage (%) | 51.62 | 4.44 | 8.23 | 35.71 |
Table 7.
Statistics and distribution of correlation values for each suitability grade.
| Evaluation Grade | Range of Values | Percentage of Positive and Negative Values | ||
|---|---|---|---|---|
| Minimum | Maximum | Negative Values | Positive Values | |
| Suitable | −0.46 | 0.17 | 82.73% | 17.27% |
| Relatively suitable | −0.42 | 0.084 | 99.77% | 0.23% |
| Relatively unsuitable | −0.44 | 0.27 | 98.82% | 1.18% |
| Unsuitable | −0.46 | 0.15 | 99.37% | 0.63% |
Table 8.
Sea level rise in 2100 under different scenario simulations.
| Year 2021 | SSP1-2.6 | SSP5-8.5 | |
|---|---|---|---|
| Global Mean Sea Level Rise (GMSLR) | / | 0.44 m | 0.77 m |
| Extreme Sea Level Rise (ESLR) | 0.94 m | 1.38 m | 1.71 m |
Note: The global mean sea level rise is all relative to the 1995–2014 mean sea level [3]. According to the 2021 China Sea Level Bulletin, the maximum extreme sea level event in Zhejiang Province occurred in October 2021.
Disclaimer/Publisher’s Note: The statements, opinions and data contained in all publications are solely those of the individual author(s) and contributor(s) and not of MDPI and/or the editor(s). MDPI and/or the editor(s) disclaim responsibility for any injury to people or property resulting from any ideas, methods, instructions or products referred to in the content. |
© 2024 by the authors. Licensee MDPI, Basel, Switzerland. This article is an open access article distributed under the terms and conditions of the Creative Commons Attribution (CC BY) license (https://creativecommons.org/licenses/by/4.0/).
Share and Cite
MDPI and ACS Style
Ruan, C.; Wei, F. Evaluation of Urban Land Suitability under Multiple Sea Level Rise Scenarios. Sustainability 2024, 16, 3485. https://doi.org/10.3390/su16083485
AMA Style
Ruan C, Wei F. Evaluation of Urban Land Suitability under Multiple Sea Level Rise Scenarios. Sustainability. 2024; 16(8):3485. https://doi.org/10.3390/su16083485
Chicago/Turabian StyleRuan, Chenxin, and Fang Wei. 2024. "Evaluation of Urban Land Suitability under Multiple Sea Level Rise Scenarios" Sustainability 16, no. 8: 3485. https://doi.org/10.3390/su16083485
Note that from the first issue of 2016, this journal uses article numbers instead of page numbers. See further details here.