
Deformation Mechanism of Underlying Sandy Soil Induced by Subway Traffic Vibrations

1
School of Civil Engineering, Southeast University, Nanjing 211189, China
2
School of Civil Engineering and Architecture, Jiangsu University of Science and Technology, Zhenjiang 212100, China
3
School of Civil Engineering and Architecture, Nanjing Communications Institute of Technology, Nanjing 210096, China
*
Author to whom correspondence should be addressed.
Sustainability 2024, 16(8), 3493; https://doi.org/10.3390/su16083493
Submission received: 18 February 2024
/
Revised: 11 April 2024
/
Accepted: 16 April 2024
/
Published: 22 April 2024
(This article belongs to the Topic Environmental Geology and Engineering)
Abstract
:The safety of the geotechnical environment around subways is vitally important for their sustainability. Ground settlement is a very common threat to the safe operation of subways and is related to subway traffic vibrations. Taking Nanjing subway line 10 as an example, field tests, discrete element simulations, and a grey relational analysis are carried out to study the deformation mechanism of the underlying sandy soil induced by vibrations. The results show that the vibration load of Nanjing subway Line 10 is mainly concentrated in the vertical direction. The particles’ coordination number below the subway increases under the vibration load, while the coordination number on the side of the tunnel decreases, which may cause a shear dilatancy effect. Among the five microscopic indexes, the local porosity and the coordination number are closely related to the deformation. Although the deformation of the underlying sandy soil is quite small under the subway traffic load, it will accumulate under frequent loading and then lead to urban engineering geological disasters.
1. Introduction
Subways are the main form of the urban railway system in China and have been popularized in megacities. As of December 2022, 53 cities in China have constructed more than 200 urban subway lines, with a total operating mileage of 9607 km. The safety of the geotechnical environment around subways is vitally important for their sustainability. Many studies indicate that long-term settlement is the main major threat to the safe operation of subways [1,2,3]. For example, the ground of Shanghai Subway Line 1 did not settle for more than two years after it was completed. However, the ground settlement reached 60 mm within eight months after the subway started running. The real cumulative land subsidence reached 140 mm within four years. The maximum accumulated settlement of the Hexi section of Nanjing Subway Line 2 during its operation from 2011 to 2014 reached 230 mm [2]. The settlement of Zhengzhou Metro Line 1 reached 70 mm in five years [3].
When subway trains are in operation, they vibrate [4]. Vibration waves are transmitted to the surrounding soil and other structures [5]. As a result, the vibration load of subways may cause the deformation and destruction of the surrounding soft strata and affect the health of the tunnel structure. This may be the main reason for the long-term settlement of subways [6]. The urban engineering geological problems induced by subway operation mostly occur in sandy soil, which is sensitive to cyclic vibration loads. According to geological profile data, sandy soil comprises more than 40% of most soil layers in China [7]. Subway tunnel crossings’ sandy soil layers are relatively long, and the deformation of sandy soil caused by subways operating is quite prominent. Therefore, it is of significance to study the deformation of sandy soil induced by subway traffic vibrations.
Scholars have carried out a lot of studies on the load characteristics of subway traffic. Timoshenko [8] proposed a classical model of rail dynamic stress based on a beam model with an elastic foundation, which established the basis of this field. After 1950, subway trains were regarded as moving loads, and the ideal elastic wave theory was used for most studies. Takemiya et al. [9] proposed several different types of mechanical models for the vibration excitation of subway trains. Nelson et al. [10] constructed a vibration expression that decays with distance based on the elastic layered ground model. In order to obtain more realistic results, some researchers conduct field measurements. Zhang et al. [11] carried out field measurements and vibration simulations for the transverse dynamic load and longitudinal dynamic load in the Beijing subway. Lei et al. [12] conducted field measurements for Nanchang West Railway Station Subway Line 2 and found that the vibration amplitude in the surrounding structure decreased exponentially with the increase in distance from the vibration source. Zheng et al. [13] conducted vibration measurements for special sites where subway traffic overlapped with road traffic and analyzed the test data in terms of the Z-vibration level and one-third octave spectrum. Xu et al. [14] conducted a study on the dynamic characteristics and vibration reduction performance of the broad-gauge sleeper track bed of Urumqi Subway Line 1 using a polyurethane curing agent. They found that both its running stability and vibration reduction performance were better than those of the ballastless track. Due to the limitations of testing methods and the costs involved, research on the vibration characteristics of subway traffic is mainly based on ground testing, and more studies are required for the underlying sand layer.
Using the discrete element method, the dynamic deformation characteristics of discontinuous sandy soil can be simulated microscopically [15,16,17,18]. Hu et al. [18] studied the dynamic characteristics of saturated compacted clayey sands in Nanchang Metro by PFC3D. Yimsiri [19] studied the effect of soil structure on soil mechanical behavior by numerical simulations using the discrete element method. Hu et al. [20] and Nguyen et al. [21] simulated and discussed the effect of the interaction between particles on the stress–strain behavior of materials by the discrete element method. Jiang et al. [22] researched the microstructural evolution of sandy soil by studying the coordination number and contact structure using the discrete element method. It was found that the evolution of the coordination number and contact structure are highly dependent on the relative density and load cycle mode. Yang et al. [23] and Yimsiri et al. [24] analyzed the effect of initial anisotropy on the macro- and micro-characteristics of soil by generating various soil samples with different deposition angles. Chen et al. [25] simulated direct shear tests under different vertical pressures to study the effects of particle movement and inter-particle contact force on shear dilatancy.
It is reported that the stress path of soil elements under traffic loads is more complicated than that caused by machine vibrations, waves, or earthquakes [26]. Richar et al. [27] and Das et al. [28] discussed the principle of vibration propagation in soil and the dynamic constitutive model of soil in detail. However, there are few studies on the deformation of sand under subway vibration loads, and the relationship between the macro- and micro-deformation characteristics of sand is still unclear. Taking Nanjing Subway Line 10 as an example, the deformation mechanism of the underlying sandy soil induced by subway traffic is studied through field tests, discrete element simulations, and the grey relational analysis method. A technical outline of this study is illustrated in Figure 1. According to this tudy, the changes in the microscopic indexes of sandy soil under vibration loads will lead to accumulated deformations, which could potentially result in urban engineering geological disasters. This research could be used as a reference for a settlement control design of sandy soil induced by subway traffic vibrations.
2. Field Tests of Subway Traffic Vibrations
In practice, subway vibration propagation is very complicated and may be easily affected by many factors, such as the number of passengers, their varying positions within the train, and soil inhomogeneity. Through field tests, the actual results of subway vibration propagation can be obtained, which are very necessary for research into its deformation mechanism.
2.1. Site and Test Procedures
The deformation characteristics of the sandy soil under the tunnel within our study are rather difficult to obtain by actual measurements. Therefore, we followed a more practical route and conducted ground tests to study the characteristics of the subway vibration propagation. Although the test results are not exactly the same as those under the subway, they are nonetheless helpful for setting the numerical simulation load conditions and conducting the soil deformation mechanism analysis. A test site was selected near Linjiang Station of Nanjing Subway Line 10, which is shown in Figure 2. This subway is the first single-hole, double-track shield tunnel crossing the Yangtze River in China, with a designed service life of 100 years. Its total length is 23.6 km, and it was built in four sections: the underground tunnel, above ground line, girder bridge, and tunnel crossing the river. The underground line is about 19.5 km, and the tunnel crossing the river is about 3.6 km. The subway with a diameter of 11.64 m is the largest in diameter in the tunnel crossing the river. The subway trains are organized into six-car A-type carriages. The maximum operating speed is 80 km/h, and the average operating speed is about 50 km/h. The acceleration is about 1 m/s2 when entering and leaving the station. The average time between trains is 6 min.
In order to reduce the impact of vibrations caused by the difference in train loads, our vibration tests are carried out during periods of low subway passenger flow. The test was conducted from 3:00 P.M. to 4:00 P.M. In addition, the vibrations generated when the subway trains start and use the brakes are quite different from those when they are driving at a constant speed. According to the subway’s design, the acceleration distance is about 250 m, and the braking distance is about 210 m. In order to reduce the interference of vehicle acceleration and braking as much as possible, we took measurements 300 m away from the station. The test points were on the ground right above Line 10. The subway tunnel’s buried depth is about 16 m in the test area, which is not as deep as the tunnel in the river-crossing section. Five measuring points, B1–B5, are arranged in the test area along a straight line perpendicular to the subway line. The interval between each measurement point is 10 m, and B1 is set directly above the subway tunnel, which is illustrated in Figure 3. A wireless vibration acceleration acquisition system is used for data acquisition. The sampling frequency is 280 Hz. The monitoring time is set to 20 s according to the train’s operation. A total of three tests were performed.
2.2. Analysis of Test Results
2.2.1. Principal Direction of the Vibrations
Figure 4 shows the 3D vibration test results for the measurement point B1. In the three-coordinate system, x, y indicate the parallel and perpendicular directions to the subway line at the grade line, respectively, and z indicates the direction perpendicular to the ground. As shown in Figure 4, the duration of the train’s vibration response is between 8 and 10 s. The maximum vibration acceleration, about 9 mg, is reflected in the z direction, which is one order larger than that in the other two directions. The vibration energies in the three directions are all concentrated between 60 and 70 Hz. However, the vibration energy is very different in each direction, and the vibration energy in the z direction is nearly a thousand times larger than that in the x and y directions. Our monitoring results show the vibration response is mainly in the z direction, which is consistent with previous research [29,30].
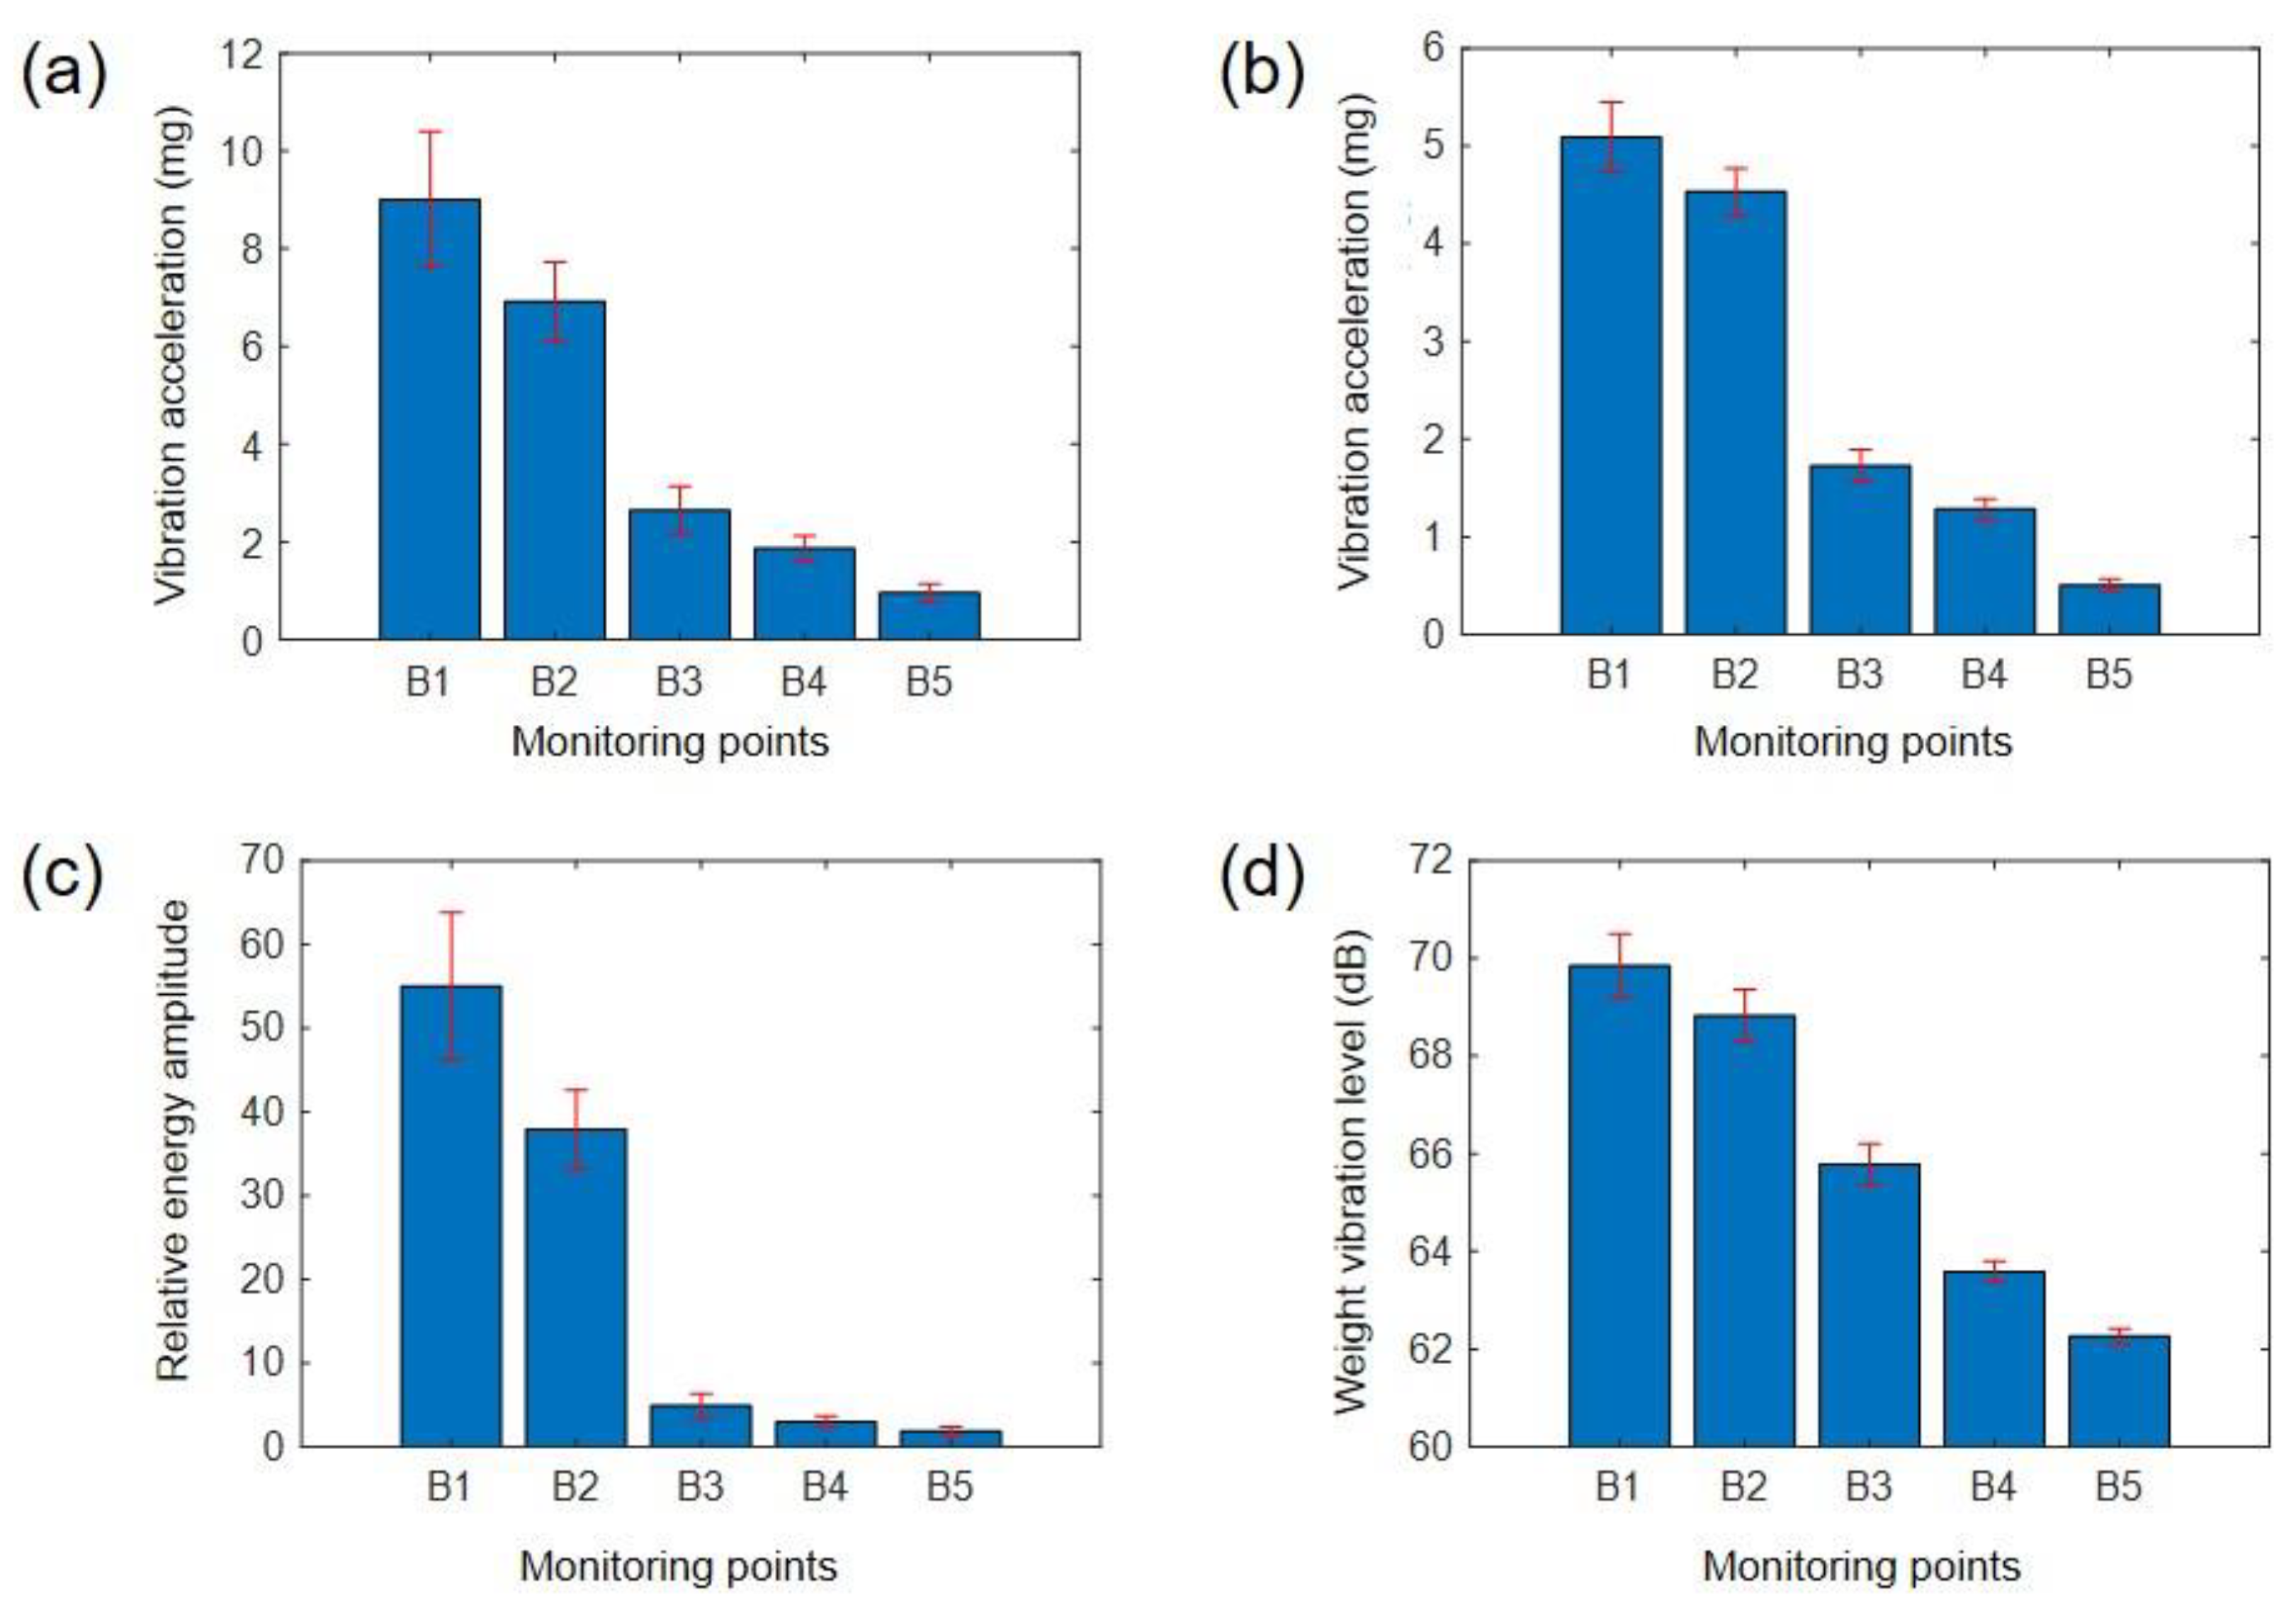
2.2.2. The Vibration Attenuation Characteristics
The time history spectrum of the vibration acceleration, Fourier transform vibration spectrum, HHT vibration energy spectrum, and one-third octave spectrum were analyzed for each measuring point. The test results are presented in Table 1 and illustrated in Figure 5. The peak ground acceleration of the time history spectrum and the peak ground acceleration of the FFT frequency spectrum fall quickly from B1 to B5. The maximum vibration acceleration appears at the measuring point B1 nearest to the subway tunnel. The vibration acceleration rapidly decreases with a negative exponent when moving away from the subway tunnel. The dominant frequencies of the measuring points on the FFT vibration spectrum, one-third octave spectrum, and HHT energy spectrum are about 65 Hz, 63 Hz, and 65 Hz, respectively. The relative vibration energies of different measuring points are very different. The maximum vibration energy at B1 is nearly 50 times larger than that at B5.
2.2.3. The Dominant Vibration Frequency Analysis
The dominant vibration frequencies of the five measuring points are concentrated between 60 and 70 Hz, but the vibration attenuation is obvious. The vibration acceleration attenuation amplitude is close to 90%, and the higher the frequency, the faster the vibration attenuation. The vibration level is reduced by about 7 dB within the test distance of 40 m. However, the vibration attenuation at a low frequency is not obvious. The vibration within 0.5 to 5 Hz is almost non-attenuated. As shown in Figure 6, when the distance to the subway tunnel increases, the dominant vibration frequency gradually attenuates, which can be considered as the advantage-frequency migration effect. This may relate to the damping characteristics of the soil. Under high-frequency vibrations, the interaction time required by the friction of soil particles and the damping force between particles is shorter, resulting in instantaneous attenuation. Meanwhile, under low-frequency vibrations, it is long, so that the speed of energy transfers and attenuation is relatively slow.
3. Numerical Simulations by Discrete Element Method
The final ground response to the subway-induced vibration can be obtained by the field tests, but the soil deformation process, especially the microscopic index change process, is unclear. The discrete element simulation can compensate for the lack of microscopic field tests.
3.1. Numerical Model
A 2D discrete element model with a width of 100 m and a height of 60 m was built for the simulations and is illustrated in Figure 7. The radius expansion method was used to generate sand particles. The number of particles depended on the sample porosity, particle radius, and gradation. The subway tunnel was set in the upper part of the model in the center. The tunnel radius is set to 5 m, and the center of the tunnel is 20 m away from the upper boundary and 50 m away from the boundary on both sides. The thickness of the tunnel segments and lining is set to 1.5 m. In order to avoid the model explosion problem caused by the concentrated load on a single particle, a Π-shaped subway track structure is constructed in the tunnel to apply dynamic loads to the tunnel, which is also closer to the actual situation.
The particle unit is regarded as a rigid body. The contact stiffness model was used between particles, and hence, the contact particles interact with each other through internal force and movement. The physical contact behavior between particles was considered to be a soft contact mode, and rigid particles were allowed to overlap each other slightly at the contact point. The tunnel structure was described by a bonding model to prevent it from being broken by force in the later stage. The boundary of the discrete element model is a viscous boundary, which can effectively prevent rebound vibrations. The physical and mechanical parameters employed in the model are listed in Table 2. The parameters mainly refer to those in published papers [31,32,33] and have been adjusted many times within a reasonable range to reflect the sandy soil’s properties as closely as possible. A subway vibration load with a duration of 8 s was applied on the subway track, which is illustrated in Figure 8.
3.2. Analysis of Simulation Results
3.2.1. Macroscopic Deformation Analysis
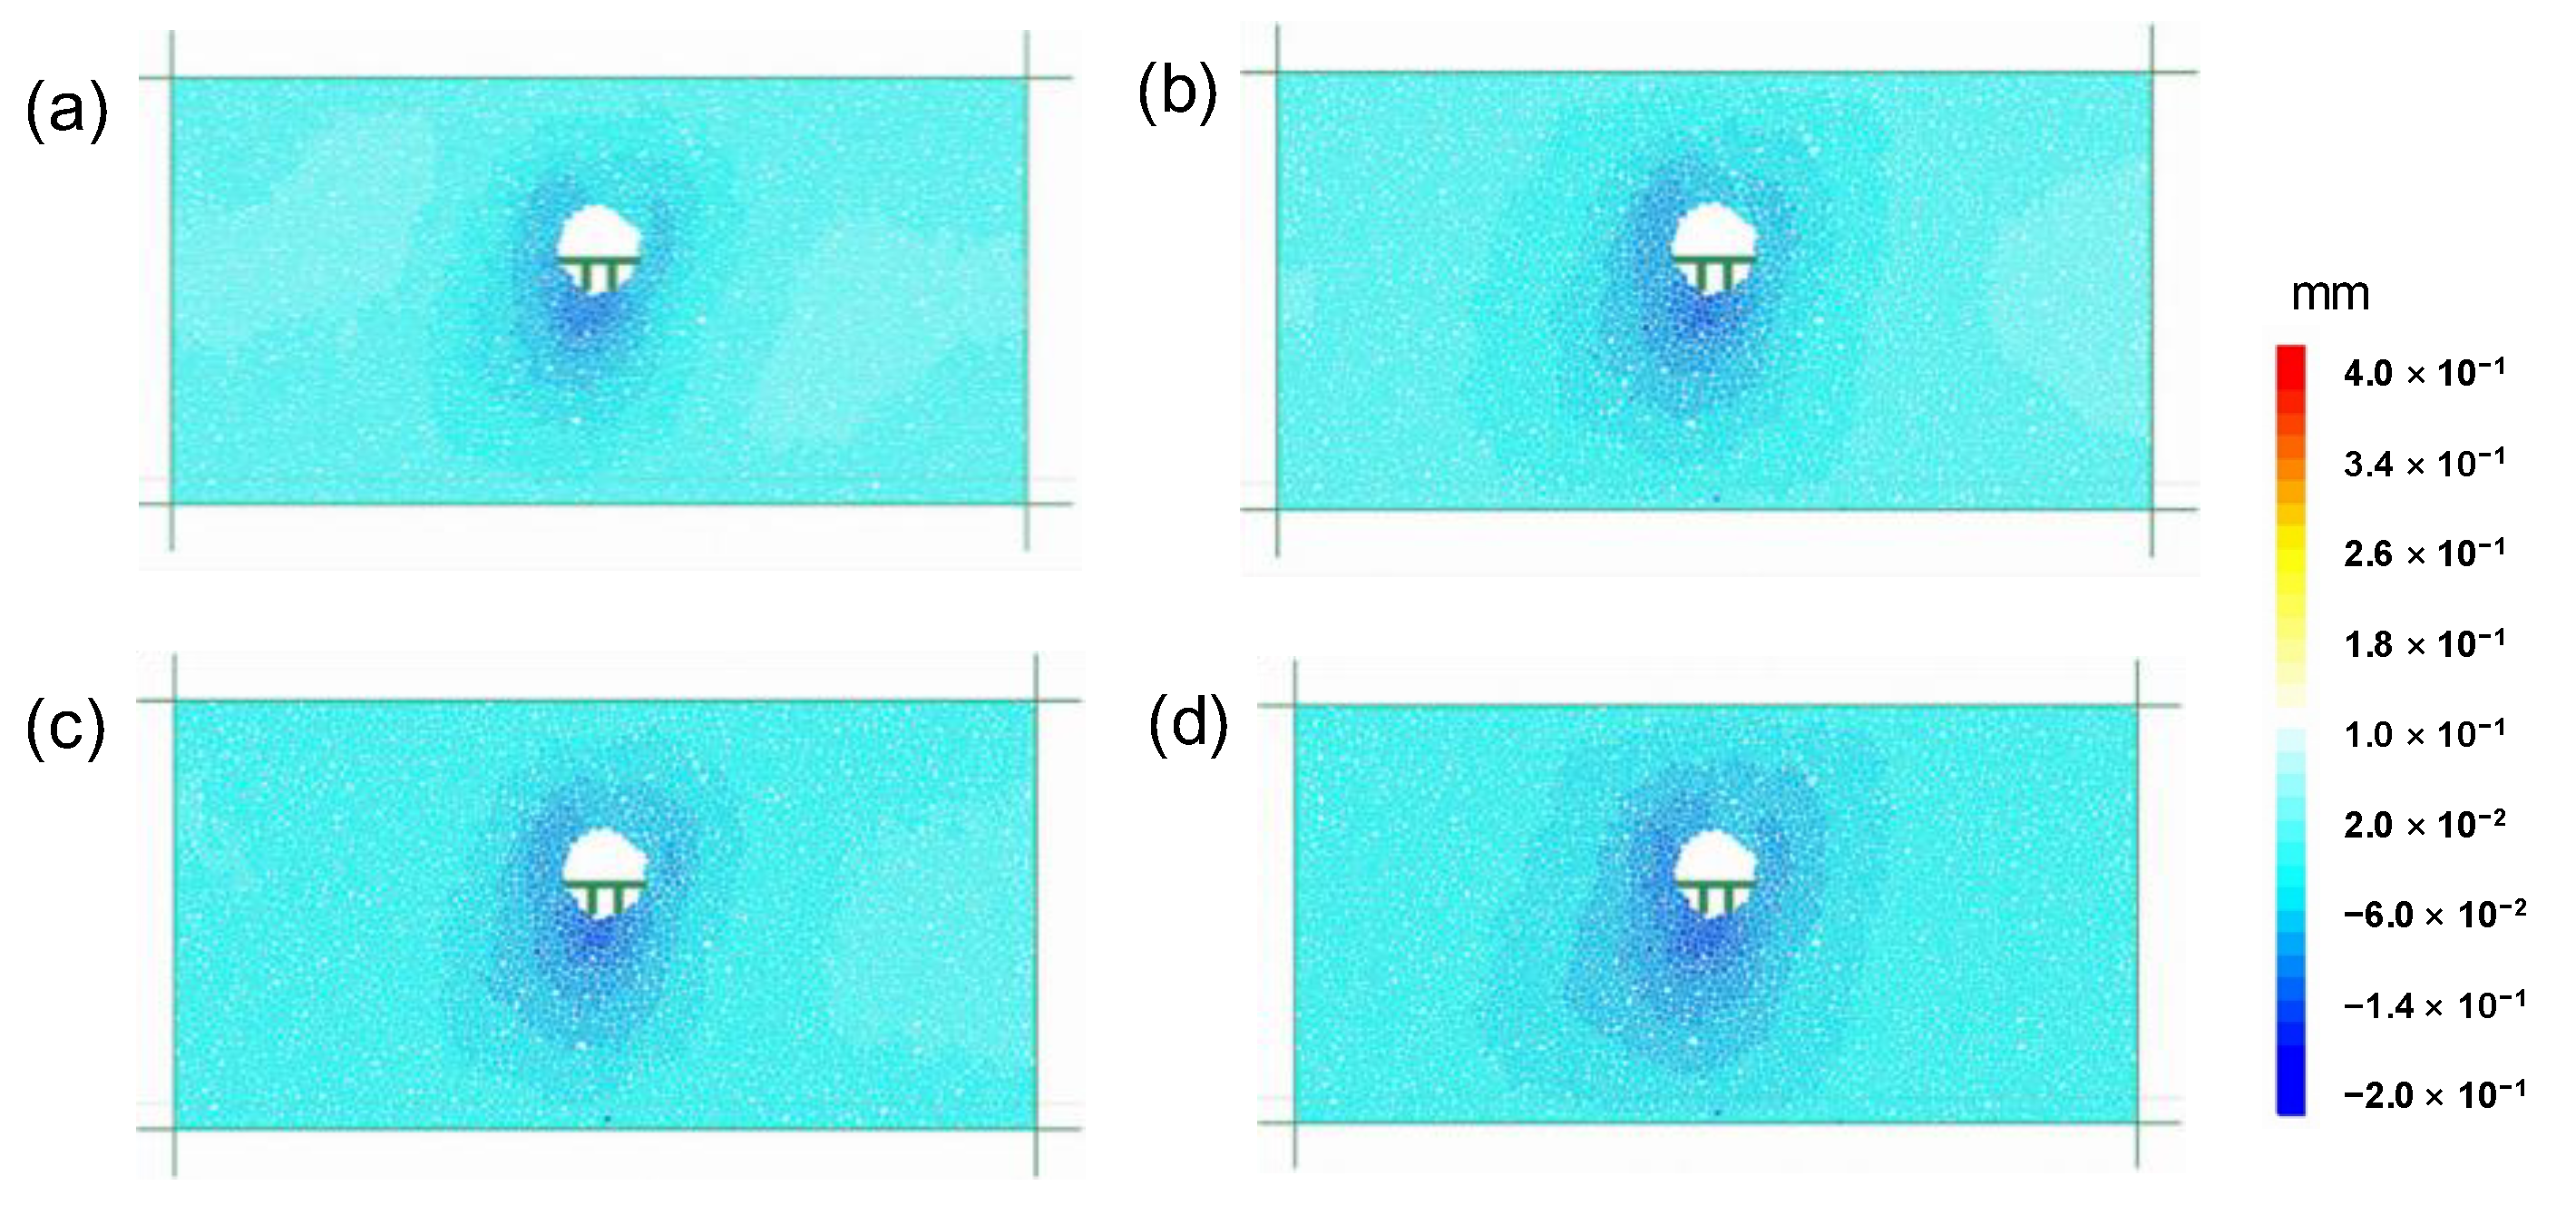
Figure 9 shows the vertical displacement of the sand under the subway vibration load. It can be seen that within 8 s, the vertical vibration load diffused around the tunnel, and the vertical deformation near the sand body gradually increased. The displacement under the tunnel is particularly obvious, and the maximum displacement near the tunnel can reach 0.2 mm. With the increase in the distance away from the tunnel, the displacement becomes smaller. At 25 m below the tunnel, the displacement decreases to less than 0.2 mm.
3.2.2. Microscopic Deformation Characteristics
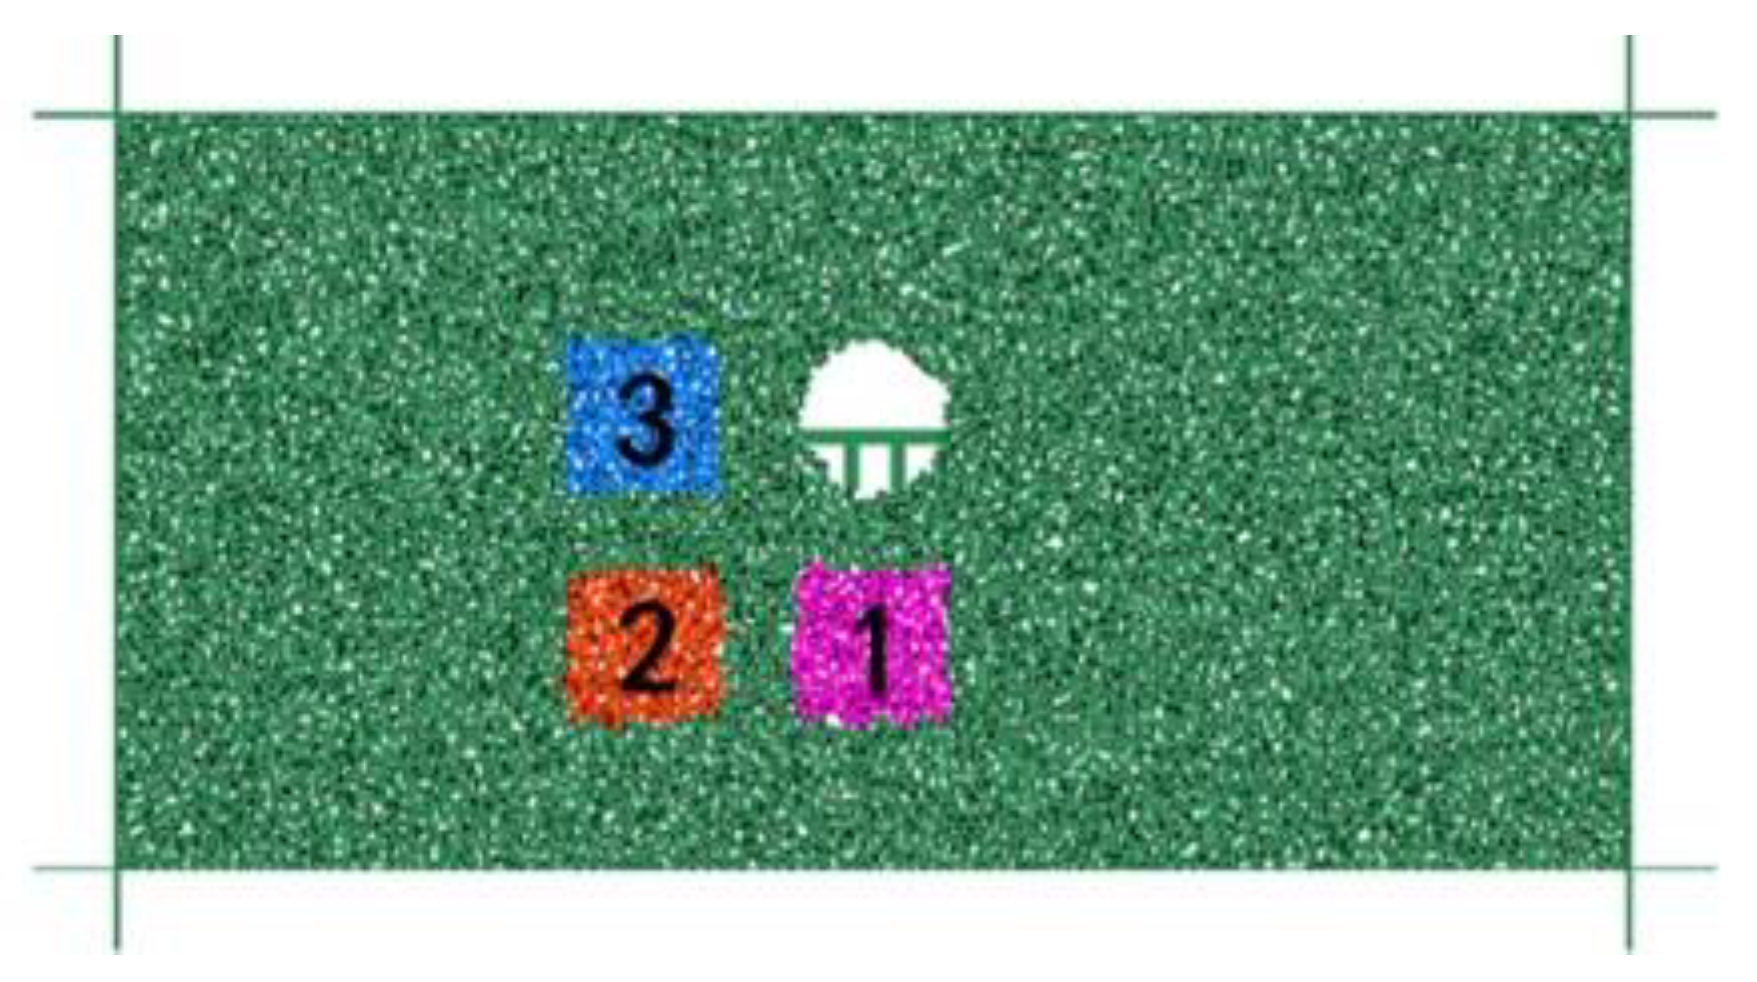
Three representative observation areas were selected for our analysis of the microscopic deformation characteristics. The selected areas are below, on the side of, and below the side of the tunnel, respectively, and are illustrated in Figure 10. Each area is 10 m × 10 m. Monitoring area 1 is located 5 m below the tunnel, monitoring area 2 is located at the lower left-hand side of the tunnel, and monitoring area 3 is located 5 m to the left of the tunnel.
Variation in Particle Coordination Number
The particle coordination number represents the number of contacts between a particle and its surrounding particles. The particle coordination number can be used to quantitatively describe the fabric characteristics of a soil mass and is one of the most representative parameters of its meso-structural characteristics. The coordination number can be expressed as follows:
where Nb is the number of particles falling into the measurement domain; and nc(b) is the number of contacts of particle b. The larger the coordination number, the closer the contact between particles. The smaller the coordination number, the less contact between particles. The deformation of sand is a process of relative sliding, rotating, crushing, and recombining particles, and the change in the coordination number can be used to quantify the evolutionary process. The means in the monitoring areas are shown in Figure 11. It can be seen that, under the subway vibration load, the coordination numbers in all of the monitoring areas change. In monitoring area 1, it shows an increasing trend, and the average is about 4.6. This indicates that the sand in monitoring area 1 becomes denser, which is caused by the soil compression deformation. In monitoring areas 2 and 3, it shows a slightly decreasing trend but it is still more than 4.4. This indicates that the sand in these two places may become loose, which is caused by the shear dilatancy effect in sandy soil.
Variation in Particle Contact Force
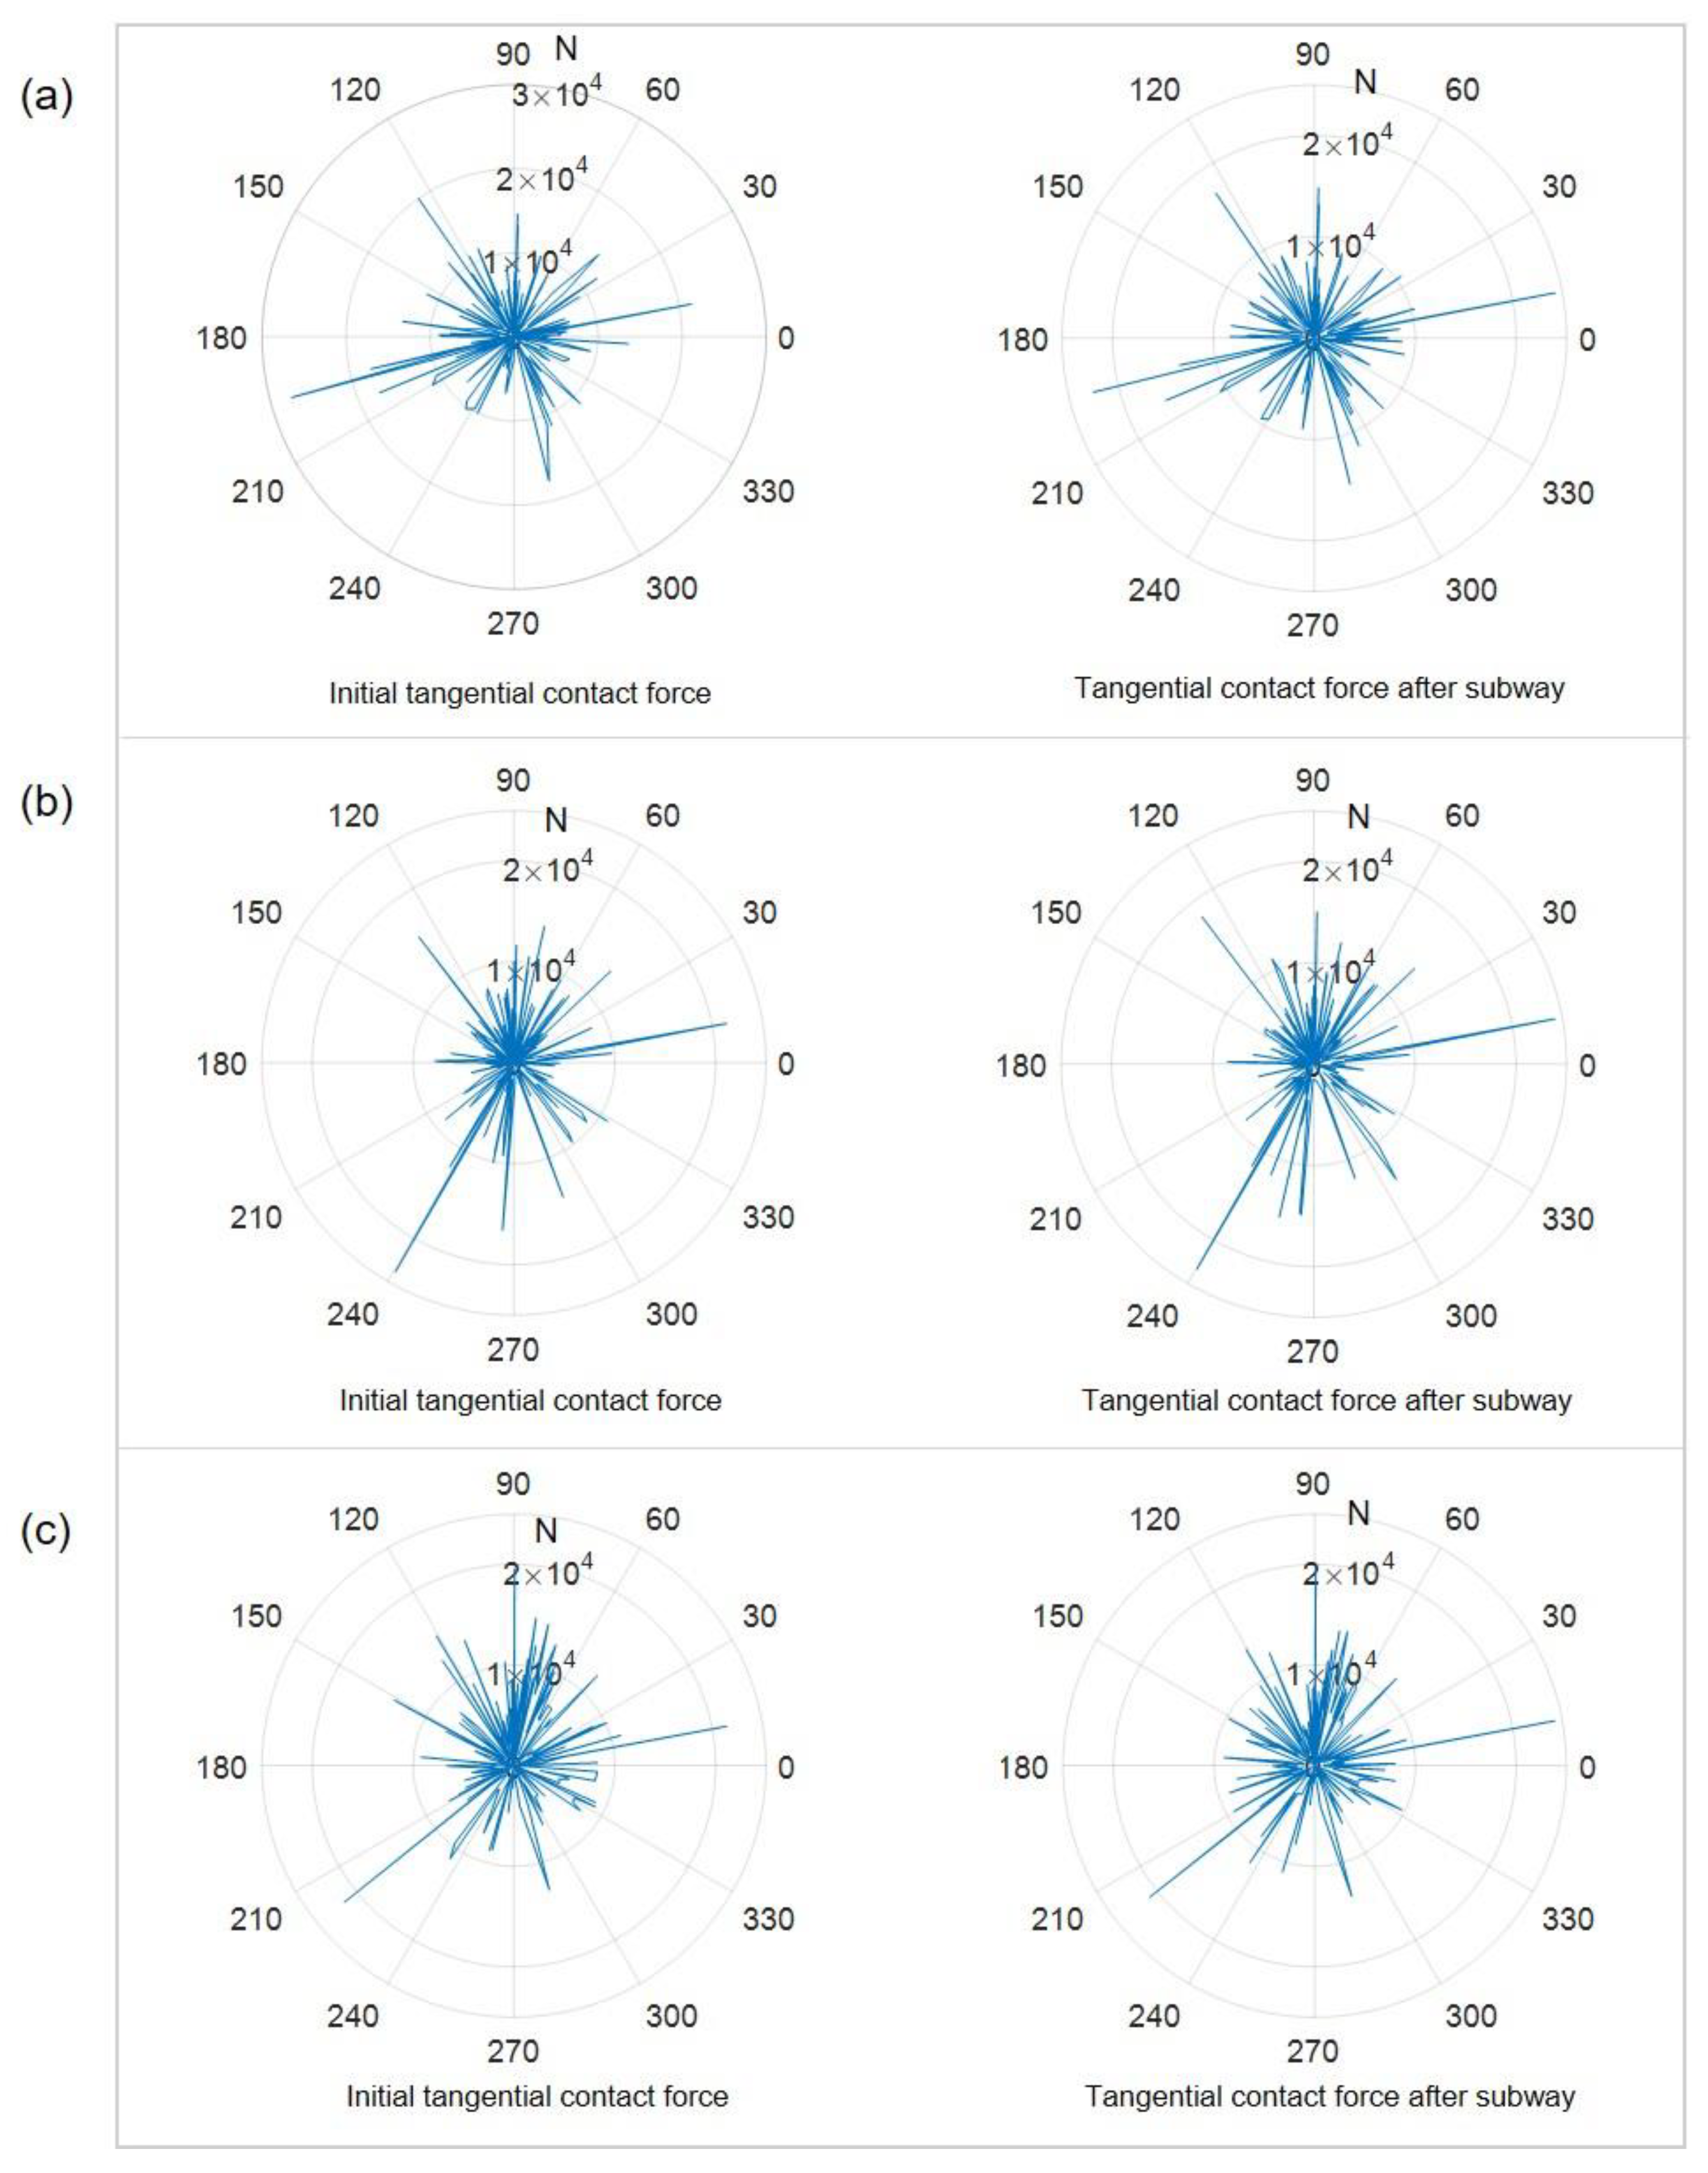
Figure 12 and Figure 13 show the statistics of the normal contact force and tangential contact force of the particles in each area, respectively. In these two figures, the radial represents the magnitude of the contact force. As shown in Figure 12, the normal contact force in each area is evenly distributed in all directions. The normal contact force in monitoring area 1 is the largest, while that in monitoring area 2 is the smallest. It did not change much after the subway came. It slightly decreased in monitoring area 2 only. As shown in Figure 13, the distribution of the tangential contact force of the particles in the monitoring areas is not uniform in direction. The tangential contact force is about one order of magnitude lower than the normal contact force. They are similar in magnitude, but their directions are quite different. In monitoring area 1, the tangential contact forces are mainly distributed in the horizontal direction.
Variation in Local Porosity
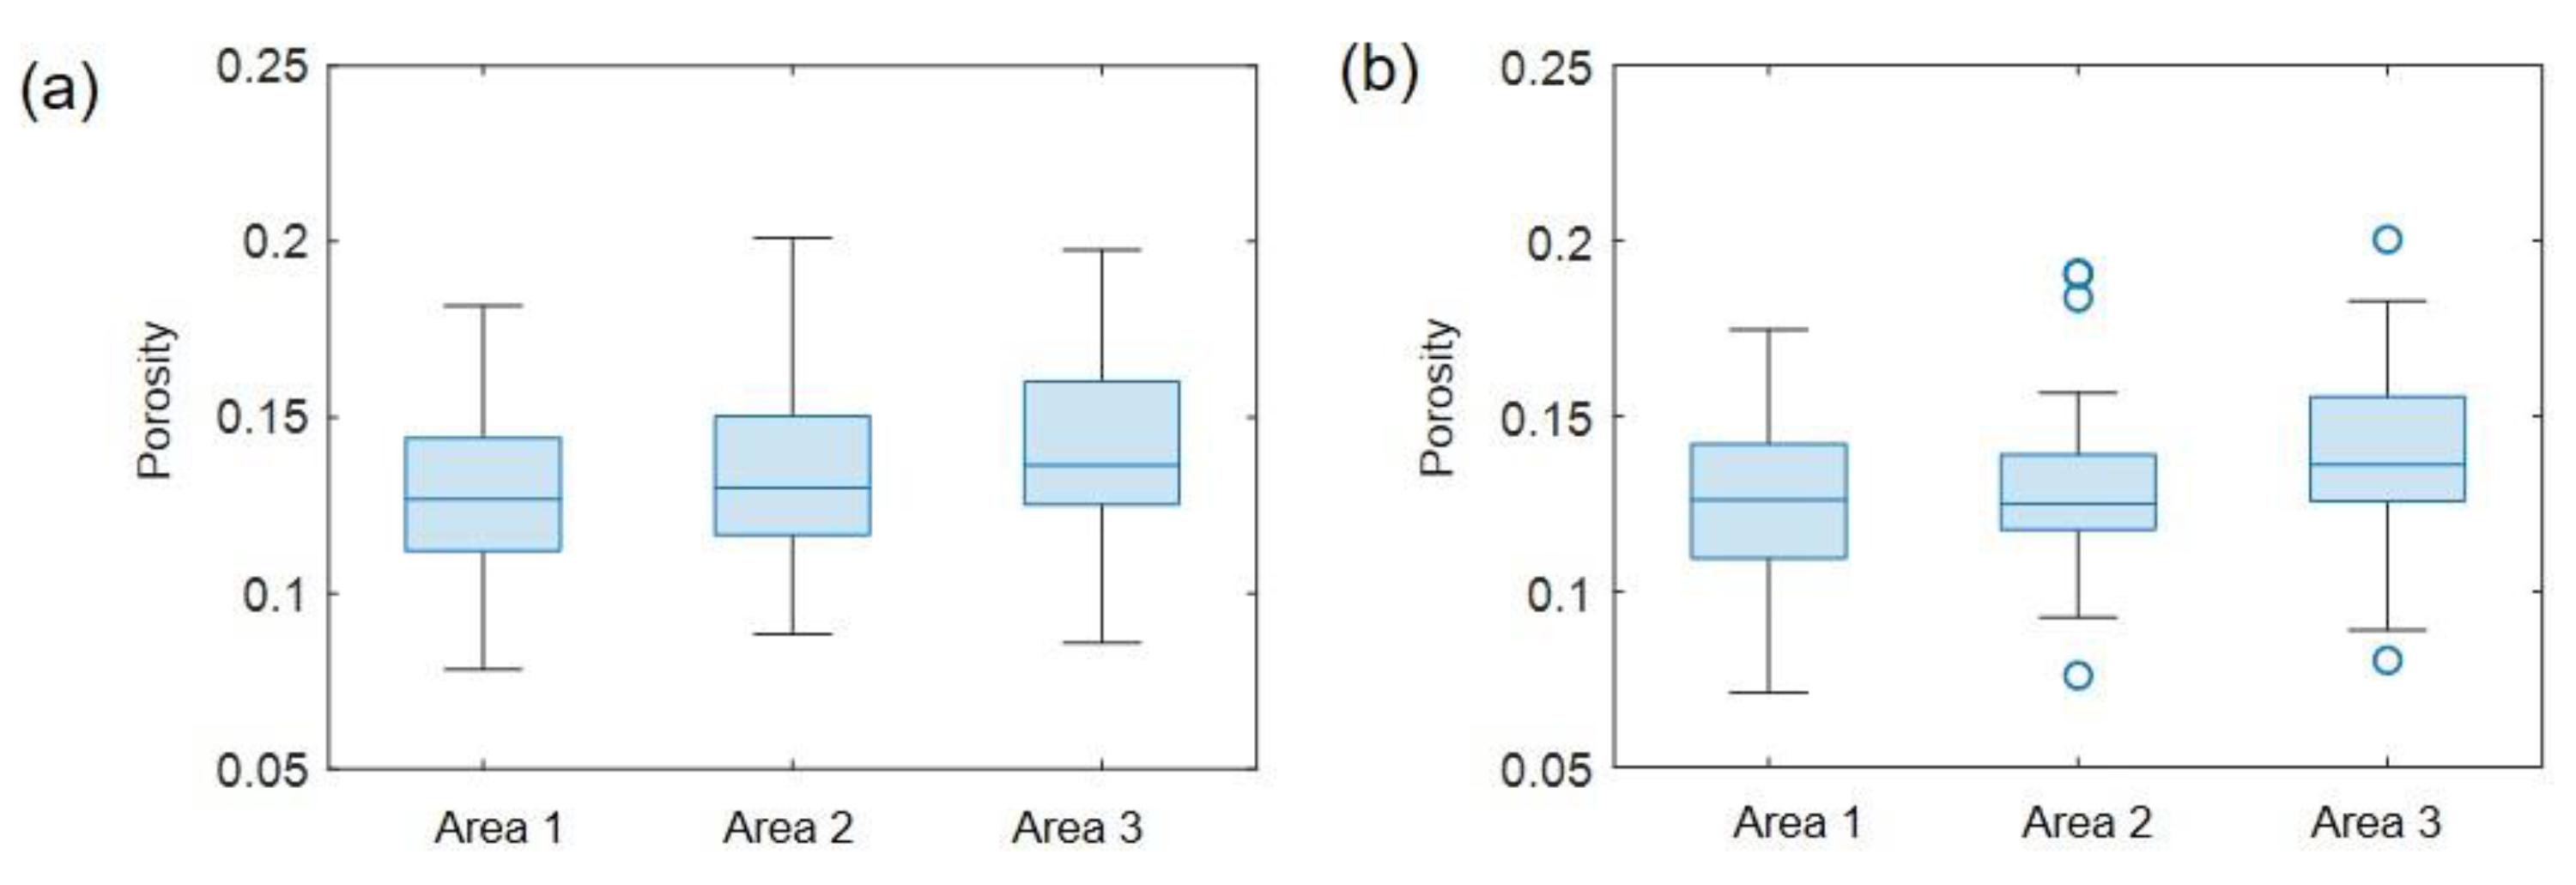
The porosity is an important factor affecting the dynamic deformation characteristics of sand. When the porosity increases, the compressive strength and shear strength of the soil will decrease, and the soil’s resistance to deformation will increase. In addition, the change in porosity will also affect the soil’s permeability characteristics. In order to analyze the porosity variation as accurately as possible, a quartile box diagram was used to form statistics. The statistical results of the local porosity are shown in Figure 14. As can be seen from Figure 14, the local porosities of monitoring areas 1 and 2 are small, about 0.13, while in monitoring area 3, it is slightly larger, close to 0.14. The porosity of the three test areas did not change much after the subway came. The porosity of monitoring area 2 showed a tendency to decrease, which is presumed to be caused by the instantaneous settlement.
Variation in Particle Rotation Angle
The sand particles may rotate under the dynamic subway load, which will change the contact mode between the particles. Figure 15 shows the statistical results of the particle rotation angle, in which clockwise is considered the positive direction. As shown in Figure 15, the rotation angles of the particles in the three monitoring areas are all between −5° and 5°, and most of the particles rotate clockwise. In particular, almost all of the particles rotate towards the subway in monitoring area 3. Since the rotation angle of all the particles is small, the variation in the coordination number of the particles is relatively small; hence, the variation in the contact force is small, which is consistent with previous statistical results.
To sum up, under the subway vibration load, the particle coordination number of the sandy soil below the subway tunnel tends to increase, while the change in the particle contact force is not obvious. The sand in this area is compressed and becomes denser, which is manifested as settlement deformation. The coordination number and normal contact force of the sand particles on the side of the tunnel decrease, which may result in the shear dilatancy effect.
4. Relative Analysis between Discrete Element Parameters and Deformation
Due to the incompleteness of the simulations, a numerical analysis is incorporated into the grey system to solve this problem. The relationship between various parameters and sand deformation can be quantitatively analyzed.
4.1. Gray Relational Analysis Method
The grey relational analysis is an analytical method based on the grey system theory [34]. In order to use this method, the collection and standardization of data related to the target variable are needed. Two matrices should be constructed first: one is the submatrix and the other is the parent matrix. The submatrix is the reference matrix corresponding to the influence factor, which can be expressed as follows:
The parent matrix is the compared sequence matrix under the corresponding condition, namely the target variable matrix, which can be expressed as follows:
where i represents the number of parameters considered; and j represents the number of parameters within a reasonable range. xij represents the i th parameter. yij represents the target variable value corresponding to xij.
The range normalization method was used to standardize and nondimensionalize the data. The element of the two matrixes can be expressed as follows:
A difference sequence matrix, Δ, can be obtained as follows:
The relative coefficient, lij, between the target variable and the standardized data can be calculated as follows:
where η is the resolution coefficient. In general, η is set to 0.5. And then the grey relational degree can be obtained as follows:
where n represents the number of parameters involved in the correlation degree analysis.
The grey relational degree is an index to measure the similarity of sequence parameters, and its value is between 0 and 1. The greater the grey relational degree is, the greater the influence of the subsequence on the parent sequence. In contrast, the parent sequence is less sensitive to the subsequence.
4.2. Analysis of Physical and Mechanical Parameters
The particle size ratio, porosity, and friction coefficient between particles were considered for the relative analysis by orthogonal experiments. A point 10 m below the subway tunnel was selected for deformation monitoring. The results are shown in Table 3.
The grey relational degree was calculated using Equations (2)–(7) and is illustrated in Figure 16. As can be seen from Figure 16, the initial porosity has the greatest influence on the sand deformation, and the relational degree is 0.830. The second greatest influence is the friction coefficient between particles, and the relational degree is 0.753. The effect of the particle size ratio on the soil deformation is relatively small, and the relational degree is 0.6.
4.3. Analysis of Microscopic Parameters
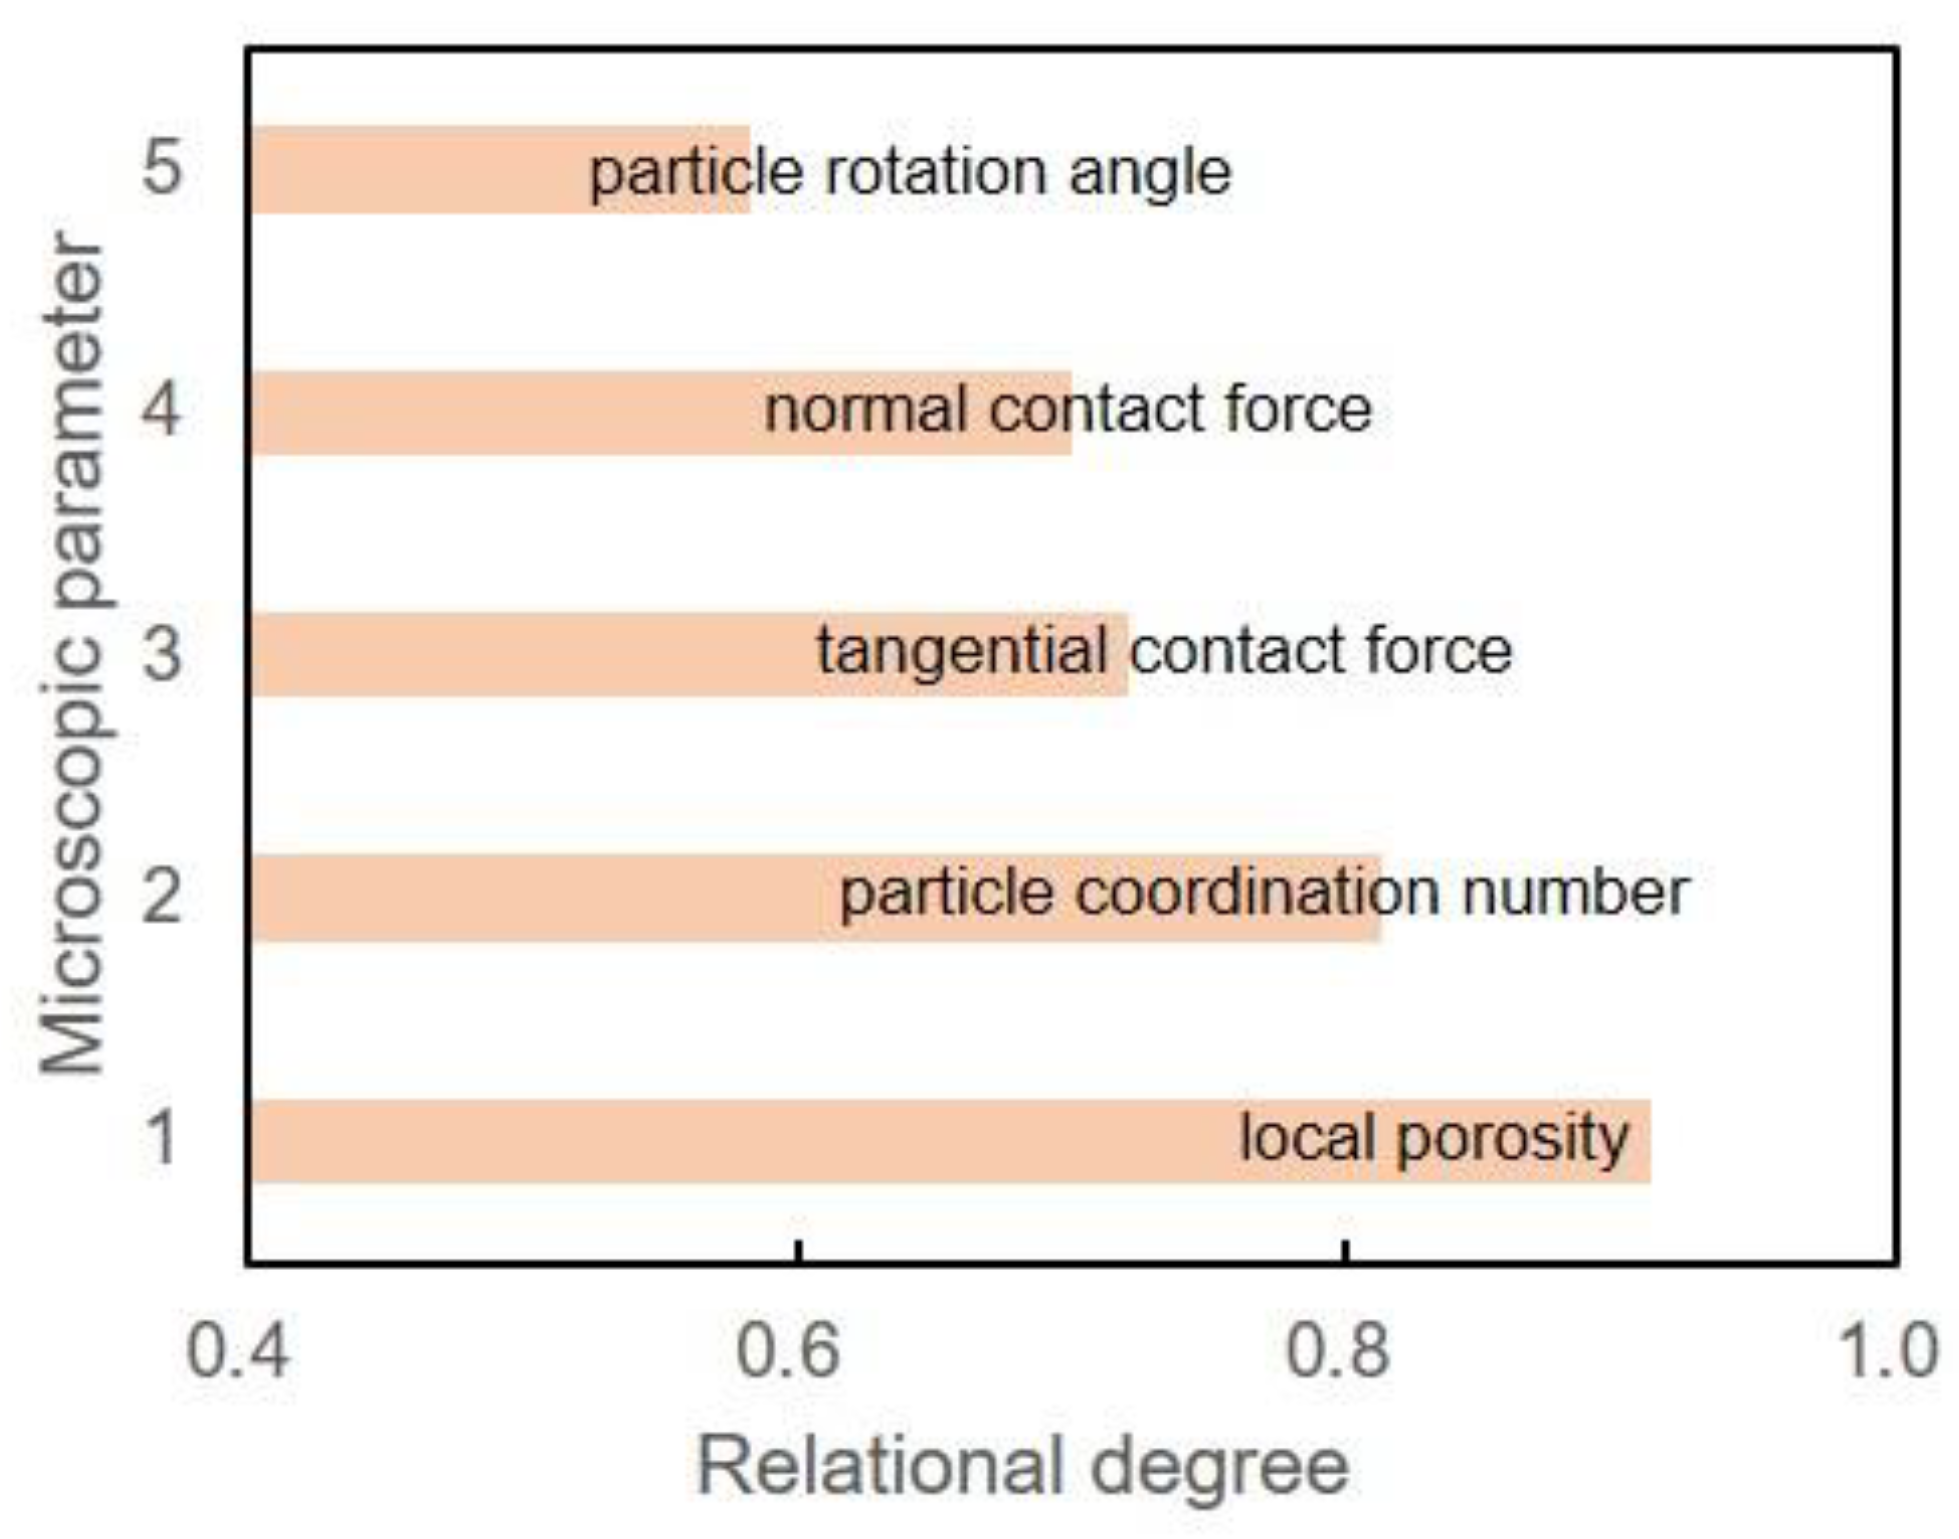
In order to better understand the evolution of the microscopic parameters during the soil deformation, monitoring area 1 was selected for a statistical analysis. Five microscopic indexes, the particle coordination number, normal contact force, tangential contact force, local porosity, and particle rotation angle, associated with soil deformation were analyzed and are presented in Table 4. The grey relational degree was calculated and is illustrated in Figure 17. As can be seen from Figure 17, in the process of the dynamic deformation of sandy soil, the variation in the local porosity is most closely related to the deformation. The particle rotation angle changes little during the dynamic deformation of sandy soil.
Under the subway dynamic load, the deformation of the sandy soil is related to the variation in microscopic parameters, and the local porosity is the most closely related parameter. The contact mode between the sand particles will change as the subway passes. The particle coordination number will increase, the contact force between particles will increase, and the particles in some areas will even be deflected. Therefore, the pores between the sand particles will be continuously compressed, which induces the macroscopic deformation of the sandy soil.
5. Conclusions
After the subway comes and goes, the ground settlement is directly related to the subway traffic vibrations. The vibration load of Nanjing Subway Line 10 is mainly concentrated in the vertical direction. The most serious ground settlement caused by the subway vibrations will occur directly above the subway.
The sandy soil deformation affects the dynamic loading process and vibration propagation path, which will in turn lead to the variation in microscopic parameters. If this behavior is repeated again and again, small deformations of the underlying sandy soil will accumulate and then lead to urban engineering geological disasters, such as uneven tunnel settlement or ground collapse.
In fact, the thickness of the sandy soil layer under a subway line is not always the same. It is worth noting that subway traffic vibrations may cause the uneven deformation of sandy soil. What is worse, this will further lead to track deformation and threaten the safety of passengers. Therefore, when there is a thick layer of sandy soil under the subway, some absorbing measures should be taken to counter the propagation of subway vibrations.
Author Contributions
J.S. and L.G. conceived of and designed the tests; J.S., D.H. and K.S. established the numerical model; and J.S. wrote the main manuscript text. All authors have read and agreed to the published version of the manuscript.
Funding
This research received no external funding.
Institutional Review Board Statement
The study did not require ethical approval.
Informed Consent Statement
Not applicable.
Data Availability Statement
The datasets used and/or analyzed in the current study are available from the corresponding author upon reasonable request.
Conflicts of Interest
The authors declare no conflicts of interest.
References
- Zheng, S.F.; Wen, J. Analysis and prediction of subway settlement deformation based on grey model. IOP Conf. Ser. Earth Environ. Sci. 2021, 638, 012073. [Google Scholar]
- Feng, Y. Study on Dynamic Behavior and Constitutive Model of Saturated Silty Sand under Subway Operation Load; Guangxi University: Nanning, China, 2017. [Google Scholar]
- Liu, J.; Yang, Y.; Yang, C. Analysis and prediction of long-term settlement of metro shield tunnel in saturated sand. Geotech. Geol. Eng. 2021, 39, 5241–5252. [Google Scholar] [CrossRef]
- Zhang, P. Vibration acceleration response analysis of subway train in different soil areas. J. Hunan City Univ. 2023, 32, 15–20. [Google Scholar]
- Zhou, J.; Lu, D.Y. Liquifiable sandy settlement characteristics analysis under metro train vibration load. China Civ. Eng. J. 2020, 53, 226–232. [Google Scholar]
- Huang, Q.; Wan, L.; Liu, G.B.; Zheng, R.Y. Field measurement and numerical analysis of train-induced vibration effect on metro tunnel in soft ground. J. Southeast Univ. 2021, 51, 435–441. [Google Scholar]
- Xu, X.L. Resource and Environment Science and Data Center: Spatial Data of Soil Geology in China. 2018. Available online: https://www.resdc.cn/data.aspx?DATAID=260 (accessed on 26 August 2021).
- Zhai, W.M. The vertical model of vehicle-track system and its coupling dynamics. J. Railw. 1992, 14, 10–21. [Google Scholar]
- Takemiya, H.; Goda, K.; Miyagawa, G. Simulation of near source ground motions due to multiple dislocations in layered soil. In Proceedings of the the Second International Symposium on the Effects of Surface Geology on Seismic Motion, Yokohama, Japan, 1–3 December 1998; pp. 915–922. [Google Scholar]
- Nelson, J.T.; Saurenman, H.J. State-of-the-art review: Prediction and control of groundborne noise and vibration from rail transit trains. Failure 1983, 79, 533–540. [Google Scholar]
- Zhang, Y.E.; Bai, B.H. The effects of strain-rate-sensitivity on dynamic buckling of cylindrical shells under axial impact. J. Vib. Shock 2000, 19, 68–70. [Google Scholar]
- Lei, X.Y.; Cui, C.C.; Zhang, L. Vibration response of station structure of comprehensive transportation Hub station under subway train load excitation. China Railw. Sci. 2019, 40, 119–128. [Google Scholar]
- Zheng, G.C.; Xu, H.L.; Qi, K.; Guo, J.L. Field measurement and numerical simulation on environmental and vibration effects in-duced by metro and ground traffic. China Environ. Sci. 2020, 40, 4146–4154. [Google Scholar]
- Xu, Y.; Liu, Q.B.; Wang, H.; Qie, L.C.; Lou, L.W.; Yu, W.Y.; Yi, Q. Dynamic characteristics of track structure with wide sleeper slab solidified ballast bed in urban rail transit. China Railw. Sci. 2021, 42, 19–26. [Google Scholar]
- Procopio, A.T.; Zavaliangos, A. Simulation of multi-axial compaction of granular media from loose to high relative densities. J. Mech. Phys. Solids 2005, 53, 1523–1551. [Google Scholar] [CrossRef]
- Li, L.H.; Sheng, H.Z.; Liao, X.C.; Liu, Y.M.; Pei, Y.Y.; Xu, W.S. Influence of stress path on macro-and micro-mechanical properties of sand. China Sci. 2022, 17, 1057–1064. [Google Scholar]
- Antony, S.J.; Jahanger, Z.K. Local scale displacement fields in grains-structure interactions under cyclic loading: Experiments and simulations. Geotech. Geol. Eng. 2020, 38, 1277–1294. [Google Scholar] [CrossRef]
- Hu, X.R.; Cai, X.F.; Li, C.B. Numerical simulations of dynamic characteristics for saturated compacted clayey sands in Nanchang metro. Chin. J. Undergr. Space Eng. 2021, 17, 157–173. [Google Scholar]
- Yimsiri, S.; Soga, K. Effects of soil fabric on behaviors of granular soils: Microscopic modeling. Comput. Geotech. 2011, 38, 861–874. [Google Scholar] [CrossRef]
- Hu, M.; O’Sullivan, C.; Jardine, R.R.; Jiang, M. Study on the Deformation of Loose Sand under Cyclic Loading by DEM Simulation. In Soil Behavior and Geo-Micromechanics; ASCE: Reston, VA, USA, 2010; pp. 212–219. [Google Scholar]
- Nguyen, N.S.; Francois, S.; Degrande, G. Discrete modeling of strain accumulation in granular soils under low amplitude cyclic loading. Comput. Geotech. 2014, 62, 232–243. [Google Scholar] [CrossRef]
- Jiang, M.; Zhang, A.; Li, T. Distinct element analysis of the microstructure evolution in granular soils under cyclic loading. Granul. Matter 2019, 21, 39. [Google Scholar] [CrossRef]
- Yang, Z.X.; Yang, J.; Wang, L.Z. Micro-scale modeling of anisotropy effects on undrained behavior of granular soils. Granul. Matter 2013, 15, 557–572. [Google Scholar] [CrossRef]
- Yimsiri, S.; Soga, K. DEM analysis of soil fabric effects on behaviour of sand. Geotechnique 2010, 60, 483–495. [Google Scholar] [CrossRef]
- Chen, Q.; Gao, Y.; Yuan, Q. Kinetic characterizations and micro-mechanism of dense sand subjected to shear. Water Resour. Hydropower Eng. 2021, 52, 212–224. [Google Scholar]
- Bian, X.C.; Hu, T.; Chen, Y.M. Stress path in soil element of ground under moving traffic loads. China Civ. Eng. J. 2008, 41, 86–92. [Google Scholar]
- Richart, F.E.; Hall, J.R. Vibration of Soils and Foundations; Prentice-Hall: Upper Saddle River, NJ, USA, 1970; pp. 142–198. [Google Scholar]
- Das, B.M.; Ramana, G.V. Principles of Soil Dynamics; PWS-Kent Pub. Co: Boston, MA, USA, 1993; pp. 77–124. [Google Scholar]
- Zhang, H. In Situ Experiment and Analysis of Environmental Vibration Induced by Urban Subway Transit; Beijing University of Technology: Beijing, China, 2006. [Google Scholar]
- Sun, K.; Zhang, W.; Xu, Y.; Zhou, L.; Zhou, F. Measurement and evaluation on vibration effects of underground space adjoining the subway station. Chin. J. Undergr. Space Eng. 2016, 12, 169–175. [Google Scholar]
- Wang, J.; Deng, Y.; Xu, N.; Yang, T.; Yan, X.; Wang, H.; Huang, X.; Liu, X.; Pei, X. Numerical simulation of land subsidence caused by subway train vibration using PFC. Proc. IAHS 2020, 382, 559–564. [Google Scholar] [CrossRef]
- Zhu, M.Y.; Gong, G.B.; Zhang, X.; Xia, J.; Moy, C.K.; Wilkinson, S. DEM investigation of strength and critical state behaviours of sand under axisymmetric stress paths with different shearing modes. J. Cent. South Univ. 2023, 30, 1964–1980. [Google Scholar] [CrossRef]
- Gu, Y.F. Macro and Micro Research on Compressibility of Soil Based on Laboratory Experiment and Discrete Element Numerical Simulation; Nanjing University: Nanjing, China, 2018. [Google Scholar]
- Deng, J.L. Basis of Grey Theory; Huazhong University of Science and Technology Press: Wuhan, China, 2002; pp. 133–182. [Google Scholar]
Figure 1.
Technical outline of this study.
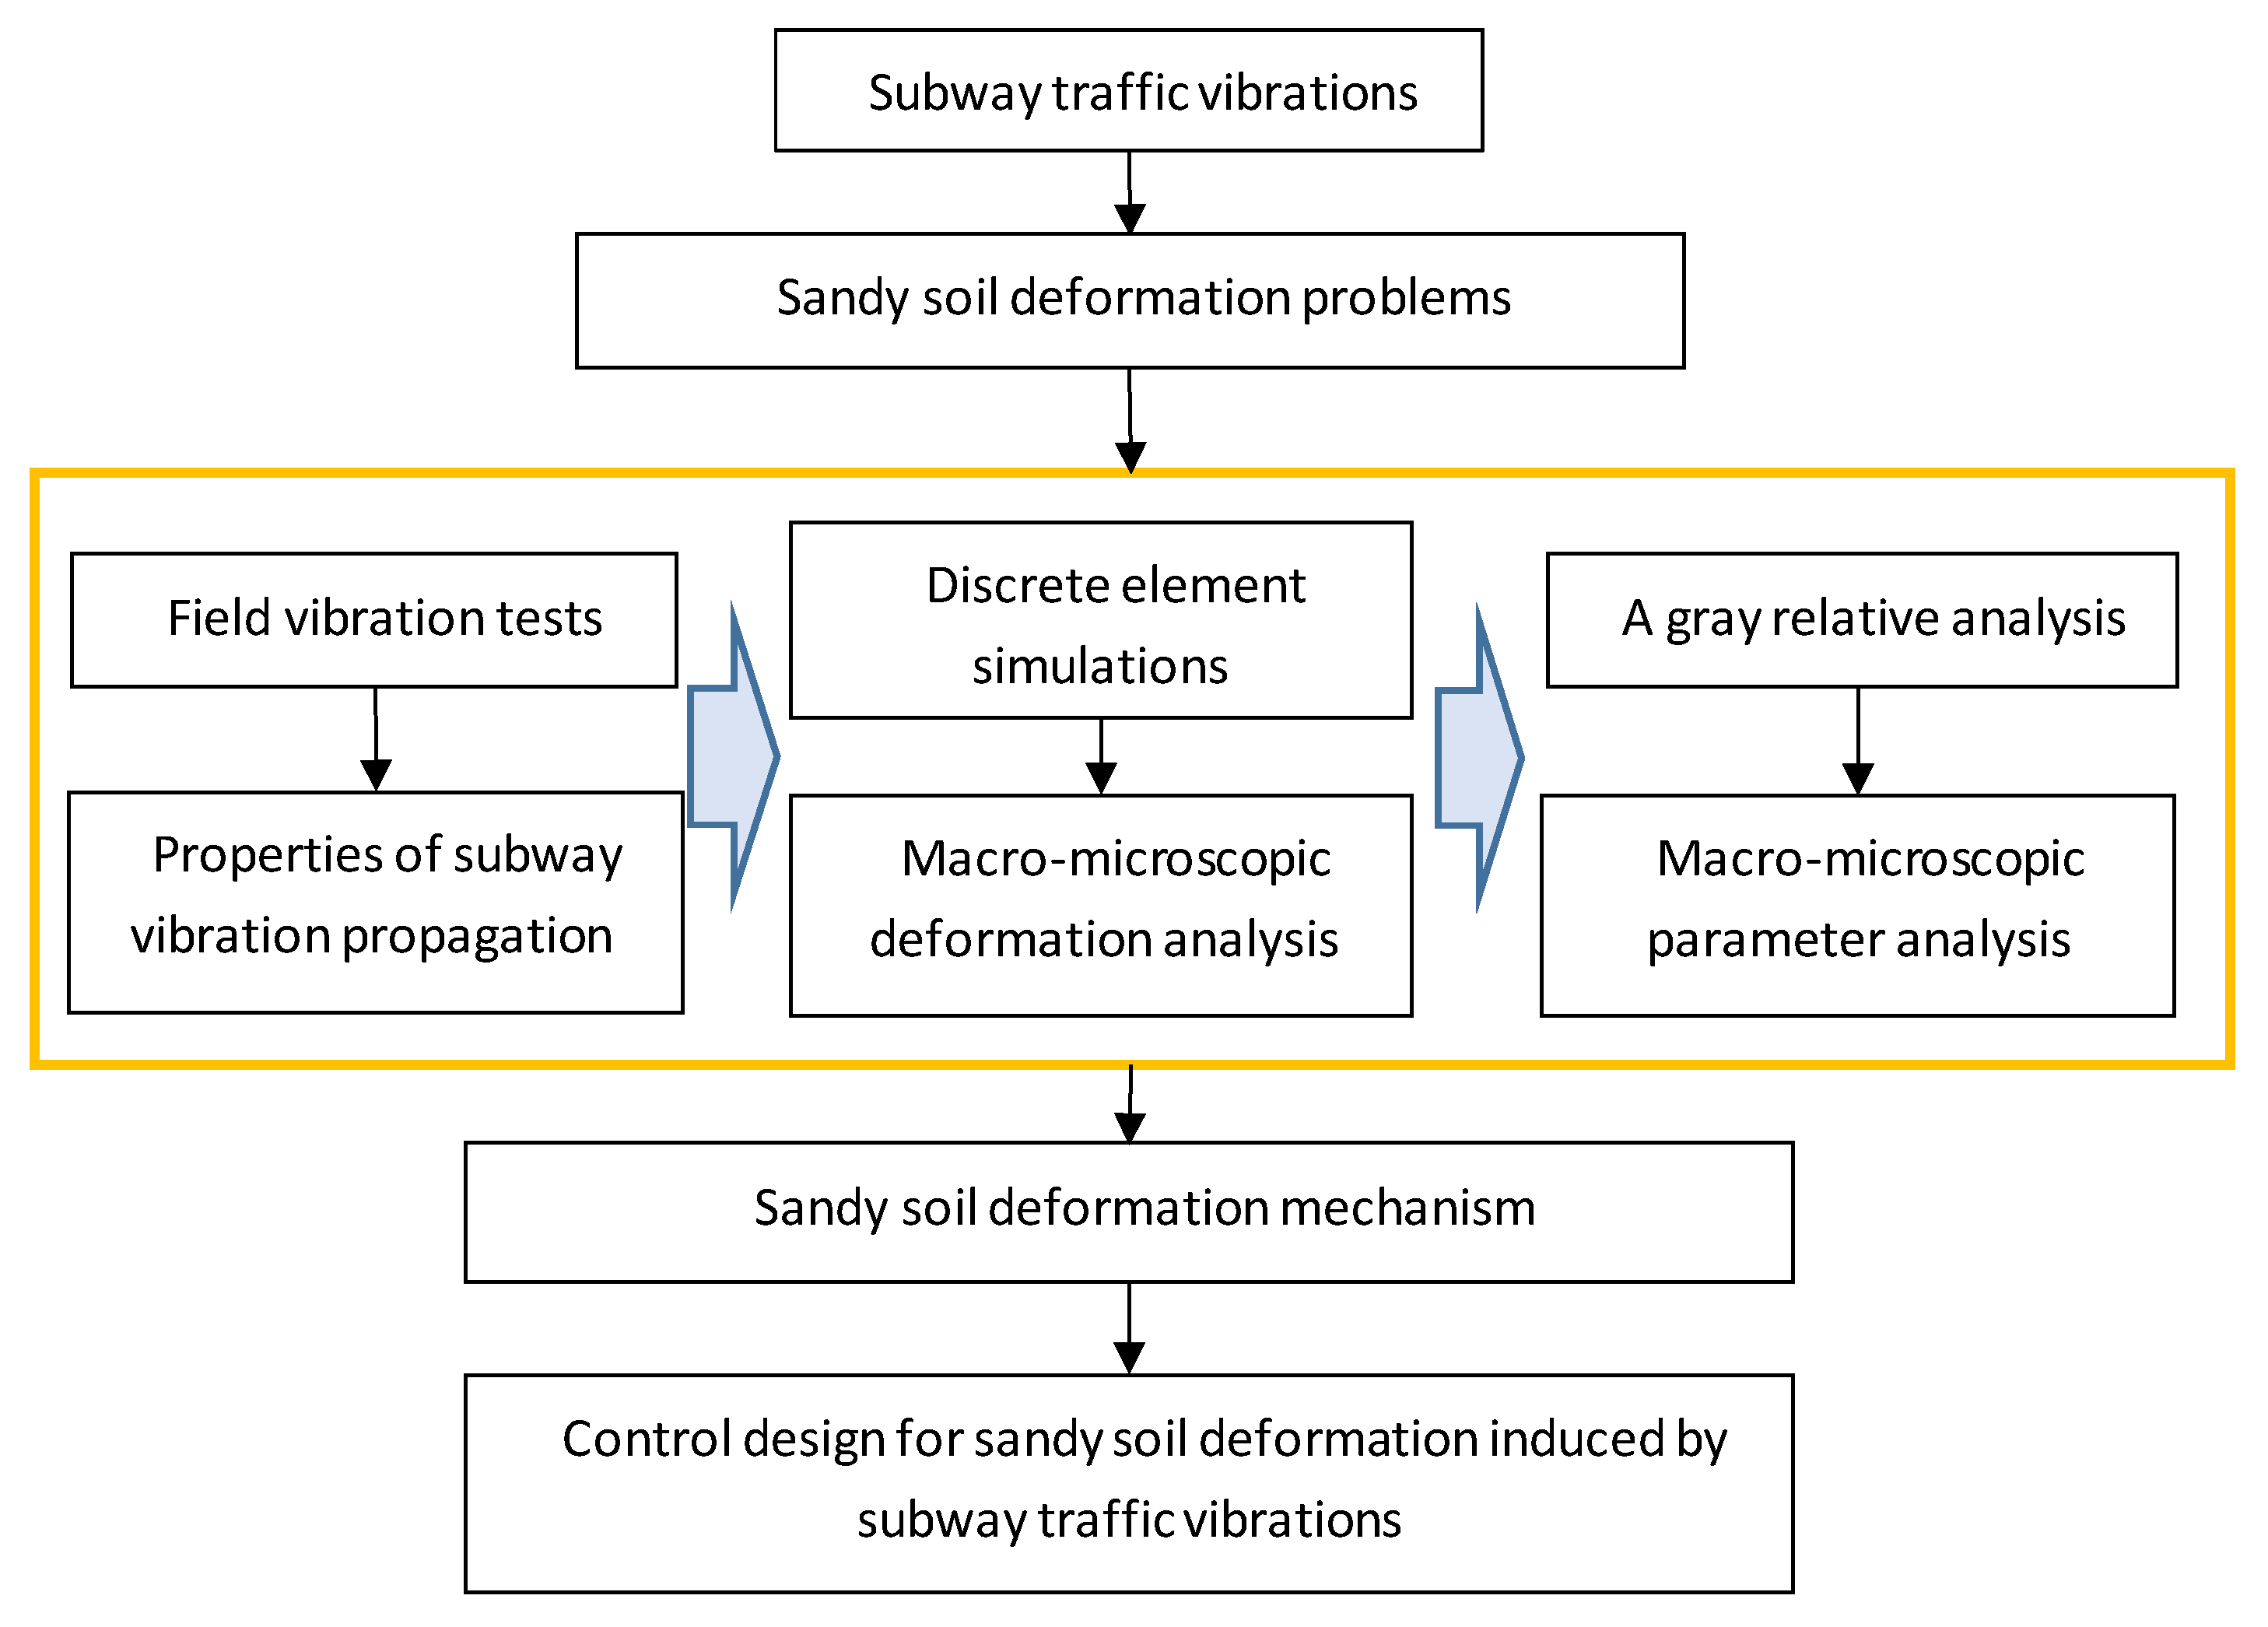
Figure 2.
The location of the test zone.
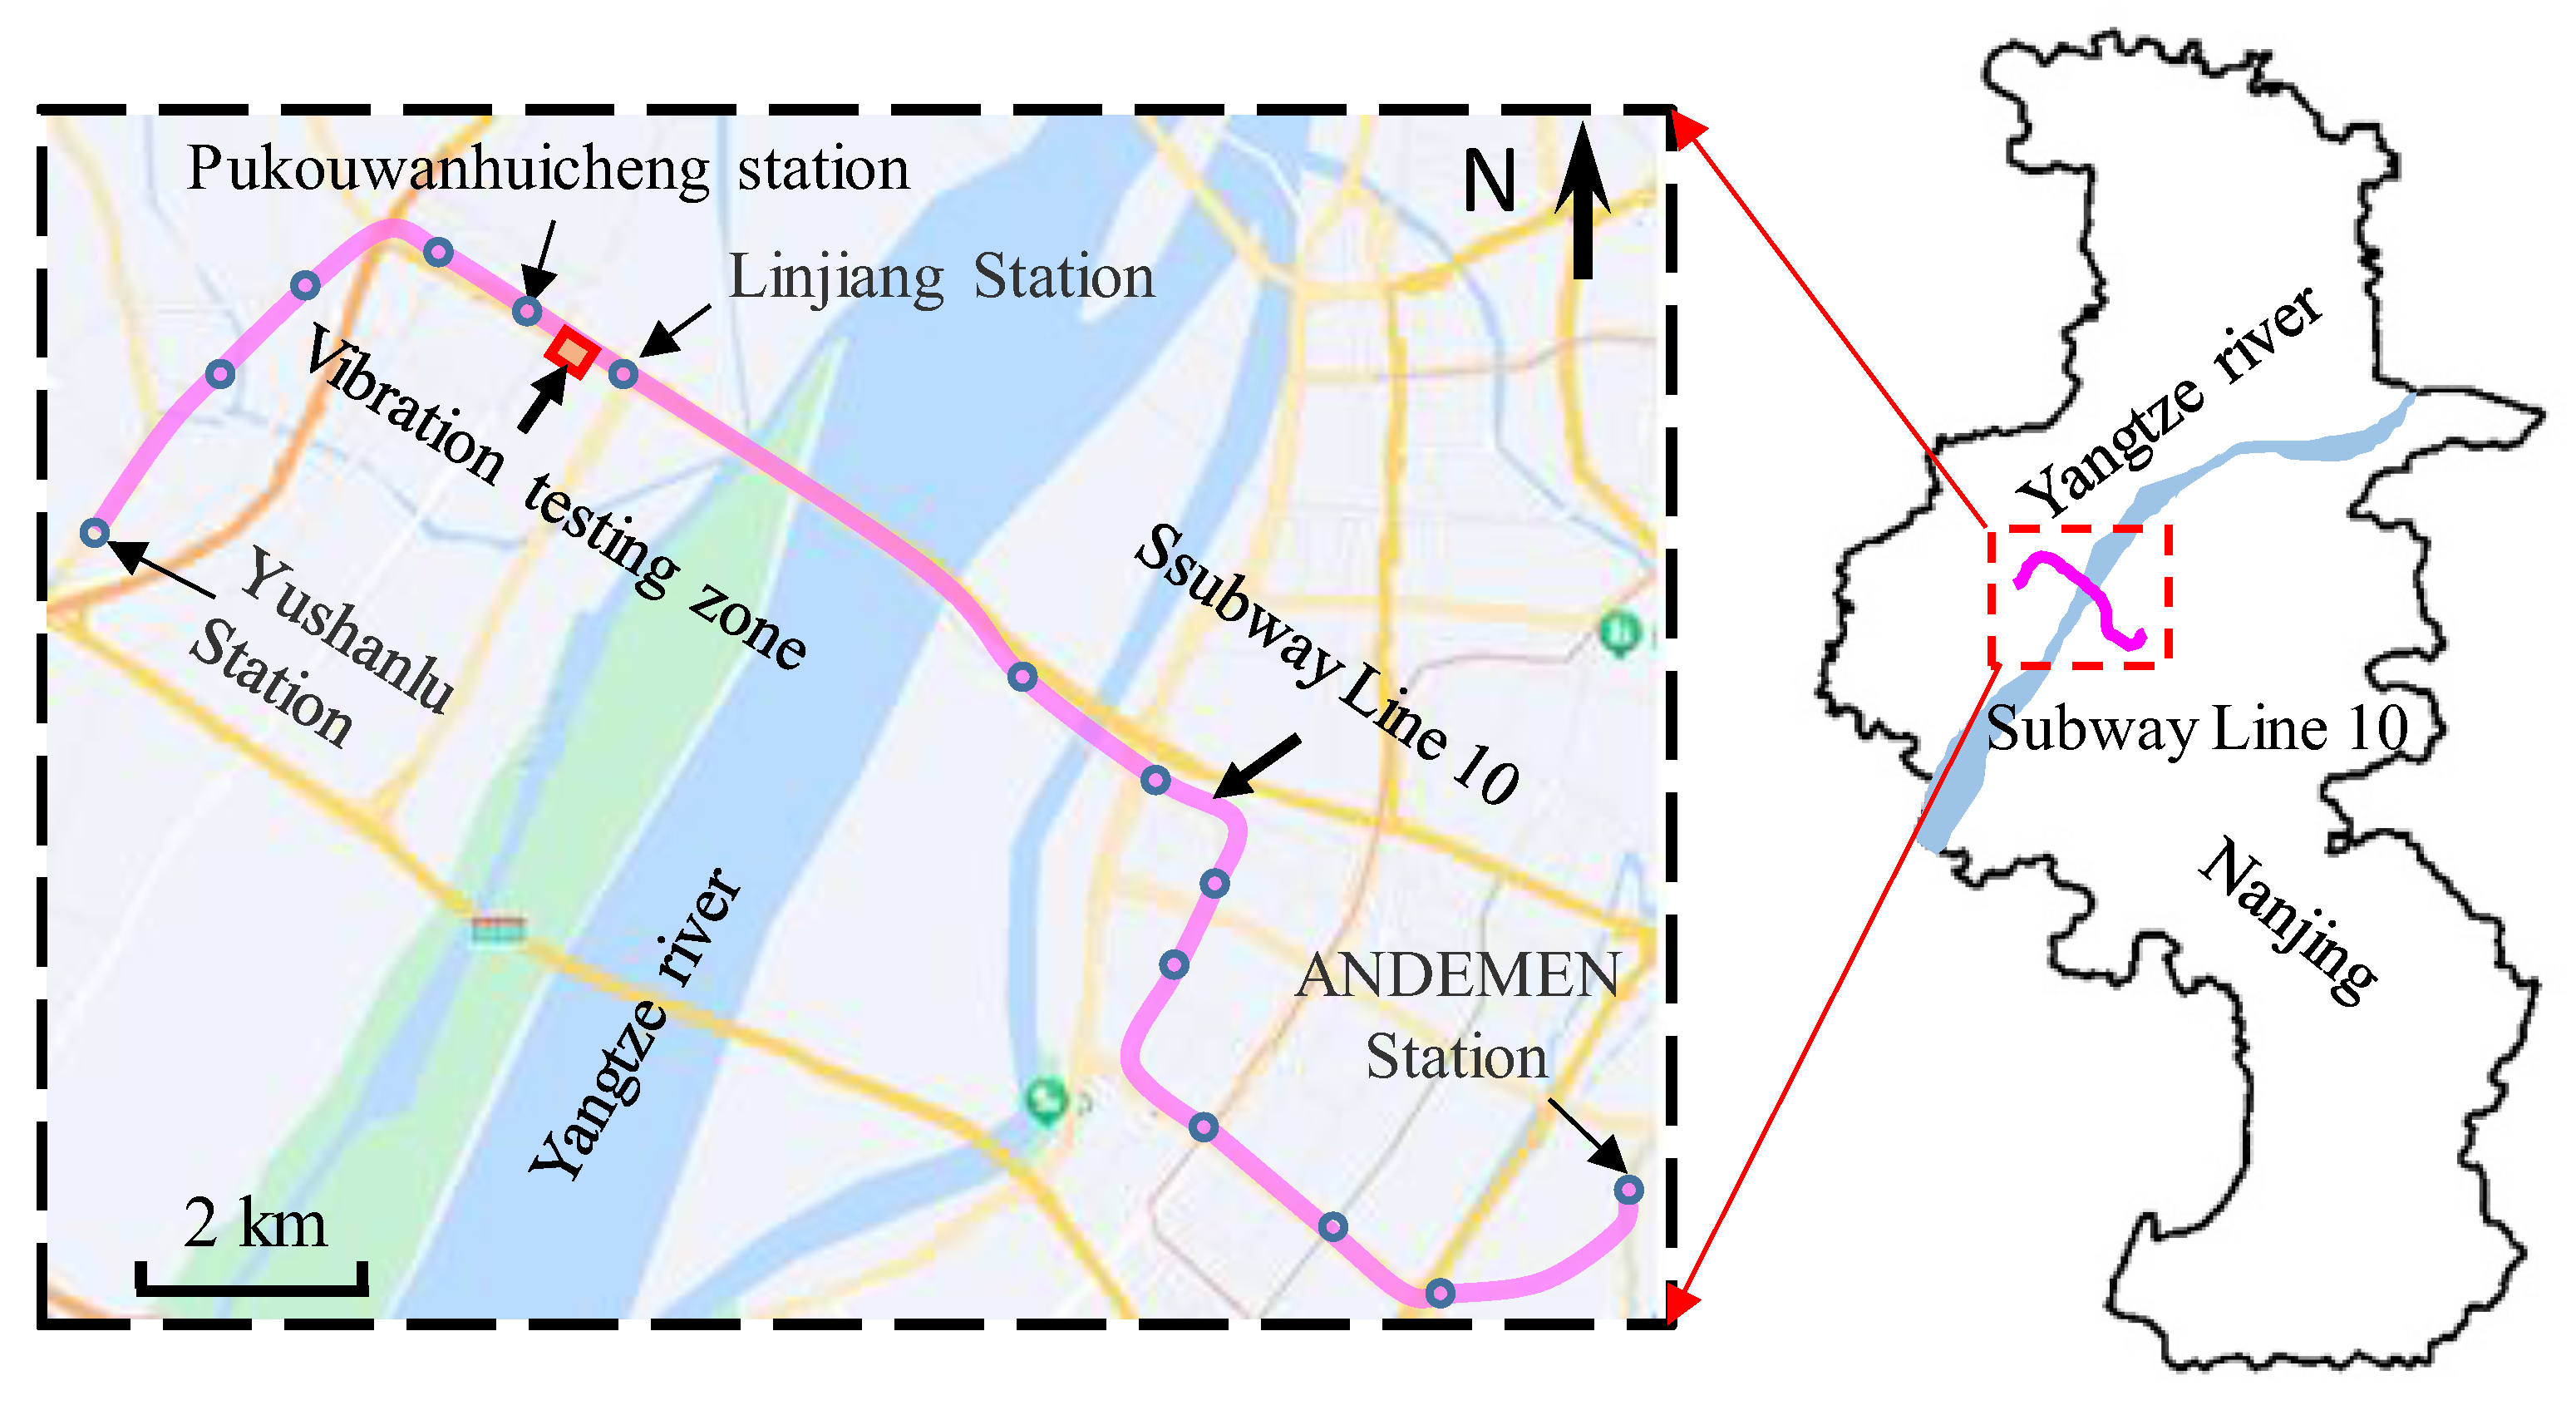
Figure 3.
Location of monitoring points.
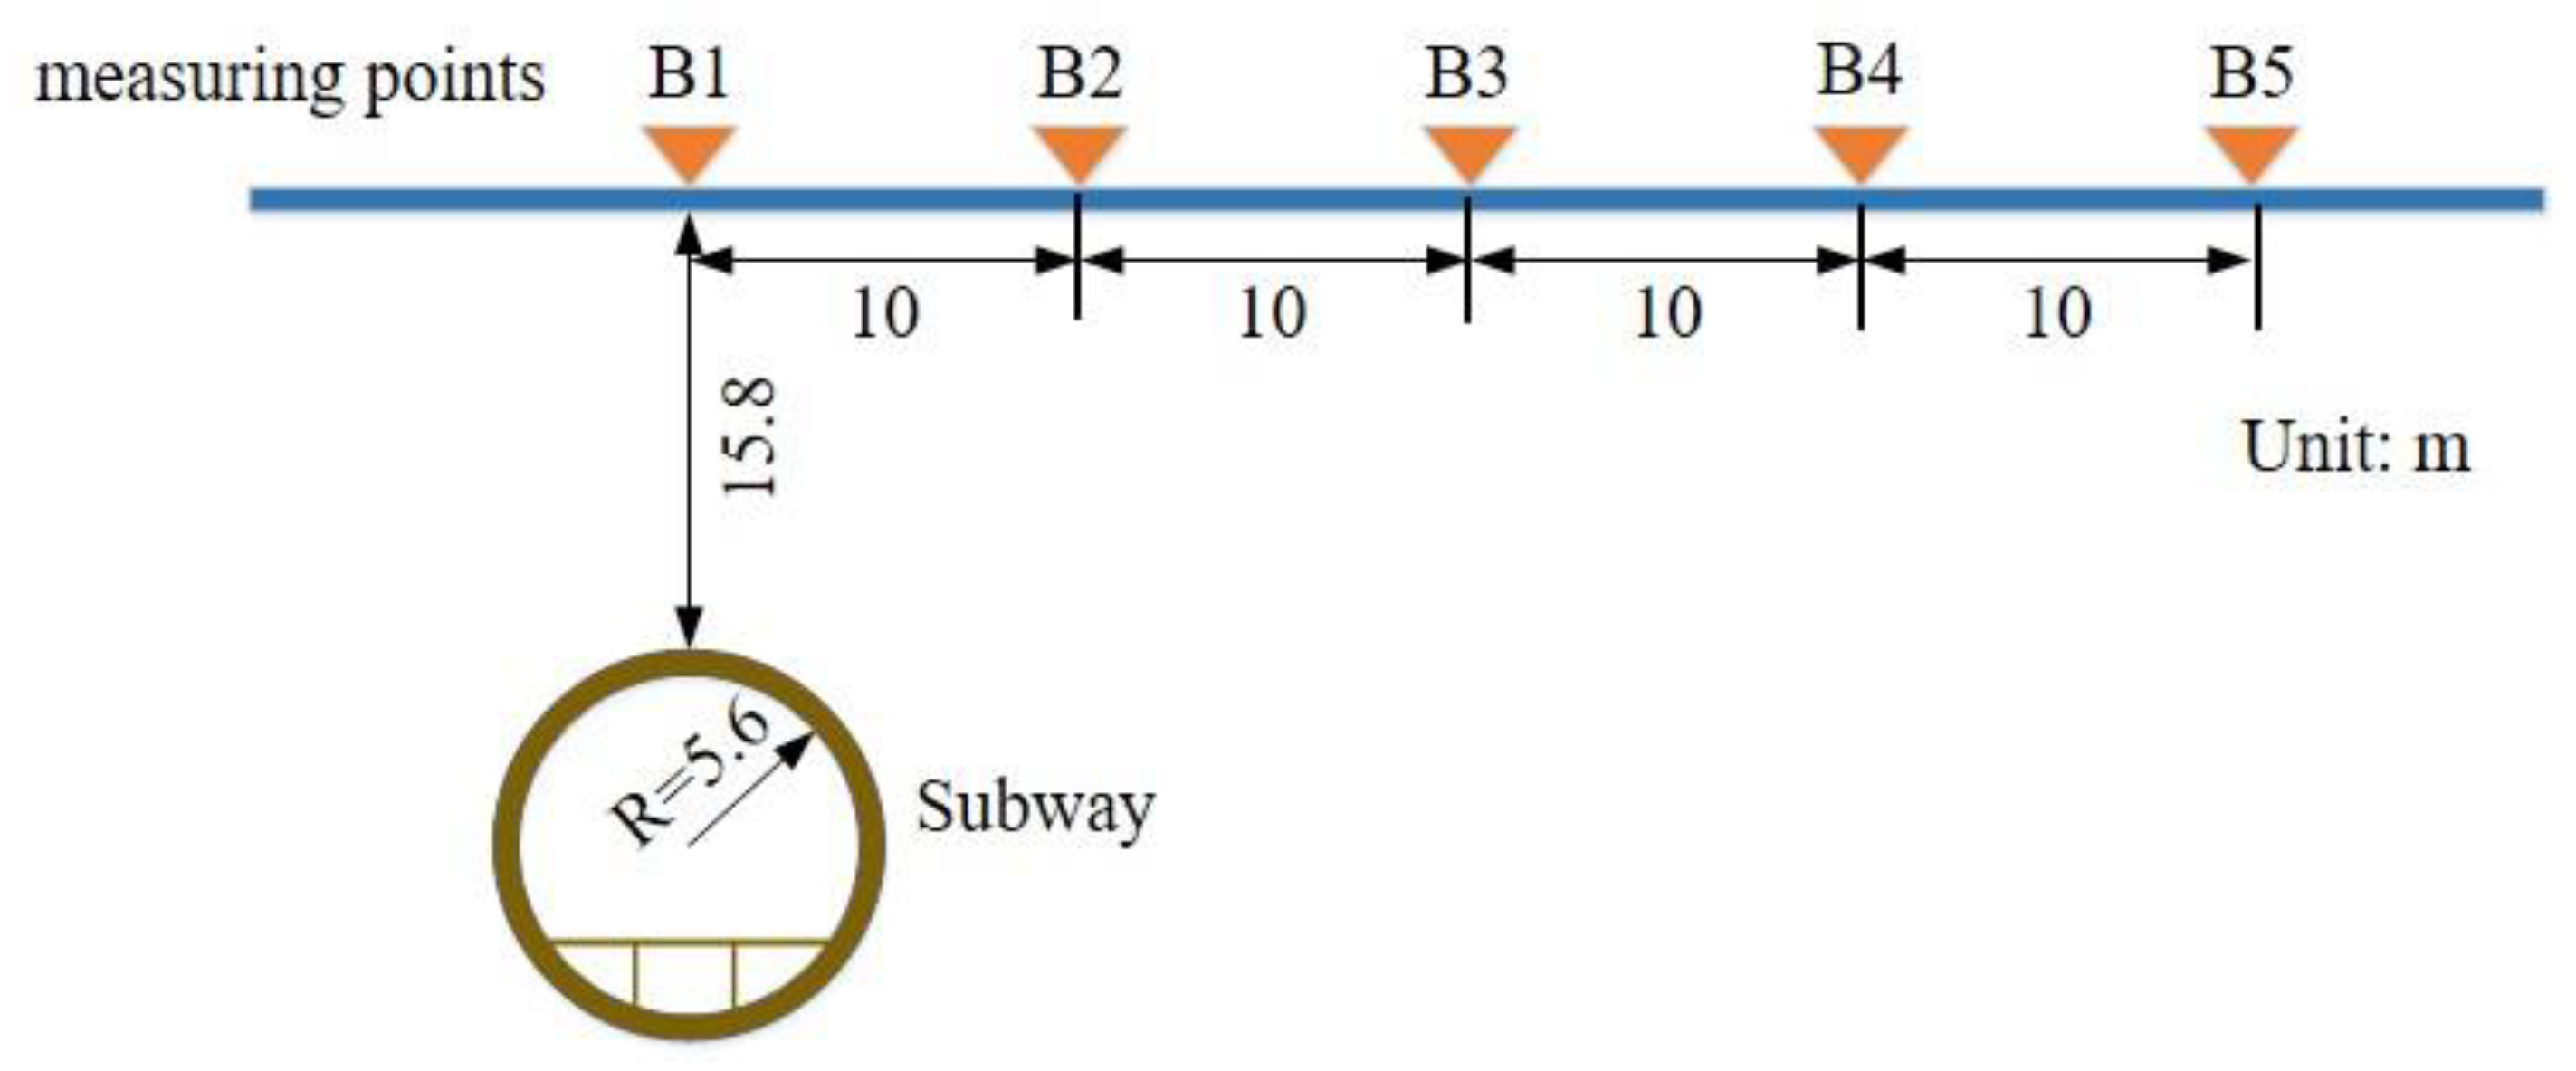
Figure 4.
The 3D vibration test results of measurement point B1: (a) in the x direction; (b) in the y direction; and (c) in the z direction.
Figure 4.
The 3D vibration test results of measurement point B1: (a) in the x direction; (b) in the y direction; and (c) in the z direction.
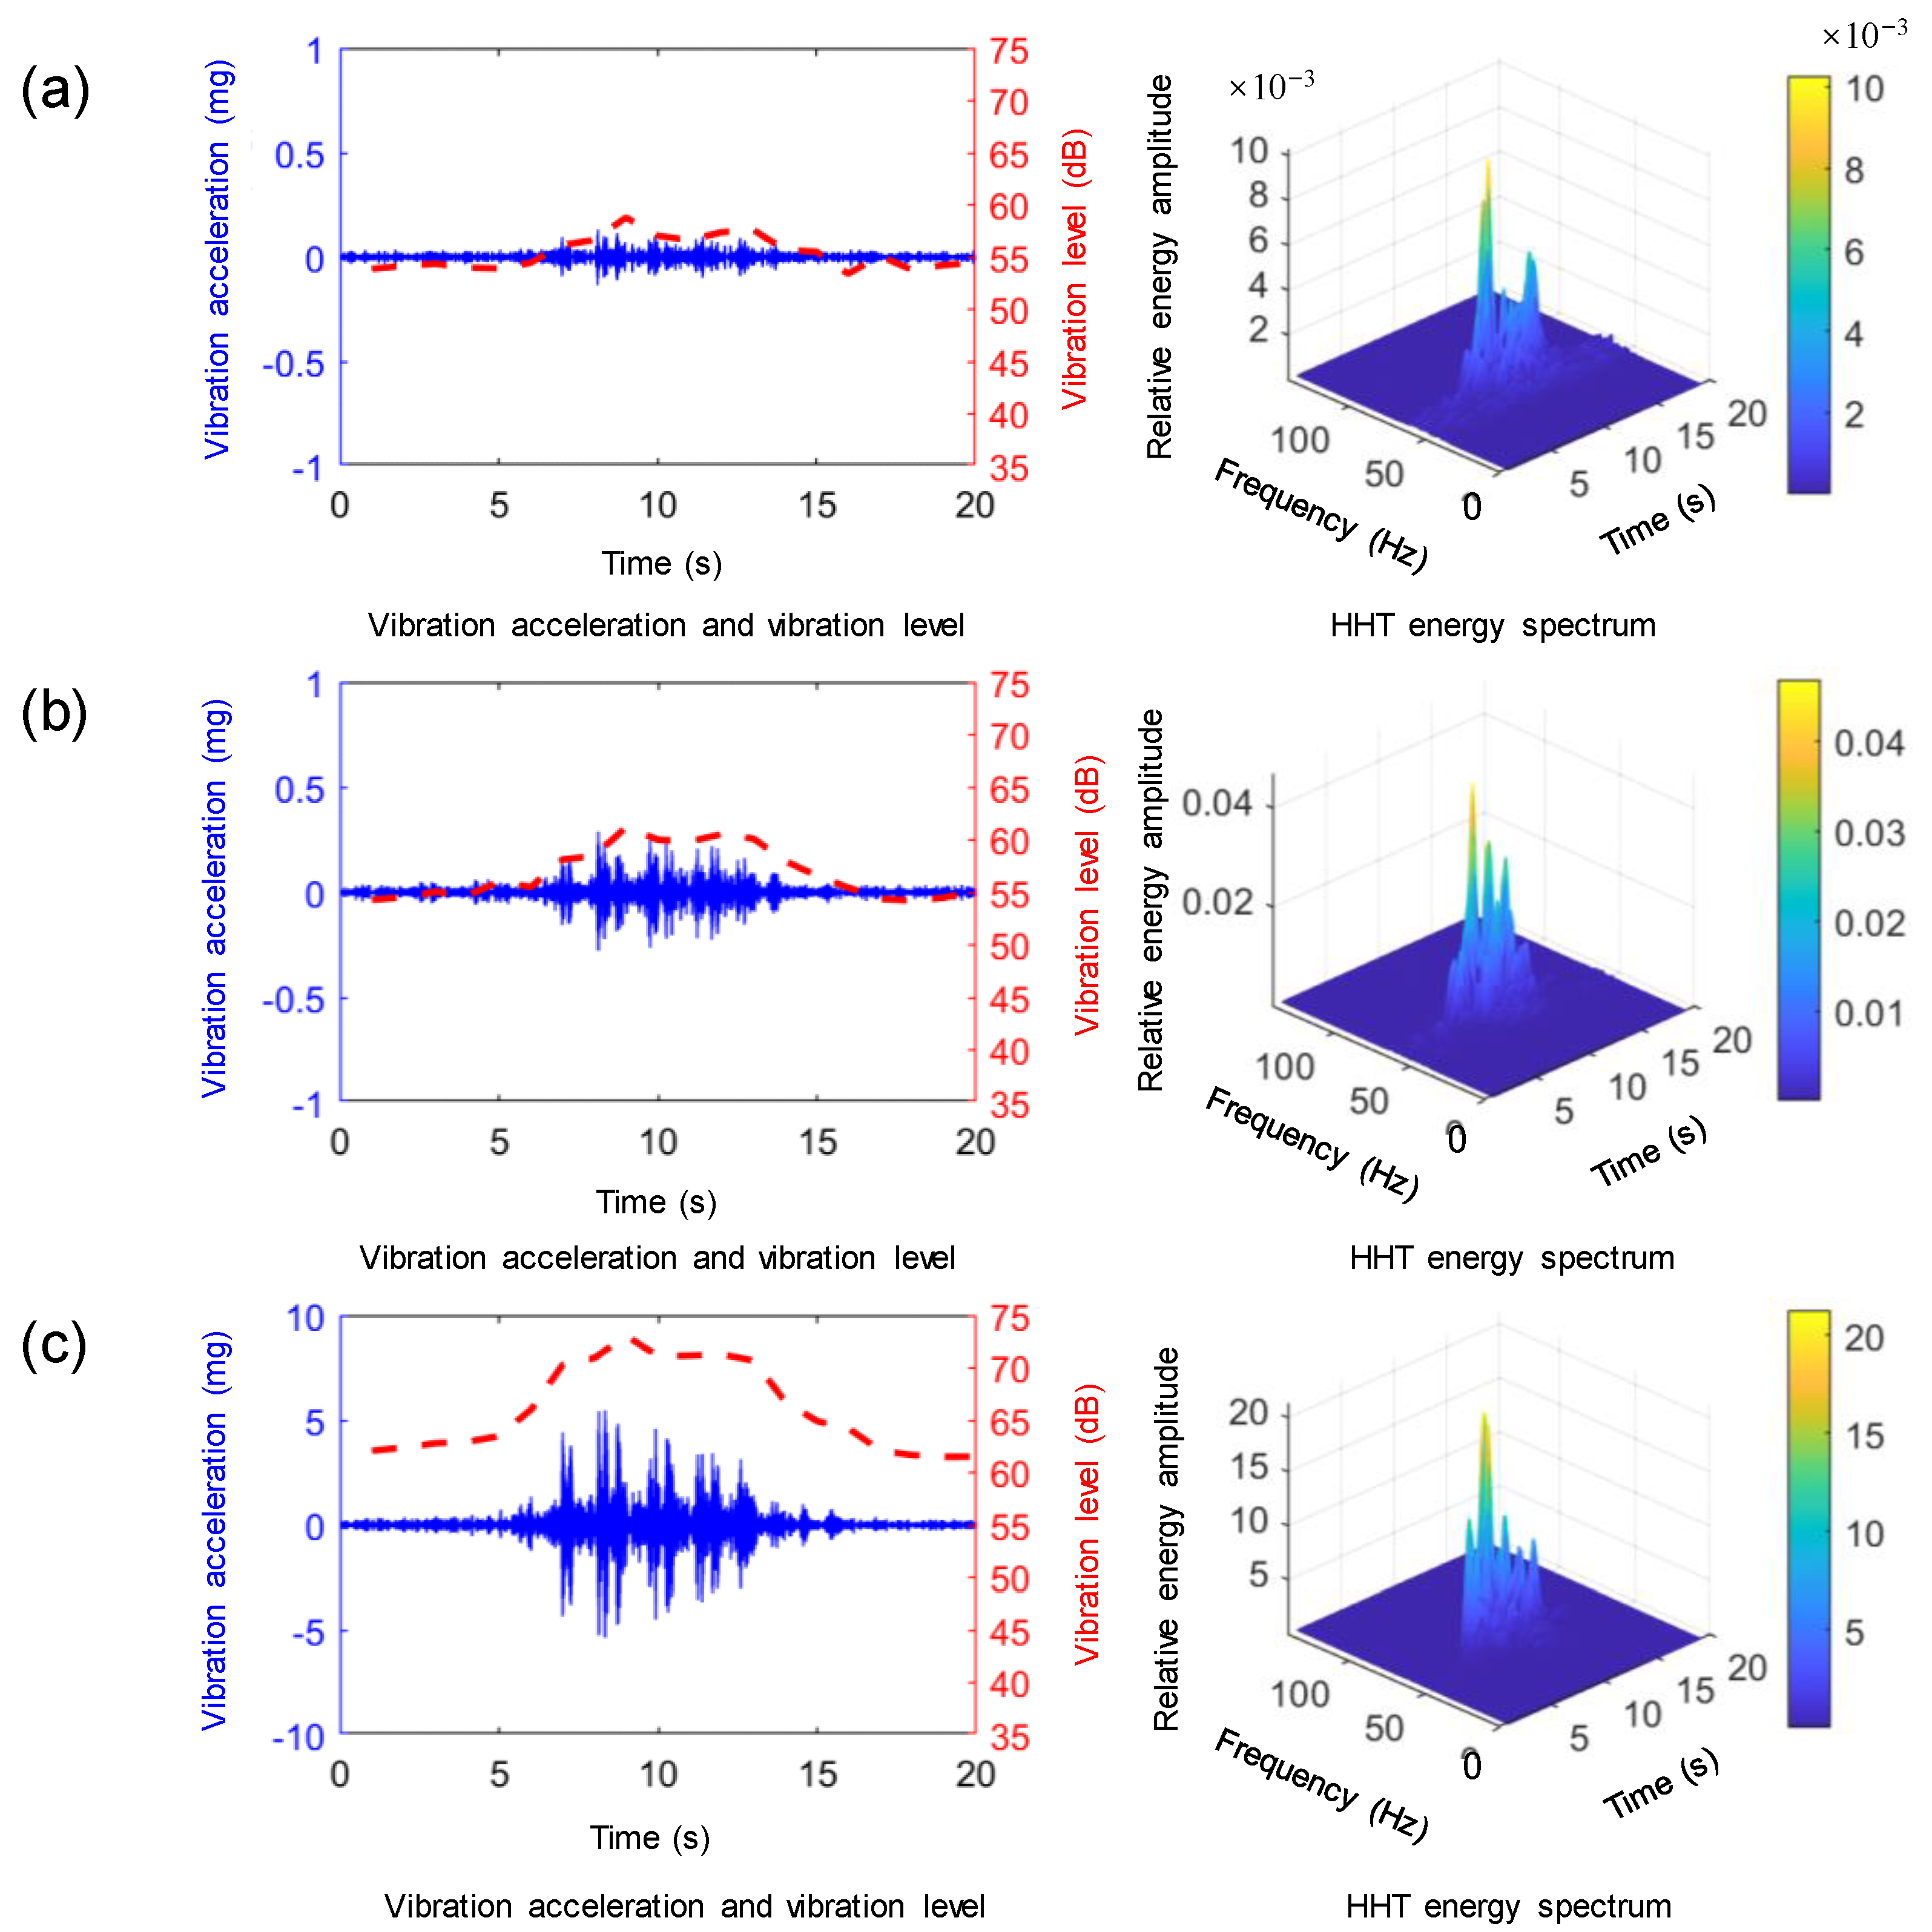
Figure 5.
The vibration attenuation along the measurement line: (a) Time history spectrum; (b) FFT frequency spectrum; (c) HHT energy spectrum; and (d) one-third octave spectrum.
Figure 5.
The vibration attenuation along the measurement line: (a) Time history spectrum; (b) FFT frequency spectrum; (c) HHT energy spectrum; and (d) one-third octave spectrum.

Figure 6.
The advantage-frequency migration effect.
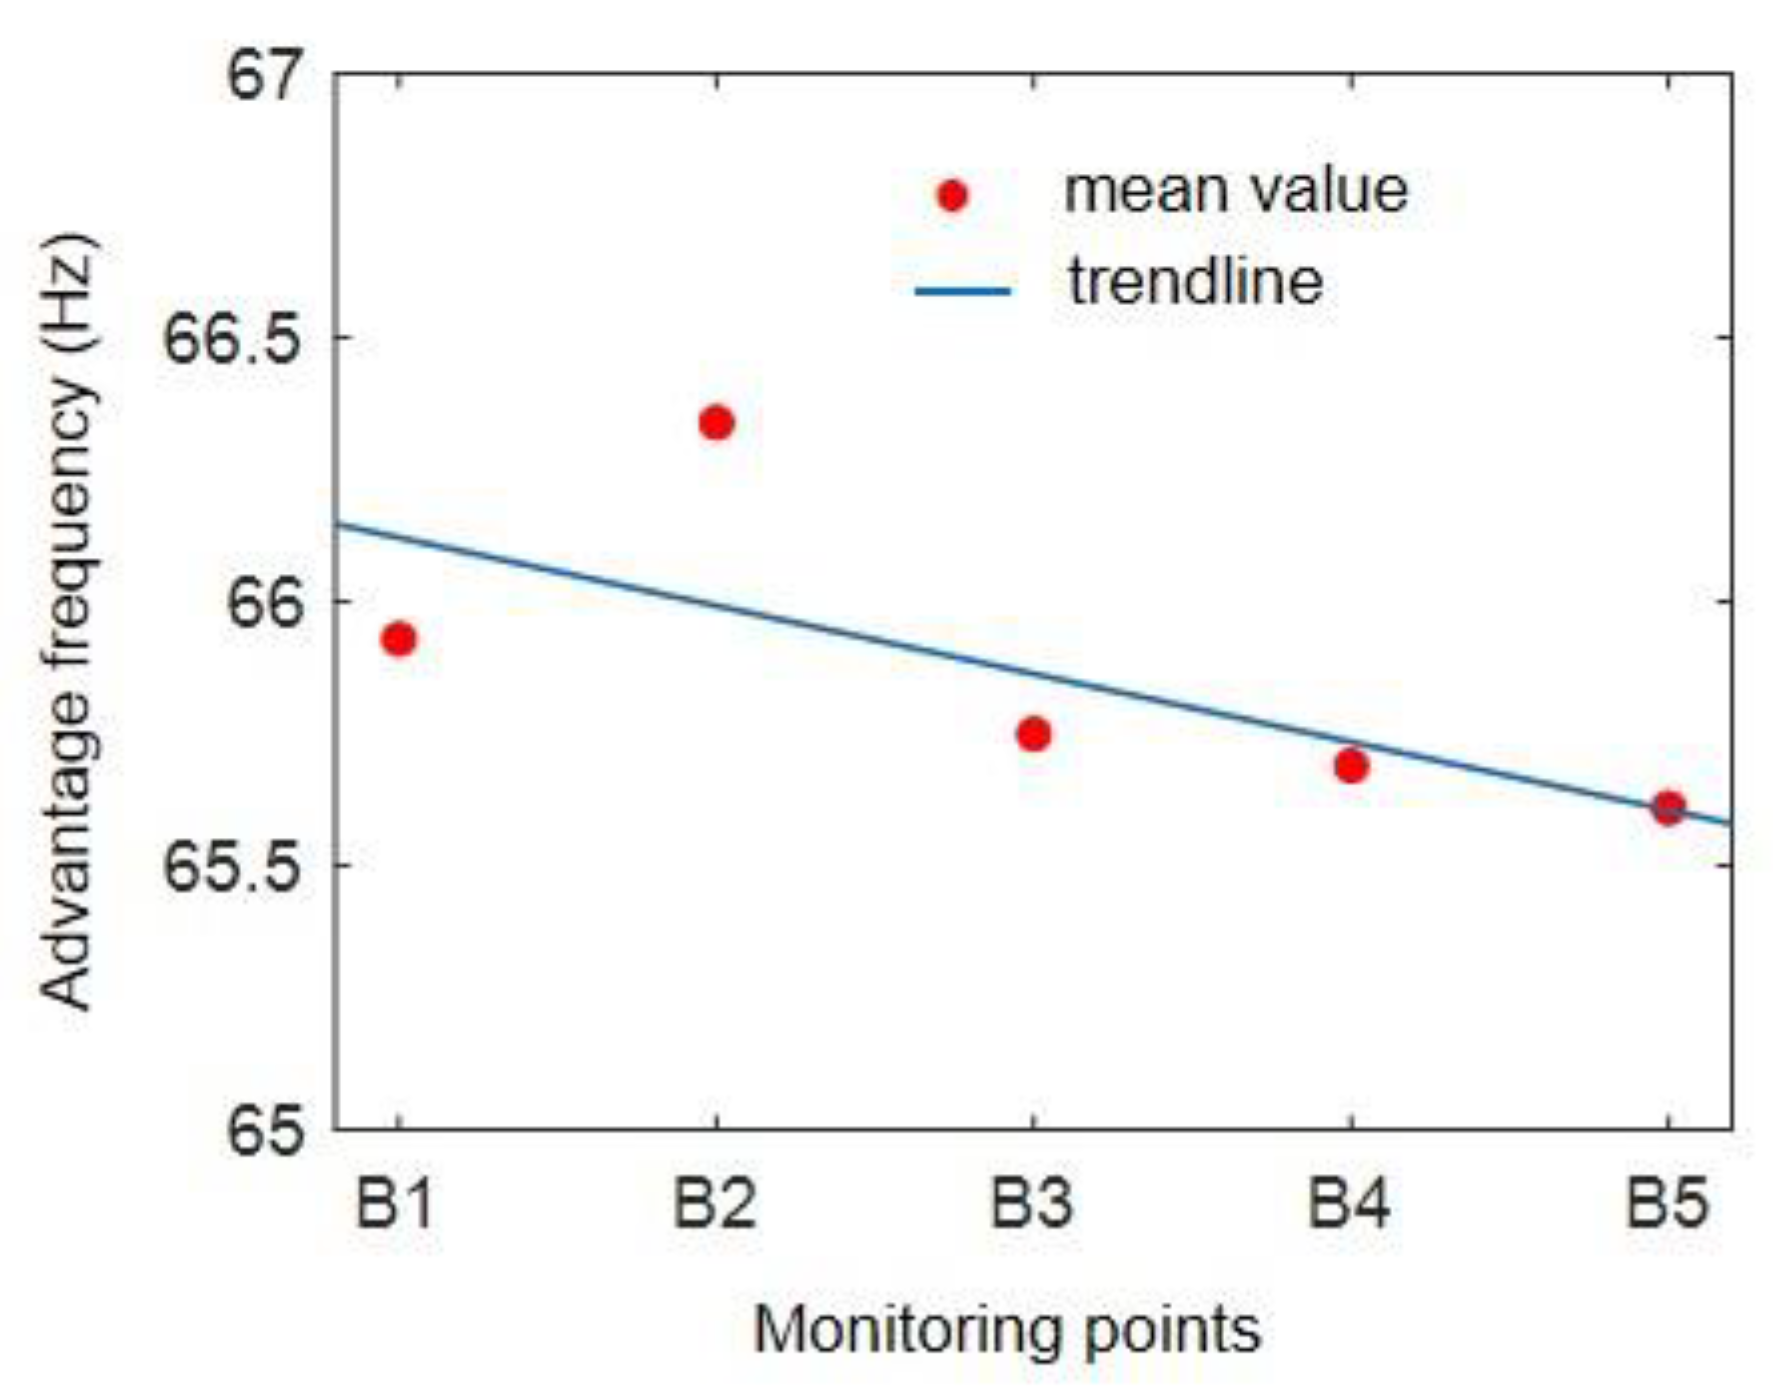
Figure 7.
The numerical model.
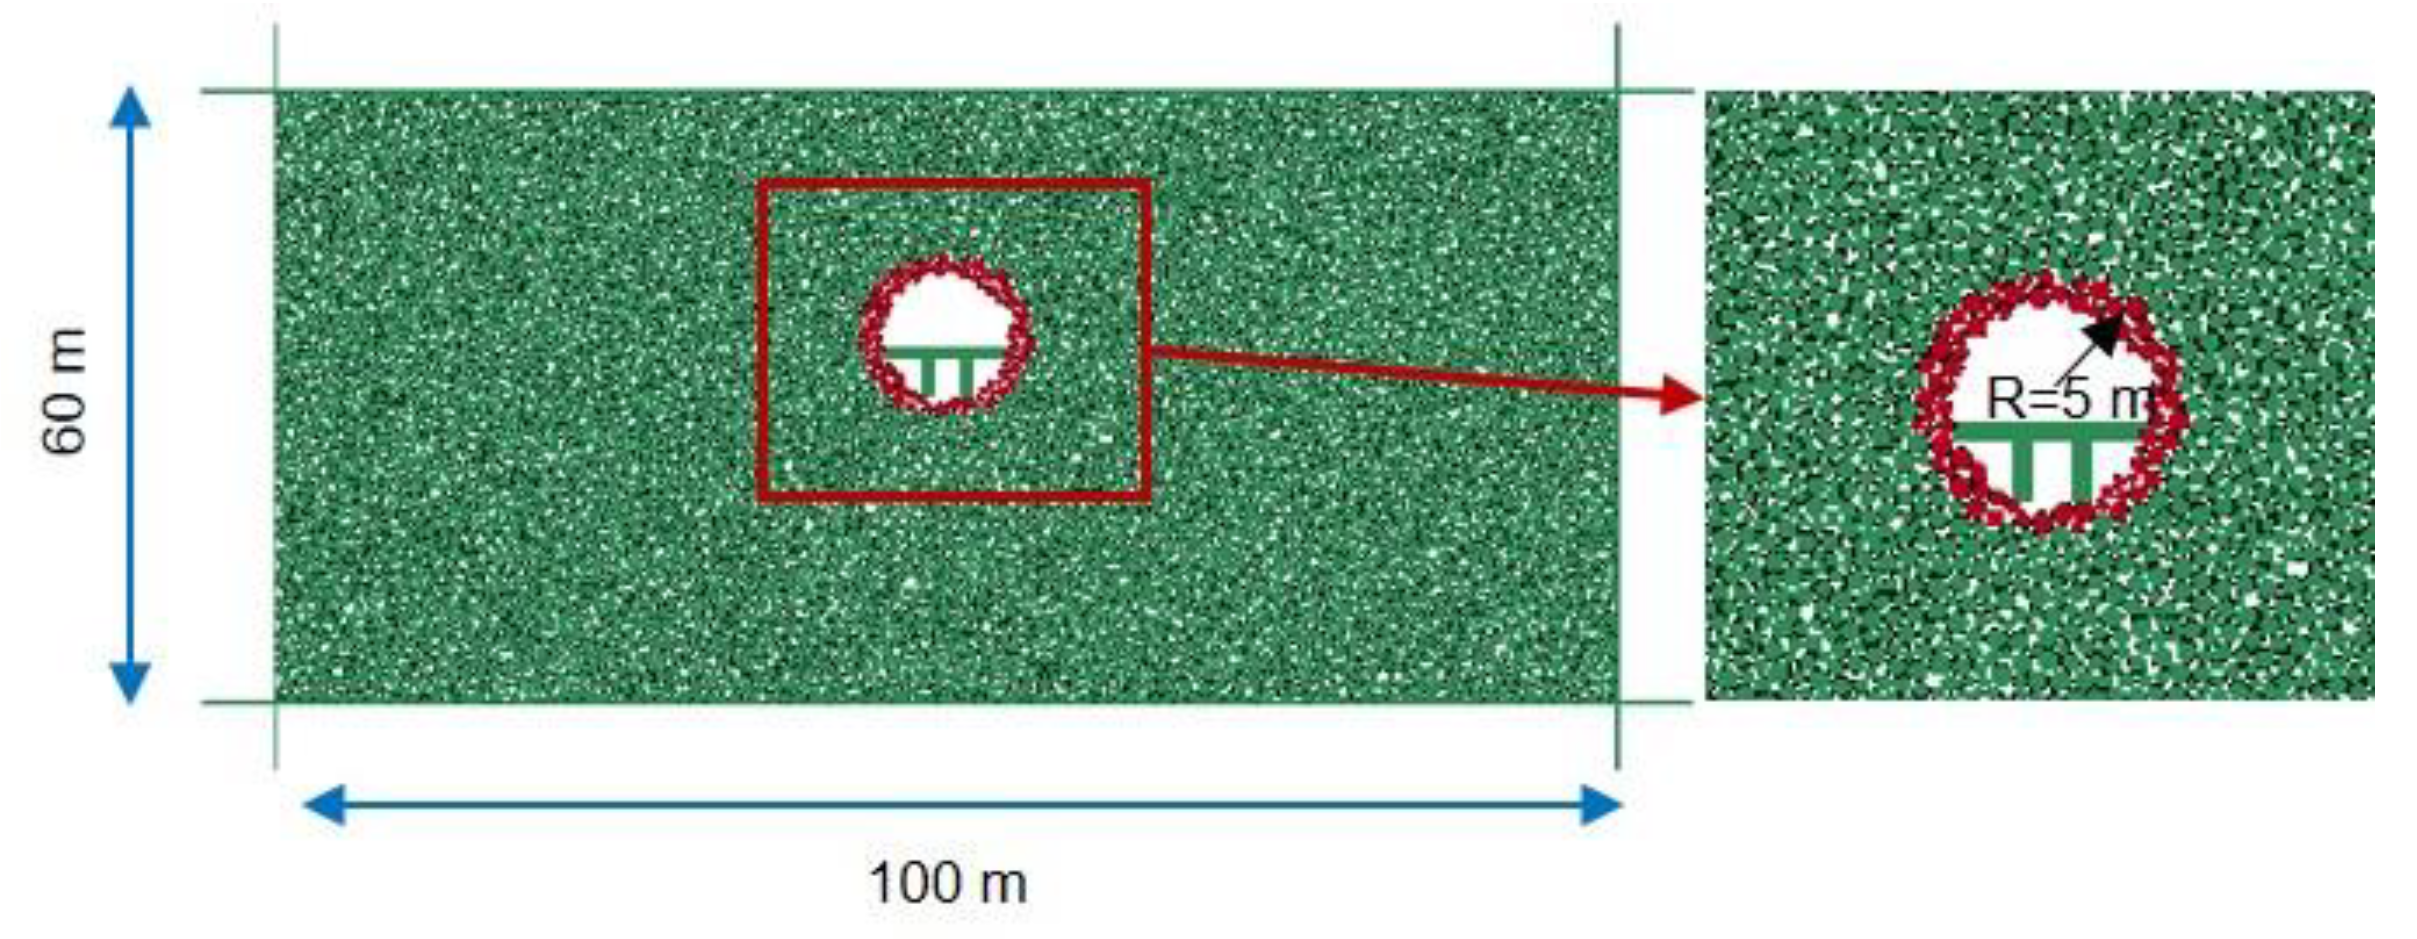
Figure 8.
The measured subway vibration load.

Figure 9.
Vertical displacement of sand under subway vibration load: (a) 2 s; (b) 4 s; (c) 6 s; (d) 8 s.
Figure 9.
Vertical displacement of sand under subway vibration load: (a) 2 s; (b) 4 s; (c) 6 s; (d) 8 s.

Figure 10.
Selected monitoring areas.

Figure 11.
The mean of particle coordination numbers in the monitoring areas: (a) monitoring area 1; (b) monitoring area 2; (c) monitoring area 3.
Figure 11.
The mean of particle coordination numbers in the monitoring areas: (a) monitoring area 1; (b) monitoring area 2; (c) monitoring area 3.
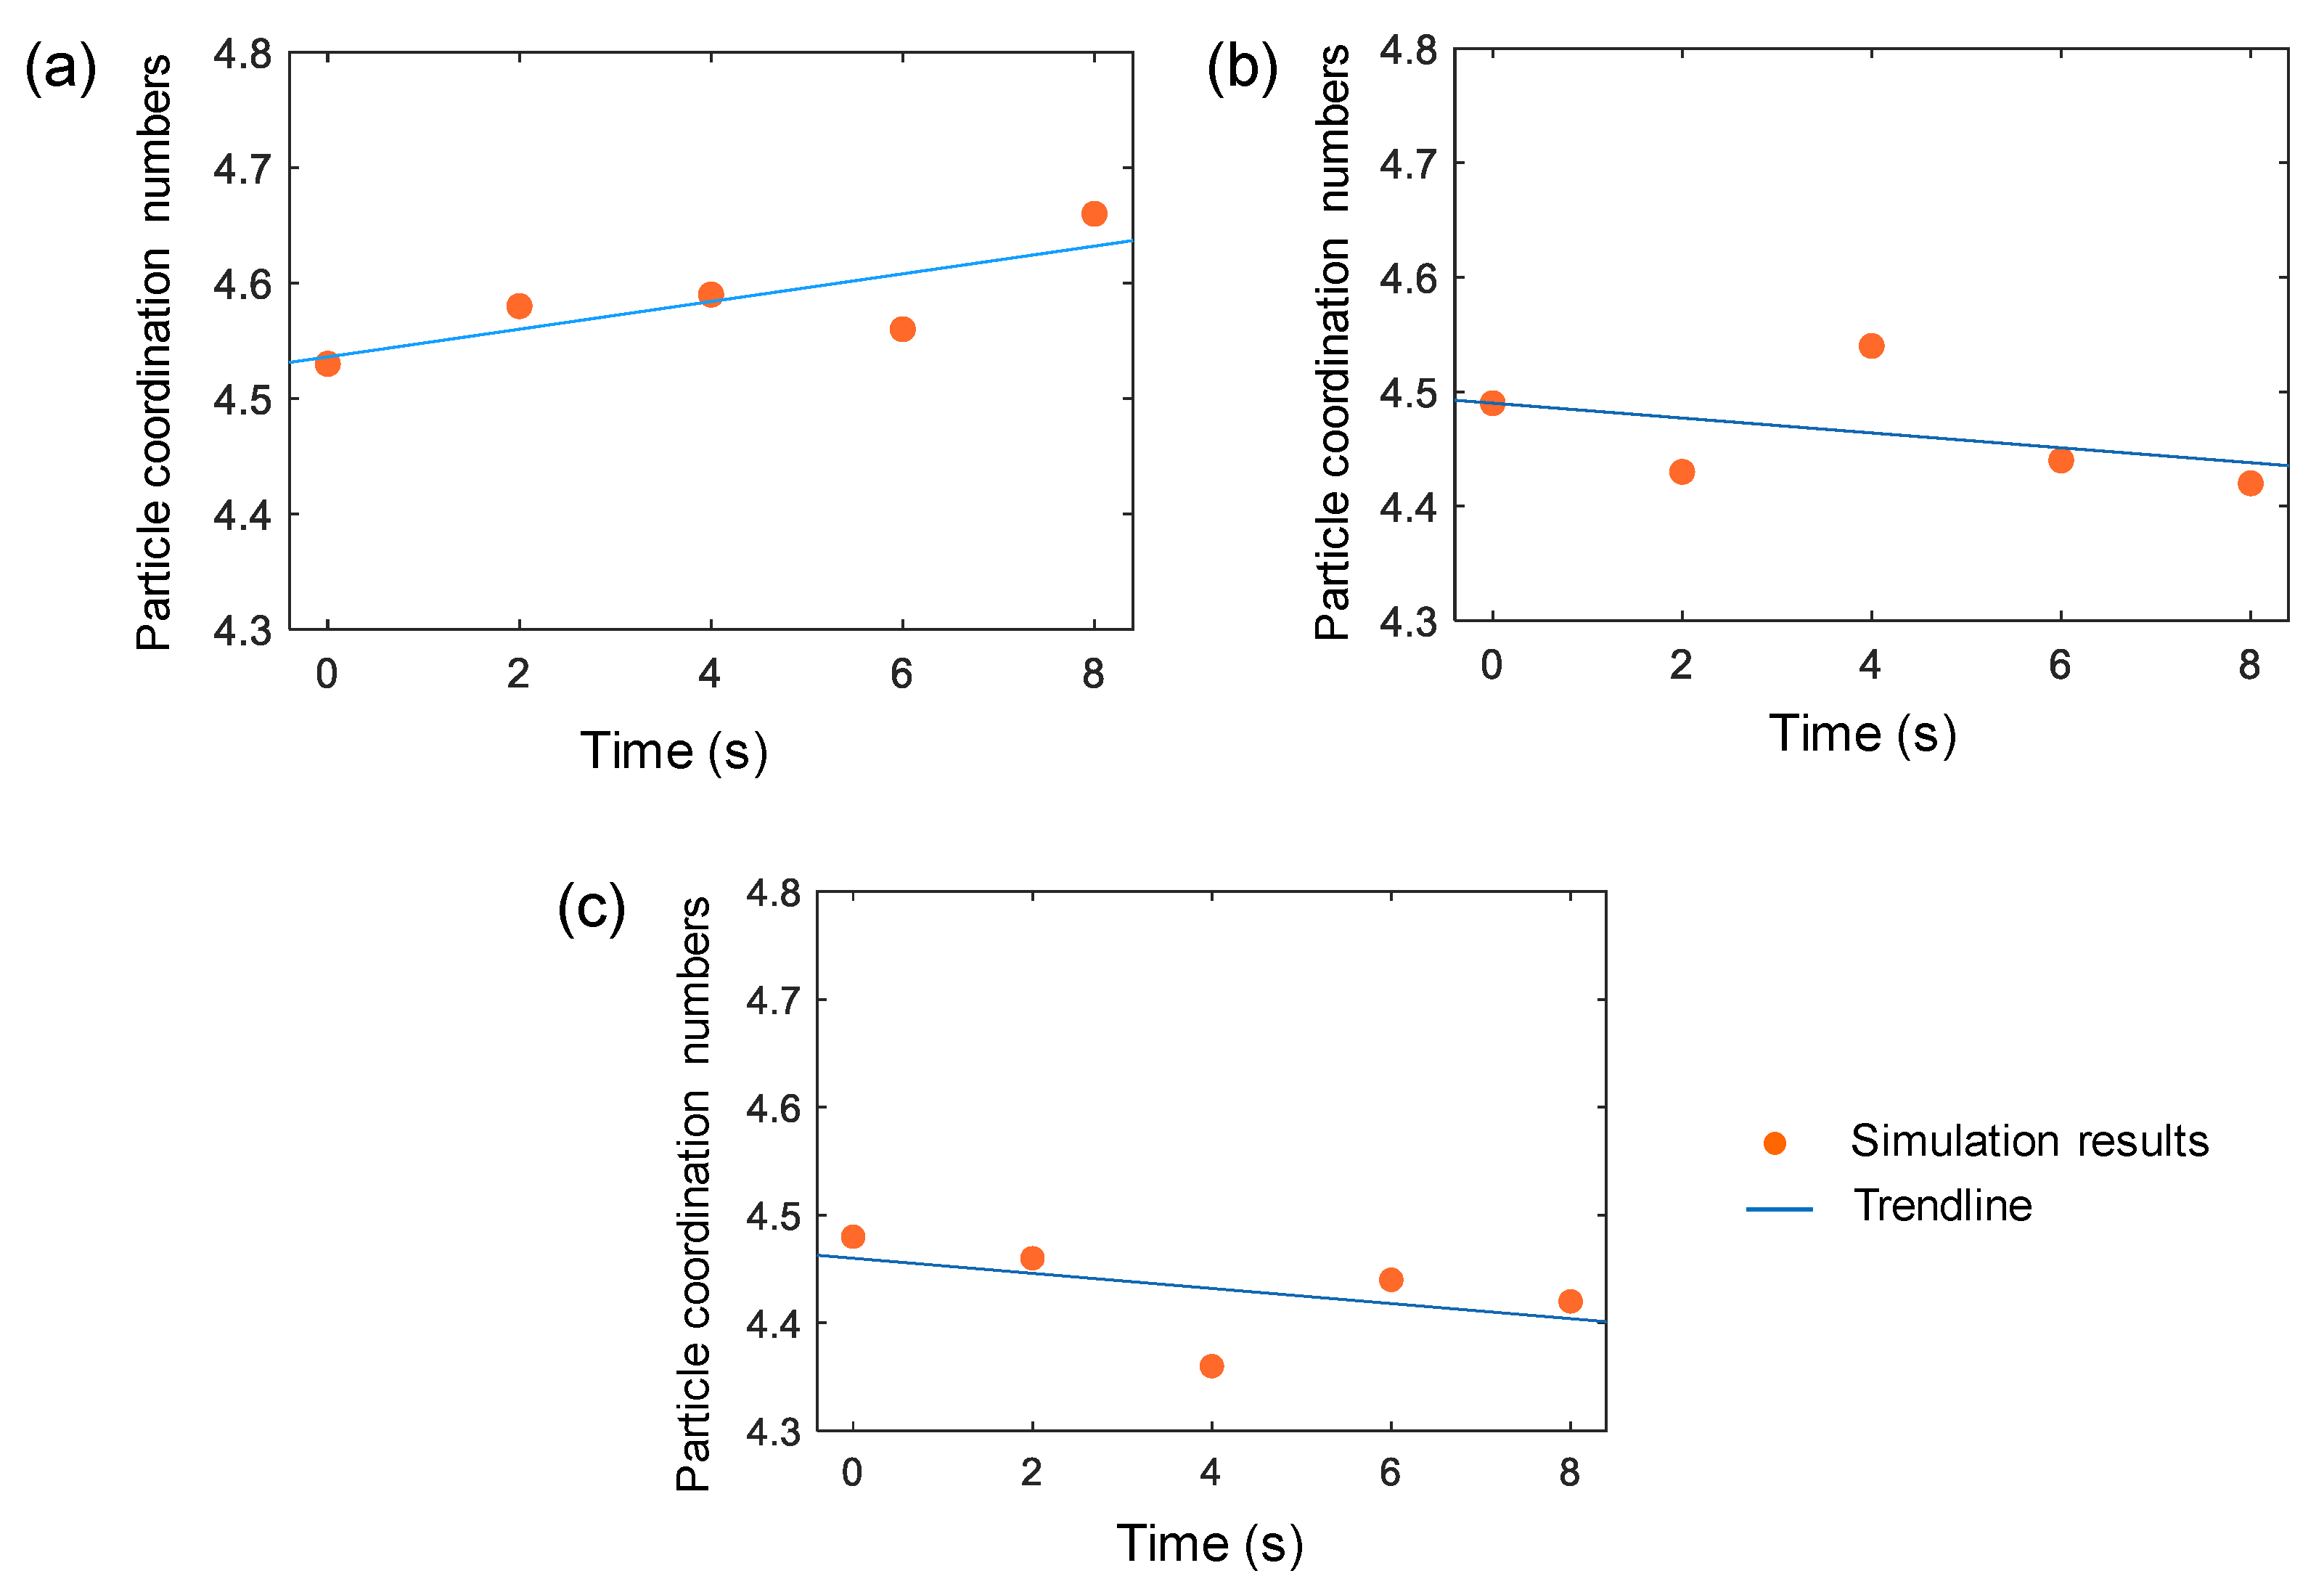
Figure 12.
The statistics of normal contact force: (a) monitoring area 1; (b) monitoring area 2; (c) monitoring area 3.
Figure 12.
The statistics of normal contact force: (a) monitoring area 1; (b) monitoring area 2; (c) monitoring area 3.
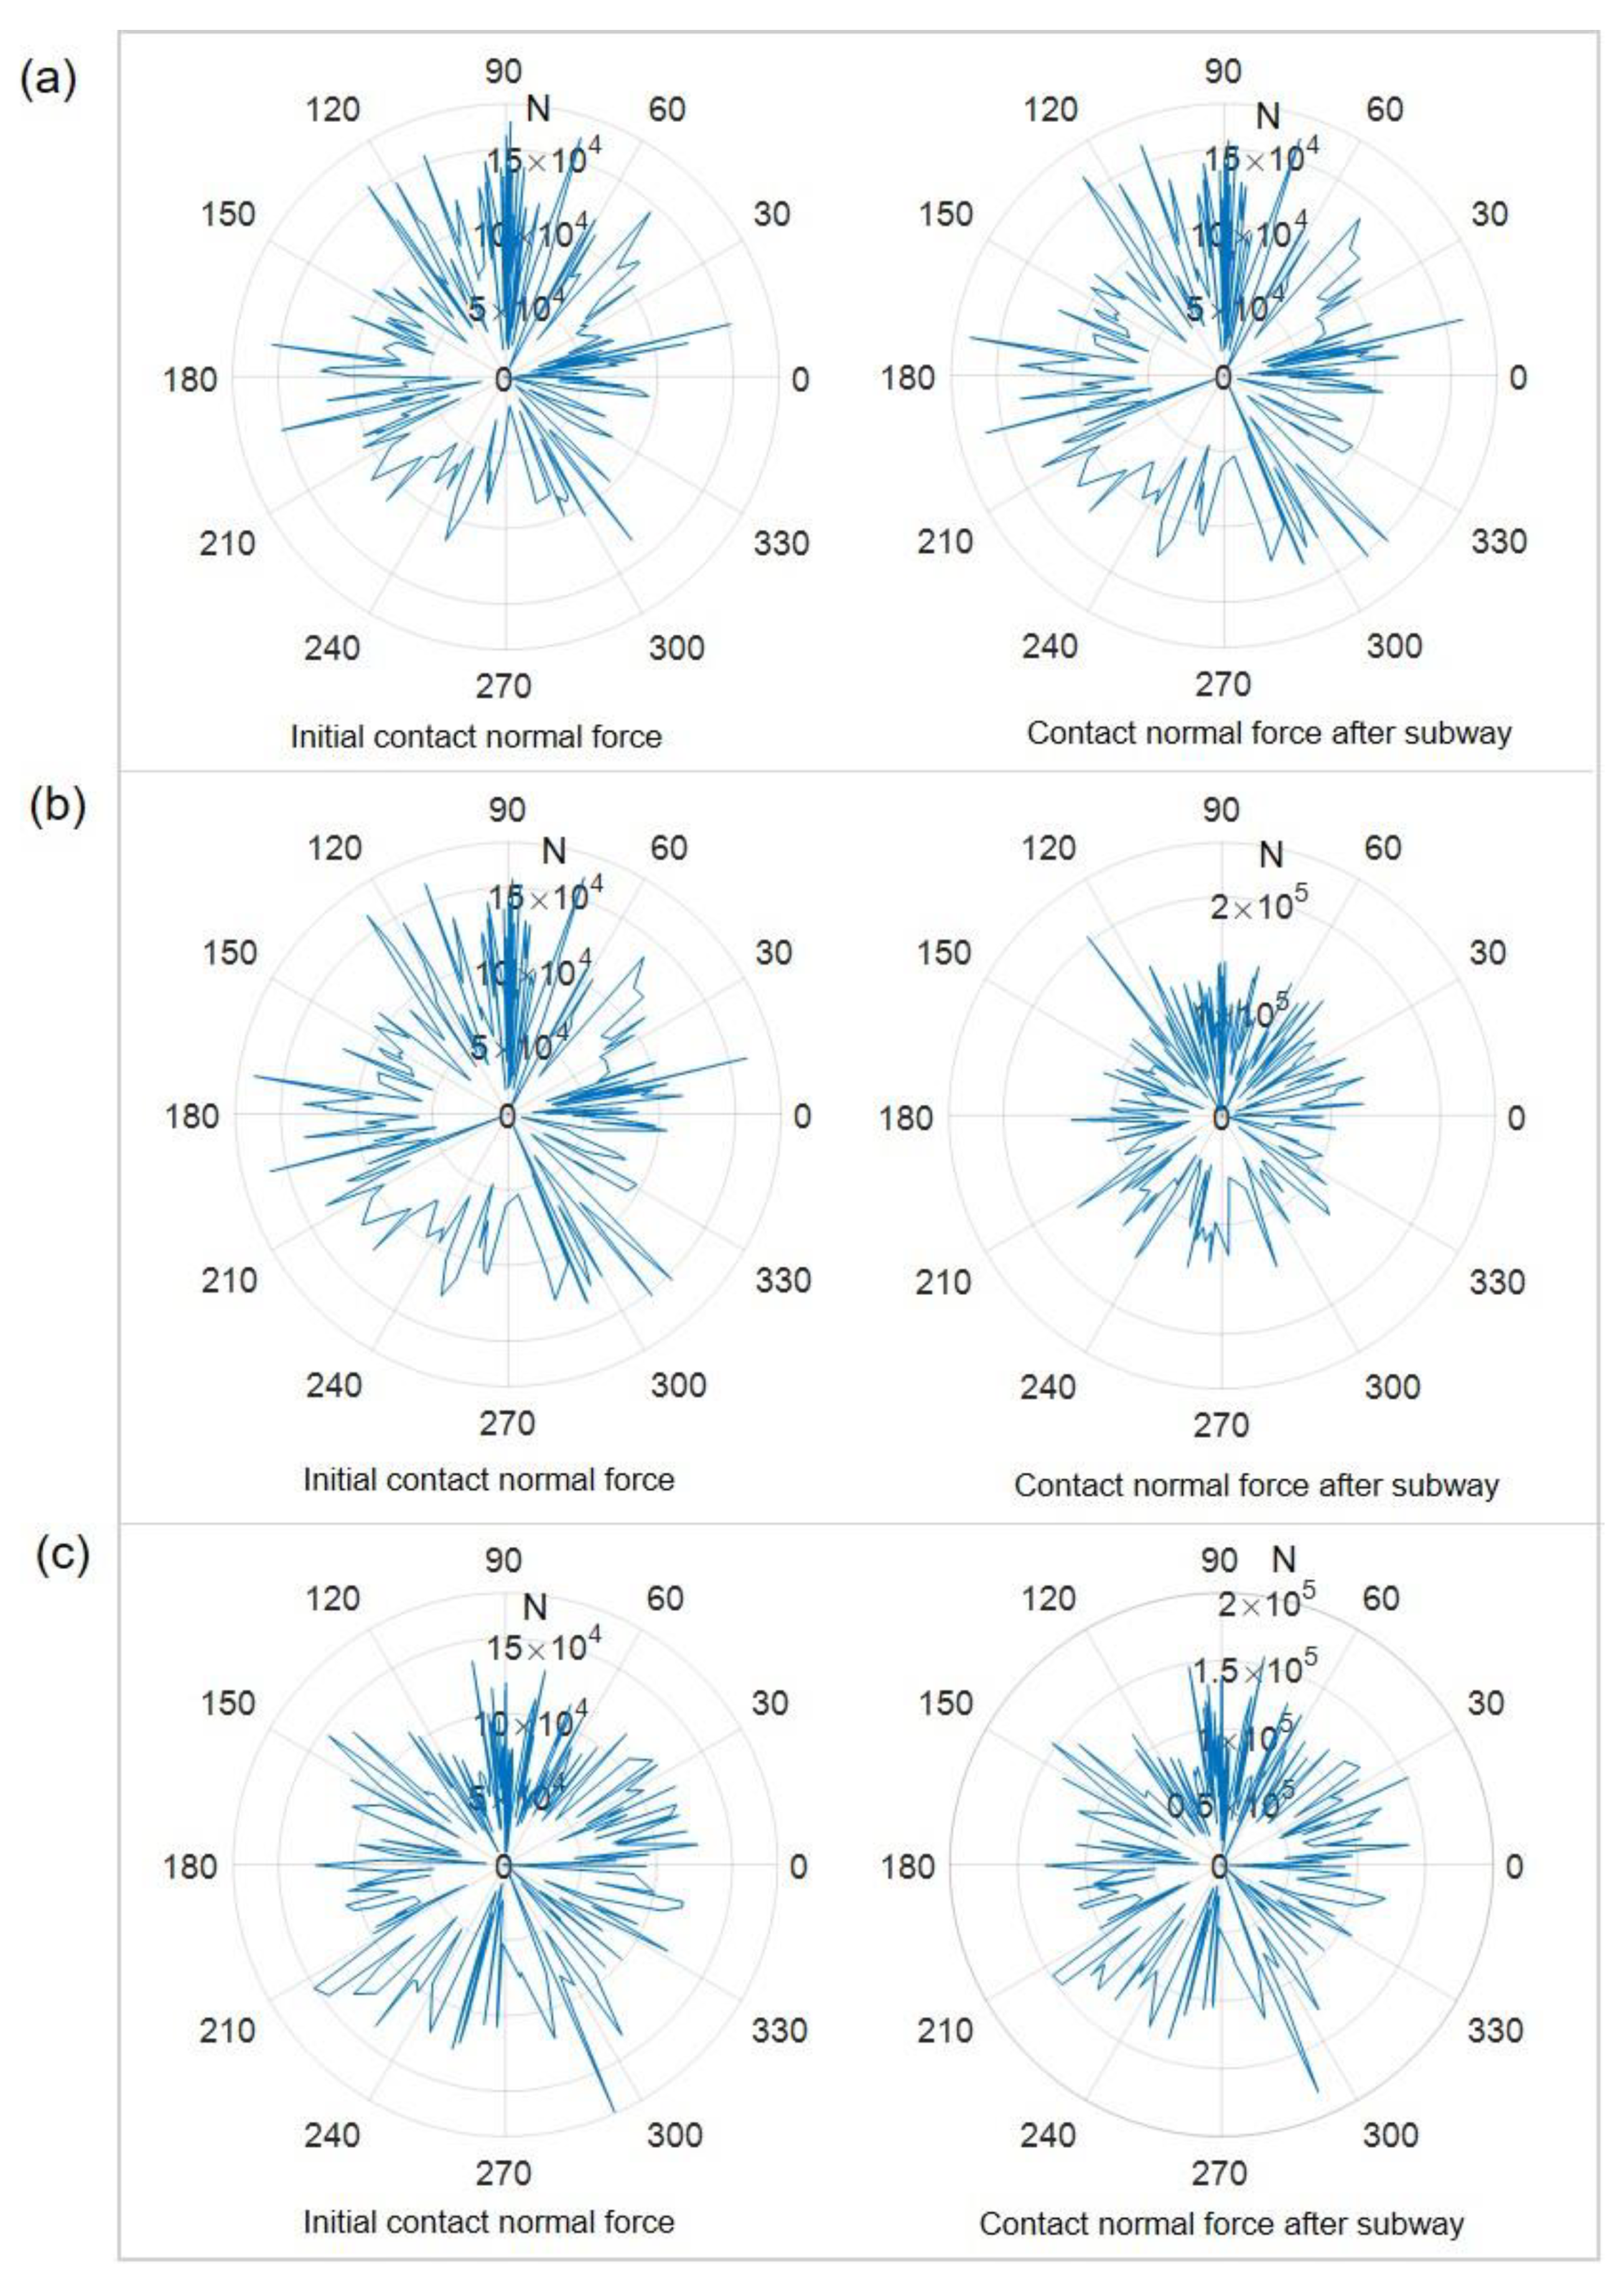
Figure 13.
The statistics of tangential contact force: (a) monitoring area 1; (b) monitoring area 2; (c) monitoring area 3.
Figure 13.
The statistics of tangential contact force: (a) monitoring area 1; (b) monitoring area 2; (c) monitoring area 3.

Figure 14.
Change of local porosity: (a) initial porosity; (b) the porosity after deformation.

Figure 15.
The statistical results of the particle rotation angle: (a) monitoring area 1; (b) monitoring area 2; (c) monitoring area 3.
Figure 15.
The statistical results of the particle rotation angle: (a) monitoring area 1; (b) monitoring area 2; (c) monitoring area 3.
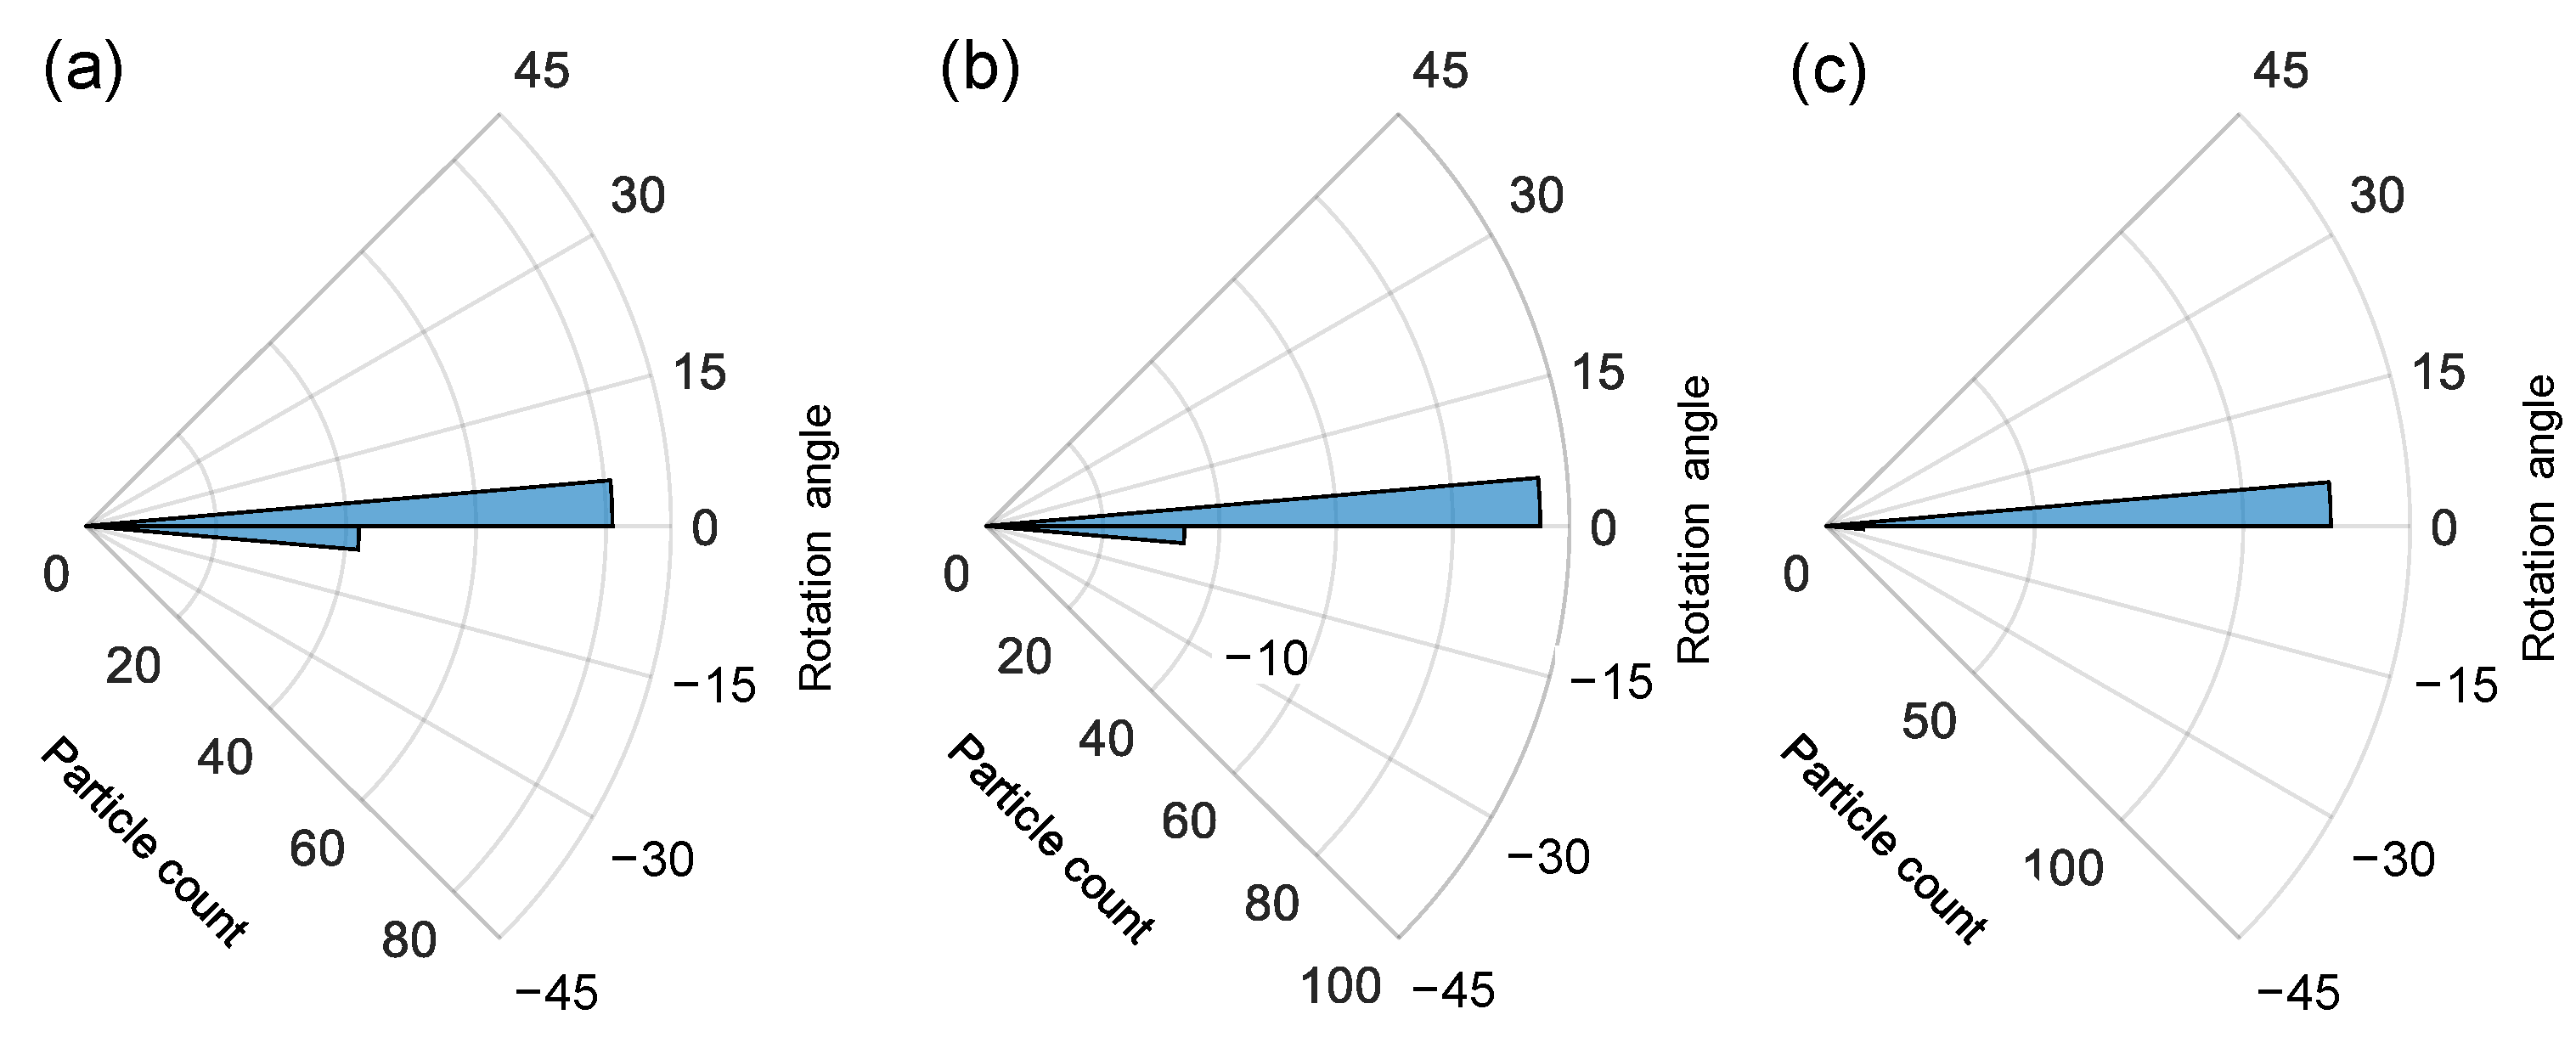
Figure 16.
Relational degree of physical and mechanical parameters with deformation.
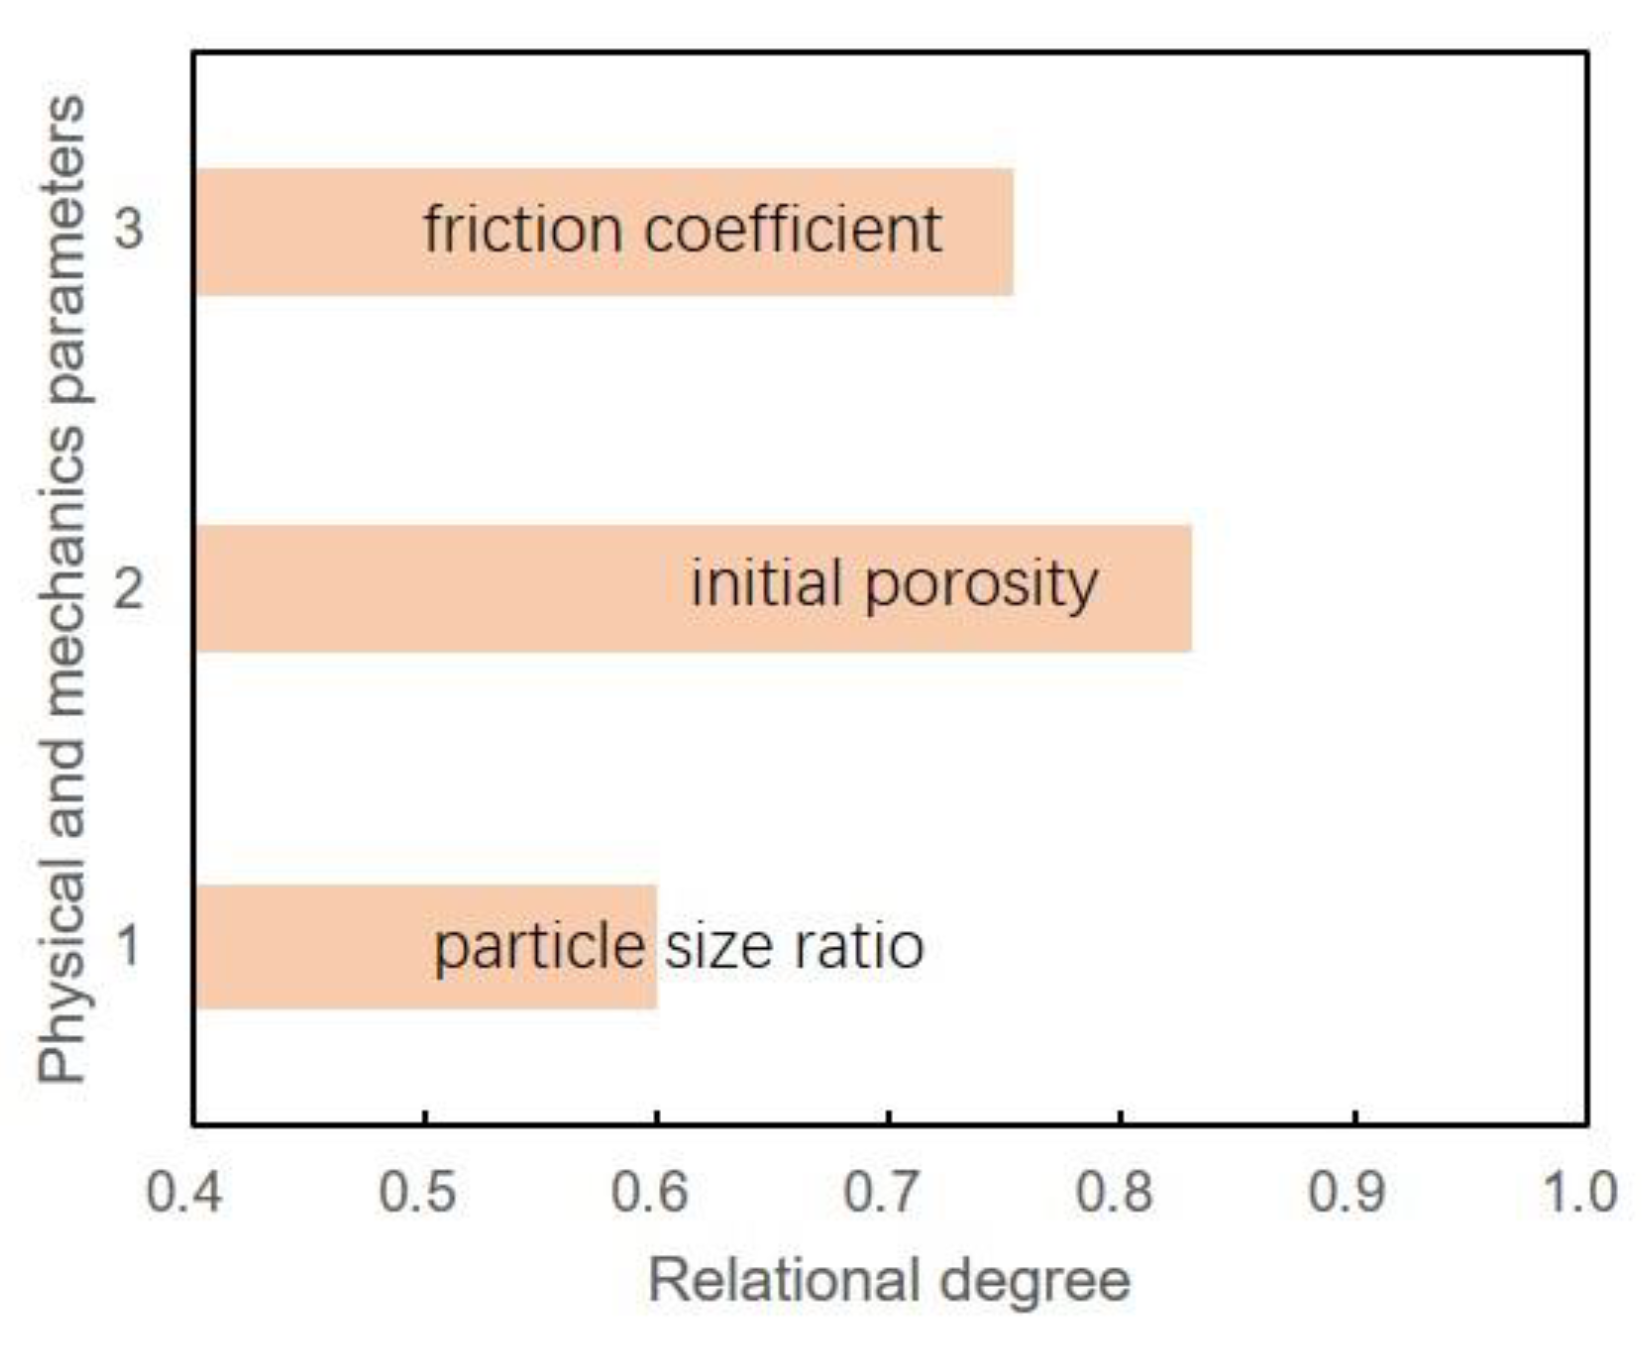
Figure 17.
Relational degree of microscopic parameters with deformation.

Table 1.
The tested vibration data of monitoring points.
| Monitoring Points (Distance from Point B1) | Time History Spectrum | FFT Frequency Spectrum | One-Third Octave Spectrum | HHT Energy Spectrum | |||
|---|---|---|---|---|---|---|---|
| Peak Ground Acceleration (mg) | Dominant Frequency (Hz) | Peak Ground Acceleration (mg) | Dominant Frequency (Hz) | Maximum Vibration Level | Dominant Frequency (Hz) | Maximum Energy | |
| B1 (0) | 9.96 | 65.73 | 4.82 | 63 | 69.82 | 65.99 | 53.01 |
| B2 (10 m) | 7.62 | 67.54 | 4.63 | 63 | 69.44 | 65.72 | 39.04 |
| B3 (20 m) | 2.97 | 65.65 | 1.68 | 63 | 65.78 | 65.89 | 3.81 |
| B4 (30 m) | 1.69 | 65.79 | 1.30 | 63 | 63.78 | 65.63 | 2.09 |
| B5 (40 m) | 0.93 | 65.61 | 0.47 | 63 | 62.05 | 65.71 | 1.08 |
Table 2.
Physical and mechanical parameters employed in the model.
| Parameters | Value |
|---|---|
| Particle diameter ratio | 3:1 |
| Particle density (kg/m3) | 2650 |
| Initial porosity | 0.16 |
| Normal stiffness of particles (N/m) | 1.5 × 10⁸ |
| Tangential stiffness of particles (N/m) | 1.0 × 10⁸ |
| Friction coefficient between particles | 0.55 |
| Damping ratio | 0.5 |
| Confining pressure (kPa) | 500 |
| Normal stiffness between tunnel and wall (N/m) | 1.5 × 10⁸ |
| Tangential stiffness between tunnel and wall (N/m) | 1.0 × 10⁸ |
Table 3.
Sand deformation under different parameters employed in the model.
| Particle Diameter Ratio | Deformation (mm) | Initial Porosity | Deformation (mm) | Friction Coefficient between Particles | Deformation (mm) |
|---|---|---|---|---|---|
| 5:1 | 2.2 | 0.16 | 1.9 | 0.45 | 2.6 |
| 4:1 | 2.1 | 0.18 | 2.6 | 0.50 | 2.3 |
| 3:1 | 1.9 | 0.20 | 3.3 | 0.55 | 1.9 |
| 2:1 | 1.7 | 0.22 | 3.8 | 0.60 | 1.4 |
| 1:1 | 1.4 | 0.24 | 4.5 | 0.65 | 1.1 |
Table 4.
The value of microscopic indexes during the soil deformation.
| Particle Coordination Number | Deformation (mm) | Normal Contact Force (kN) | Deformation (mm) | Tangential Contact Force (kN) | Deformation (mm) | Rotation Angle (°) | Deformation (mm) | Local Porosity | Deformation (mm) |
|---|---|---|---|---|---|---|---|---|---|
| 4.53 | 0 | 73.29 | 0 | 3.61 | 0 | 0 | 0 | 0.160 | 0 |
| 4.58 | 0.5 | 76.91 | 0.5 | 4.28 | 0.5 | 1.8 | 0.5 | 0.157 | 0.5 |
| 4.60 | 1.0 | 86.79 | 1.0 | 3.90 | 1.0 | 1.5 | 1.0 | 0.147 | 1.0 |
| 4.57 | 1.5 | 84.81 | 1.5 | 3.88 | 1.5 | 1.9 | 1.5 | 0.141 | 1.5 |
| 4.66 | 2.0 | 79.69 | 2.0 | 4.33 | 2.0 | 1.1 | 2.0 | 0.133 | 2.0 |
Disclaimer/Publisher’s Note: The statements, opinions and data contained in all publications are solely those of the individual author(s) and contributor(s) and not of MDPI and/or the editor(s). MDPI and/or the editor(s) disclaim responsibility for any injury to people or property resulting from any ideas, methods, instructions or products referred to in the content. |
© 2024 by the authors. Licensee MDPI, Basel, Switzerland. This article is an open access article distributed under the terms and conditions of the Creative Commons Attribution (CC BY) license (https://creativecommons.org/licenses/by/4.0/).
Share and Cite
MDPI and ACS Style
Sun, J.; He, D.; Sun, K.; Gong, L. Deformation Mechanism of Underlying Sandy Soil Induced by Subway Traffic Vibrations. Sustainability 2024, 16, 3493. https://doi.org/10.3390/su16083493
AMA Style
Sun J, He D, Sun K, Gong L. Deformation Mechanism of Underlying Sandy Soil Induced by Subway Traffic Vibrations. Sustainability. 2024; 16(8):3493. https://doi.org/10.3390/su16083493
Chicago/Turabian StyleSun, Jinbo, Dingding He, Ke Sun, and Liang Gong. 2024. "Deformation Mechanism of Underlying Sandy Soil Induced by Subway Traffic Vibrations" Sustainability 16, no. 8: 3493. https://doi.org/10.3390/su16083493
Note that from the first issue of 2016, this journal uses article numbers instead of page numbers. See further details here.