
Carbonation of Recycled Concrete Aggregates for New Concrete and Concrete Fines to Make Cement-Free Hollow Blocks
 ,
,
Abstract
:1. Introduction
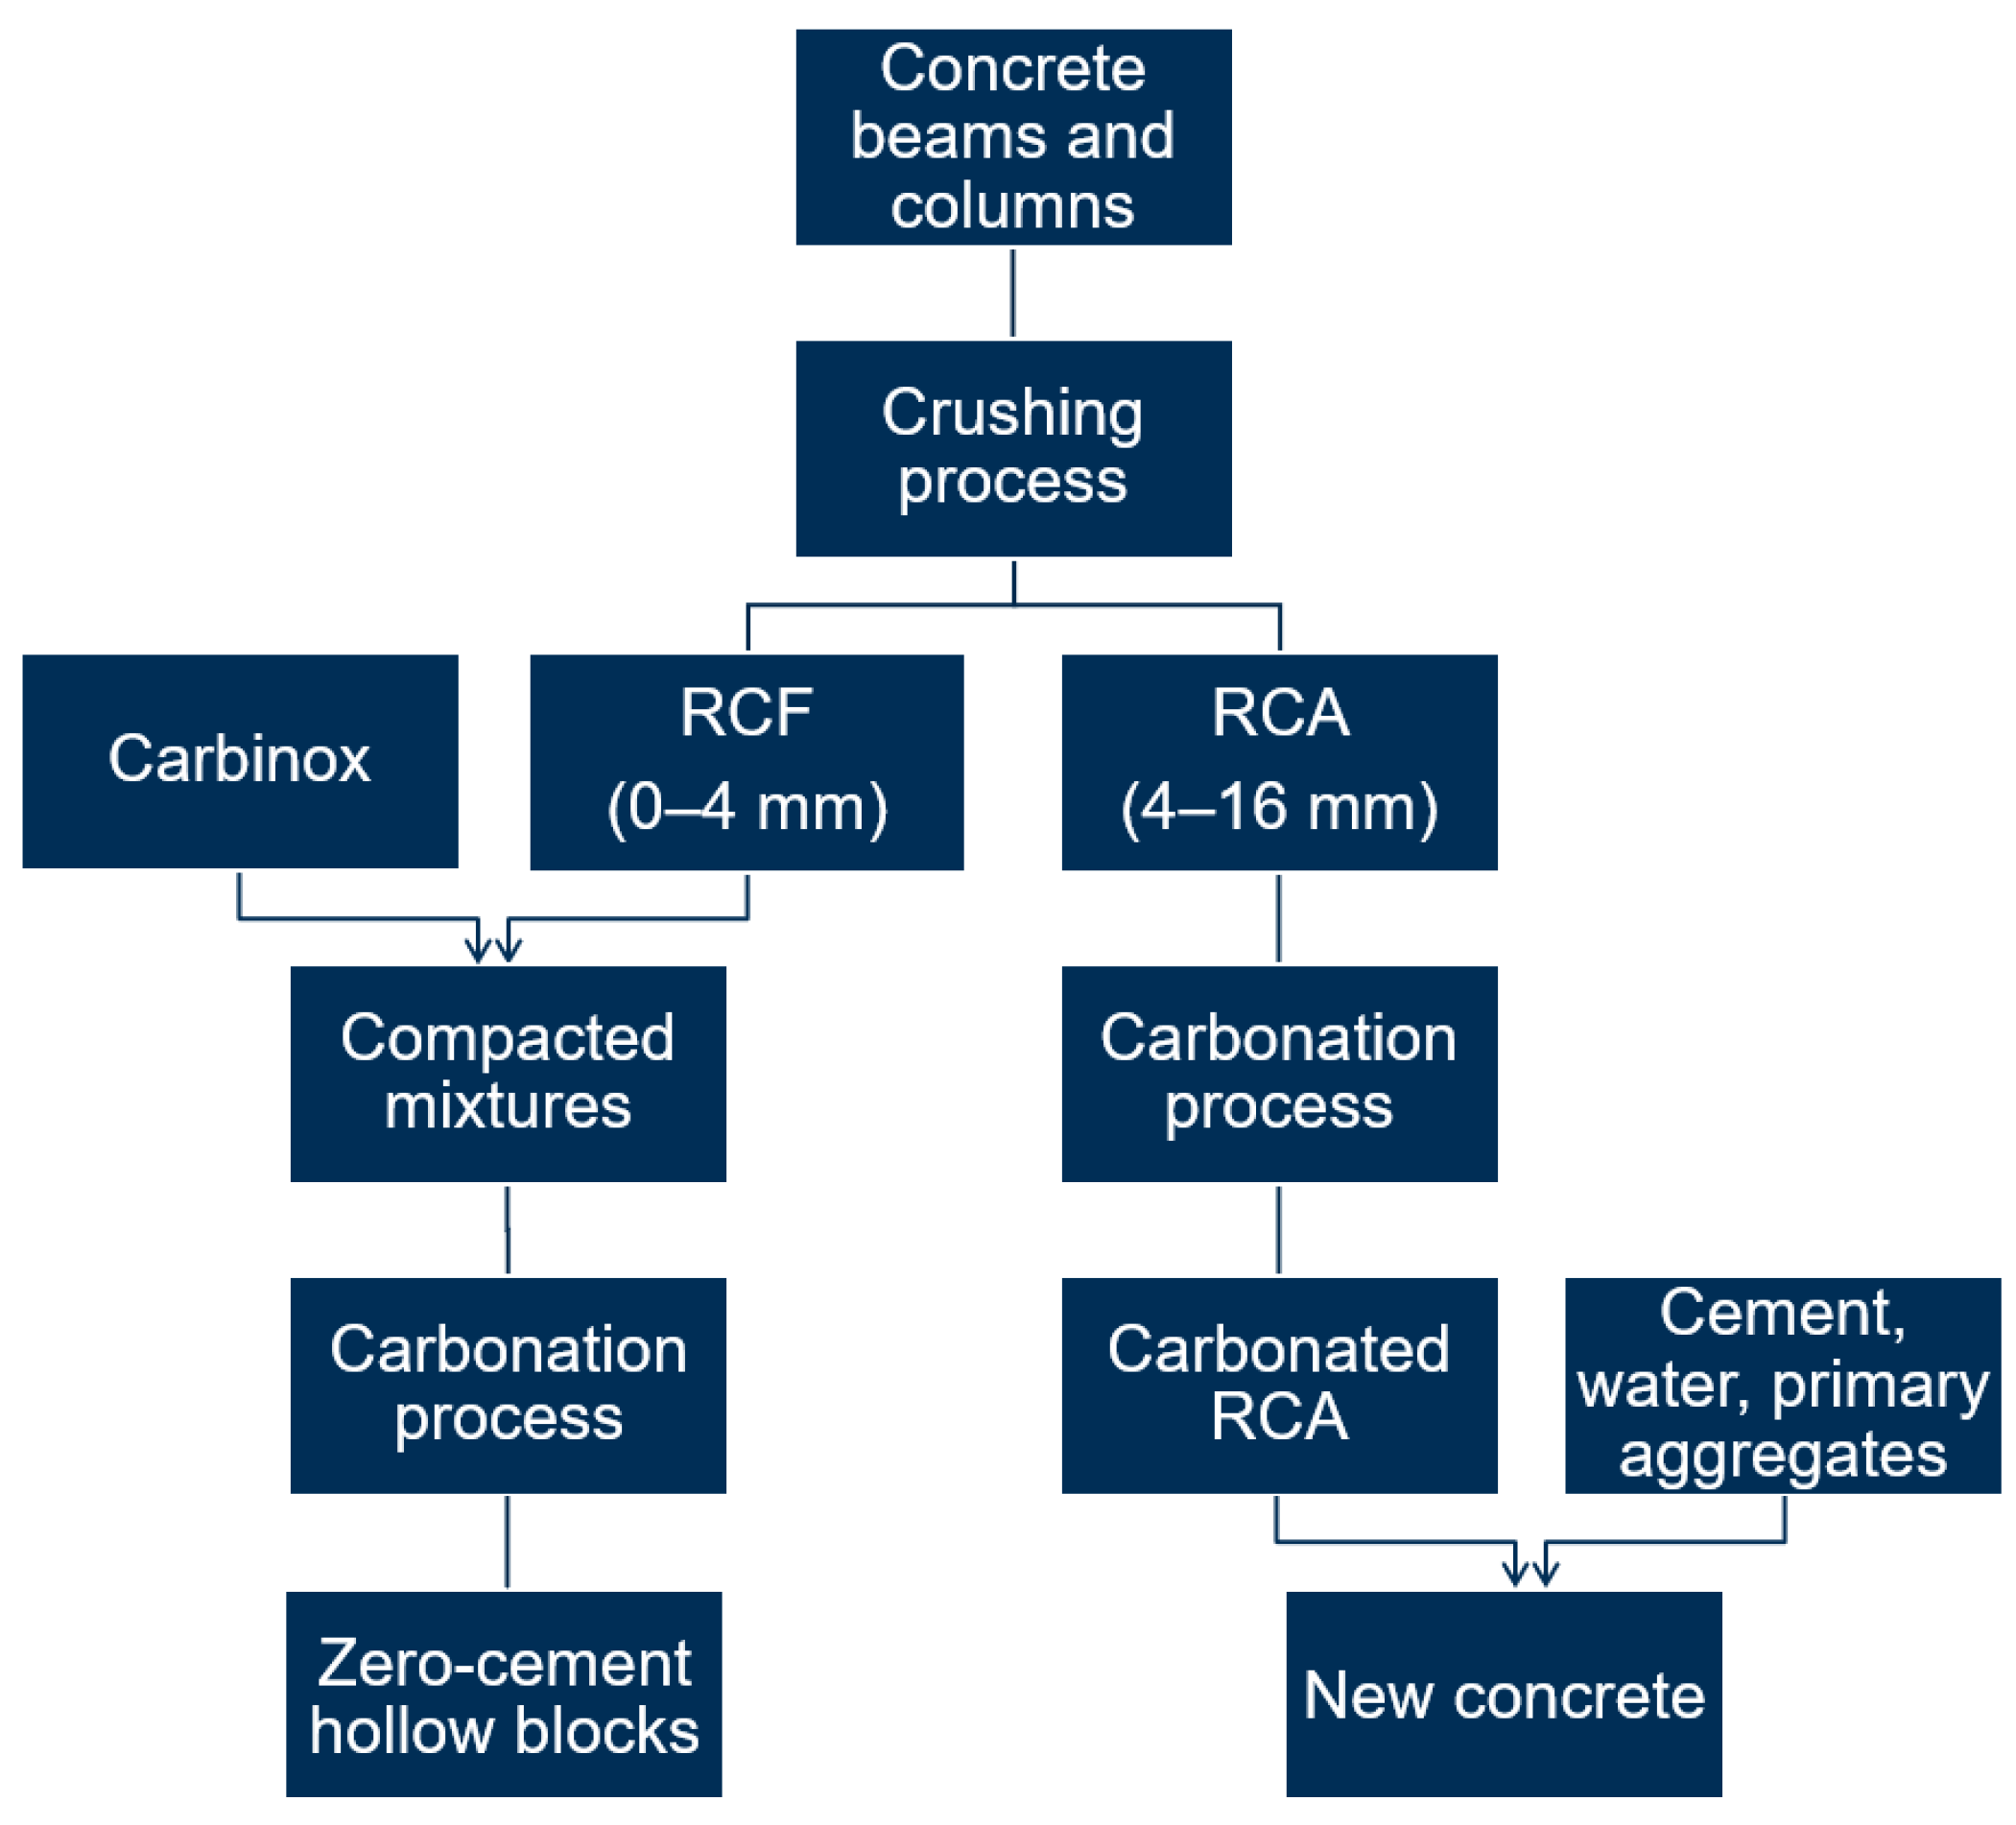
2. Materials and Methods
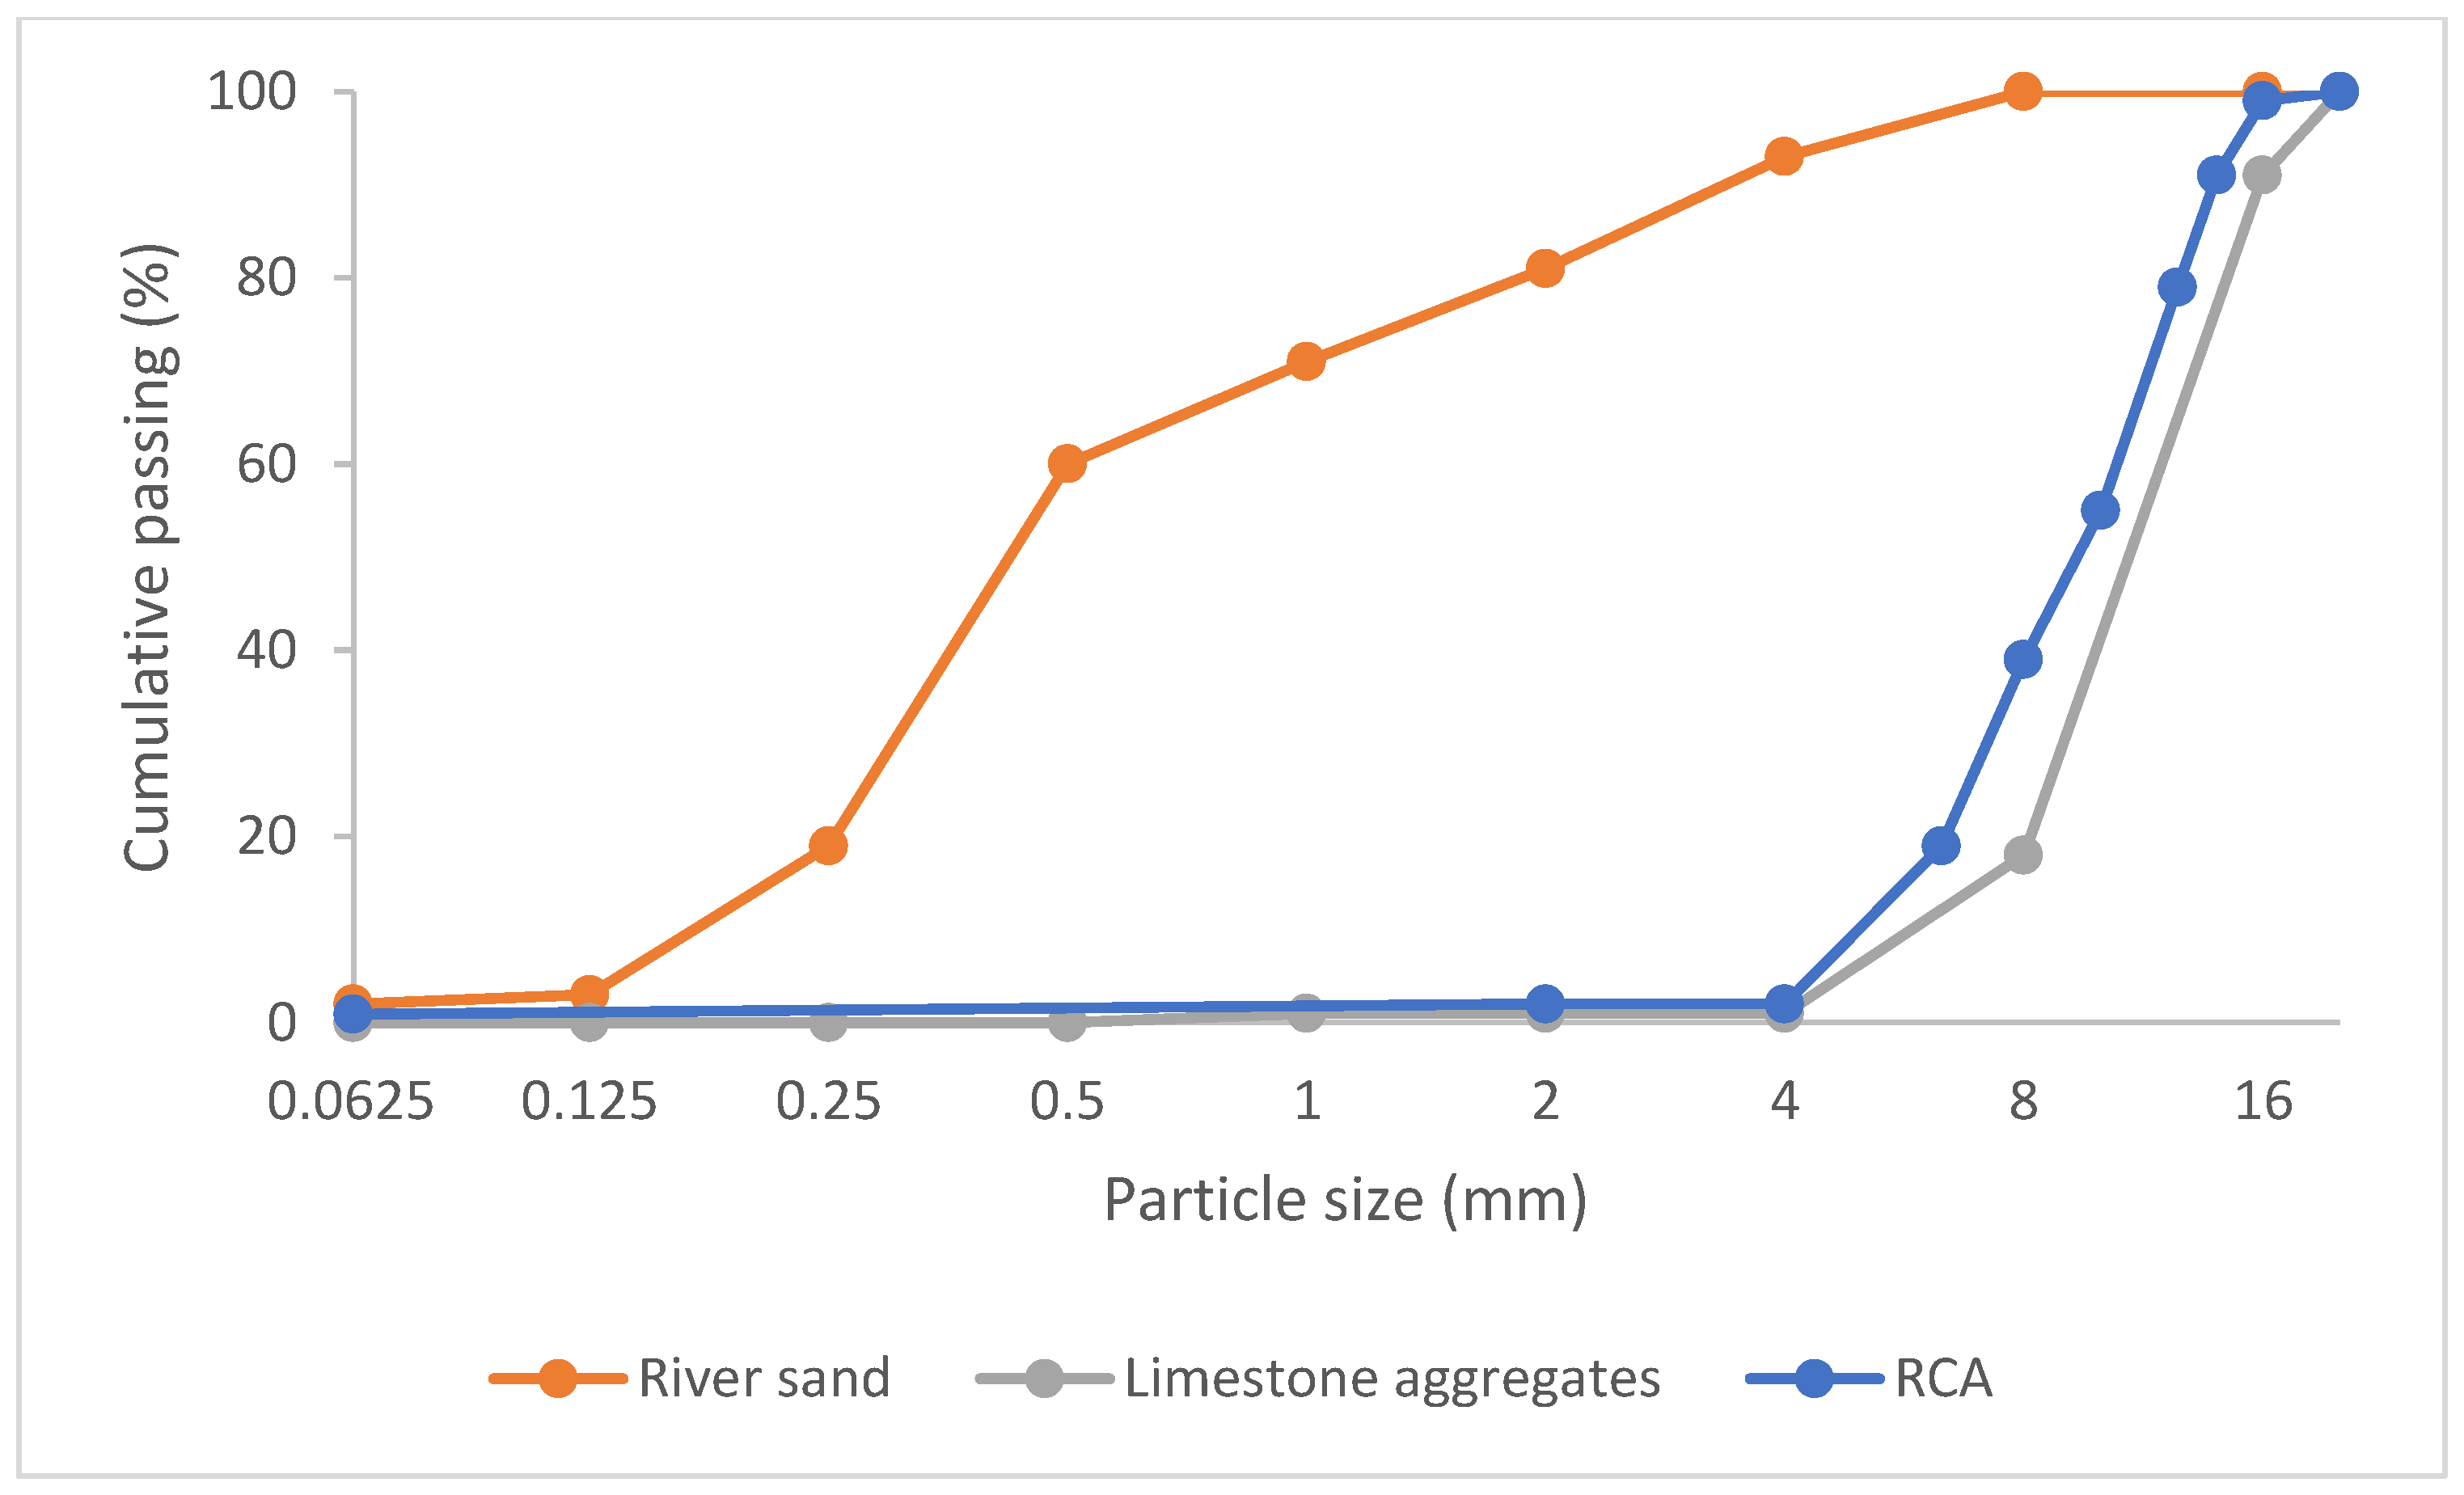
2.1. RCA
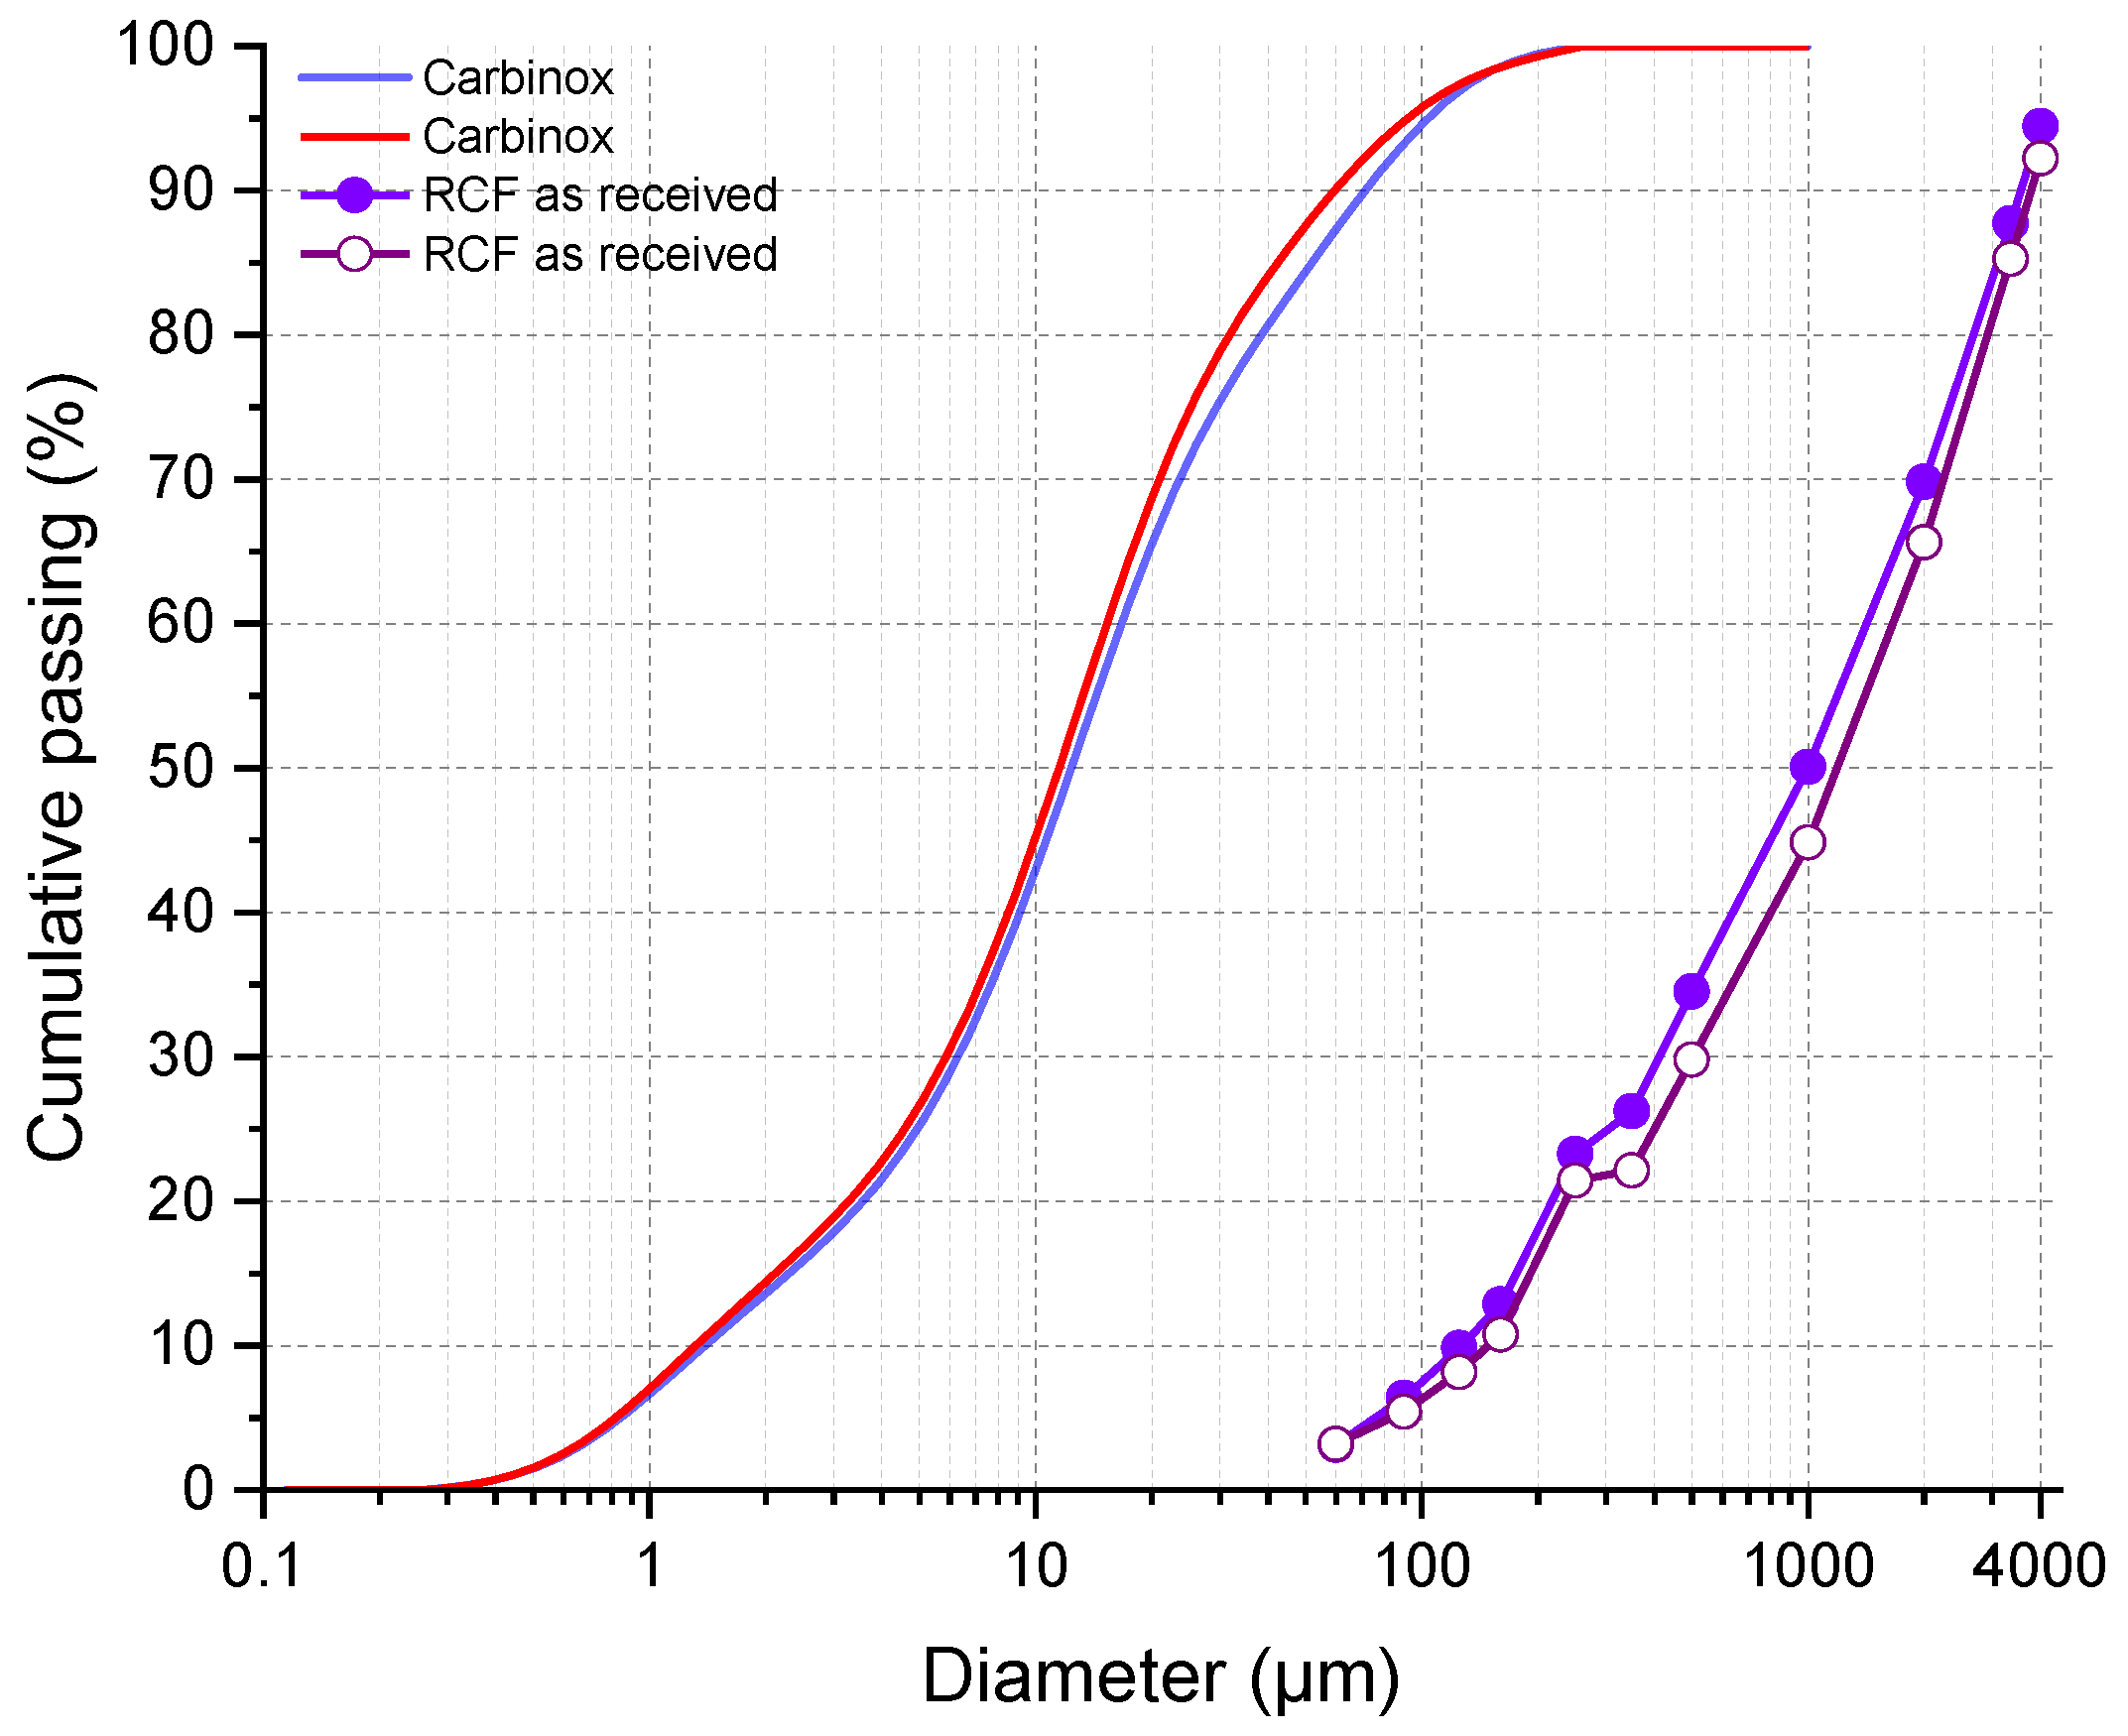
2.2. RCF
- (1)
- In the first phase, a Knauer laboratory-scale block-making machine with a vibrating table (vibropress) was used to make prisms of 40 × 40 × 160 mm. This stage provided a better understanding of the vibropress settings that can influence the compaction. Different mixtures of RCF and Carbinox were made;
- (2)
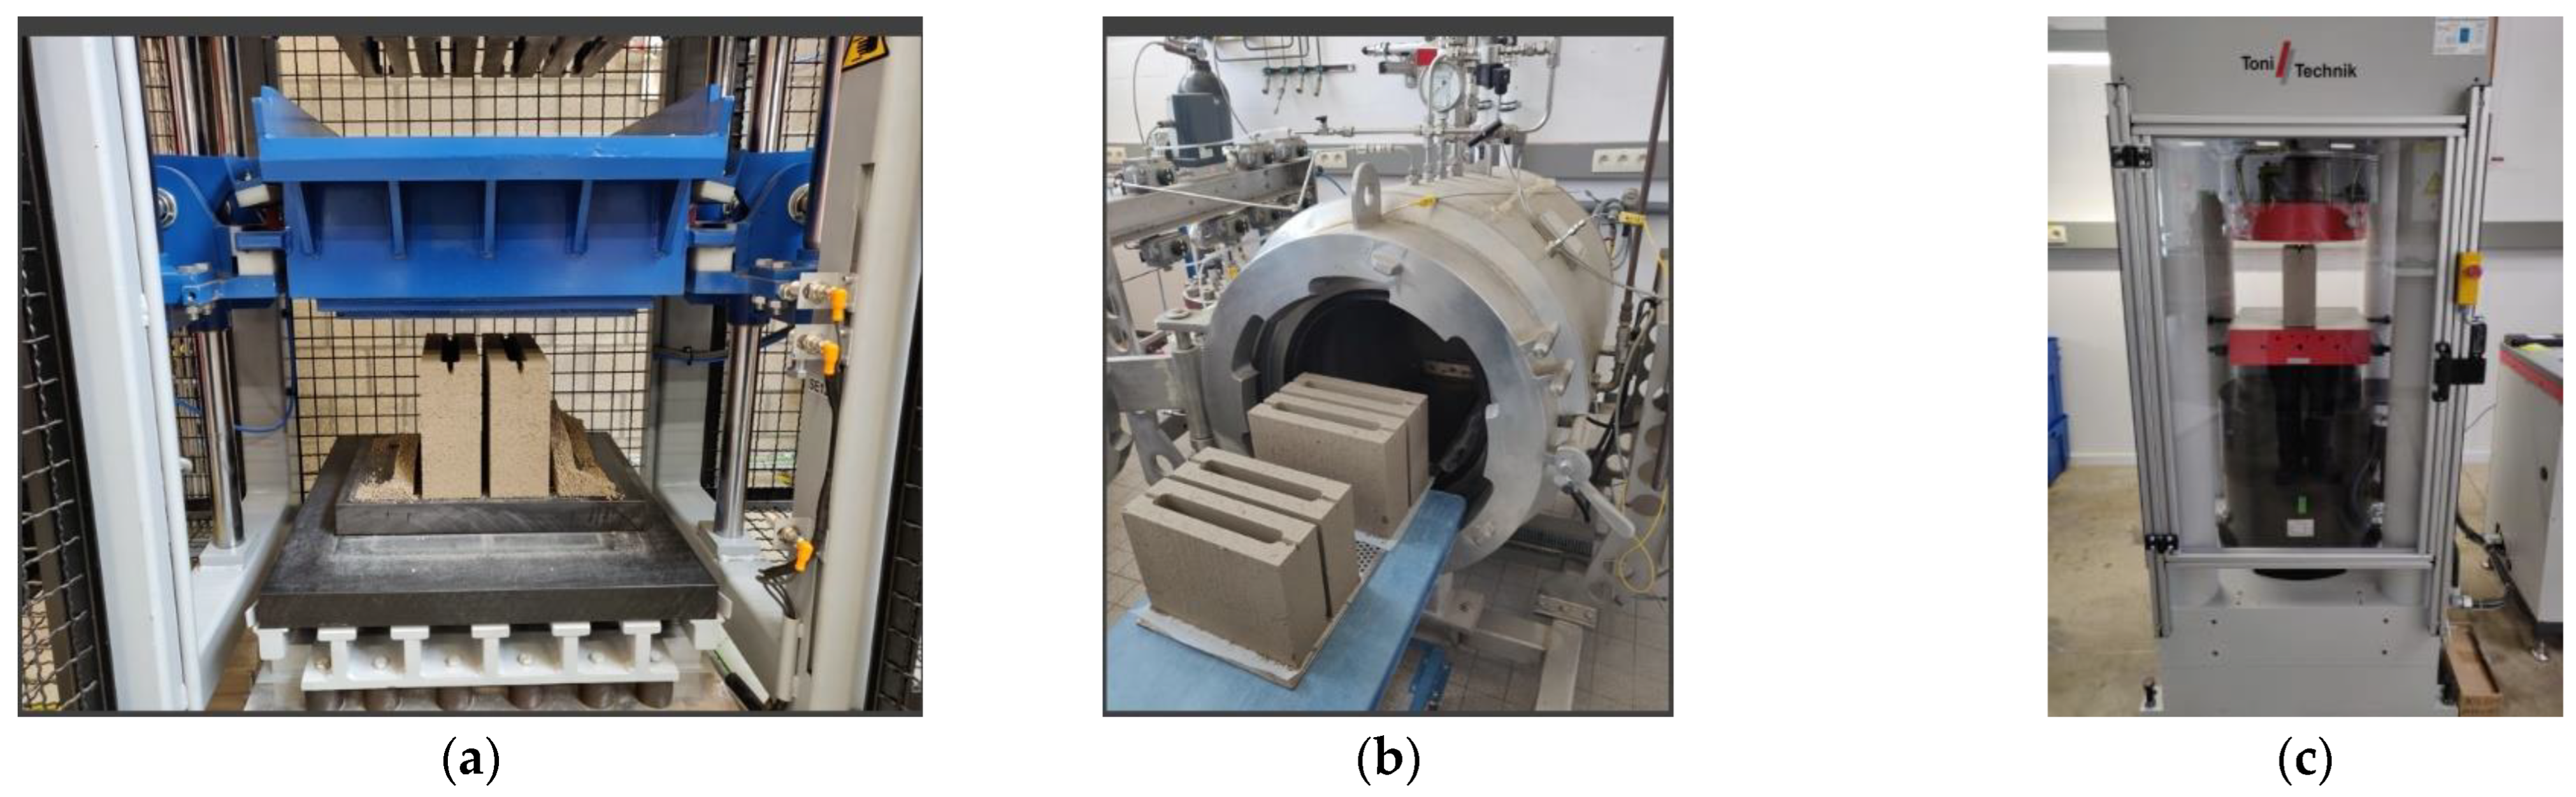
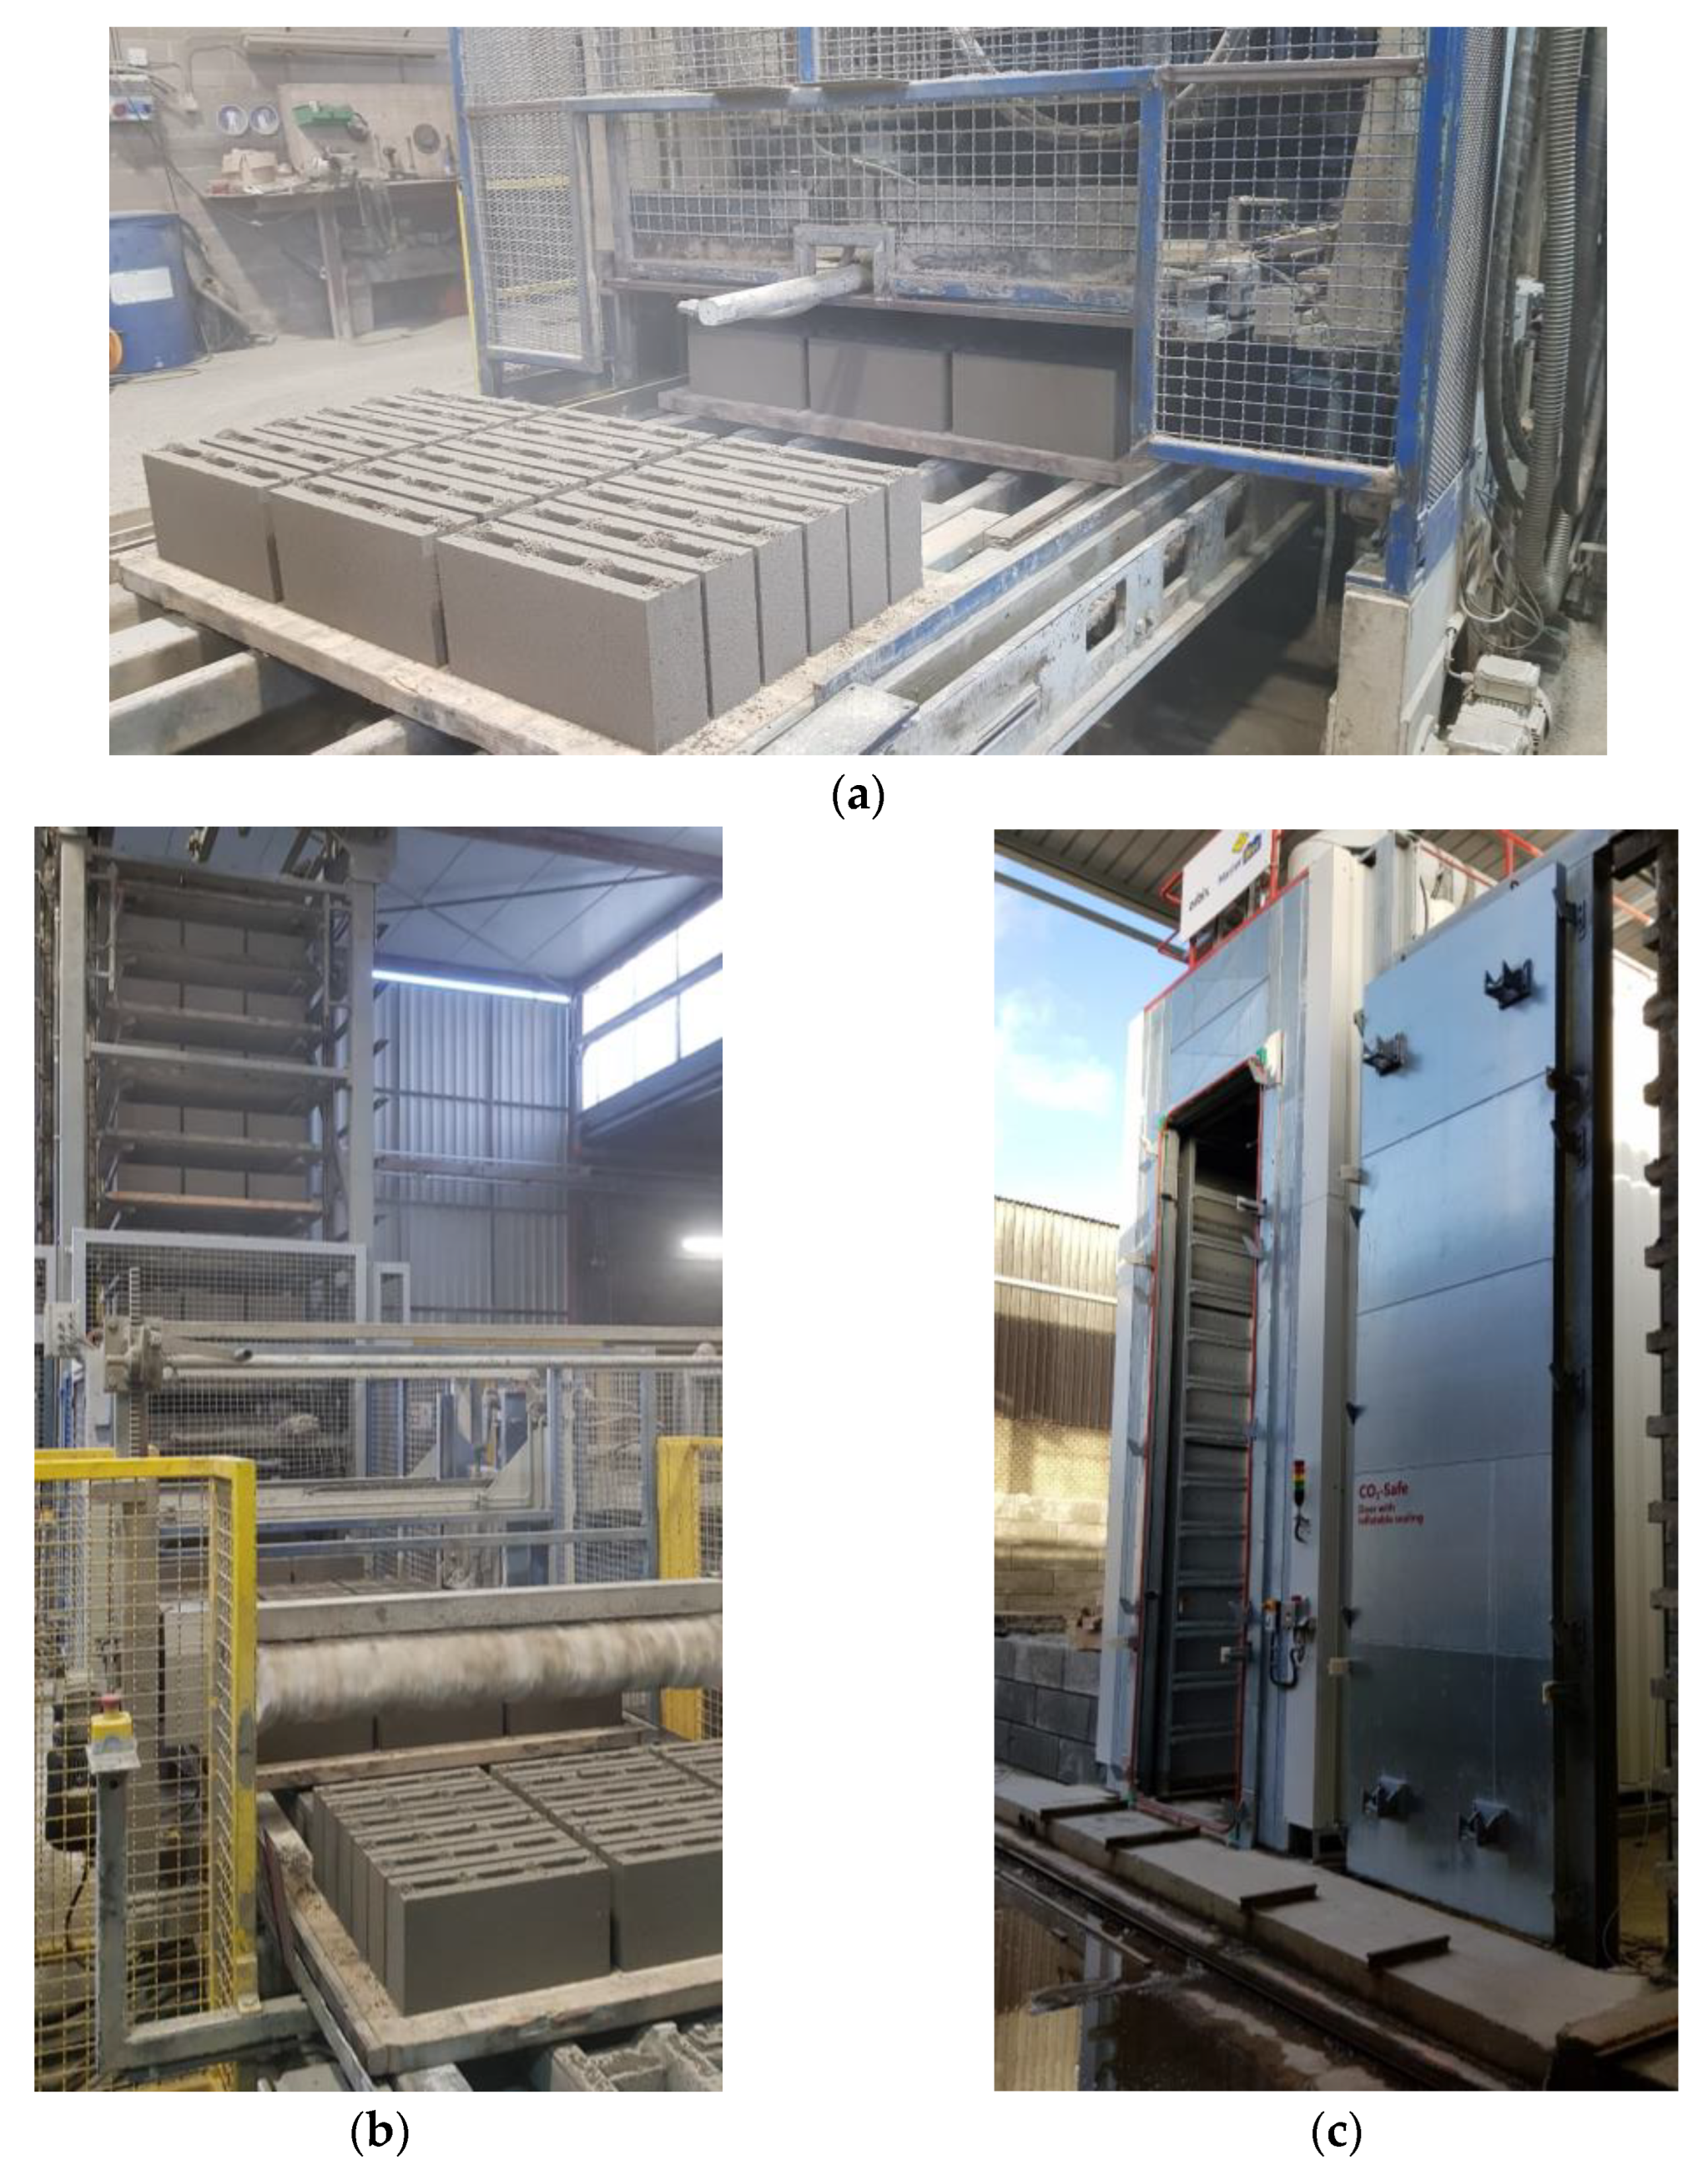
- In the second stage, the Knauer laboratory-scale block-making machine was used to make hollow blocks (≈length 290 mm, height 212 mm, width 90 mm) (Figure 5a). A series of tests were carried out to optimize the mold-filling steps (pre-vibration, intermediate, and final compaction) of the vibropress to ensure the proper height of the blocks, and green strength is achieved. The mixtures coming from the screening test were fine-tuned (Table 3), and the samples were compacted and carbonated as described in the first stage (Figure 5b,c). A 4 MN Tonitechnik servo-hydraulic testing machine was used for compressive strength testing (Figure 5c). The loading rate was set at 0.96 kN/s [40];
- (3)
- In the third stage, the upscaling was carried out at Masterbloc (Gubbels Beton, Belgium) with modified dimensions of the hollow block (≈length 387 mm, height 191 mm, width 87 mm). The mixture with 75% RCF and 25% Carbinox was selected for the upscaling to ensure the minimum strength of 4 MPa would be reached in the pilot-scale production of the two-ton demonstration material (Figure 6). Unlike stages 1 and 2, where the compaction was carried out in three different steps, the mixture was compacted in one step using an industrial vibropress at 50 Hz for 3 s. The carbonation chamber at Masterbloc was used at atmospheric pressure, with commercial CO2, with a purity of 70%. Note that the temperature and relative humidity were not actively controlled. The carbonation duration was set to 48 h. Various characterization tests, including compressive strength, capillary water absorption coefficient, and dry density were carried out [40,41,42].
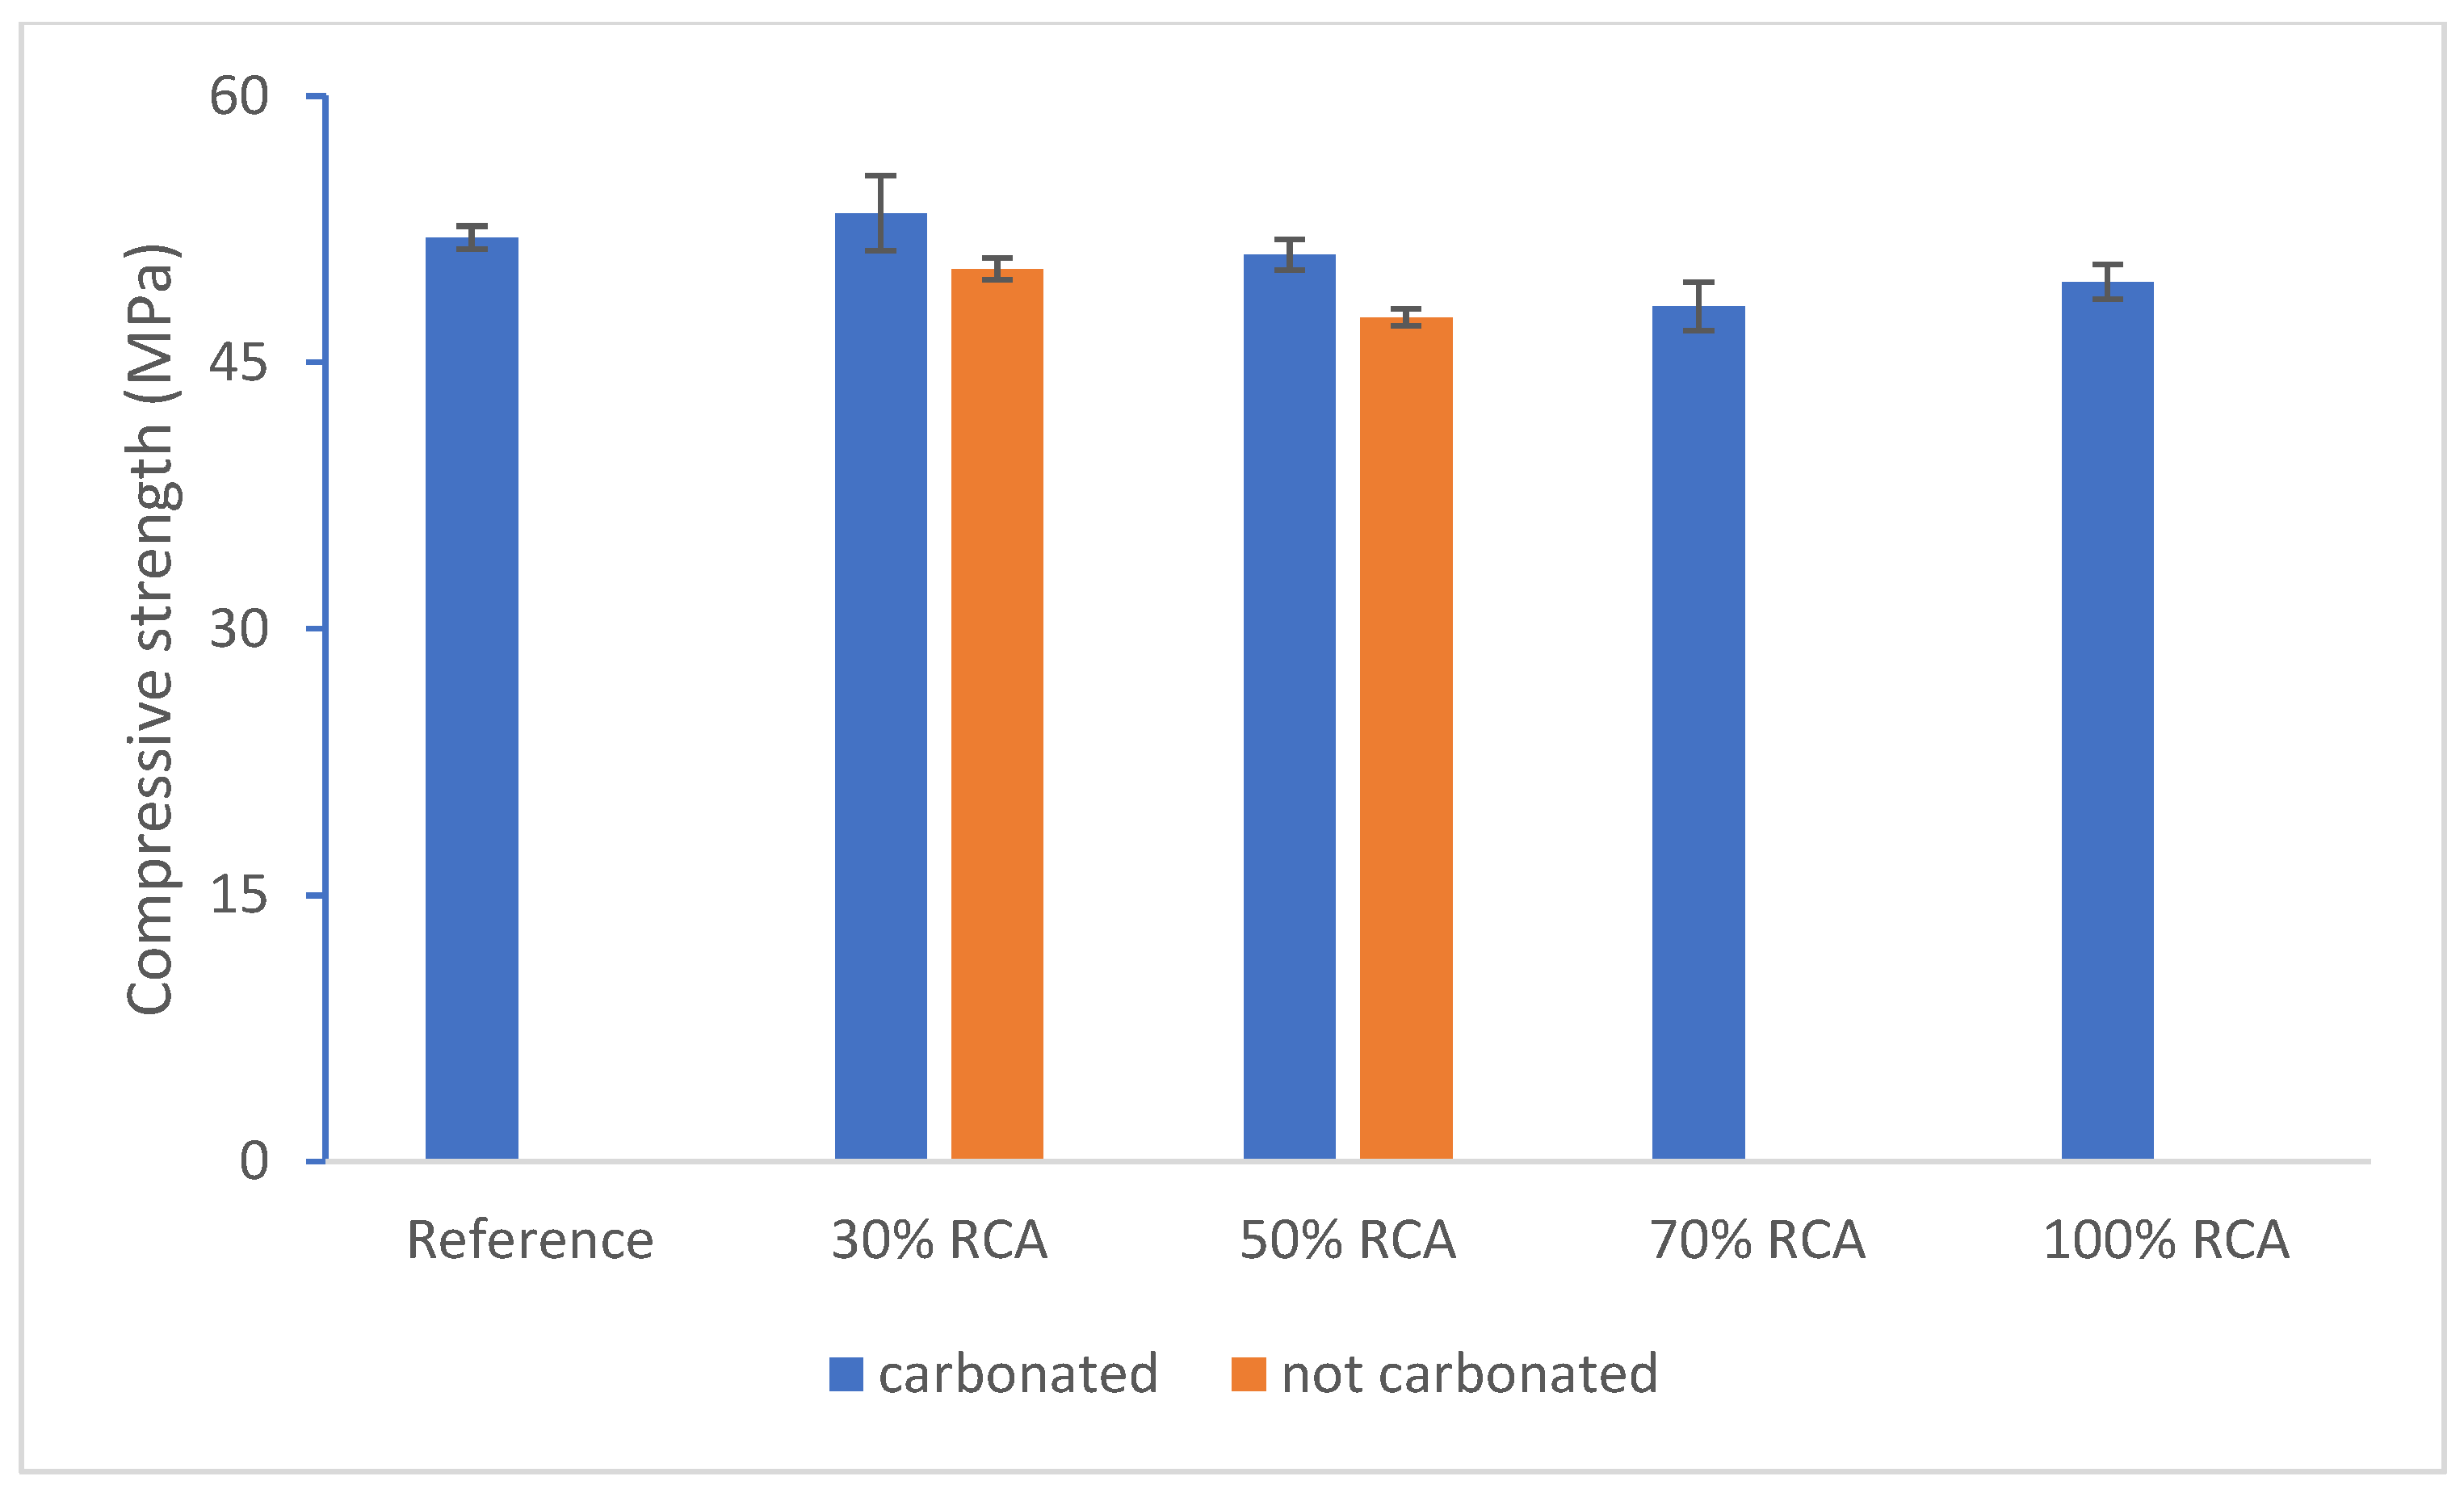
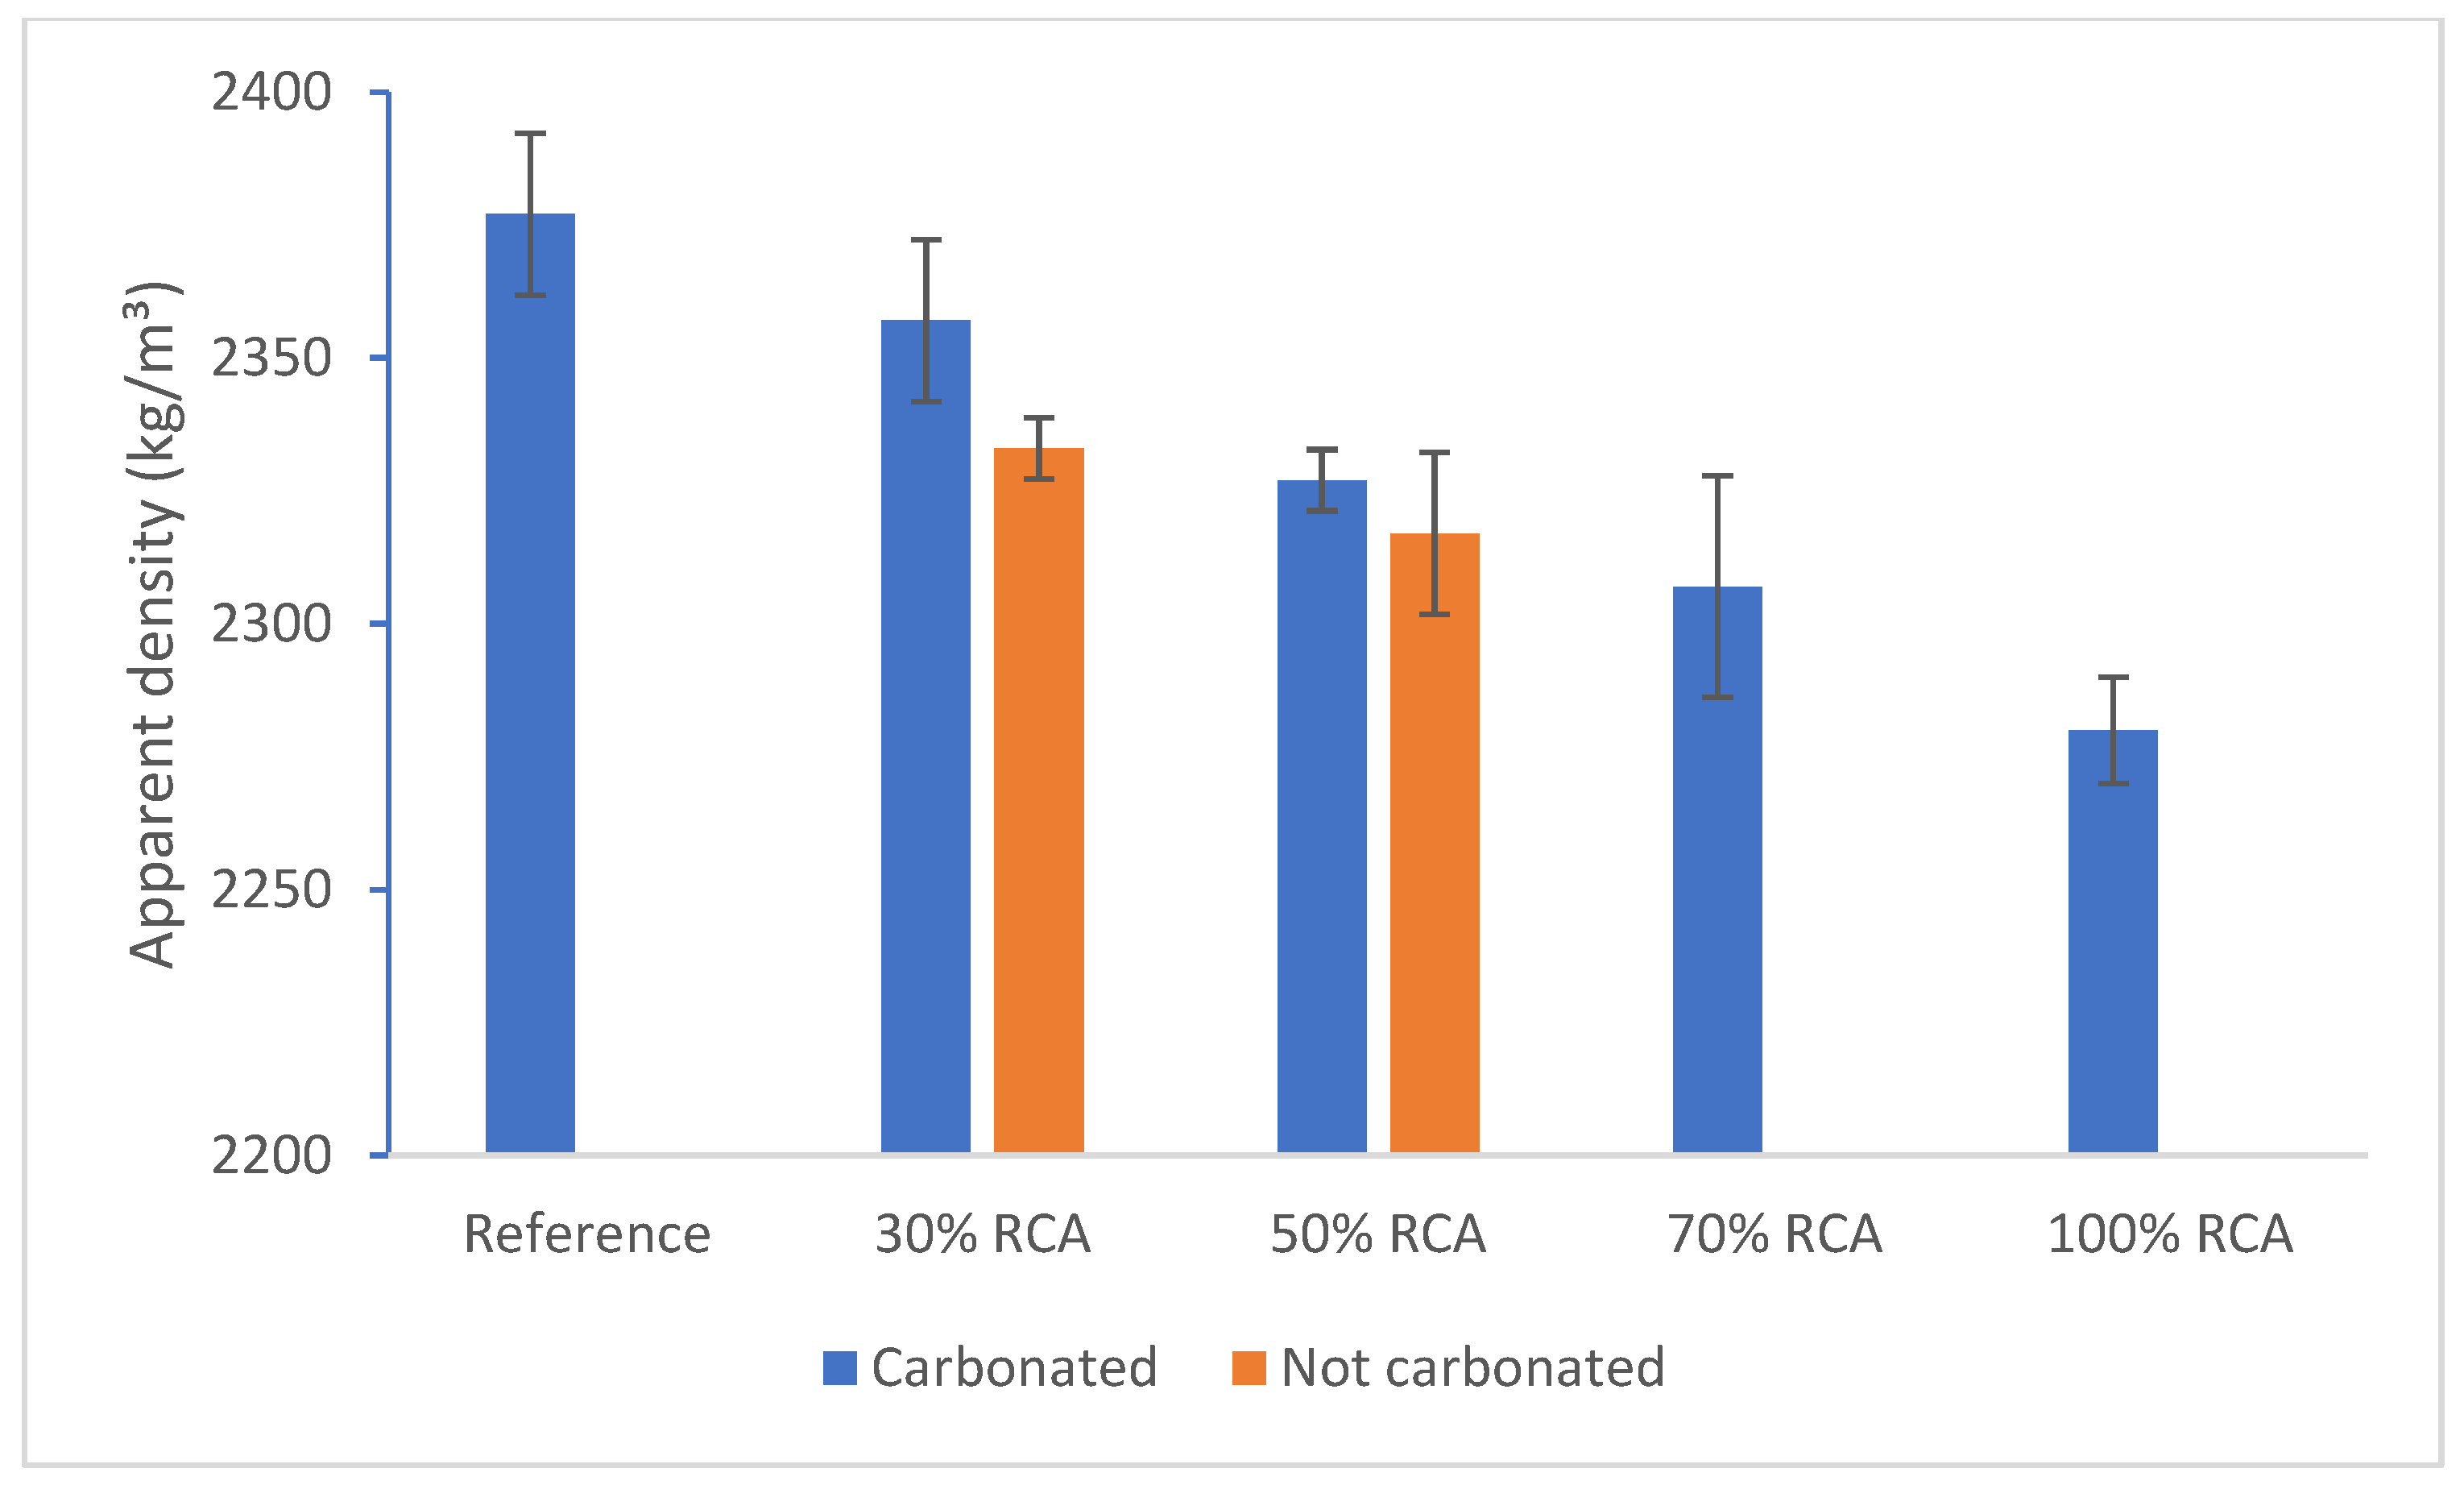
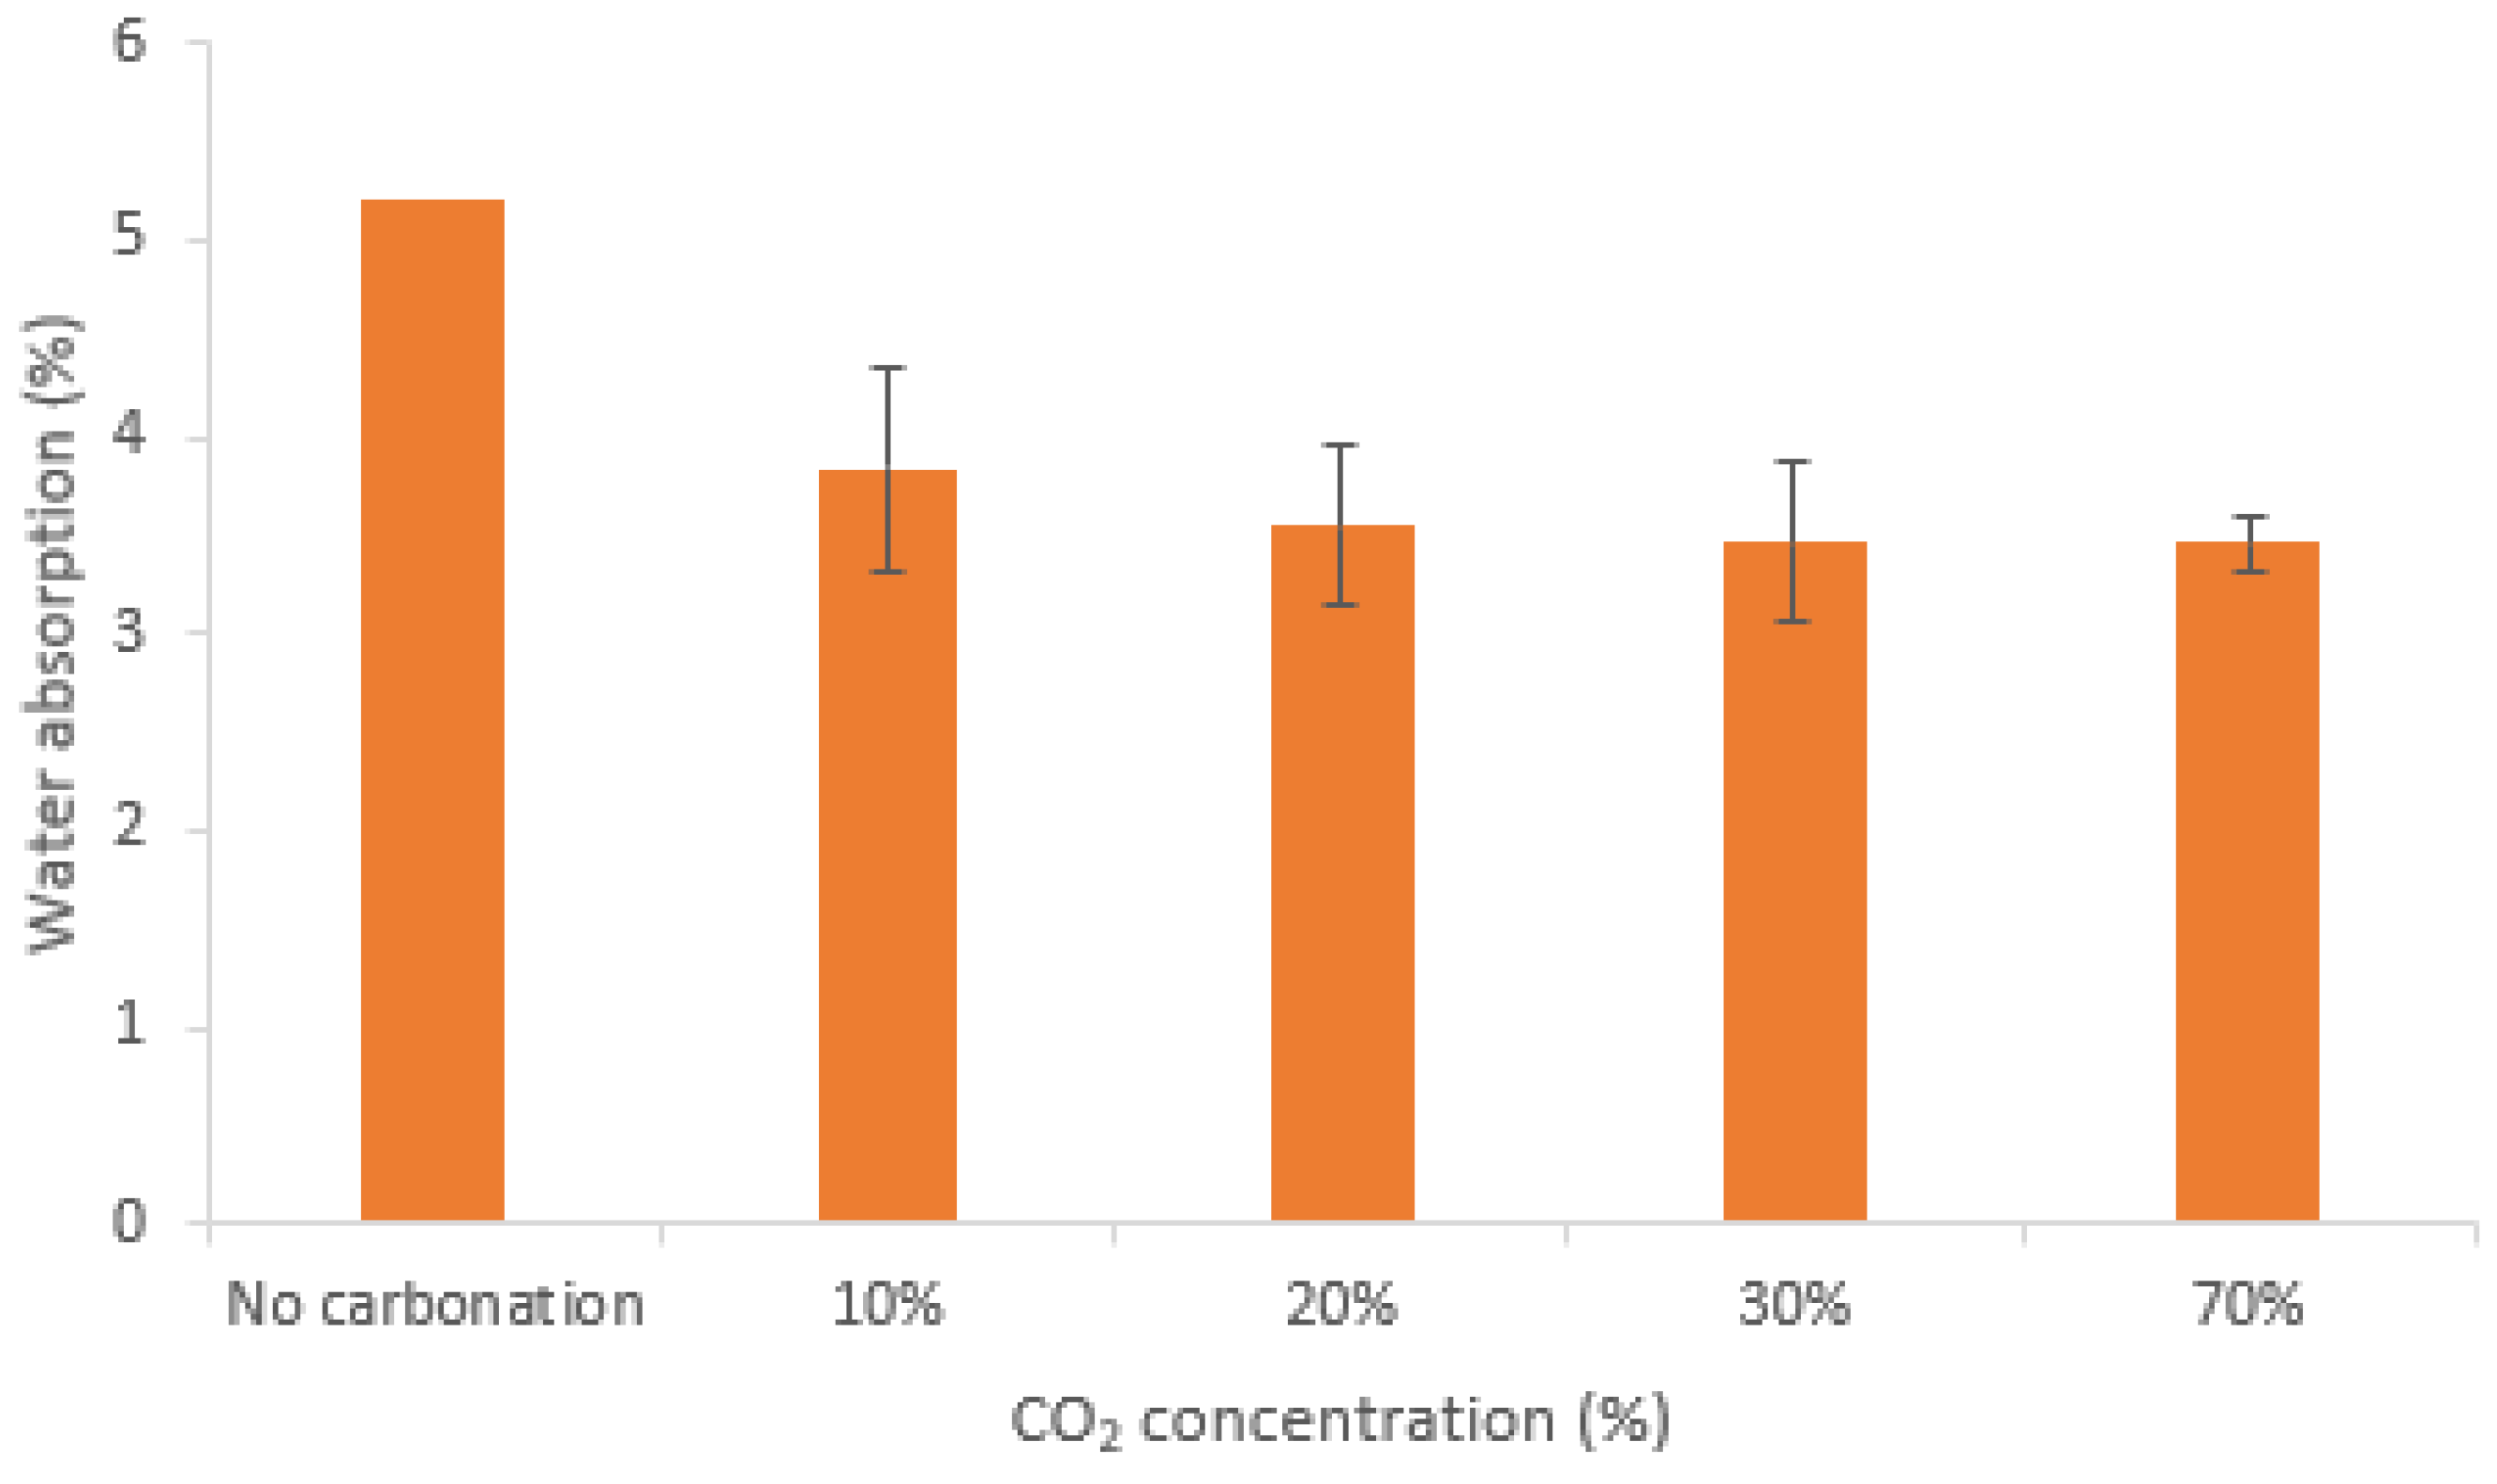
3. Results and Discussions
3.1. RCA Results
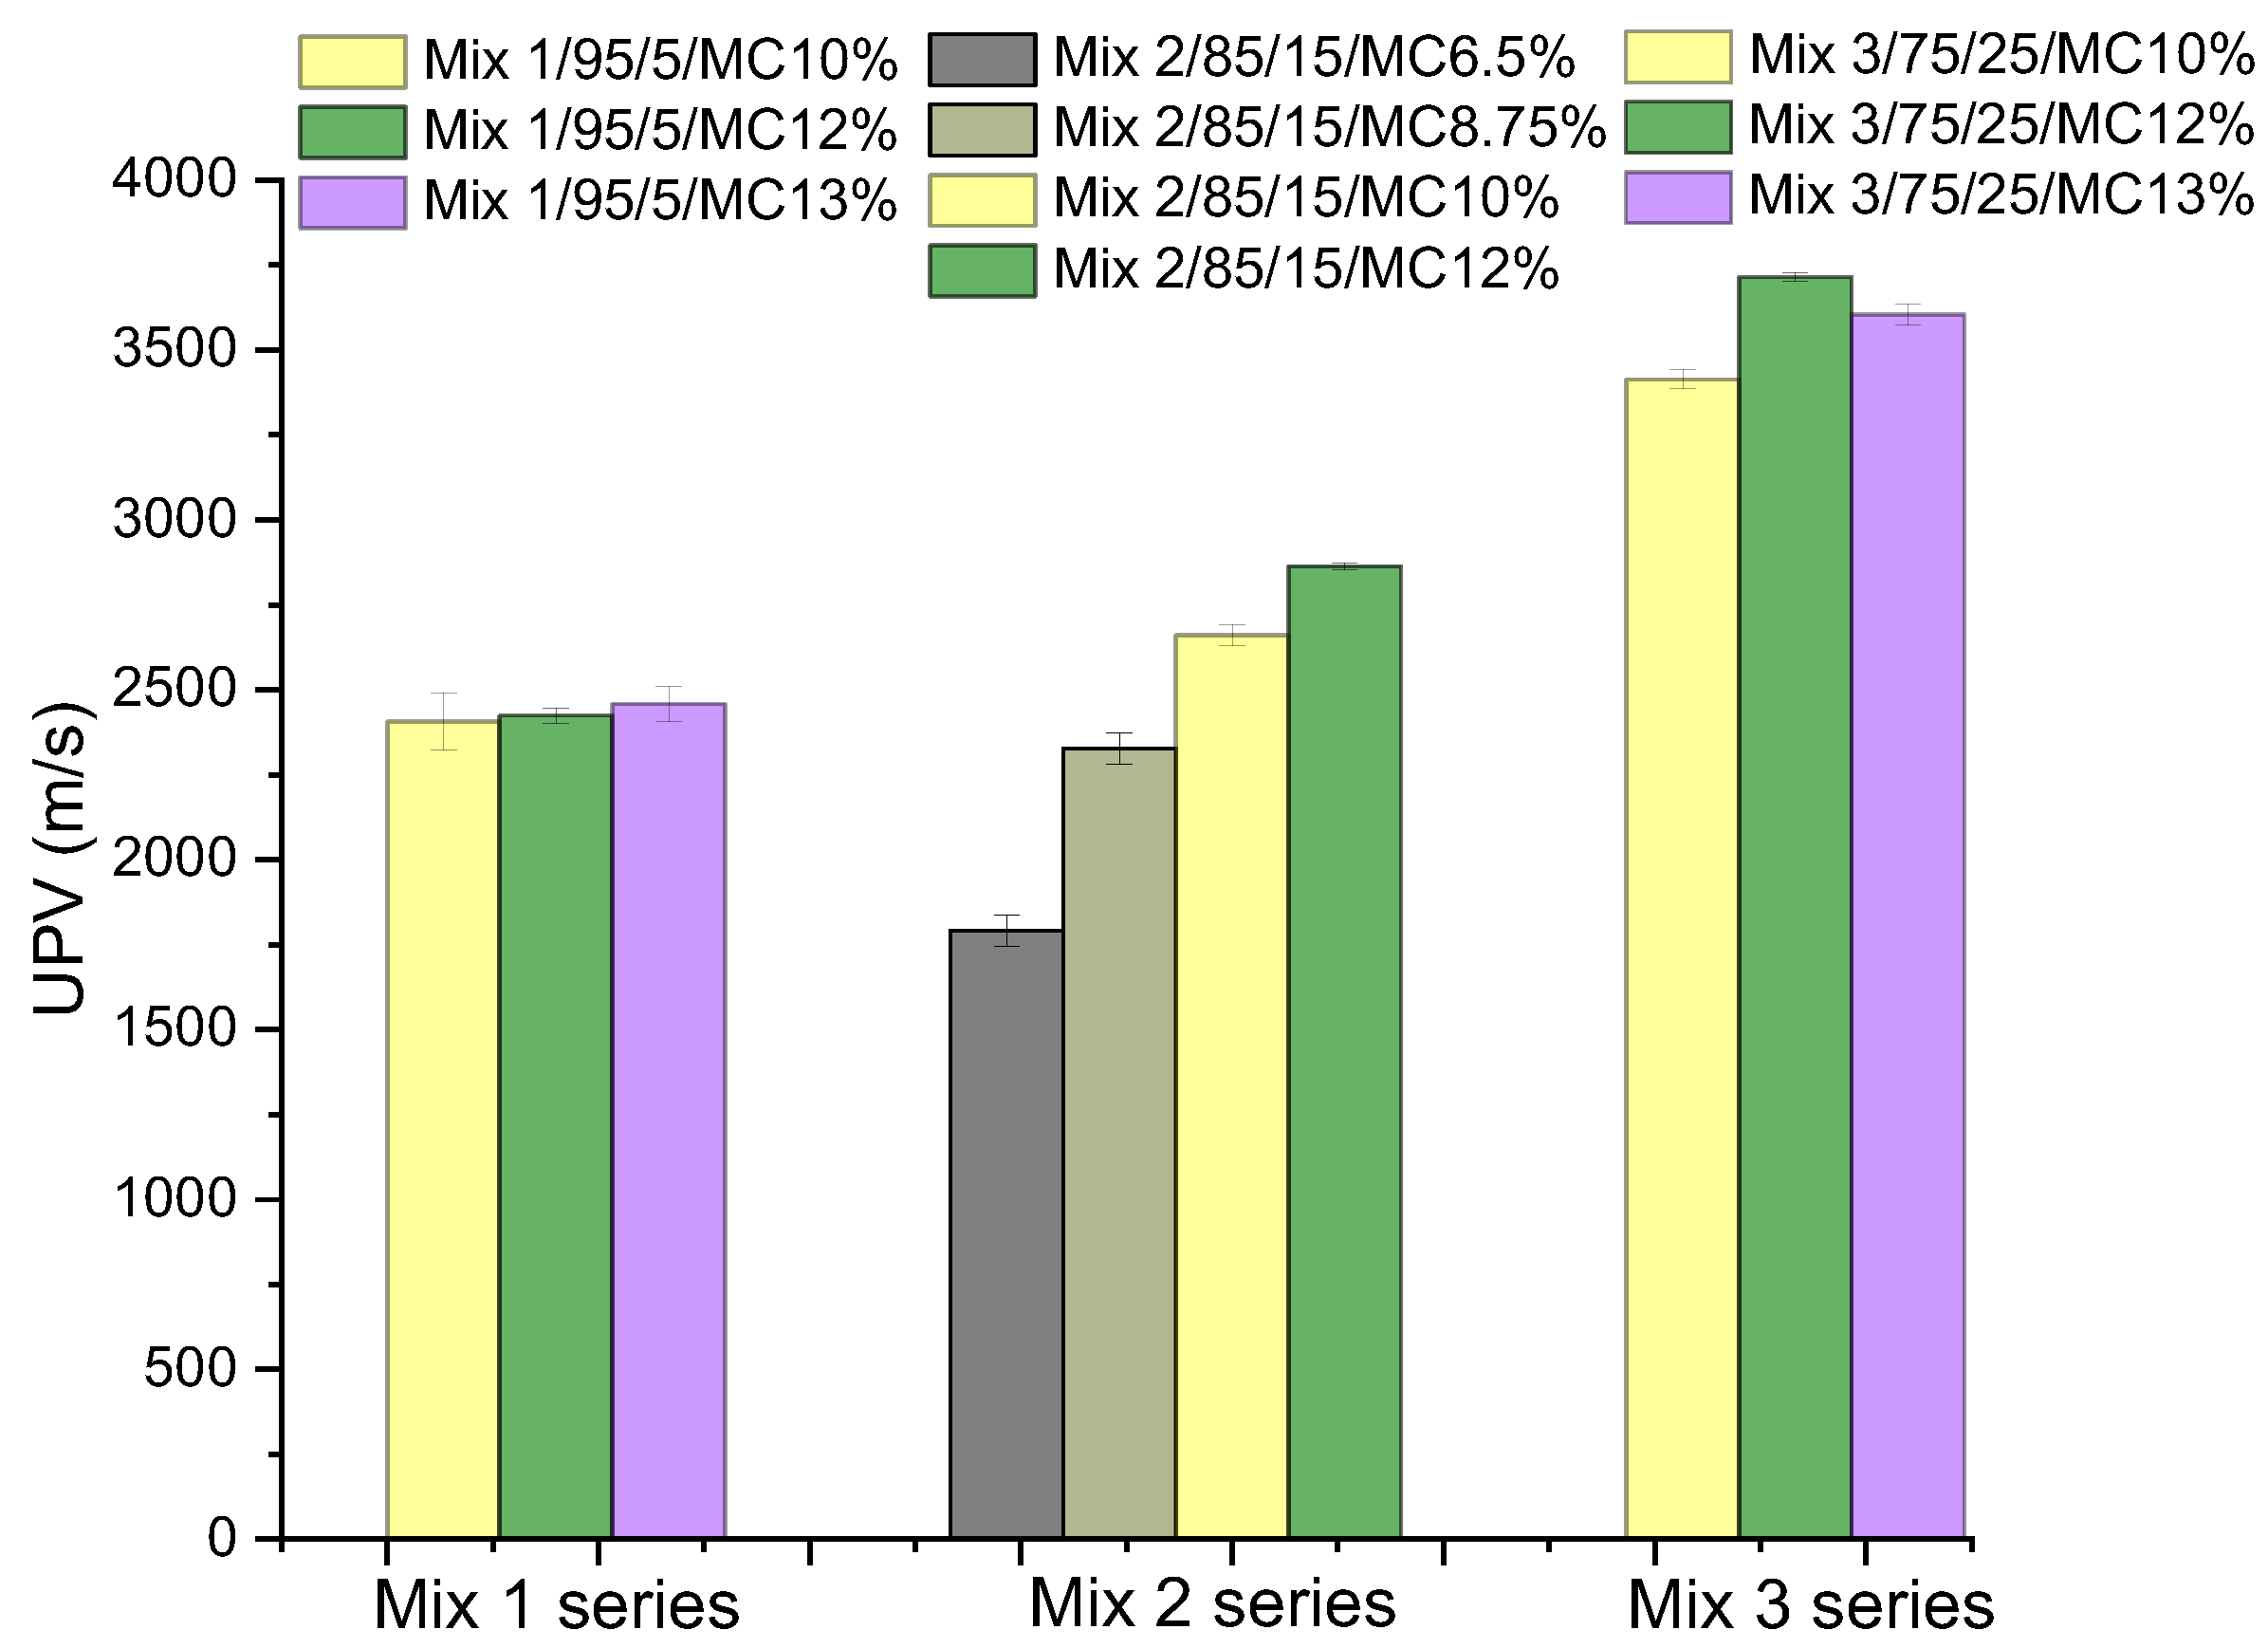
3.2. RCF Results
4. Conclusions
4.1. RCA Conclusion
4.2. RCF Conclusion
Author Contributions
Funding
Institutional Review Board Statement
Informed Consent Statement
Data Availability Statement
Acknowledgments
Conflicts of Interest
References
- Sáez, P.V.; Osmani, M. A diagnosis of construction and demolition waste generation and recovery practice in the European Union. J. Clean. Prod. 2019, 241, 118400. [Google Scholar] [CrossRef]
- Damgaard, A.; Lodato, C.; Butera, S.; Fruergaard Astrup, T.; Kamps, M.; Corbin, L.; Tonini, D.; Fruergaard Astrup, T. Background Data Collection and Life Cycle Assessment for Construction and Demolition Waste (CDW) Management; EUR 31323 EN; Publications Office of the European Union: Luxembourg, 2022; ISBN 978-92-76-59147-4. [Google Scholar] [CrossRef]
- Monitoringsysteem Duurzaam Oppervlaktedelfstoffenbeleid (MDO, 2018). VITO, OVAM, Departement Omgeving. Available online: https://omgevingvlaanderen.paddlecms.net/nl/monitoringsysteem-duurzaam-oppervlaktedelfstoffenbeleid-mdo (accessed on 5 March 2024).
- Hansen, T.C.; Henrik, N. Strength of recycled concrete made from crushed concrete coarse aggregate. Concr. Int. 1983, 5, 79–83. [Google Scholar]
- Parthiban, K.; Saravana Raja Mohan, K. Influence of recycled concrete aggregates on the engineering and durability properties of alkali activated slag concrete. Constr. Build. Mater. 2017, 133, 65–72. [Google Scholar] [CrossRef]
- Parviz, S. Strength and durability of RAC containing milled glass as partial replacement for cement. Constr. Build. Mater. 2012, 29, 368–377. [Google Scholar]
- Lotfi, S.; Deja, J.; Rem, P.; Mróz, R.; van Roekel, E.; van der Stelt, H. Mechanical recycling of EOL concrete into high-grade aggregates. Resour. Conserv. Recycl. 2014, 87, 117–125. [Google Scholar] [CrossRef]
- Di Maria, A.; Eyckmans, J.; Van Acker, K. Downcycling versus recycling of construction and demolition waste: Combining LCA and LCC to support sustainable policy making. Waste Manag. 2018, 75, 3–21. [Google Scholar] [CrossRef]
- NBN EN 206:2013+A2:2021; Concrete–Specification, Performance, Production and Conformity. Bureau for Standarisation: Brussels, Belgium, 2021.
- Belin, P.; Habert, G.; Thiery, M.; Roussel, N. Cement paste content and water absorption of recycled concrete coarse aggregates. Mater. Struct. 2014, 47, 1451–1465. [Google Scholar] [CrossRef]
- EHE-08; Code on Structural Concrete. Gobierno de Espana, Ministerio de Transportes y Movilidad Sostenible: Madrid, Spain, 2011.
- NBN B B15-001:2024; Beton—Specificatie, Eingenschappen, Vervaardiging en Conformiteit—Nationale Aanvulling bij NBN 206=2013+A2:2021. Bureau for Standarisation: Brussels, Belgium, 2024.
- Fang, Y.; Chang, J. Microstructure changes of waste hydrated cement paste induced by accelerated carbonation. Constr. Build. Mater. 2015, 76, 360–365. [Google Scholar] [CrossRef]
- Pu, Y.; Li, L.; Wang, Q.; Shi, X.; Luan, C.; Zhang, G.; Fu, L.; El-Fatah Abomohra, A. Accelerated carbonation technology for enhanced treatment of recycled concrete aggregates: A state-of-the-art review. Constr. Build. Mater. 2021, 282, 122671. [Google Scholar] [CrossRef]
- Russo, N.; Lollini, F. Effect of carbonated recycled coarse aggregates on the mechanical and durability properties of concrete. J. Build. Eng. 2022, 51, 104290. [Google Scholar] [CrossRef]
- Pu, Y.; Li, L.; Wang, Q.; Shi, X.; Fu, L.; Zhang, G.; Luan, C.; El-Fatah Abomohra, A. Accelerated carbonation treatment of recycled concrete aggregates using flue gas: A comparative study towards performance improvement. J. CO2 Util. 2021, 43, 101362. [Google Scholar] [CrossRef]
- Gholizadeh-Vayghan, A.; Bellinckx, A.; Snellings, R.; Vandoren, B.; Quaghebeur, M. The effects of carbonation conditions on the physical and microstructural properties of recycled concrete aggregates. Constr. Build. Mater. 2020, 257, 119486. [Google Scholar] [CrossRef]
- Izoret, L.; Pernin, T.; Potier, J.M.; Torrenti, J.M. Impact of Industrial Application of Fast Carbonation of Recycled Concrete Aggregates. Appl. Sci. 2023, 13, 849. [Google Scholar] [CrossRef]
- Li, L.; Poon, C.S.; Xiao, J.; Xian, D. Effect of carbonated recycled coarse aggregate on the dynamic compressive behavior of recycled aggregate concrete. Constr. Build. Mater. 2017, 151, 52–62. [Google Scholar] [CrossRef]
- Wang, J.; Zhang, J.; Cao, D.; Dang, H.; Ding, B. Comparison of recycled aggregate treatment methods on the performance for recycled concrete. Constr. Build. Mater. 2020, 234, 117366. [Google Scholar] [CrossRef]
- Nedeljkovic, M.; Visser, J.; Savija, B.; Valcke, S.; Schlangen, E. Use of fine recycled concrete aggregates in concrete: A critical review. J. Build. Eng. 2021, 38, 102196. [Google Scholar] [CrossRef]
- Gebramariam, A.T.; Di Maio, F.; Vahidi, A.; Rem, P. Innovative technologies for recycling End-of-Life concrete waste in the built environment. Resour. Conserv. Recycl. 2020, 163, 104911. [Google Scholar] [CrossRef]
- Raman, J.V.M.; Ramasamy, V. Various treatment techniques involved to enhance the recycled coarse aggregate in concrete: A review. Mater. Today Proc. 2021, 45, 6356–6363. [Google Scholar]
- Ho, H.-J.; Iizuka, A.; Shibata, E.; Tomita, H.; Takano, K.; Endo, T. Utilization of CO2 in direct aqueous carbonation of concrete fines generated from aggregate recycling: Influences of the solid–liquid ratio and CO2 concentration. J. Clean. Prod. 2021, 312, 127832. [Google Scholar] [CrossRef]
- Meijssen, M.; Marinello, L.; di Bella, C.; Gasós, A.; Mazzotti, M. Industrial demonstration of indirect mineral carbonation in the cement and concrete sector. J. Environ. Chem. Eng. 2023, 11, 110900. [Google Scholar] [CrossRef]
- Simoes dos Reis, G.; Grigore Cazacliu, B.; Artoni, R.; Torrenti, J.-M. Effect of the accelerated carbonation treatment on the recycled sand physicochemical characteristics through the rolling carbonation process. J. CO2 Util. 2020, 39, 101181. [Google Scholar] [CrossRef]
- Jiang, Y.; Li, L.; Lu, J.X.; Shen, P.; Ling, T.C.; Poon, C.S. Mechanism of carbonating recycled concrete fines in aqueous environment: The particle size effect. Cem. Concr. Compos. 2022, 133, 104655. [Google Scholar] [CrossRef]
- Poon, C.S.; Shen, P.; Jiang, Y.; Ma, Z.; Xuan, D. Total recycling of concrete waste using accelerated carbonation: A review. Cem. Concr. Res. 2023, 173, 107284. [Google Scholar] [CrossRef]
- Fernández Bertos, M.; Simons, S.J.R.; Hills, C.D.; Carey, P.J. A review of accelerated carbonation technology in the treatment of cement-based materials and sequestration of CO2. J. Hazard. Mater. 2004, 112, 193–205. [Google Scholar] [CrossRef]
- NBN EN 933-11: 2009; Tests for Geometrical Properties of Aggregates—Part 11: Classification Test for the Constituents of Coarse Recycled Aggregate. Bureau for Standarisation: Brussels, Belgium, 2009.
- NBN EN 1097-6:2022; Tests for Mechanical and Physical Properties of Aggregates—Part 6: Determination of Particle Density and Water Absorption. Bureau for Standarisation: Brussels, Belgium, 2022.
- NBN EN 1097-2:2020; Tests for Mechanical and Physical Properties of Aggregates—Part 2: Methods for the Determination of Resistance to Fragmentation. Bureau for Standarisation: Brussels, Belgium, 2020.
- NBN EN 1367-1:2007; Tests for Thermal and Weathering Properties of Aggregates—Part 1: Determination of Resistance to Freezing and Thawing. Bureau for Standarisation: Brussels, Belgium, 2007.
- NBN EN 1744-1+A1:2013; Tests for Chemical Properties of Aggregates—Part 1: Chemical Analysis. Bureau for Standarisation: Brussels, Belgium, 2013.
- NBN EN 12350-2:2019; Testing Fresh Concrete—Part 2: Slump Test. Bureau for Standarisation: Brussels, Belgium, 2019.
- NBN EN 12350-7:2019; Testing Fresh Concrete—Part 7: Air Content—Pressure Methods. Bureau for Standarisation: Brussels, Belgium, 2019.
- NBN EN 12390-3:2019; Testing Hardened Concrete—Part 3: Compressive Strength of Test Specimens. Bureau for Standarisation: Brussels, Belgium, 2019.
- Librandi, P.; Nielsen, P.; Costa, G.; Snellings, R.; Quaghebeur, M.; Baciocchi, R. Mechanical and environmental properties of carbonated steel slag compacts as a function of mineralogy and CO2 uptake. J. CO2 Util. 2014, 33, 201–214. [Google Scholar] [CrossRef]
- NBN EN 196-1:2016; Methods of Testing Cement—Part 1: Determination of Strength. Bureau for Standarisation: Brussels, Belgium, 2016.
- NBN EN 772-1+A1:2015; Methods of Test for Masonry Units—Part 1: Determination of Compressive Strength. Bureau for Standarisation: Brussels, Belgium, 2015.
- NBN EN 772-11:2011; Methods of Test for Masonry Units—Part 11: Determination of Water Absorption of Aggregate Concrete, Autoclaved Aerated Concrete, Manufactured Stone and Natural Stone Masonry Units Due to Capillary Action and the Initial Rate of Water Absorption of Clay Masonry Units. Bureau for Standarisation: Brussels, Belgium, 2011.
- NBN EN 772-13:2000; Methods of Test for Masonry Units—Part 13: Determination of Net and Gross Dry Density of Masonry Units (Except for Natural Stone). Bureau for Standarisation: Brussels, Belgium, 2000.
- Zhang, J.; Shi, C.; Li, Y.; Pan, X.; Poon, C.S.; Xie, Z. Performance enhancement of recycled concrete aggregates through carbonation. J. Mater. Civ. Eng. 2016, 27, 04015029. [Google Scholar] [CrossRef]
- Mu, Y.; Liu, Z.; Wang, F.; Huang, X. Carbonation characteristics of γ-dicalcium silicate for low-carbon building material. Constr. Build. Mater. 2018, 177, 322–331. [Google Scholar] [CrossRef]
- Salman, M.; Cizer, Ö.; Pontikes, Y.; Santos, R.M.; Snellings, R.; Vandewalle, L.; Blanpain, B.; Balena, K.V. Effect of accelerated carbonation on AOD stainless steel slag for its valorisation as a CO2- sequestering construction material. J. Chem. Eng. 2014, 246, 39–52. [Google Scholar] [CrossRef]
- Santos, R.M.; Van Bouwel, J.; Vandevelde, E.; Mertens, G.; Elsen, J.; Van Gerven, T. Accelerated mineral carbonation of stainless steel slags for CO2 storage and waste valorization: Effect of process parameters on geochemical properties. Int. J. Greenh. Gas Control 2013, 17, 32–45. [Google Scholar] [CrossRef]
- NBN EN 771-3+A1:2015; Specification for Masonry Units—Part 3: Aggregate Concrete Masonry Units (Dense and Lightweight Aggregates). Bureau for Standarisation: Brussels, Belgium, 2015.


| Compounds | Reference | 30% cRCA | 50% cRCA | 70% cRCA | 100% cRCA |
|---|---|---|---|---|---|
| CEM III/A 42.5 | 340 | 340 | 340 | 340 | 340 |
| Sand 0/5.6 | 770 | 770 | 770 | 770 | 770 |
| Limestone 4/16 | 1097 | 754 | 533 | 316 | |
| cRCA 4/16 | 323 | 533 | 737 | 1034 | |
| Water (W/C = 0.53) | 178.5 | 178.5 | 178.5 | 178.5 | 178.5 |
| Material | CaO | SiO2 | Al2O3 | Fe2O3 | MgO | K2O | TiO2 | LOI |
|---|---|---|---|---|---|---|---|---|
| RCF Colruyt | 23.4 | 52.6 | 2.88 | 0.86 | <1 | 0.325 | <0.15 | 17.43 |
| Carbinox | 45.8 | 27.5 | 6.63 | 0.80 | 9.65 | <0.15 | 0.86 | 2.88 |
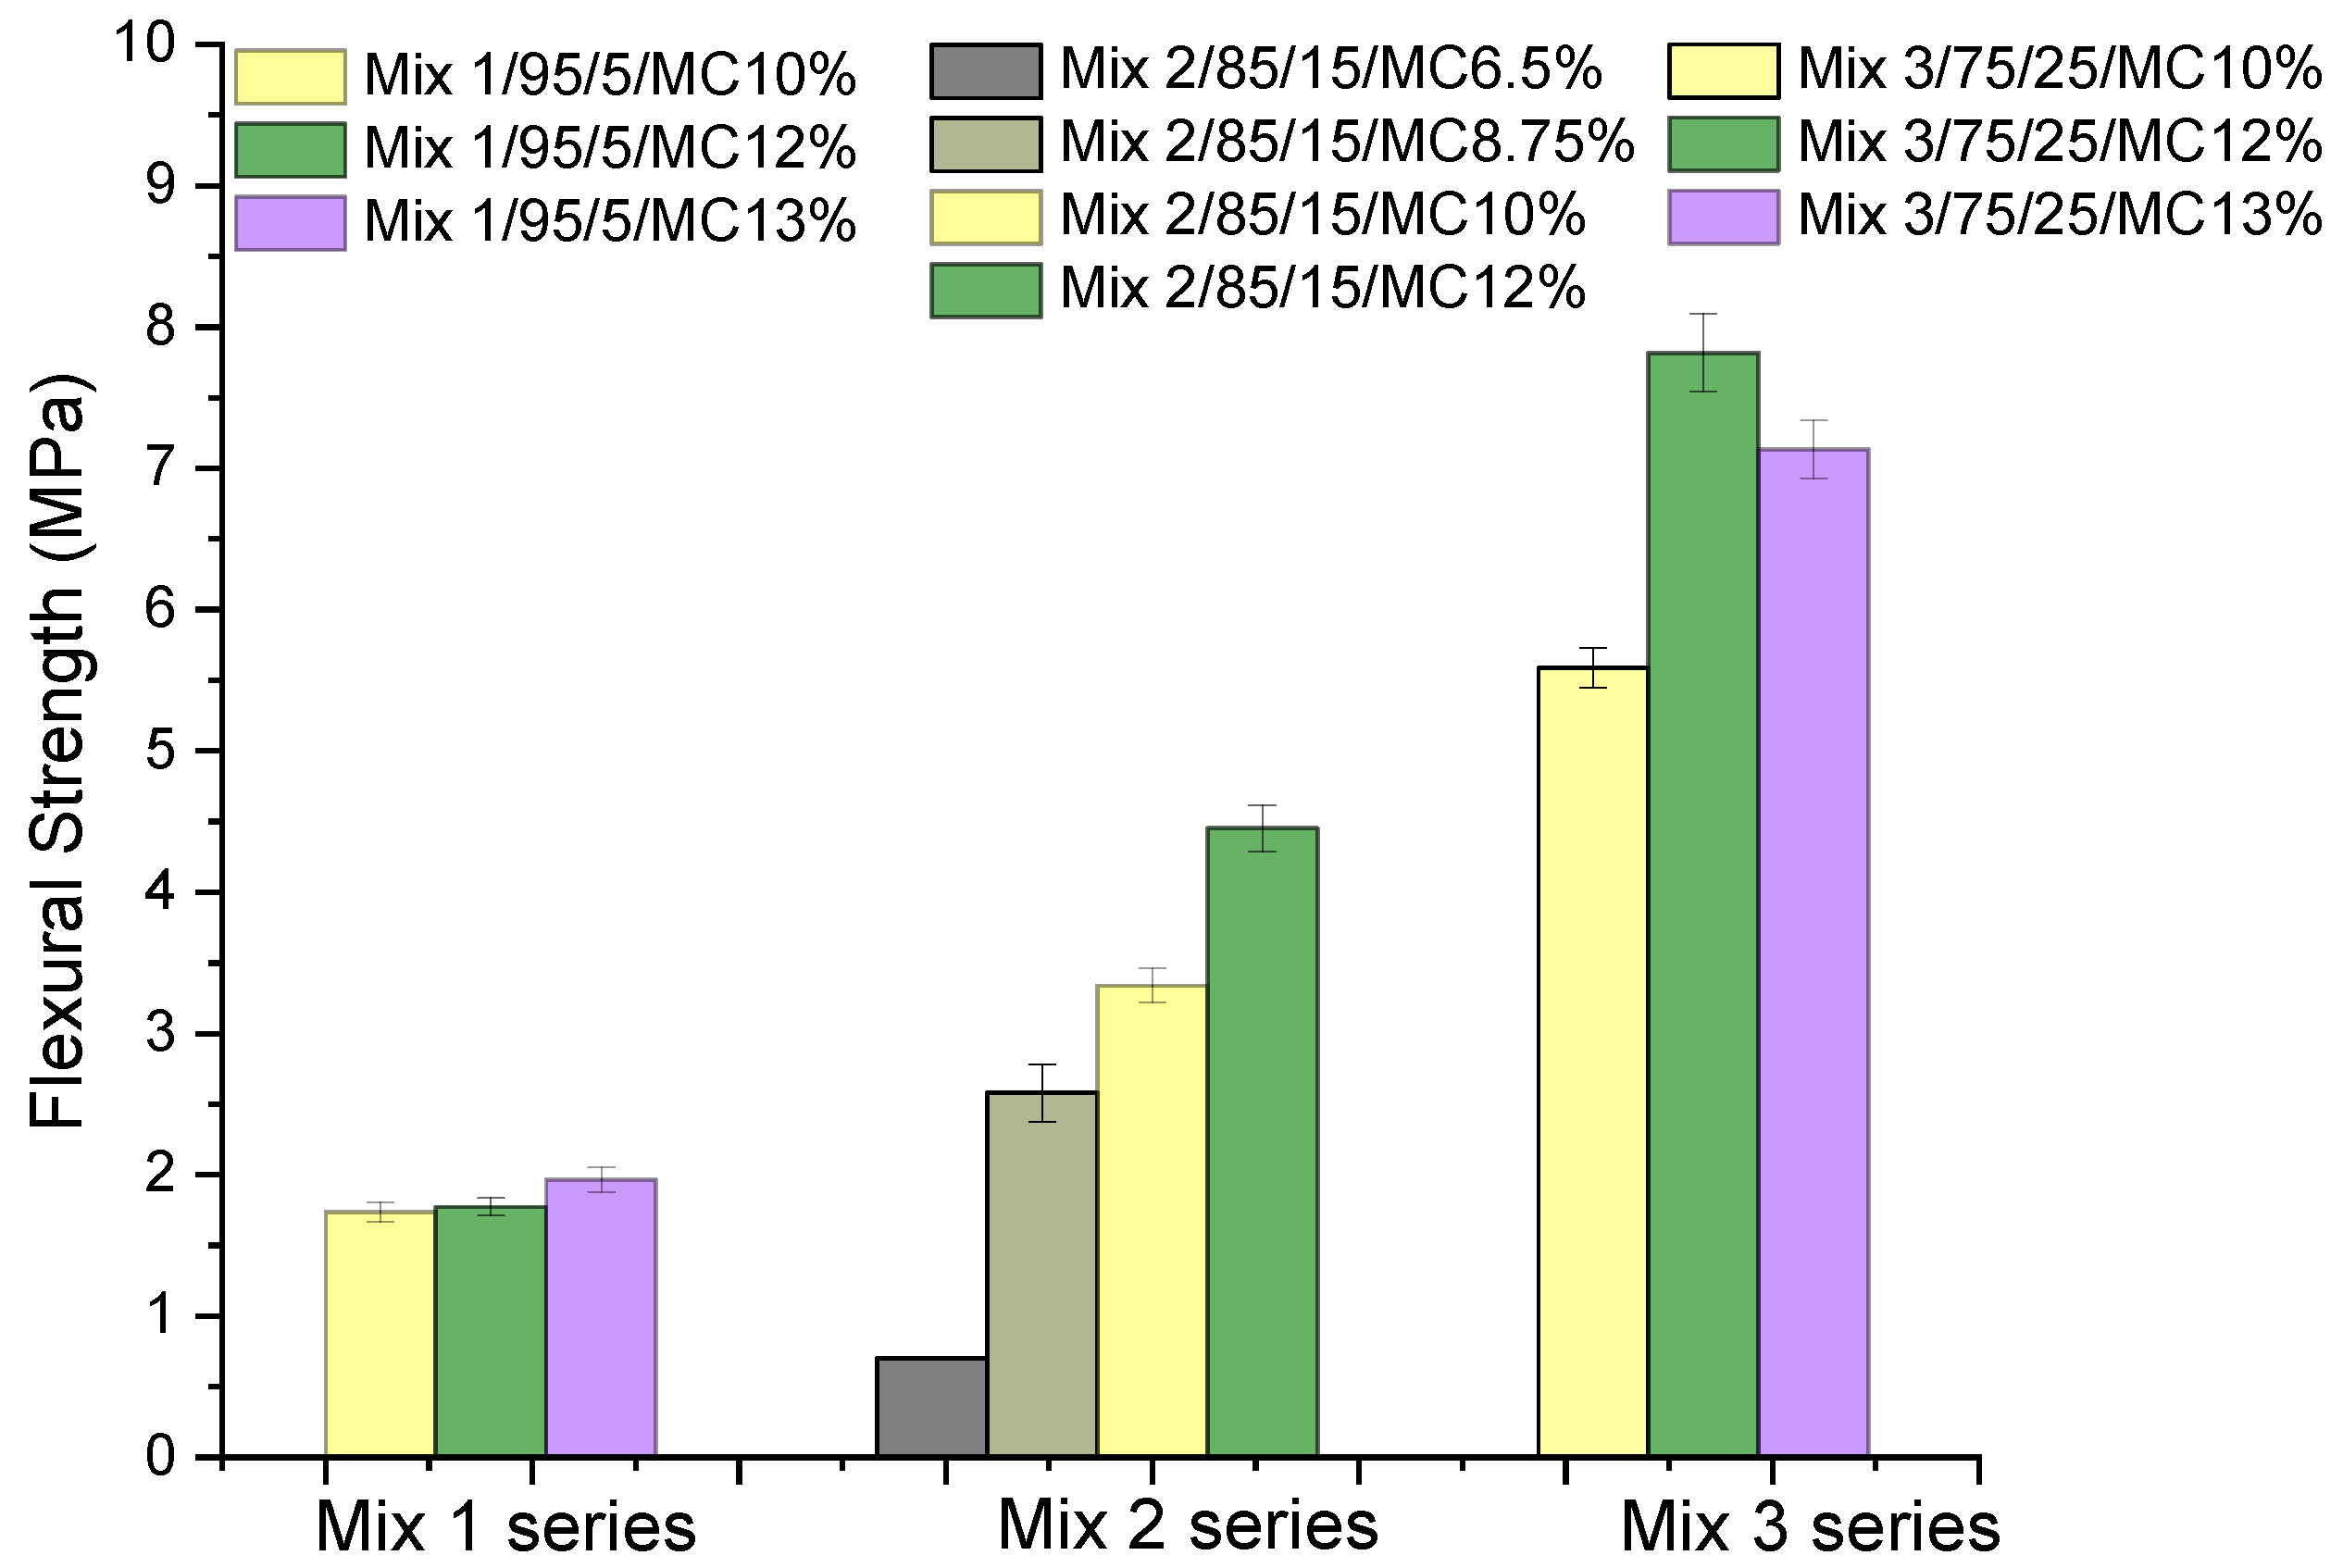
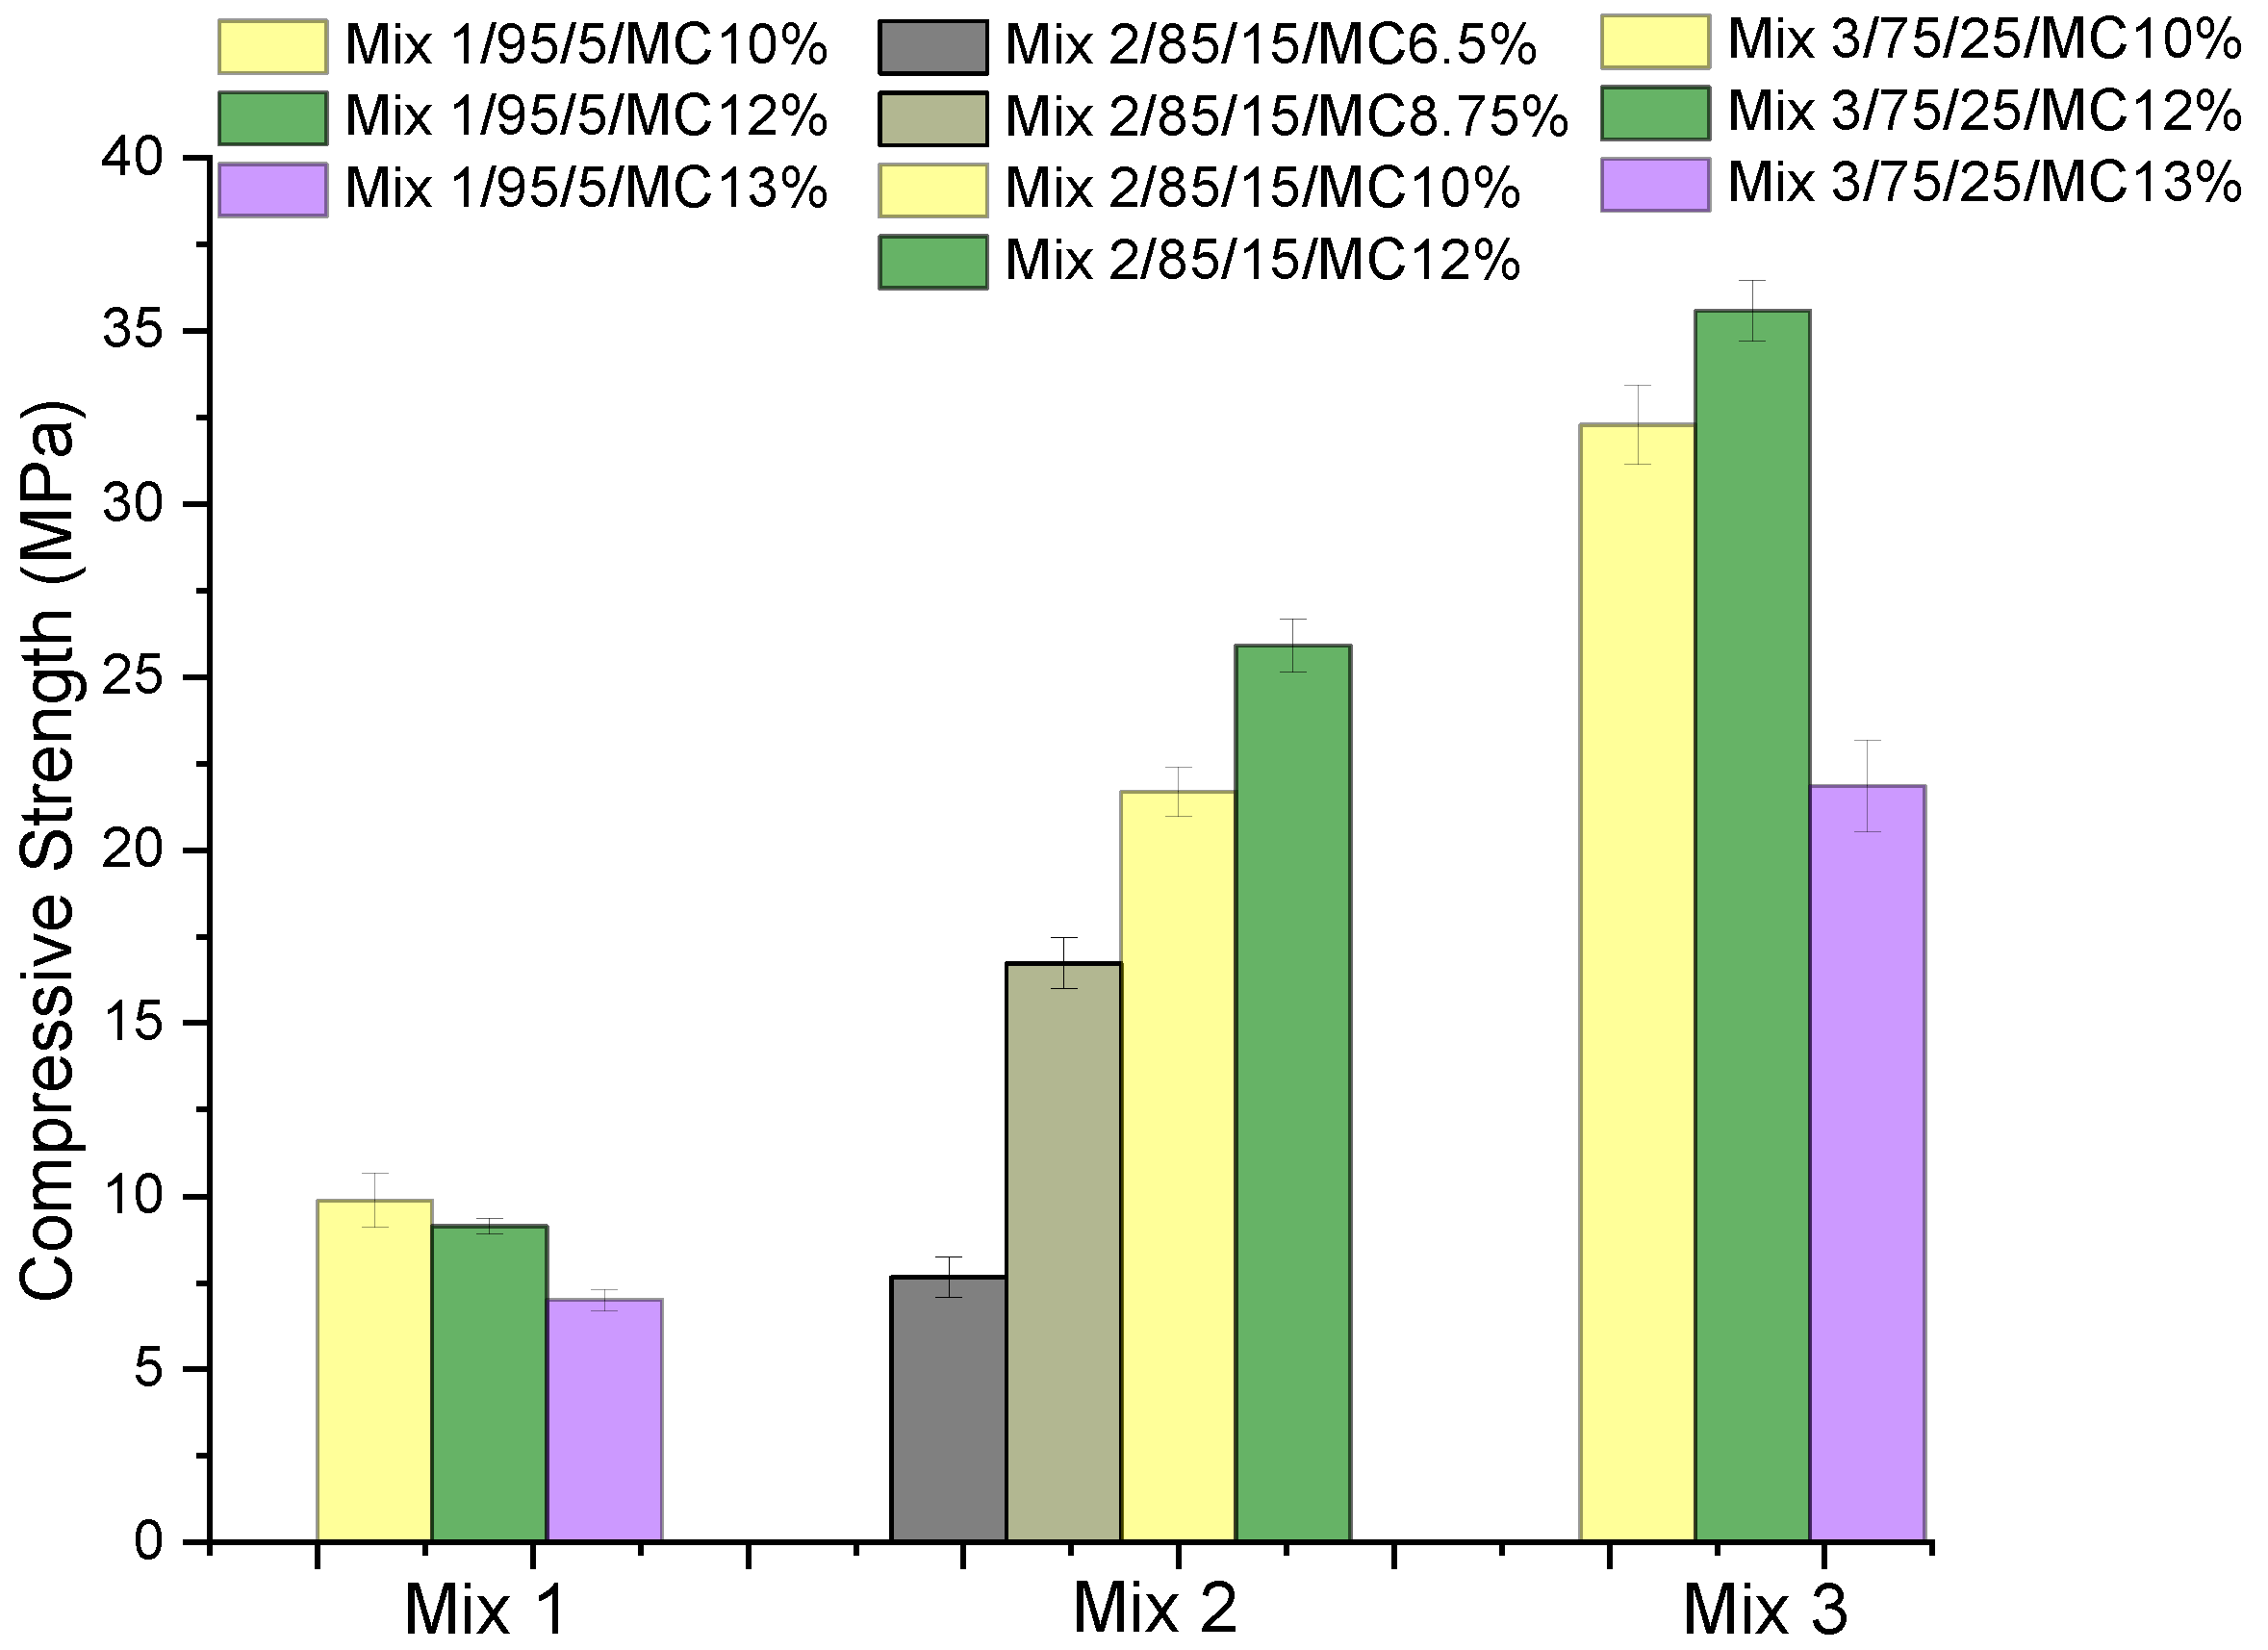
| Mixes | RCF (%) | Carbinox (%) | Moisture Content (%) | |
|---|---|---|---|---|
| Lab phase on prisms | Mix 1/95/5/MC10% | 95 | 5 | 10 |
| Mix 1/95/5/MC12% | 95 | 5 | 12 | |
| Mix 1/95/5/MC13% | 95 | 5 | 13 | |
| Mix 2/85/15/MC6.5% | 85 | 15 | 6.5 | |
| Mix 2/85/15/MC8.75% | 85 | 15 | 8.75 | |
| Mix 2/85/15/MC10% | 85 | 15 | 10 | |
| Mix 2/85/15/MC12% | 85 | 15 | 12 | |
| Mix 3/75/25/MC10% | 75 | 25 | 10 | |
| Mix 3/75/25/MC12% | 75 | 25 | 12 | |
| Mix 3/75/25/MC13% | 75 | 25 | 13 | |
| Lab phase on hollow blocks | Mix 2/85/15/MC10% | 85 | 15 | 10 |
| Mix 2/85/15/MC11% | 85 | 15 | 11 | |
| Mix 3/75/25/MC10% | 75 | 25 | 10 | |
| Pilot phase on hollow blocks | Mix 3/75/25/MC11% | 75 | 25 | 11 |
| Parameter | RCA Sample | ||
|---|---|---|---|
| Original | Carbonated 24 h Pilot Scale | Carbonated 72 h Lab Scale | |
| Water absorption after 24 h (%) (duplicates) | 3.9 ± 0.4 | 3.0 ± 0.3 | 3.2 ± 0.2 |
| Los Angeles abrasion coefficient | 34 | 31 | |
| Disintegration after freeze–thaw cycles (%) | 7.2 | 4.5 | |
| Total carbon content (%) | 2.74 | 3.62 | 4.09 |
| Water soluble sulfate (%) | 0.09 | 0.06 | |
| Parameter | Concrete Samples | ||||||
|---|---|---|---|---|---|---|---|
| Ref. | 30% RCA | 50% RCA | 30% cRCA | 50% cRCA | 70% cRCA | 100% cRCA | |
| Air content (%) | 1.4 | 1.5 | 1.5 | 1.5 | 1.6 | 1.4 | 1.5 |
| Slump (mm) | 110 | 110 | 120 | 90 | 100 | 90 | 60 |
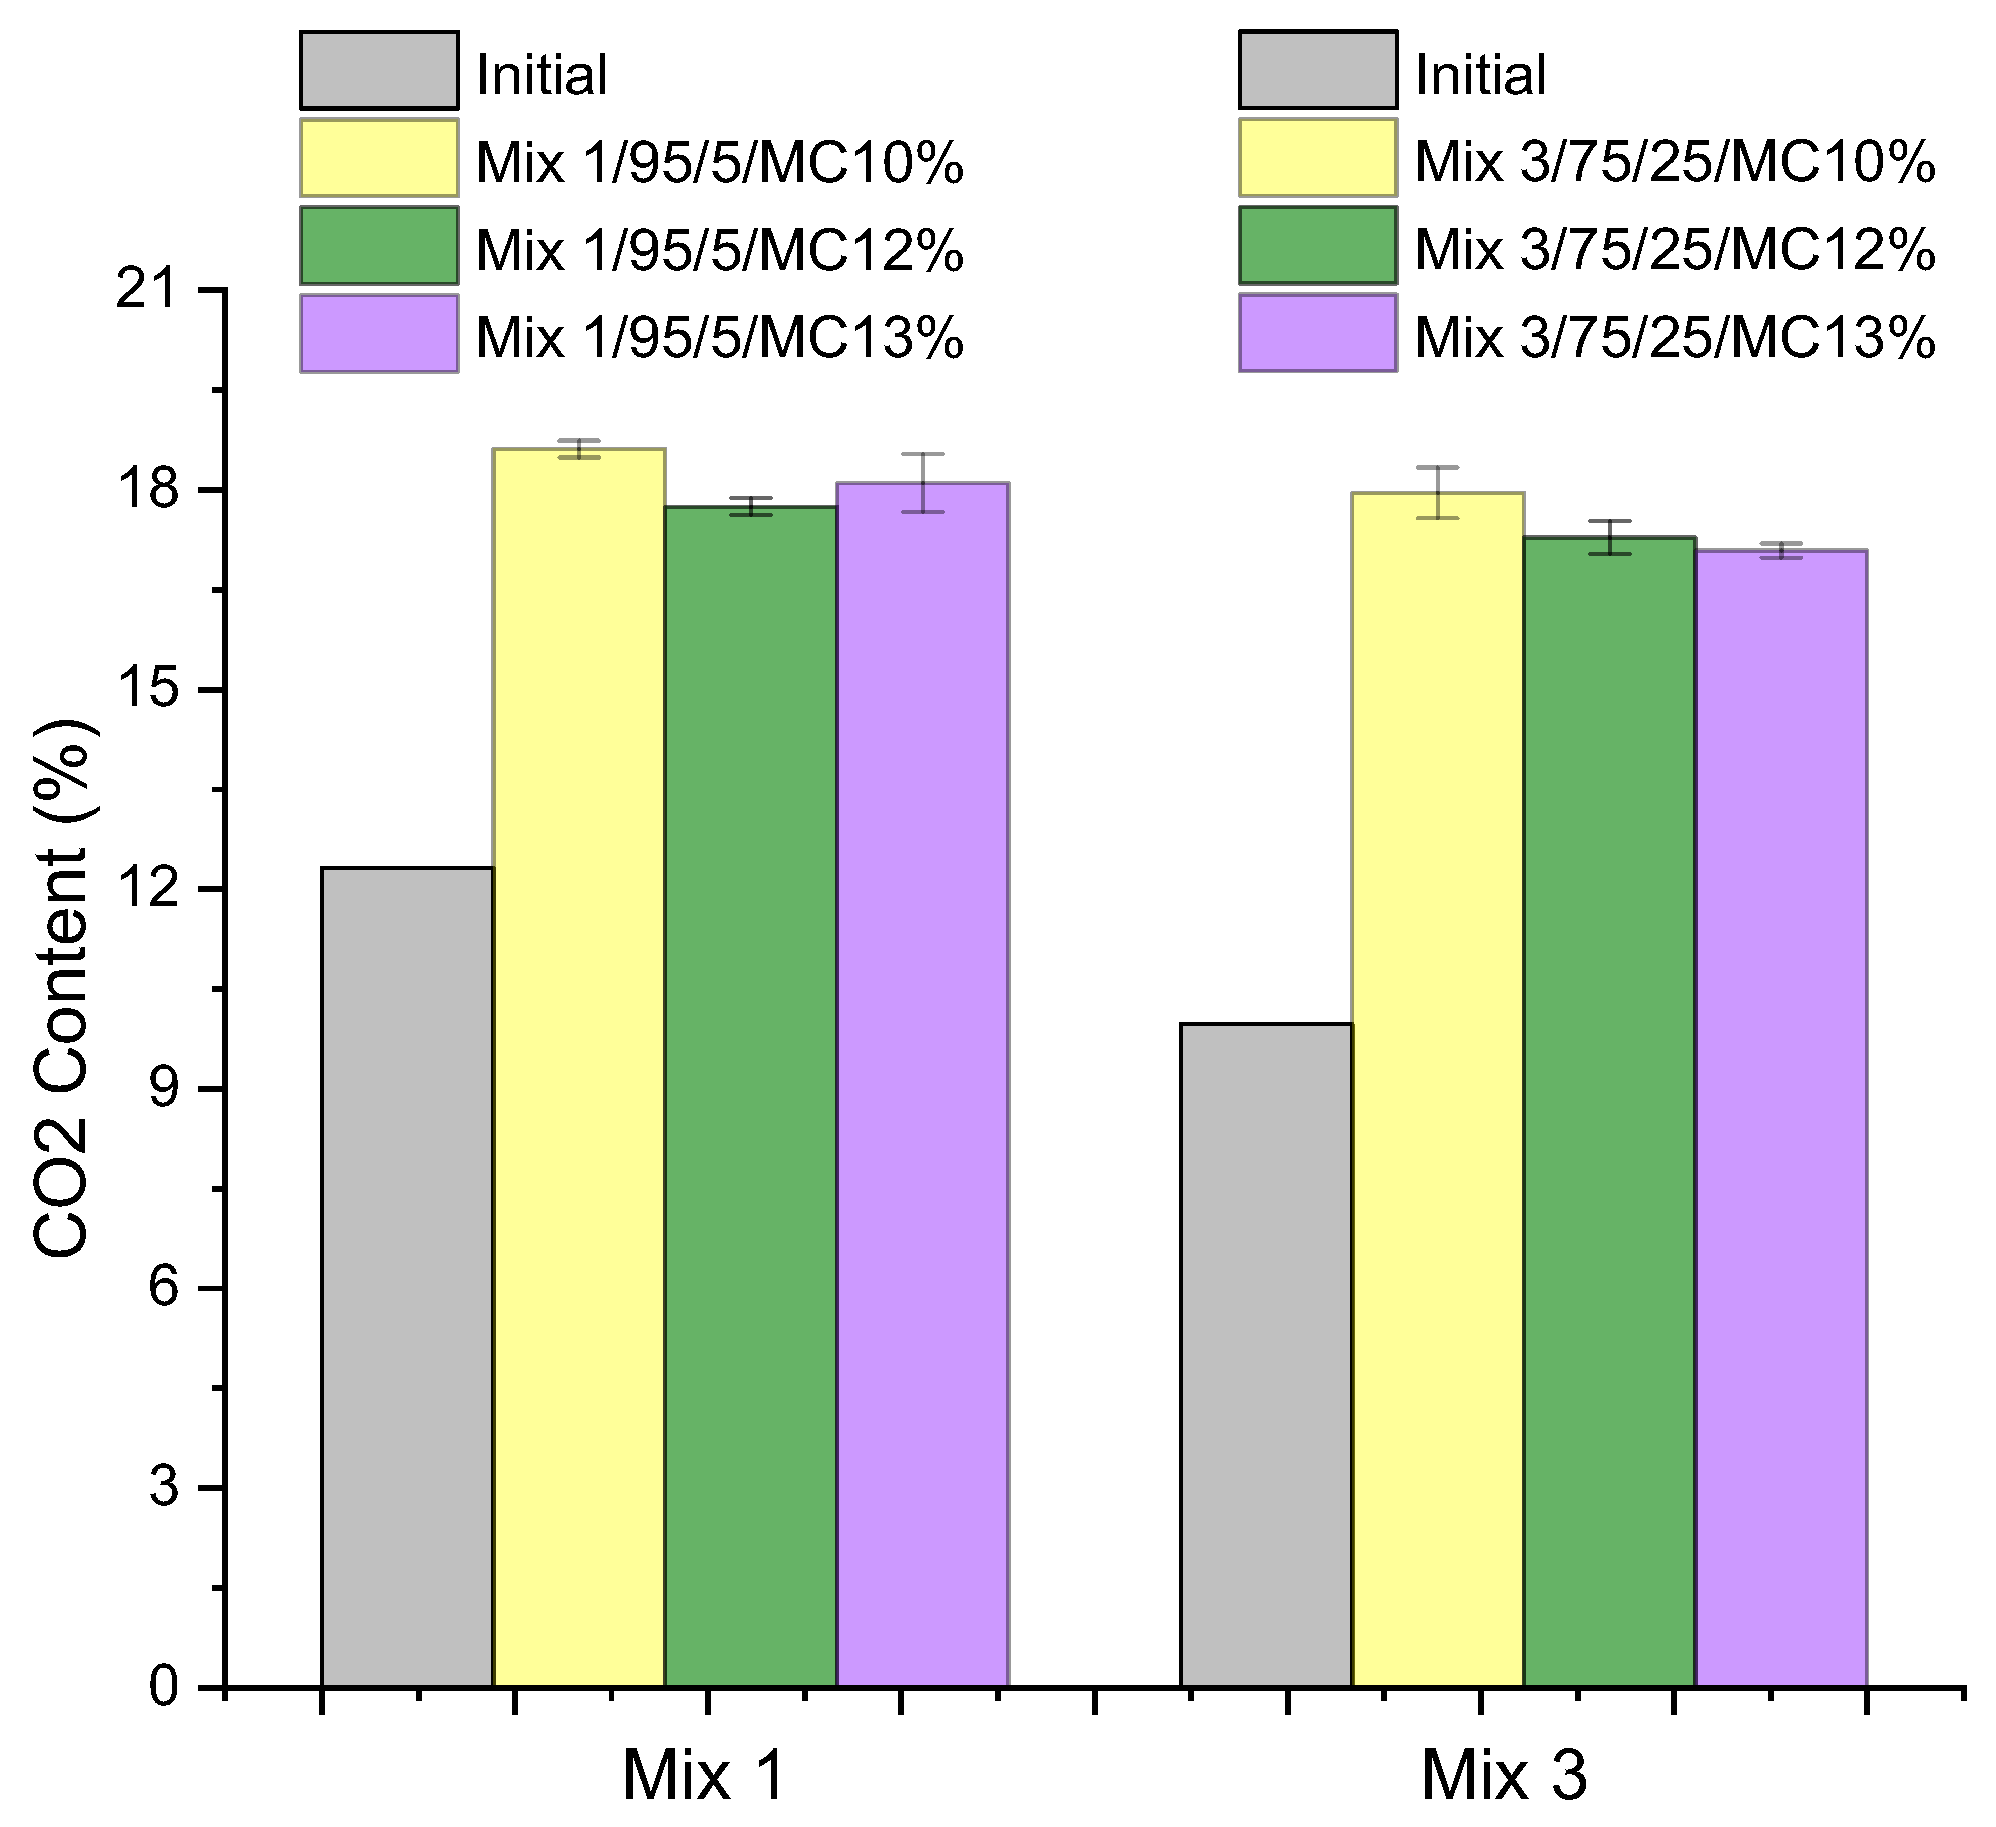
| Material Units | Initial CO2 % | Final (Max) CO2 % | CO2 Uptake % | Volume Increase % |
|---|---|---|---|---|
| Carbinox | 1.2 ± 0.1 | 20.4 ± 0.1 | 24.1 | 27.6 |
| RCF | 12.9 ± 0.1 | 15.7 ± 0.1 | 3.3 | 3.2 |
| UPV | Compressive Strength | Initial CO2 Content | Final CO2 Content | Calculated Max. CO2 Content | Calculated CO2 Uptake | |
|---|---|---|---|---|---|---|
| m/s | MPa | % | % | % | kg/ton | |
| Mix 2/85/15/MC10% | 2150 ± 70 | 7.4 ± 0.4 | 12.3 | 17.6 ± 0.2 | 15.9 | 64 |
| Mix 2/85/15/MC11% | 2550 ± 70 | 9.3 ± 0.6 | 11.1 | 18.1 ± 0.2 | 16.4 | 85 |
| Mix 3/75/25/MC10% | 3000 ± 60 | 15.4 ± 0.0 | 10.0 | 18.7 ± 0.1 | 16.9 | 107 |
| Parameter | Standard/Norm | Value |
|---|---|---|
| Compressive strength (MPa) | [47] | 6.4 ± 0.2 |
| Capillary water absorption (g/(m2s)) | [41] | 12.4 ± 0.5 |
| Gross dry density (kg/m3) | [42] | 1828 ± 4 |
| Net dry density (kg/m3) | [42] | 1488 ± 4 |
Disclaimer/Publisher’s Note: The statements, opinions and data contained in all publications are solely those of the individual author(s) and contributor(s) and not of MDPI and/or the editor(s). MDPI and/or the editor(s) disclaim responsibility for any injury to people or property resulting from any ideas, methods, instructions or products referred to in the content. |
© 2024 by the authors. Licensee MDPI, Basel, Switzerland. This article is an open access article distributed under the terms and conditions of the Creative Commons Attribution (CC BY) license (https://creativecommons.org/licenses/by/4.0/).
Share and Cite
Bergmans, J.; Kazemi Kamyab, H.; Ghosh, D.; Van Mierloo, P.; Carens, H.; Nielsen, P. Carbonation of Recycled Concrete Aggregates for New Concrete and Concrete Fines to Make Cement-Free Hollow Blocks. Sustainability 2024, 16, 3494. https://doi.org/10.3390/su16083494
Bergmans J, Kazemi Kamyab H, Ghosh D, Van Mierloo P, Carens H, Nielsen P. Carbonation of Recycled Concrete Aggregates for New Concrete and Concrete Fines to Make Cement-Free Hollow Blocks. Sustainability. 2024; 16(8):3494. https://doi.org/10.3390/su16083494
Chicago/Turabian StyleBergmans, Jef, Hadi Kazemi Kamyab, Debabrata Ghosh, Peter Van Mierloo, Hilde Carens, and Peter Nielsen. 2024. "Carbonation of Recycled Concrete Aggregates for New Concrete and Concrete Fines to Make Cement-Free Hollow Blocks" Sustainability 16, no. 8: 3494. https://doi.org/10.3390/su16083494