
Social and Spatial Inequalities during COVID-19: Evidence from France and the Need for a New Sustainable Urban and Regional Development Paradigm

Department of Sociology, University of Sharjah, Sharjah City P.O. Box 27272, United Arab Emirates
Sustainability 2024, 16(8), 3501; https://doi.org/10.3390/su16083501
Submission received: 5 February 2024
/
Revised: 15 April 2024
/
Accepted: 16 April 2024
/
Published: 22 April 2024
(This article belongs to the Special Issue Urban Planning and Sustainable Regional Development in Suburban Zones of Large Cities in Central and Eastern Europe)
Abstract
:This study examines the impact of social and spatial inequalities on the spread of COVID-19 and the efficacy of lockdown measures in French regions during the third wave (22 March and 3 May 2021), with a focus on population density and poverty. It based on data from French government websites, adopting quantitative methods including the Pearson Coefficient and One-Way ANOVA. The results indicate a significant correlation between population density and COVID-19 deaths in 92 departments (R = 0.695), which is stronger than the correlation between density and infection rates (R = 0.633, p < 0.001). In the 25 most affected departments, this pattern shifts, with a weaker correlation between density and deaths (R = 0.644) compared to density/infections (R = 0.716, p < 0.001). Although insightful, these statistics do not capture regional disparities. A minor correlation between poverty and death rates was recorded in French regions. Spatial observations showed that areas exceeding the national poverty average experienced higher infection/death rates. The lockdowns were effective, leading to a reduction (51.7%) in infections. The present results showed that there is a significant need for a new social contract based on a new urban and regional paradigm focused on socio-spatial equality and Sustainable Development Goals locally and globally, a vital task for policymakers, planners, and researchers.
1. Introduction
Since the World Health Organization (WHO) declared COVID-19 a global pandemic in March 2020 [1], the spread of the virus in cities and regions outpaced government responses. WHO data from 19 November 2020 showed approximately 56.3 million global infections and 1.3 million fatalities [2]. These numbers quickly doubled, then tripled, increasing to 233 million, including 4.73 million deaths by 28 September 2021 [3], and further surging to over 600 million infections with more than 6.4 million deaths by 2 September 2022 [4]. By 14 January 2024, the tally had reached 774 million infections and 7.01 million deaths [5]. Early observations indicated that COVID-19 predominantly impacted urban areas, with about 95% of the cases in the initial months occurring in these regions, and over 2550 cities affected by COVID-19 [6].
Since 2020, the COVID-19 pandemic has captured the world’s attention, but it is not the only challenge facing our cities and societies, primarily spreading through human contact [7]. The crisis has highlighted pre-existing weaknesses in urban models, often ignored in the past by urban planners [8]. The post-COVID-19 era presents an opportunity to reshape our cities into “happy and healthy cities” [9] to assure “urban social sustainability” [10]. COVID-19, marked by significant human suffering, is neither the first nor will it be the last virus to impact humanity. Notably, its timing, frequency, and spread have varied significantly across countries, regions within the same country, and cities within the same region, leading to diverse territorial impacts [11]. In the context of the COVID-19 pandemic, several developed countries including France, situated in Central Europe were significantly affected. France was identified as the fourth most infected country globally [3,4] and the most affected within the European Union, despite boasting a high Human Development Index (HDI) of 0.901 in 2019, a year before the pandemic [12]. Like many other countries, France’s urban areas faced challenges during the public health crisis. The actual cities and regions, tailored to meet specific needs of a pre-pandemic era, inadvertently facilitated the spread of the virus.
During the initial phase of the pandemic, national and international communities have initiated various awareness campaigns, including conferences, research, and reports. These efforts aimed to encourage leaders and urban planners to reevaluate urban and intercity travel, drawing on insights gained from the COVID-19 experience [13]. António Guterres, the Secretary-General of the United Nations, characterized the COVID-19 crisis as a chance to establish a “New social contract” stating: “Cities are engines of dynamism and innovation and can help us overcome development deficits. They can spearhead reforms towards a New Social Contract to tackle poverty, strengthen social protection, restore public trust, and reach people who are on the margins or who face discrimination” [14]. M. M. Sharif, Executive Director of UN-HABITAT, highlighted that “poverty” and “inequality” were central to the COVID-19 crisis. She emphasized the need for direct action against systemic “poverty”, and “inequality” in cities [6], focusing on improved housing, essential services, sustainable mobility, and connectivity. As the world continues to grapple with COVID-19, understanding the link between “poverty” and “inequality” has become a key area of research, especially in relation to the extensive spread of the disease. Scholars have particularly focused on urban inequality in poorer and less developed nations. A notable example is India, where an estimated 152–216 million individuals reside in densely packed informal settlements, often referred to as slums [15]. However, the socio-economic factors influencing COVID-19’s spread are also evident in many developed countries. Research from the USA, the UK, and China highlights aspects related to their medical and healthcare systems, as well as social inequalities [8,16,17,18]. In other developed countries such as France, research on this topic was comparatively limited. Bajos et al.’s [19] study highlighted social inequality and the dynamics of early COVID-19, focusing on specific socio-economic factors at the micro and individual levels, traversing social and ethnic groups, as well as gender differences. This research linked social characteristics to the symptoms of anosmia/ageusia during and after the epidemic’s peak but did not explore regional variations at socio-spatiotemporal levels.
Meanwhile, Gaudart et al.’s [20] investigated the factors contributing to the spatial heterogeneity of COVID-19 in France. The analysis covered the first wave COVID-19 and the first lockdown from 19 March to 11 May 2020. This study’s analysis revealed distinct spatial variations in hospital COVID-19 incidence and mortality rates following the virus’s spread. Higher death rates were observed in departments with a larger population aged over 85 years. The findings indicated no correlation between climate and hospital COVID-19 incidence, nor between economic factors and COVID-19 incidence or mortality rates in France. However, it is important to note that this research was conducted during the early stages of the COVID-19 outbreak and solely analyzed hospital data. It did not consider other contributing factors to the spread of COVID-19, such as “density” related to the “spatial dimension”, or “poverty” and “inequality” associated with the “social dimension”. These factors are critical across spatial/temporal levels, particularly in the context of lockdown policies. Moreover, the spatial aspects of disease prevention and management pose significant challenges for scholars in urban health. In line with this, Wolf [21] advocated for a deeper understanding of the relationship between urban environments and disease, calling for a rethinking of urban epidemiology.
From a developmental perspective, “poverty”, and “inequality” present a significant risk to sustained social and economic development, undermining efforts towards sustainable development. Consequently, the first Sustainable Development Goal (SDG 1) seeks to “end poverty in all its forms everywhere”, and SDG 10 aims to “reduce inequality within and among countries” to guarantee the achievement of the SDGs by 2030. Additionally, SDG 11 highlights the importance of “inclusive sustainable urbanization” by “strengthening national and regional development planning” [10]. Based on this perception, the research on social and spatial inequalities during the COVID-19 crisis in France has been somewhat limited, with a primary focus on medical strategies to prevent the virus’ spread. However, the concept of social sustainability faces considerable obstacles both in theoretical and practical terms [22]. A significant gap in existing academic literature related to COVID-19 pandemic is the exploration of spatial and social dimensions for urban social sustainability, which remains largely unexplored and untouched [22], particularly empirical data related to the challenges of spatial and social dimensions in France. It is crucial to understand how these challenges impact the governance of cities and regions in the post-COVID-19 era. As the research progresses, it examines various concepts and evaluates the interconnections among different factors. More precisely, it investigates the following questions:
- -
- What are the theoretical and operational implications of social and spatial inequality in cities and regions?
- -
- Is there a correlation between population density and the numbers of infections and deaths caused by COVID-19?
- -
- Is there a correlation between poverty and the numbers of infections and deaths caused by COVID-19?
- -
- How effective were the lockdown measures during the COVID-19 pandemic, and did they play a role in reducing the rates of infection and death?
- -
- What lessons can be learned from the French experience?
- -
- How can we reshape the future of cities, regions, and communities for the post-COVID-19 era?
The objective of this study is to enhance knowledge and uncover the factors contributing to the variation in COVID-19 cases across France, which was significantly affected during the early stages of the pandemic. This study stems from an academic attempt to emphasize the role of city planning and regional development policies as effective tools for achieving SDGs. This initiative will address issues related to urban structure as well as densely populated areas, and social issues related to poverty in cities and regions, with the aim of fostering social and spatial equality. The focus of the study is French regions managing urban areas, mitigating social and spatial inequalities, and extracting lessons for future crisis prevention and management. The main outcome is to contribute to the creation of healthy communities, sustainable cities, and regions for the post-COVID-19 world.
1.1. The Theoretical Framework: Social and Spatial Inequality Discourse
From the early stages, the social and spatial dimensions have been debated at both theoretical and operational levels. In 1973, Harvey argued that the city is a “complicated thing” [23]. It cannot be understood within the borders of our current disciplinary structures. However, there is scarcely any indication of a developing interdisciplinary approach to thinking about and theorizing the city. Sociologists, economists, geographers, architects, city planners, and others all seem to work in isolation, limited to their own theoretical realms. Harvey confirmed that normative thinking plays a crucial role in spatial analysis. Given that social justice is a normative concept, it is surprising that social justice considerations have not been integrated into spatial analysis methods [23]. Nevertheless, Leven confirmed that the city has been used more as a laboratory for testing propositions and theories, rather than being studied [24]. In this context, Harvey advocated for a shift in our perception of the city, aiming to bridge “social imagination” and “spatial consciousness”. This highlights the importance of recognizing the role of space and place. It emphasizes the significance of applying social justice in the “vertical dimension”, which comprises law and sociology, but it should be included also in “horizontal dimension” at the spatial level in urban and regional planning. Within this context, scholars have intensively investigated in the “social dimension” of cities and regions [22]. Social equity has been one of the central concerns of human rights [25] and planning [26]. In 1993, Yiftachel and Hedgcock underlined the potential of a city for providing “social qualities”, “equitable access to urban opportunities”, and the “fair distribution of urban services throughout the city” [26].
From a spatial perspective, Kay proposed the concept of “territorial justice”, which means equal access to public services and spatial distribution of welfare [27]. However, recent studies have discussed the concept of “social sustainability” and the “spatial realm” [22]. Piketty highlighted the relationships among capitalist wealth generation, inequality, and social sustainability, stressing that ongoing inequality trends make meeting future social needs unattainable, rendering the situation socially unsustainable [28]. Vallance et al. [29] assert that social sustainability encompasses “development sustainability”, focusing on addressing “poverty” and “inequality”. Bramley et al. indicate that social sustainability comprises two principal dimensions: social equity and community sustainability [30]. Social equity encompasses access to services and opportunities, while community sustainability entails aspects like neighborhood attachment, social interaction, local safety, environmental quality, home satisfaction, stability, and civic engagement. Nevertheless, other studies reveal that social sustainability’s spatial aspect has been investigated in various fields and disciplines, such as “urban form” [30], “density” [31,32], “neighborhood environment” [33], and “urban happiness” [34]. However, the multidisciplinary nature of social and spatial inequality discourse covers a broad range of knowledge from natural and social sciences such as sociology, architecture, social work, public health, public administration, urbanism, etc.
Despite this, scholars have highlighted the lack of “social sustainability” evaluation methods and the insufficient measurement frameworks [35]. The spatial dimension of social sustainability remains unexplored. However, other scholars suggests that social sustainability qualities have two key aspects: “hard qualities” which relate to material topics such as access to urban services and quality of neighborhoods called “spatiality of place”, and “soft qualities” for non-material topics related to “sociality of place” based on social interaction and urban practices [22]. In 1997, Shields emphasized that the objective of spatiality is the “empirical space”, which measures the relationship between objects based on an empirical–physical approach to space [36]. However, Shirazi and Keivani developed two modes of spatiality of social sustainability based on the interaction and complementarity between the “theory of urban form” and the “social theory of space” [37]. The “theory of urban form” uses the objective spatiality with quantitative methods developed in fields such as geography, architecture, urbanism, and urban planning; while the “social theory of space” uses intersubjective spatiality based on qualitative methods related to urban sociology. In this kind of research, “mixed methodologies” are used to achieve higher reliability and accuracy.
1.2. The Operational Framework: Population Density, Poverty, and the Spread of COVID-19
Historically, the problem of cities has often revolved around density [38]. However, McFarlane mentioned that we do not have comprehensive studies on the past, present, and future patterns of urban density [38]. Density has been portrayed as a solution to various urban challenges such as slums, suburbs, social mixing, economic growth, and environmental sustainability [38]. It is now back in the spotlight as a central focus of global urban strategies. The spatial urban dialectic suggests that “population density” plays a crucial role in the emergence and spread of epidemics [39]. Intensive urbanization, characterized by rising density, is consequently linked to infectious diseases [40,41]. Nonetheless, scholars have highlighted the population density averages in a city and how they can provide a useful indication about the risk of diseases spreading [41]. The COVID-19 crisis has shown the fragility of some urban systems that were not designed to confront this type of crisis.
Areas often exhibit high population densities during working hours, leading to congestion. However, at day’s end, people return to residential areas, reducing the density. Cities with extensive global connections and high levels of social interaction, as observed in this pandemic, became vulnerable and central to the COVID-19 outbreak [42]. The impact of population density on infectious diseases and their transmission rates is not consistent or uniform worldwide, with empirical studies yielding mixed outcomes. Some research [43,44] identified a positive correlation between population density and COVID-19 infection and death rates, particularly where social distancing was the primary control measure. However, other studies [8,45] found no significant link between high-density cities and COVID-19 spread. Fang & Wahba’s [46] results indicated an absence of a direct causal relationship between density and COVID-19 transmission.
Instead, Hamidi et al. [47] highlighted that economic, social, and transport connections within and beyond urban centers had a greater correlation with COVID-19 than density itself. Their findings did not support the theory that higher density, through increased connectivity, positively correlates with the time-adjusted rates of infection and death. Subsequent studies suggest that compact, densely populated cities might lead to early COVID-19 transmission but not necessarily higher numbers of fatalities. The presence of healthcare systems in denser areas might account for the observed inverse relationship between mortality and density [48]. Other research focused on urban density’s effect on physical activity, revealing that residents in low-density areas experienced less reduction in activity levels [43,44].
From another perspective, poverty may be an important factor to consider in this context. Some studies in less developed countries show a relationship between the spread of COVID-19 and the multidimensional poverty index in the city of Manizales [49]. A more recent study examined the social distribution of exposure factors (density of place of residence, overcrowded housing, and working outside the home) and emphasized the need for a dynamic consideration of race, social status, and gender as direct and indirect consequences of the COVID-19 pandemic, particularly to implement initiatives that prevent social inequalities and the dynamics of the early epidemic spread [17]. These divergent findings call for a more thorough investigation with solid evidence—a topic this paper will explore to offer insights into urban and regional development for the post-COVID-19 world.
1.3. The Empirical Framework: Spread of COVID-19 in French Regions
As of 10 June 2023, France has reported a total of 38,997,490 confirmed COVID-19 cases and 167,985 deaths from 3 January 2020 to 6 September 2023 [50]. On 4 October 2022, the country faced its eighth significant COVID-19 wave since the pandemic’s declaration in March 2020 [51]. The initial wave reached its peak on 31 March 2020, and the lockdown was lifted on 11 May 2020, by which time there were 150,000 confirmed cases and over 30,000 deaths as reported by WHO [2]. The second wave spanned from 27 February to 30 June 2020, while the third wave occurred from 19 March to 3 May 2021. In November 2021, France recorded approximately 2,036,755 confirmed cases, with a peak of +86,852 cases per day on 7 November during the second wave, and a total of 45,054 deaths by 16 November, equating to 128 infections per 100,000 inhabitants at the height of the second wave. As observed, the infection rate in France surpassed the Regional Health Agency’s (Agence Régionale de Santé, ARS) alert threshold of 50 infections per 100,000 inhabitants. Unfortunately, the COVID-19 mortality rate in France was higher and increased more rapidly compared to many other countries. By 4 May 2021, there were 5,728,090 reported infections and 105,879 deaths, as recorded by Public Health France (Santé Publique France, SPF), and these figures continued to escalate [52]. On 11 May 2021, between 3% and 7% of the French population had been infected, with particularly high rates in the Parisian region, known as Île-de-France (7% to 16%), and the Grand Est region (6% to 15%), according to the Pasteur Institute [53].
This data swiftly escalated to 32,300,330 infections, equating to 48% of the population, along with 147,692 deaths by 21 July 2022 [4,52]. By 6 September 2023, France reported a total of 39,079,469 confirmed COVID-19 cases and 167,985 fatalities [50]. Over 1000 infections per 100,000 inhabitants were concentrated in 20 cities and urban agglomerations. Public Health France [52] reported infection rates nearing 1400 in these areas with active COVID-19 spread. On 4 March 2021, France announced the onset of the third wave, with notable regional disparities in infection rates. For instance, the Alpes-Maritimes in Southeast France recorded 486 infections per 100,000 inhabitants, and the Pas-de-Calais region in the North reported 407 infections per 100,000 inhabitants [54]. These figures support the hypothesis of a correlation between socio-spatial factors and the variance in infection/death rates across different regions. Accordingly, this study investigates the rate of cumulative confirmed COVID-19 infections in France at a regional level. As of 2022, France is divided into three tiers of territorial collectivities: 34,955 “communes”, 101 “départements”, and 18 regions (Figure 1).
Consequently, this research sought to analyze the associations among population density, infections, and fatalities in France during the third wave of the pandemic, while also investigating the link between poverty infections and deaths, and the impact of lockdown policies. The study initially covered all 96 French “départements”. It then narrowed its focus to the 92 “départements”, along with the 25 most affected, where the infection rate exceeded 400 per 100,000 inhabitants at the height of the third wave, the most intense since the COVID-19 crisis began.
1.4. Population Density in French Regions
Population density is determined by dividing the mid-year population by the land area in square kilometers [55]. As of 1 January, INSEE reported that France’s population reached 68.4 million in 2023 [56]. According to the 2020 population census, the population density in France was 106 people per square kilometer. Between 2007 and 2017, there was a noticeable increase in population, with significant disparities between the least and most densely populated regions. Population density varied from three people per square kilometer in French Guiana, an overseas region, to 1022 people per square kilometer in Île-de-France, and up to 20,700 inhabitants per square kilometer in the city of Paris. INSEE indicates that population growth rates were generally higher in less populated areas compared to those with dense or intermediate density [56]. The most rapidly growing less populated areas are located along the Atlantic coast, in regions like Aquitaine, and notably in Tarn-et-Garonne (82), Haute-Garonne (31), Hérault (34), and Gard (30), Bouches-du-Rhône (13), Var (83), and the two Corsican departments (2A and 2B), as well as in Ain (01), Isère (38), Drôme (26), and Haute-Savoie (74). Conversely, in 45 departments across central France, Normandy, and the northeast quarter, the population in dense or intermediate-density areas is either declining or stable. However, data presented in Table 1 and Figure 2 show that certain departments in France, such as Calvados (14), Somme (80), Doubs (25), Eure (27), Eure-et-Loir (28), Dordogne (24), Finistère (29), Loir-et-Cher (41), Lot (46), Lot-et-Garonne (47), Mayenne (53), Vienne (86), and Sarthe (72) have seen population increases, mainly in less densely populated areas. However, from 2007 to 2017, population declines were observed in seven departments, irrespective of density: Guadeloupe (971), Creuse (23), Orne (61), Haute-Marne (52), Indre (36), Nièvre (58), and Martinique (972), as INSEE reported [57]. Research indicates that traditional measures of population density may be too simplistic, as the number of people in an area can vary in the day, influenced by the diversity of neighborhoods and their intended purposes [58].

Table 1.
Density and Infections/Deaths * by COVID-19 per 100,000 Inhabitants in French “Departments” at the Peak of the Epidemic—Wave-3.
Table 1.
Density and Infections/Deaths * by COVID-19 per 100,000 Inhabitants in French “Departments” at the Peak of the Epidemic—Wave-3.
| Department | Density h/km2 | N° of Infections | N° of Deaths | Department | Density h/km2 | N° of Infections | N° of Deaths | Department | Density h/km2 | N° of Infections | N° of Deaths |
|---|---|---|---|---|---|---|---|---|---|---|---|
| Val-d’Oise (95) | 1133 | 861 | 1996 | Bas-Rhin (67) | 207 | 262 | 1691 | Deux Sèvres (79) | 65 | 308 | 253 |
| Seine Saint- Denis (93) | 7822 | 825 | 2416 | Haute-Rhin (68) | 204 | 203 | 1503 | Hautes-Pyrénées (65) | 65 | 180 | 202 |
| Val-de-Marne (94) | 7103 | 749 | 2947 | Hérqult (34) | 197 | 381 | 968 | Tarne (81) | 64 | 360 | 372 |
| Seine et Marne (77) | 319 | 736 | 2003 | Gironde (33) | 195 | 275 | 1031 | Lot-et-Garanne (47) | 63 | 195 | 180 |
| Paris (75) | 21,000 | 631 | 4438 | Morbihan (56) | 172 | 221 | 417 | Loir-et-Cher (41) | 62 | 333 | 327 |
| Essonne (91) | 956 | 634 | 1840 | Moselle (57) | 167 | 292 | 2387 | Côte-d’Or (21) | 62 | 264 | 924 |
| Oise (60) | 129 | 615 | 1345 | Ile-et-Vilaine (35) | 164 | 300 | 697 | Haute-Vienne (87) | 60 | 297 | 323 |
| Yvelines (78) | 774 | 590 | 1805 | Savoie (73) | 159 | 363 | 693 | Landes (40) | 57 | 104 | 237 |
| Nord (59) | 475 | 489 | 3756 | Meurthe-et-Moselle (54) | 158 | 365 | 1200 | Orne (61) | 56 | 273 | 351 |
| Bouches-du-Rhône (13) | 376 | 581 | 3560 | Haute-Garonne (31) | 155 | 288 | 797 | Mayenne (53) | 55 | 228 | 272 |
| Aube (10) | 71 | 567 | 429 | Finistère (29) | 154 | 91 | 259 | Tarne et- Caronne (82) | 54 | 275 | 219 |
| Hauts de Seine (92) | 10,866 | 544 | 2688 | Calvados (14) | 147 | 273 | 588 | Jura (39) | 53 | 370 | 480 |
| Rhône (69) | 573 | 550 | 3119 | Pyrénées-Orientales (66) | 138 | 323 | 321 | Ardennes (08) | 52 | 360 | 369 |
| Pas-de-Calais (62) | 217 | 519 | 1918 | Maine-et-Loire (49) | 134 | 332 | 703 | Vosges (88) | 52 | 331 | 847 |
| Doubs (25) | 97 | 488 | 512 | Loiret (45) | 128 | 326 | 636 | Aude (11) | 52 | 263 | 361 |
| Aisne (02) | 66 | 480 | 1095 | Côtes-d’armor (22) | 119 | 207 | 244 | Yonne (89) | 49 | 324 | 566 |
| Vaucluse (84) | 149 | 479 | 883 | Indre-et-Loire (37) | 117 | 367 | 489 | Dordogne (24) | 48 | 332 | 218 |
| Somme (80) | 72 | 478 | 919 | Pay-du-Drôme (63) | 109 | 296 | 739 | Haute-Corse (2B) | 47 | 140 | 88 |
| Var (83) | 220 | 465 | 1460 | Pyrénées-Atlantiques (64) | 105 | 111 | 475 | Haute-Saône (70) | 45 | 229 | 265 |
| Loire (42) | 27 | 460 | 1332 | Eure-et-Loire (28) | 96 | 381 | 503 | Ariège (09) | 42 | 227 | 1332 |
| Alpes-de-Hautes de Provence (04) | 27 | 458 | 247 | Charente-Maritime (17) | 94 | 179 | 319 | Cher (18) | 40 | 318 | 504 |
| The Alpes Maritimes (06) | 402 | 440 | 1517 | Vendée (85) | 91 | 308 | 286 | Aveyron (12) | 40 | 309 | 228 |
| Nièvre (58) | 38 | 439 | 322 | Sarthe (72) | 88 | 378 | 588 | Corrèze (19) | 40 | 273 | 216 |
| Gard (30) | 114 | 436 | 634 | Manche (50) | 84 | 250 | 364 | Indre (36) | 36 | 207 | 261 |
| Hautes-Alpes (05) | 29 | 434 | 253 | Drôme (26) | 81 | 320 | 767 | Lot (46) | 35 | 170 | 98 |
| Eure (27) | 98 | 426 | 479 | Ardèche (07) | 78 | 210 | 494 | Corse-du-Sud (2A) | 29 | 181 | 117 |
| Seine Maritime (76) | 191 | 422 | 1507 | Charente (16) | 70 | 233 | 159 | Creuse (23) | 28 | 71 | 97 |
| Isère (38) | 224 | 411 | 1746 | Saône-et-Loire (71) | 69 | 280 | 1097 | Meuse (55) | 27 | 365 | 380 |
| Ain (01) | 145 | 402 | 616 | Vienne (86) | 69 | 271 | 267 | Cantal (15) | 25 | 186 | 133 |
| Loire-Atlantique (44) | 202 | 277 | 827 | Marne (51) | 68 | 380 | 895 | Haut-Marne (52) | 25 | 365 | 366 |
| Haute-Savoie (74) | 258 | 258 | 1007 | Allier (03) | 68 | 267 | 580 | Gers (32) | 25 | 185 | 98 |
| Territoire de belfort (90) | 213 | 333 | 590 | Haute-Loire (43) | 66 | 345 | 251 | Gozère (48) | 19 | 273 | 118 |
Figure 2.
Spatial and social disparities of COVID-19 in French departments. (a) Infections at the peak of wave 3 (27 March–2 April 2021). (b) COVID-19 fatalities, total deaths from 24 March 2020 to the end of wave 3 on 30 May 2021, totaling 48,865 cases. (c) Population density in France in 2018. (d) Poverty rates in French departments in 2019. * France’s population density was 106 people per square kilometer in 2018. ** France’s poverty rate was 14.5% in 2020. Source: Author, using data from [59,61,62,63].

1.5. Poverty, Social Inequalities, and Spatial Disparities in France
This research assesses the impact of the poverty rate, a critical economic factor [64], on COVID-19 transmission and effects, exploring how economic disparities influence the spread and outcomes of the virus. By 2021, 47% of total household wealth was owned by the top 10% of households, an increase from 41% in 2010 [60]. Over 9.3 million people in France were considered poor, with 14.8% living below the monetary poverty line, set in 2018 at 60% of the median living standard of €1063 per month, and two million earning less than €700 monthly. The poverty rate rose by 0.7 points in 2018 compared to 2017 [65]. However, during the COVID-19 crisis in 2021, the poverty rate further increased by 0.9 points, from 13.6% to 14.5%. Concurrently, the intensity of poverty escalated, from 18.7% in 2020 to 20.2% in 2021 [57], and this indicates that inequality in France is on the rise. However, France’s poverty level is considered moderate relative to the EU, where the average poverty rate is 16.8%. Germany has a lower rate at 14.8%, while Italy is at 20.1%, Spain at 20.7%, and Romania has the highest EU average at 23.8% [57]. In France, over 200,000 individuals are homeless or live in inadequate housing, and nearly five million rely on food assistance. About 400,000 people live in poverty with unstable employment, and 30% of farmers earn less than €350 per month. INSEE’s data in (Figure 2c) reveal that poverty is more prevalent in densely populated areas, with 19% of the impoverished living in crowded communes, 15% in medium-density, 11% in low-density, and 14% in very sparsely populated municipalities [57]. Despite mandatory universal health care and social health insurance, France faces significant socio-economic disparities in accessibility to health services, particularly in rural areas.
This context lends support to the hypothesis that there is a correlation between poverty (people density, places, and health) and COVID-19 infections/deaths. In France, territorial disparities indicate (Figure 2d) that the poorest departments are predominantly located in the north, in central regions, along a significant portion of the Mediterranean coast, and in overseas departments. Conversely, the wealthiest households are situated in regions bordering Germany and Switzerland, as well as in most major agglomerations, where income disparities are more marked. France Strategy’s [66] report reveals that the northeastern quarter, including Hauts-de-France, Grand Est, and others, predominantly former industrial regions, are experiencing post-industrial struggles. Their Gross Domestic Product (GDP) per capita falls below the national average, Île-de-France excluded, with lagging job growth [66].
In contrast, regions like the Rhône valley, the Atlantic, and Mediterranean coasts exhibit strong dynamism, with GDP per capita and job growth surpassing the national average. However, Île-de-France, while hosting a substantial share of the population, jobs, and GDP, is experiencing a decline in demographic appeal. The contrasting circumstances highlight the widening gap between the affluent south and west and the struggling north, east, and center of France: (a) the north-eastern half of the country faces unfavorable developments; (b) many medium-sized cities and rural areas lack growth drivers; (c) the development of metropolises is marked by significant internal inequalities [66].
2. Methods and Materials
2.1. Methodologies
In the “theory of urban form”, spatiality aims to be understood through “quantitative methods” commonly employed in fields like urban planning, where “density” is an important element in urban form, and is often linked with infectious disease. Conversely, the “social theory of space”, reliant on “qualitative methods” from an urban sociology aspect, identifies poverty as a crucial indicator of social inequality [37].
From this perspective, this study is based on data related to COVID-19 infections and deaths, population density, poverty rates, and the spatiotemporal spread of the outbreak in France. Initially, the research covered all 96 French (départements), a level of administration in France situated between regions and “communes” and under the national level of territorial collectivities [57,60]. The study then focused on 92 departments, excluding those with extreme densities, to analyze the correlation between population density and COVID-19 infections/deaths. The research further examined the 25 most infected departments during France’s third COVID-19 wave (22 March–3 May 2021), which included the third national lockdown and was the most severe in terms of infections/deaths, compared to the first (31 March–11 May 2020) and the second wave (November–December 2020). The analysis utilized data from official sources, including the Ministry of Solidarity and Health (Ministère de solidarité et de la santé), the French Observation System, managed by Public Health France, Santé Publique France (SPF), and the Regional Health Agencies (RHA, Agences régionales de santé).
2.2. Data for COVID-19 Infections and Deaths
The primary data source for COVID-19 infections and deaths in France was gathered from the public open database portal of the Public Health France (Santé Publique France, SPF), including interactive spatial maps at the department level (https://geodes.santepubliquefrance.fr/#c=home, accessed on 22 March 2021 to 30 May 2021) [52,54,59]. The data published by SPF are the official and sole trusted source for COVID-19 infections and deaths in France, reported daily by the RHA. The incidence rate was determined as the cumulative number of COVID-19 infections/deaths per 100,000 inhabitants.
2.3. Population Density and Poverty Rates
As population density and poverty are linked to increased severity of disease [8,16,17,18,67], the population density and poverty rates for each department were obtained from the French National Statistics Institute (INSEE). This was based on the most recent data pertaining to poverty at the department level, published in 2017, and population density figures from 2018 [63].
2.4. Data Analysis and Variables
The conceptual framework of this study is underpinned by theoretical, empirical, and experimental methods, including quantitative analyses across various dimensions: (a) spatial (departments, population density); (b) social (poverty); and (c) temporal: infections and deaths (before, during, and after the third wave of COVID-19) to ascertain significant associations among diverse factors affecting the spread of COVID-19 and the impact of lockdown policies. The data were examined quantitively using the Statistical Package for the Social Sciences (SPSS version 29) to test hypotheses and establish the relationships among population density, poverty, and infection/death rates due to COVID-19 in departments to investigate social and spatial inequality across 29 more infected departments in France. Subsequently, to assess the effectiveness of lockdown policies (independent factor) and the frequency of COVID-19 infections/deaths (dependent factors) during the lockdown, the One-Way ANOVA test was used.
An experimental approach was employed at different spatial scales according to infection rates in different departments. The cumulative COVID-19 infections and deaths per 100,000 inhabitants were examined alongside the population density and poverty rate of 96, 92, and 25 departments in France, excluding five overseas departments due to their unique social and spatial contexts. The data were interpreted using the Pearson Coefficient, ranging from (−1 to +1), indicative of negative and positive correlation coefficients. A correlation value of 0 signifies no connection (zero link). Following the Rule of Thumb for interpreting the magnitude of a correlation coefficient, the strength of the correlation (whether negative or positive) is categorized as: (a) very strong if over 0.80; (b) strong if between 0.60–0.79; (c) moderate if between 0.40–0.59; (d) weak if between 0.20–0.39; or (e) very weak if under 0.20 [68]. Nevertheless, the Pearson Coefficient should not be viewed as definitive evidence of a relationship between variables; rather, it is utilized initially to investigate the correlation between social/spatial factors during a specific period of COVID-19 wave 3. Further spatial and visual analysis is required to draw more concrete conclusions about such correlations between different factors.
3. Results
3.1. Population Density and Infection/Death Correlation in 96 French Departments
The statistical analysis in Figure 3a,b and Table 2 reveals a moderate positive correlation between population density in 96 departments and the COVID-19 infection rate per 100,000 inhabitants, with an R2-value of 0.154 and an R-value of 0.39 (p-value < 0.001). However, the correlation between population density and deaths was moderately positive and stronger than that for infections, with an R2-value of 0.40, an R-value of 0.589 (p-value < 0.001). Additionally, the correlation between infections and deaths was positive and strong, with an R-value of 0.654 (p-value < 0.001). This indicates that departments with higher infection rates recorded a greater number of deaths, demonstrating a direct proportionality between infection/death rates. Remarkably, Table 1 shows that extreme data were observed in the departments of Paris (75), Seine-Saint-Denis (93), Val-de-Marne (94), and Hauts de Seine (92), reported very high population densities per square kilometer and the highest numbers of infections/deaths in the third wave of COVID-19 up to 3 May 2021, as follows:
- The Paris department (75) recorded the highest density in France at 21,000 inhabitants per square kilometer, where infections in the third wave reached 631 per 100,000 inhabitants, with deaths totaling 4438 by the end of the wave.
- Seine-Saint-Denis (93) noted France’s highest infection rate at 825 per 100,000 inhabitants and 2416 deaths per 100,000, with a density of 7822 inhabitants per square kilometer.
- Val-de-Marne (94), ranking third, reported 749 infections per 100,000 inhabitants, and 2947 deaths, despite having the lowest density in the Île-de-France region at 7103 inhabitants per square kilometer.
- Hauts de Seine (92), with the second highest density in France after Paris at 10,866 inhabitants per square kilometer, recorded the lowest infection number per 100,000 inhabitants in the Île-de-France region at 544, alongside 2688 deaths.
- Bordering departments such as Nord (59), second only to Paris (75) in death numbers at 3756, followed by Bouches-du-Rhône (13) with 3560 deaths, show contrasting data given their densities of 475 for the first, and 376 inhabitants per square kilometer for the second. Even the number of infections per 100,000 inhabitants was lower than Paris, 489 for Nord (59), and 581 for Boches-du-Rhône (13).
These incongruent data necessitate further detailed analysis. Hence, four departments were excluded with extreme density values over 1000 inhabitants per square kilometer: Paris (75), Seine-Saint-Denis (93), Val-de-Marne (94), and Hauts de Seine (92).
3.2. Population Density and Infection/Death Correlation in 92 French Departments
Overall, Figure 3c,d reveal a strong positive correlation between population density and infections in the 92 departments at the peak of the third wave, with an R2-value of 0.401 and an R-value of 0.633 (p-value < 0.001). Departments with high density were more likely to report increased infections. Moreover, the correlation between population density and deaths in these 92 departments was strongly positive, with an R2-value of 0.482 and an R-value of 0.695, exceeding the infection/density correlation (p-value < 0.001). The data indicate that deaths exceeded 1000 per 100,000 inhabitants in these departments, with the density/death correlation (R = 0.695) being stronger than the density/infections correlation (R = 0.633) (p-value < 0.001). Particularly, the likelihood of deaths was higher in denser departments, influenced by factors such as age, healthcare availability, lifestyle, social interactions, and socio-economic conditions. These patterns statistically confirm that the densest departments had the highest rates of infections and deaths.
However, as shown in Table 1, not all departments aligned with this trend. Some with relatively low density (below 250–300 inhabitants per square kilometer) reported high infection rates (over 400 per 100,000 inhabitants) and a significant number of deaths (exceeding 1000). The departments falling into this category include Aisne (02), density (66 h/km2), infections (480/100,000 h), deaths (1517); Loire (42): density (27 h/km2), infections (460), deaths (1332); Isère (38), density (224 h/km2), infections (411), deaths (1746); Haute-Savoie (74) density (258 h/km2), infections (258), and deaths (1007); Bas-Rhin (67), density (207 h/km2), infections (262), and deaths (1691); Moselle (57), density (167 h/km2), infections (292), and deaths (2387); Saône-et-Loire (71), density (69 h/km2), infections (280), and deaths (1097); and Ariège (09), density (42 h/km2), infections (227), and deaths (1332). Additionally, to further understand the correlation between density and COVID-19 infections, the study focused on the 25 departments with more than 400 infections per 100,000 inhabitants, again excluding the four departments with extremely high densities over 1000 inhabitants per square kilometer: Paris (75), Seine-Saint-Denis (93), Val-de-Marne (94), and Hauts de Seine (92).
3.3. Population Density and Infection/Death Correlation in 25 French Departments
The analysis revealed a strong positive correlation between density and infections in the 25 most affected departments, with a p-value < 0.001, an R2-value of 0.513, and an R-value of 0.716. Similarly, the correlation between density and deaths was also strongly positive, with an R2-value of 0.415, an R-value of 0.644, and a p-value < 0.001. In this detailed examination, it is evident that the correlation between density and infection was stronger than that between density and deaths (0.716 > 0.644) in these 25 regions. This suggests that denser areas may have offered better healthcare services and more opportunities for remote work in certain areas. However, it also implies that other factors may have contributed to the spread of COVID-19, influencing infection and death rates. Consequently, further analysis was undertaken to explore the correlation between poverty and COVID-19 infections/deaths.
3.4. Poverty and Infection/Death Correlation in French Departments
The statistical analysis in Table 2 reveals significant positive correlations between poverty and COVID-19 infections across the 96 departments, with an R2-value of 0.267, an R-value of 0.516, and a p-value of 0.009 < 0.001. Furthermore, the correlation between poverty and deaths in these 96 departments was also positive and less than the poverty/infection correlation, with an R2-value of 0.197, an R-value of 0.443, and a p-value of 0.055 < 0.001. This indicates a concentration of COVID-19 infections in poorer departments. However, in the 92 departments, the results varied. The correlation between poverty and infections was positive but weak, with an R2-value of 0.135, an R-value of 0.367, and a non-significant p-value of 0.198 > 0.001. Similarly, the correlation between poverty and deaths in these 92 departments was weakly positive, with an R2-value of 0.136, an R-value of 0.368, and a non-significant p-value of 0.197 > 0.001.
Furthermore, testing in the 25 most infected departments revealed a weakly negative, non-significant correlation between poverty and infection, with an R-value of −0.04 and a p-value of 0.850 > 0.001. Similarly, the correlation between poverty and deaths showed an R-value of 0.397 and a p-value of 0.452 > 0.001. These statistical results highlight their limitations and obscure territorial disparities. Consequently, visual tools were utilized to illustrate spatial disparities among the departments and the correlation between social and spatial analysis.
3.5. Evidence of Spatial and Social Inequality in French Departments
Figure 2 highlights spatial and social disparities among departments, as follows:
- (a)
- The first group with low density demonstrates that some areas, despite having low density, reported high infection rates (over 400 infections per 100,000 inhabitants with more than 1000 deaths) but also recorded high poverty levels. For example, in the Aisne (02) department, 18.5% of the population lives below the national poverty line set at 14.6%. Similar results were observed in Pas-de-Calais (62), where the poverty rate reaches 19.30%, despite relatively low density (72 inhabitants per square kilometer for the first and 217 for the second). A comparable situation exists in the Var (83) department, where 18.3% are below the poverty line, and the death count is relatively high at 1332, despite a low density of about 220 inhabitants per square kilometer.
- (b)
- The second group with low poverty rates highlights some dense departments, like Hauts de Seine (92) in Île-de-France. Here, poverty stands at 11.80%, below the national average, while the density is high at 10,866 inhabitants per square kilometer. The department recorded 2688 deaths, despite a high infection rate of 544 cases per 100,000 inhabitants. However, the number of deaths were relatively high in relation to the infections rate.
- (c)
- The third group, combining high population density and high poverty percentage, illustrates extreme cases, as seen in Seine-Saint-Denis (93). Here, the density is 7822 inhabitants per square kilometer, and 27.90% of the population is under the poverty line, nearly double the national average. In this department, north of Paris, some of the highest infection rates were recorded at 825 cases per 100,000 inhabitants, along with 2416 deaths.
The department of Seine-Saint-Denis (93) faces multiple challenges, including: (1) institutional shortcomings, heightening its susceptibility to the impacts of geographical, demographic, and economic factors; (2) a volatile demographic and social landscape marked by a concentration of often inactive youth, susceptible to delinquency or drug trafficking; and (3) a foreign population exceeding 50%, where the cohabitation of diverse ethnic and religious communities can lead to tensions [69]. As depicted in (Figure 2a–d), higher infection rates were notably prevalent in departments where poverty surpassed the national average (14.6%), such as Seine-Saint-Denis (93), with 27.9%, Val d’Oise (95) with 15.4%, Val-de-Marne (94) with 16.6%, Pas-de-Calais (62) with 19.3%, among others. This trend of increased infections/deaths in areas with significant poverty was also evident in the northern and southeastern regions of France.
3.6. Impact of Lockdown Policies on Infection/Death Correlation in 29 Departments
To assess the effect of lockdown policies on reducing COVID-19 infections, 29 departments were selected with infection rates exceeding 400 per 100,000 inhabitants, and a One-Way ANOVA test was conducted. This analysis affirmed the effectiveness of lockdown measures during the health crisis in these highly infected departments. As indicated in Table 3, four phases were identified for infection rates (before the peak, during the peak, lockdown period, and end of lockdown).
As showed in Table 4, the influence of the lockdown during the third wave (27 March to 27 April 2021) was significant, with the mean difference between the peak and lockdown being −110.655 < 0.001, and during the fourth phase between the peak and end of lockdown at −282.310 < 0.001. Additionally, Figure 4 illustrates a marked decrease in average infections from 538 to 255 (51.7%) after three weeks of lockdown. These findings are significant for this sample and can be extrapolated to national and international contexts in similar health crises.
In terms of the effectiveness of preventive measures, the number of infections decreased rapidly during the first week of the lockdown period, with infections falling below 400 per 100,000 inhabitants in 14 departments. However, when assessing the success of preventive efforts, it is notable that Paris (75), Nord (59), and Bouches-du-Rhône (13) had the highest number of infections/deaths (Table 3). Additionally, departments with medium population density (262–280 inhabitants per square kilometer) experienced a high number of deaths, exceeding 1000 per 100,000 inhabitants. Examples include Bas-Rhin (67), Haute-Rhin (68), and Gironde (33), among others (Table 1). These findings warrant further investigation into socio-economic factors such as the age of the population, healthcare accessibility, and employment rates. During the lockdown period, when direct social interactions were minimized (e.g., work, commerce, schools, universities, transportation, etc.), the number of infections decreased rapidly, and the correlation coefficient increased accordingly. This underscores the importance of implementing lockdown measures promptly to effectively curb the spread of COVID-19 for similar pandemics in the future.
4. Discussion
The ongoing COVID-19 pandemic has undeniably reshaped our understanding of urban social sustainability, and social and spatial inequalities within cities and across regions. This discussion critically evaluates the relationship between COVID-19’s spread in French regions and underlying socio-spatial inequalities, emphasizing the theoretical operational frameworks and empirical results that have guided our study.
4.1. Prioritizing Social and Spatial Inequality
The discourse on social and spatial inequality in urban contexts has evolved into rich theories and empirical investigations, highlighting the complex interplay between social justice and urban spatial shapes. Despite early recognitions by Harvey (1973) of the city as a complex entity that defies simple disciplinary categorization [23], the integration of social justice into spatial analysis remains in progress. Harvey calls for a multidisciplinary approach addressing the complexities of urban systems. The emphasis on normative thinking in spatial analysis, as discussed by Harvey, points to a significant gap in incorporating social justice into urban planning practices. This gap is further explored by Leven, who suggests that cities have been more of a theoretical testing ground rather than subjects of study aimed at addressing social inequalities [24]. The potential of urban environments to foster social qualities, equitable access, and fair service distribution, as highlighted by Yiftachel and Hedgcock [26], introduces a critical perspective on the role of cities in achieving social equity. Kay’s notion of “territorial justice” [27] and Piketty’s analysis of the interconnections between capitalist dynamics, inequality, and social sustainability [28] contribute to a broader understanding of spatial justice. This understanding is crucial for addressing the contemporary challenges of poverty, inequality, and the pursuit of social sustainability as outlined by Vallance et al. [29]. Bramley et al.’s identification of social equity and community sustainability as core dimensions of social sustainability enriches this discourse of the social responsibilities inherent in urban and regional planning [30]. The exploration of social sustainability’s spatial dimension across diverse fields indicates a growing acknowledgment of the importance of urban form and density in shaping socially sustainable cities and regions [30,31]. This multidisciplinary engagement reflects the complexity of social and spatial inequality issues, necessitating a broad spectrum of knowledge from natural to social sciences. However, the challenge of developing effective evaluation methods for social sustainability [35] points to an ongoing need for innovative approaches to measure and understand the spatial dimensions of “social sustainability”. The distinction between “hard” and “soft” qualities introduced by Shields [36], and further developed by Shirazi and Keivani [37], underscores the potential for a more holistic understanding of urban spaces through the integration of theoretical and empirical perspectives on spatiality for advancing towards social, equitable, and sustainable urban futures.
4.2. Population Density and Sustainability Challenges
The relationship between population density and the spread of COVID-19 has become a focal point in urban studies, particularly considering the recent pandemic. Historically, urban density has been both vilified and valorized, depicted as a source of problems as well as a solution to urban sustainability and economic growth [38]. McFarlane’s observation on urban densities is lacking, and points to a significant gap in our understanding of density’s multifaceted impacts [38]. The theory that population density is a critical factor in the spread of epidemics is supported by the spatial urban global dialectic, which links intensive urbanization and its associated high density to the emergence of infectious diseases [39,40,41]. However, the association between urban density and the transmission of COVID-19 is complex and not uniformly observed across different studies. While some research identifies a positive correlation between population density and COVID-19 infection rates [43,44], others find no significant link [8,45] or even suggest that economic, social, and transport connections play a more crucial role than density itself [47]. Carozzi et al.’s findings challenge the assumption that higher density, through increased connectivity, necessarily leads to higher infection and death rates, suggesting instead that compact cities with robust healthcare systems might see an inverse relationship between mortality and density [48].
However, findings on the relationship between population density’s impact on COVID-19 infection and mortality rates across French departments offer insightful observations about the pandemic’s dynamics. The research delineates a strong correlation between population density and the incidence of COVID-19 infections across various French departments (Table 2), with R-values of 0.393, 0.633, and 0.716 for 96, 92, and 25 departments, respectively. This relationship intensifies in areas with higher density, particularly noted in the 25 most affected departments, where the correlation surged (R-value of 0.716), underscoring that regions with dense populations witnessed a significant rise in COVID-19 cases. Conversely, the link between population density and mortality demonstrated strong significance across the departments, with R-values being 0.589, 0.695, and 0.644 for the 96, 92, and 25 departments accordingly. The correlation exhibited variation, which was notably less pronounced in the 25 hardest-hit departments, yet considerably strong in the remaining 92. The results indicate a significant correlation between population density and COVID-19 deaths in 92 departments (R = 0.695), which is stronger than the correlation between density and infection rates (R = 0.633). This pattern suggests that COVID-19 infections and fatalities were not solely concentrated in the most densely populated areas but also in regions of lower density, excluding those at the extremes. This finding aligns with Boterman’s [70] comparative analysis in the Netherlands, which highlighted the varied influences on the pandemic’s spread. Boterman found a stronger correlation between population density and mortality than between density and infection rates, indicating a greater risk of both in densely populated areas with confirmed cases. Furthermore, the above findings align with AW et al.’s [71] results focused on Malaysia, in which they found that 40% of cumulative COVID-19 cases could be attributed to differences in population density. The correlation between density and infections with a coefficient of an R-value 0.644 aligns closely with our findings of an R-value of 0.633 for the 92 departments. This reinforced the critical role of population density in predicting COVID-19 infections. These insights prompt a reevaluation of the sustainability of compact urban models and the necessity for post-pandemic urban policy to bolster resilience, echoing concerns previously highlighted by Wolf [21].
Furthermore, urban density’s impact on physical activity levels, with residents in lower-density areas experiencing less reduction in activity during the pandemic, adds another layer to the debate. These findings illuminate the complex relationship between urban density and pandemic dynamics, underscoring the necessity for multi-faceted public health strategies that consider demographic, economic, and social factors alongside urban planning to effectively combat future pandemics. The deviation in expected outcomes across various densities accentuates the importance of localized, tailored responses to pandemic management, highlighting the critical need for comprehensive data analysis in informing public health policies and interventions. As urban planners and policymakers navigate the post-COVID-19 world, these insights call for integrated strategies that address urban density’s challenges while leveraging its potential benefits from a sustainability perspective. This discussion aims to contribute to a more comprehensive understanding of urban planning that anticipates and mitigates the risks associated with future pandemics.
4.3. Department Size and Accessibility to Health Services: A Policy Dilemma and the Need for a New Social Contract
The second set of empirical findings revealed strong associations among higher rates of COVID-19 infections, mortality, and the size of the department, as well as the efficiency and availability of health services. The regions most susceptible to COVID-19 are situated in larger departments that are interconnected through economic, social, and commuting interactions. These results are inconsistent with the findings of Hamidi et al. [47], Gaudrat et al. [20], and Wang et al. [72], which suggested that countries with higher population density tended to have lower death rates, likely due to their higher level of development, including more advanced healthcare systems. Nonetheless, our research also highlighted a paradox where smaller, less densely populated departments showed reduced levels of development and limited access to healthcare facilities. Despite their lower population density, these regions experienced higher rates of infections and deaths, a phenomenon linked to socio-economic factors, and also to urban and regional systems. The data in Table 1 show that departments with relatively low density such as Loire (42): density (27 h/km2), infection rate (460/100.000 inhabitant), with high deaths (1332). Similar scenarios were noted in Aisne (02); Isère (38); Haute-Savoie (74); Bas-Rhin (67); Moselle (57); Saône-et-Loire (71); and Ariège (09). Meanwhile, in other departments with elevated density levels such as Paris (75) and Île-de-France (regions around Paris), the highest levels of infections and deaths were recorded. In Paris, where density has surged to 21,000 inhabitants per square kilometer, the highest number of deaths was recorded, with 4438 deaths by COVID-19. This pattern is mirrored in other high-density departments (7822 inhabitants per square kilometer) and 2416 deaths, such as Seine-Saint-Denis (93). These findings starkly illustrate spatial and social inequalities, highlighting the shortage of healthcare services in densely populated areas and the lack of such services in marginalized and low-density departments. For this reason, the correlation between population density and COVID-19 deaths in 92 departments (R = 0.695) was stronger than the correlation between density and infection rates (R = 0.633, p < 0.001). The findings underscore the presence of profound social and spatial inequality in urban networks across French regions—a concern echoed by Olmo et al., [73] for Southern European regions, demanding attention at local, regional, and national levels.
However, the map of medical practitioners across France presents an extremely contrasting landscape. Some areas are very well served, while others are completely neglected. The outcome is inequality in access to healthcare, with potentially serious health consequences and an increased number of deaths during the COVID-19 pandemic in some regions more than others. According to the Association of Rural Mayors of France, citizens living in so-called “hyper-rural” departments live on average two years less than those in “hyper-urban” departments [74]. This situation has several well-identified causes. The first is the “numerus clausus”. Established by law in 1971, its aim was to limit the number of new doctors created each year based on an idea that seems somewhat unbearable when expressed today: “The fewer doctors there are, the fewer prescriptions there will be to be reimbursed”. In urban areas as well, “medical deserts” can be found in many regions such as in Île-de-France, were 62% is a “medical desert” [75]. The situation is even more critical in Seine-Saint-Denis (93), where 92% of the department is underserved by medical doctors [75].
This scenario underscores a policy dilemma and a profound clash between economic and social agendas. The objective is to mitigate the financial burden on the government, given France’s establishment of the “general social security system” after World War II in 1945. Its principle is “from each one according to their ability, to each one according to their needs “[74]. Conferring to the French Court of Auditors, despite the government’s promises to restore balance, the Social Security deficit was projected to reach around €5.4 billion in 2019. Due to the COVID-19 crisis in France in 2020, the “Social Security” deficit is expected to rise to €41 billion, surpassing the previous record of €28 billion in 2010 [76]. The deficiency of medical services in poor, densely populated departments, coupled with inadequate access to medical facilities in low density and poor ones, may explain why COVID-19 mortality rates in France were elevated and increased more rapidly compared to other nations. This delicate situation calls for a new “social contract” to ensure social equity both vertically (socially) and horizontally (spatially) in France. A political discourse and philosophical reflections on the essence of societal life are recommended for the post-pandemic world to tackle the complexities of contemporary society [77] in a new social contract which responds to new challenges of communities. Alexander et al. [78] posed the question of a “social contract within public health”, and asked whether healthcare is considered as a privilege or a right. Such questions related to social contracts were not addressed in Harvey’s [23] and Leven’s [24] earlier works. However, an interdisciplinary approach supports the achievement of social and spatial justice, which also requires a strong political will to respond to new requirements of societies.
4.4. Correlation between Poverty, Infections, and Deaths: Limitation of Statistical Results
This study critically examines the interrelations among poverty, social inequalities, and spatial disparities from one department to another, and their cumulative effect on the transmission of COVID-19 in France. The escalation of economic disparities [65] and the rise in poverty rates during the pandemic [57,62] highlight a deepening divide in France as it grapples with significant socio-economic challenges. The statistical findings underscore a significant correlation between poverty and COVID-19 infections/deaths across French departments. Notably, while a strong positive correlation was identified across 96 departments, with an R-value of 0.516, stronger than the poverty and death correlation, with an R-value of 0.443. These findings prove the concentration of COVID-19 cases in poorer departments. However, the relationship appears weaker when examining subsets of 92 and 25 departments, suggesting nuanced dynamics (Table 2). This variance hints at the complexity of poverty’s impact on pandemic outcomes, transcending simple causation to include a spectrum of socio-economic and spatial factors. However, spatial analysis reveals critical insights into the spatial distribution of poverty and its correlation with COVID-19 metrics. Departments with lower density but higher poverty rates, such as Aisne (02) and Pas-de-Calais (62), reported significant infection rates and fatalities, and a high population poverty rate (19.3%), challenging assumptions that density alone dictates pandemic spread (Figure 2a–d). Conversely, densely populated areas with lower poverty rates, like Hauts de Seine (92), also experienced high infection and death rates, further complicating the relationships among population density, poverty, and health outcomes. Particularly alarming is the situation in Seine-Saint-Denis (93), which combines high population density 7822 inhabitants per square kilometer) and a high population poverty rate (27.90%), nearly double the national average. In this department, north of Paris, some of the highest infections rates were recorded at 825 cases per 100,000 inhabitants, along with 2416 deaths. This department’s struggle, marked by institutional shortcomings and a volatile demographic landscape [69], underscores the multifaceted nature of pandemic vulnerability, where socio-economic disadvantages amplify health risks. The results highlight a significant correlation between higher poverty percentages in departments and increased infection rates, a finding that is consistent with research conducted in France by Brandily et al. [79]. Regions with higher poverty levels often have more jobs that require close contact, and they face additional challenges such as poor housing, air pollution, limited healthcare access, and a higher elderly population. These findings align with several studies that emphasize how low-density, small urban and rural areas tend to have higher poverty rates due to limited local resources and the inability of local governments to meet urban infrastructure and healthcare needs in such regions [80,81,82,83,84]. Furthermore, Cattell [85] has affirmed that poor people are in poor areas and have poor health. Additionally, Kapitsinis [86] has reported that in economically poorer European regions, COVID-19 mortality rates have generally been higher. Similar results were reported by Siddique et al. [64], where mortality rates were higher in poorer regions of the United States. These findings underscore policymakers’ attention to achieving balanced and equitable socio-economic development at the local and national levels.
4.5. Successful Lockdowns Mitigate COVID-19 Transmission
This study sheds light on the efficacy of lockdown measures in mitigating COVID-19 transmission and fatalities across 29 highly affected French departments. The analysis revealed a substantial mean difference in infection rates from the peak to the lockdown phase and from the peak to the post-lockdown phase, indicating a 51.7% reduction in average infections three weeks into the lockdown. The study also highlights a rapid decline in infections during the first week of lockdown, particularly in departments with medium population density, underscoring the critical role of social interaction in controlling the spread of the virus. The results corroborate the international research findings of Salje et al. [87] and Di Domenico et al. [88]. These studies reported a significant decrease in the reproductive number of COVID-19 due to lockdowns, with reductions of 77% in France and 81% in the Île-de-France region. These results are also consistent with the findings of Islam et al. [89] across 149 countries. However, the impact of COVID-19 on health inequalities will extend beyond virus-related infection and mortality, encompassing the health consequences of policy responses implemented in many countries. Lockdowns lead to disparate health effects, influenced by job and income loss, overcrowding, urban living, limited access to green areas, and key worker roles. These impacts are compounded by shifts in the social determinants of health, notably reduced access to non-COVID healthcare and direct lockdown consequences on mental health and gender-based violence as confirmed by Bambra et al. [18]. This discussion underlines the importance of prompt and compliant implementation of lockdown measures in densely populated and highly interactive areas to curb the spread of COVID-19 effectively. It also calls for further research into the socio-economic factors that modulate the effectiveness of such interventions, advocating for holistic pandemic response strategies and social consequences of lockdown policies.
4.6. Towards a New Urban and Regional Paradigm
The COVID-19 crisis has underscored the critical necessity to reshape urban policies towards creating cities that are more resilient, green, and inclusive, under the collective responsibility of communities and governments. The pandemic has significantly impacted the health, livelihoods, and employment of city residents, amplifying existing urban and spatial challenges like poverty and inequality. The findings of this study demonstrate that the COVID-19 outbreak has exposed existing spatial and social disparities and inequalities in cities and regions, thereby increasing the virus’ danger. These results are compatible with the study by Bouchet and Duvoux in which they emphasize the insufficient acknowledgement of community support during difficult times. Furthermore, the COVID-19 outbreak has not only worsened socio-economic conditions in France, but it has also revealed structural, long-term aspects of poverty [90].
In conclusion, the COVID-19 crisis has shown the fragility of some urban systems. As a result, a new urban and regional paradigm is needed to assess the quantity and quality of sectoral and spatial sustainable balanced development at local, regional, and global levels to ensure a higher quality of life through innovative methods. This pandemic has shifted societies towards new methods and techniques of work requiring fewer social interactions, such as telework (working from home), e-learning, and the digitization of societies, along with the transformation of urban cultures into digital ones within the “smart cities” concept. However, these new concepts are not available for everyone; the COVID-19 pandemic precipitated both poverty and other forms of deprivation, social exclusion, and a lack of institutional support [90]. These rapid social and cultural changes pose new challenges, prompting new research topics in various sectors, as well as good governance and balanced development between urban and rural areas, food security, and climate change issues. Consequently, it has catalyzed discussions on reimagining and revitalizing cities to foster sustainable development and equitable opportunities for everyone [91]. Drawing from city strategy insights and informed by the COVID-19 experience, the OECD proposed a holistic and integrated approach entitled “Policy Recommendation” for all government levels to collaboratively enhance cities’ resilience and recovery based on social, spatial, economic, environmental, technological, and governance interventions [92]:
- (a)
- Inclusive Cities
Cities should offer opportunities for everyone, and governments should enhance social and community services for disadvantaged groups, including healthcare and home care for the elderly and homeless, through social innovation strategies and repurposing empty buildings. Tailored employment programs should address the evolving needs of the local labor market post-crisis, alongside measures to improve housing and promote social cohesion. Enhancing soft mobility and ensuring equitable access to quality education, particularly through online platforms are critical for supporting low-income youth and fostering collaborative ties among educational institutions, businesses, and civil society.
- (b)
- Green Cities
To transition towards low-carbon economies, addressing urban congestion and air pollution through reduced private car use and promoting multimodal transport are paramount. Forward-looking spatial planning should prioritize climate-resilient and low-carbon infrastructure, such as green buildings and renewable energy initiatives, alongside encouraging sustainable consumption patterns through circular economy principles. Climate mitigation and adaptation should be integral to recovery investments, with special attention paid to green projects and support offered to vulnerable groups affected by transition policies.
- (c)
- Smart Cities
The advancement of smart cities should focus on making new technology in public transport inclusive and sustainable. Regulation of the sharing and gig economy is needed to ensure employment security and protect workers, while the push for digitalization aims to enhance the efficiency and inclusivity of local public services. Governments should also support cities in leveraging public procurement for innovation, to adopt technology-driven solutions.
- (d)
- Good Governance
Effective governance is key to implementing these strategies, requiring agile and flexible models that prioritize residents’ interests and resilience. Coordination across government levels and a functional approach to metropolitan policy action are essential for tailoring strategies to diverse urban scales. Engaging citizens in decision-making, fostering public-private partnerships, and promoting open government initiatives are vital for transparent and accountable governance. Moreover, strategic management and innovation capabilities among local officials are crucial for tackling complex urban challenges.
- (e)
- Financial Resources
Adequate funding is essential for realizing these urban visions, including innovative financial mechanisms like sustainability bonds for urban development. Governments should explore contingency funds and encourage private sector funding, particularly for Small and Medium Enterprises (SMEs), to develop business continuity plans that include health crisis considerations. Participatory budgeting allows citizens to influence public spending decisions, supporting programs that pursue inclusive objectives.
Based on this perspective (Figure 5), OECD developed an urban policy with a bottom-up process, based on three main pillars: Scale, Strategy, and Stakeholders, and 11 principles. The OECD’s urban policy principles provide a strategic approach for developing smart, sustainable, and inclusive cities. These principles revolve around the “3S” framework according to following:
- -
- (S1) Effective scale and policy action based on: (1) Empower cities of all sizes to contribute to prosperity and well-being. (2) Customize policies to local living and working environments. (3) Promote urban–rural collaboration and support.
- -
- (S2) Integrated strategy for inclusive, smart, and green cities: (4) Set forward-looking national urban policies for upcoming challenges. (5) Utilize the urban potential of cities of all sizes to enhance environmental sustainability and transition to a low carbon and greener economy. (6) Create inclusive cities of all sizes with opportunities for everyone. (7) Implement an integrated urban policy framework to coordinate sectoral policies for holistic development. (8) Ensure ample funding for urban policy execution at all government levels.
- -
- (S3) Stakeholder Engagement: (9) Involve stakeholders in urban policy design and implementation. (10) Boost the innovation and efficiency of urban actors. (11) Maintain continuous urban policy evaluation and governance accountability.
The COVID-19 crisis has accelerated the shift towards a new urban and regional paradigm centered on inclusive, green, smart cities [91]. This new urban and regional paradigm proposed by the OECD will guide policymakers through the complexities of urban growth, ensuring that cities advance in technology, environmental stewardship, and inclusivity. As confirmed by Stratigea [93] in her study, “smart cities” encompass various aspects of modern living, including healthcare systems, public services, and social services. However, what people require today is “Human and Healthy Smart Cities”—cities that guarantee the ecologic, social, and economic well-being of all residents and are resilient enough to confront future epidemics. This new concept needs an interdisciplinary approach, as recommended by Harvey in 1973, to bridge “social imagination” and “spatial consciousness” [23]. Therefore, achieving social justice should not be confined to the “vertical dimension” in sociological approaches and law; it should also encompass the “horizontal dimension” at the spatial level in urban and regional planning to explore the “social dimension” of cities and regions. However, the key question today is how “smart cities” can respond to poor people and assure social equality at vertical and horizontal levels. How can cities and regions face future pandemics, particularly those with high population densities? How can the future of cities and regions be shaped to confront health crises and epidemics effectively, to ensure human prosperity and social justice, and the transition from low to Net Zero Carbon Cities (NZCCs) by 2050 [94,95]? What is the new potential for net-zero spatial planning in the fabric of cities and regions?
5. Conclusions
In concluding this investigation into social and spatial inequalities during the COVID-19 pandemic within France, it becomes evident that the pandemic not only exacerbated existing disparities but also highlighted the urgent need for a transformative approach towards a new urban and regional paradigm. This study, through its rigorous exploration of socio-spatial dynamics, reveals a multifaceted landscape of inequality that challenges the resilience of cities and regions against such global crises.
The discussion on social and spatial inequalities [23,24,26,27,28,29,30,35,36] has underscored the necessity for an interdisciplinary approach to urban planning and policy-making that integrates social justice at its core. The empirical findings regarding the relationship between population density and COVID-19 spread within French departments emphasize the complex interplay between urban form, healthcare access, and socio-economic factors and highlighted the need for a new “social contract” to ensure social equity both vertically (socially) and horizontally (spatially) for all (people, cities, and regions). These findings challenge traditional paradigms and call for a nuanced understanding of density’s role in urban sustainability and resilience against pandemics. Meanwhile, concerns were raised by the World Economic Forum (WEF) in 2024, where social issues were ranked among the Top Ten Global Risks in terms of severity in the short, medium, and long term [96]. It was based on “societal polarization”, encompassing deficiencies in infrastructure and services, inadequate economic opportunities, unemployment, and the prevalence of infectious diseases. However, spatial and social analyses uncover certain drawbacks of extreme density.
Moreover, the insights into department size and healthcare accessibility illustrate a profound policy dilemma where the inadequacy of healthcare services in both densely populated and rural areas amplifies the risk and impact of the pandemic. This scenario necessitates a reevaluation of healthcare distribution and accessibility across urban and regional networks to mitigate future health crises effectively. The study’s examination of the correlation between poverty, infections, and deaths further highlights the significant yet nuanced dynamics between socio-economic disparities and pandemic outcomes. This analysis reaffirms the critical need for policies that address the root causes of inequality to enhance the resilience of vulnerable communities against health emergencies.
The responses of cities and regions to the COVID-19 pandemic and the lessons learned from French experience for future urban resilience and recovery strategies highlight the critical role cities have played in navigating through the crisis. It underscores the importance of place-based, people-centered approaches to addressing the asymmetrical impacts of the pandemic across different territories [91]. The efficacy of lockdown measures demonstrates the potential of timely and compliant interventions in controlling virus spread and saving millions of lives [97]. Additionally, the rise of automated labor in industrialized nations has affected health due to reduced physical activity and increased stress, weakening immune systems [72]. However, the broader implications of such measures on health inequalities and the socio-economic landscape underscore the importance of holistic and inclusive pandemic response strategies. Enhancing local and global health governance could be achieved by focusing more on the roles and potential of populations, local authorities, and metropolitan governance, as also confirmed by Ali and Keil [39]. Drawing from the OECD’s policy recommendations, this study advocates for a new urban and regional development paradigm that is inclusive, green, and smart [91], but it should be human in the first degree.
Fortunately, the COVID-19 crisis presents an unparalleled opportunity to rethink and reshape our urban systems to be more resilient, equitable, and sustainable at spatial levels. The recovery and resilience planning must also intertwine with global agendas and commitments such as the SDGs [10], the New Urban Agenda [6], and Net Carbon Zero Cities approaches [94,95], to ensure that cities can not only recover from this crisis but also be better prepared for the future. However, at social levels, “social contract” theories play a dual role: they both fuel political discourse and serve as philosophical reflections on the essence of societal life. To develop a social contract for the post-pandemic world that tackles poverty and inequality within the complexities of contemporary society, a solid methodological foundation is essential [77].
The new social contract is foundational to society. The WEF and Davos Agenda in 2022 confirmed that “[t]he social contracts on which society is currently based largely emerged in the post-war era and are no longer fit for purpose” [98]. Based on COVID’s lessons, we need a new social contract for fairer prosperity, embracing principles like stakeholder capitalism, skill development, economic security, and a shift to net zero. These contracts represent agreements between governments and citizens on mutual rights and duties, but the current contracts, rooted in the post-war era, no longer serve us well [96]. The emphasis on digital tools, citizen engagement, support for local businesses, affordable housing, and vulnerable populations indicates a comprehensive approach towards building cities that are not only economically resilient but also socio-spatially inclusive and environmentally sustainable.
In conclusion, this research underscores the imperative need for a new social contract for a new sustainable urban and regional development paradigm shift, integrating economic, social, environmental, technological, spatial, and political systems. Leveraging public participation, good governance and adequate financial resources will be crucial in transforming these visions into reality. This shift aims to ensure swift recovery, enhanced well-being, and the achievement of the Sustainable Development Goals by 2030.
6. Study Limitations
This research presents certain constraints. Our focus was solely on examining the relationship between COVID-19 infections/deaths and certain urban and spatial factors (such as population density and poverty) at the departmental level, and the impact of lockdown policies for decreasing the infection and death cases. At the time of the study, data at the city level were not accessible, and fieldwork was not possible because of strict lockdown policies applied in France and high rates of infections and deaths. However, the availability of data related to infections/deaths by COVID-19 on the official websites permitted us to complete this study. Studying all economic and social factors was not possible, because this kind of data was not available at that time, and we needed financial support, which was not available.
Funding
This research received no external funding.
Institutional Review Board Statement
Not applicable.
Informed Consent Statement
Not applicable.
Data Availability Statement
Data available upon request.
Acknowledgments
Thanks to the French authority INSEE, SPF and WHO for public data.
Conflicts of Interest
The author declares no conflict of interest.
References
- World Health Organization. Novel Coronavirus (2019-nCoV): Situation Report, 11; WHO: Geneva, Switzerland, 2020; Available online: https://apps.who.int/iris/bitstream/handle/10665/330776/nCoVsitrep31Jan2020-eng.pdf (accessed on 8 March 2022).
- WHO. Coronavirus Disease COVID-19 Dashboard. 19 November 2020. Available online: https://covid19.who.int/?gclid=EAIaIQobChMIjfDYqqfE7gIV82DmCh2R4QWrEAAYASAAEgLCNPD_BwE (accessed on 20 November 2021).
- World Health Organization. Coronavirus Disease COVID-19 Dashboard. 28 September 2021. Available online: https://covid19.who.int/ (accessed on 28 September 2001).
- World Health Organization. Coronavirus Disease COVID-19 Dashboard. 2022. Available online: https://covid19.who.int/region/wpro/country/cn (accessed on 2 September 2022).
- World Health Organization. Data.who.int, WHO Coronavirus (COVID-19) Dashboard > Cases [Dashboard]. 2024. Available online: https://data.who.int/dashboards/covid19/cases (accessed on 14 January 2024).
- UN-HABITAT. COVID-19, Key Facts, and Data. 5 March 2021. Available online: https://unhabitat.org/covid-19/key-facts-and-data (accessed on 20 March 2021).
- Cascella, M.; Rajnik, M.; Aleem, A.; Dulebohn, S.C.; Di Napoli, R. Features, Evaluation, and Treatment of Coronavirus (COVID-19); StatPearls Publishing: Treasure Island, FL, USA, 2023. Available online: https://www.ncbi.nlm.nih.gov/books/NBK554776 (accessed on 14 October 2023).
- Hamidi, S.; Sabouri, S.; Ewing, R. Does Density Aggravate the COVID-19 Pandemic? J. Am. Plan. Assoc. 2020, 86, 495–509. [Google Scholar] [CrossRef]
- Sassen, S.; Kourtit, K. A Post-Corona Perspective for Smart Cities: ‘Should I Stay, or Should I Go?’. Sustainability 2021, 13, 9988. [Google Scholar] [CrossRef]
- UN. Transforming Our World: The 2030 Agenda for Sustainable Development; Resolution Adopted by the General Assembly on 25 September 2015; United Nations: New York, NY, USA, 2015; Volume 42809, pp. 1–13. Available online: https://sustainabledevelopment.un.org/post2015/transformingourworld/publication (accessed on 20 March 2024).
- OECD. OECD Regional Outlook 2021: Addressing COVID-19 and Moving to Net Zero Greenhouse Gas Emissions; OCDE: Paris, France, 2021. [Google Scholar] [CrossRef]
- UNDP. Human Development Report 2021/2022. Uncertain Times, Unsettled Lives: Shaping our Future in a Transforming World; United Nations Development Programme: New York, NY, USA, 2022; Available online: https://hdr.undp.org/system/files/documents/global-report-document/hdr2021-22pdf_1.pdf (accessed on 22 April 2022).
- UN-HABITAT. Spatial Planning Guidelines during COVID-19. September 2020. Available online: https://unhabitat.org/sites/default/files/2020/11/covid19_spatialplanning_eng1.pdf (accessed on 20 March 2021).
- UN-HABITAT. Report Calls for Cities Post-Pandemic to Lead the Way to a Fairer, Greener, Healthier Future. UN News. United Nations. 30 March 2021. Available online: https://news.un.org/en/story/2021/03/1088622 (accessed on 18 February 2023).
- Jillian, D.; Robert, K.; Radha, C. Tackling Inequality in Cities is Essential for Fighting COVID-19, 14 April 2020. Available online: https://www.wri.org/blog/2020/04/coronavirus-inequality-cities (accessed on 21 July 2021).
- Sharifi, A.; Khavarian-Garmsir, A.R. The COVID-19 pandemic: Impacts on cities and major lessons for urban planning, design, and management. Sci. Total Environ. 2020, 749, 142391. [Google Scholar] [CrossRef]
- Bilal, U.; Tabb, L.P.; Barber, S.; Diez Roux, A.V. Spatial Inequities in COVID-19 Testing, Positivity, Confirmed Cases, and Mortality in 3 U.S. Cities: An Ecological Study. Ann. Intern. Med. 2021, 174, 936–944. [Google Scholar] [CrossRef]
- Bambra, C.; Riordan, R.; Ford, J.; Matthews, F. The COVID-19 pandemic and health inequalities. J. Epidemiol. Community Health 2020, 74, 964–968. [Google Scholar] [CrossRef]
- Bajos, N.; Counil, E.; Franck, J.E.; Jusot, F.; Pailhé, A.; Spire., A.; Martin, C.; Lydie, N.; Slama, R.; Meyer, L.; et al. Social inequalities and dynamics of the early COVID-19 epidemic: A prospective cohort study in France. BMJ Open 2021, 11, e052888. [Google Scholar] [CrossRef] [PubMed]
- Gaudart, J.; Landier, J.; Huiart, L.; Legendre, E.; Lehot, L.; Bendiane, M.K.; Chiche, L.; Petitjean, A.; Mosnier, E.; Kirakoya-Samadoulougou, F.; et al. Factors associated with the spatial heterogeneity of the first wave of COVID-19 in France: A nationwide geo-epidemiological study. Lancet Public Health 2021, 6, e222–e231. [Google Scholar] [CrossRef]
- Wolf, M. Rethinking Urban Epidemiology: Natures, Networks and Materialities. Int. J. Urban Reg. Res. 2016, 40, 958–982. [Google Scholar] [CrossRef] [PubMed]
- Shirazi, M.R.; Keivani, R. Social sustainability discourse. In Urban Social Sustainability; Routledge: London, UK, 2019; pp. 1–26. [Google Scholar] [CrossRef]
- Harvey, D. Front Matter. In Social Justice and the City (REV-Revised); University of Georgia Press: Athens, GA, USA, 1973; pp. 1–4. Available online: http://www.jstor.org/stable/j.ctt46nm9v.1 (accessed on 10 March 2024).
- Leven, C. Towards a Theory of the City. In Urban Development Models; Special Report 97; Hemmens, G., Ed.; National Academy of Sciences, Highway Research Board: Washington, DC, USA, 1978. [Google Scholar]
- Magis, K.; Shinn, C. Emergent Principles of Social Sustainability; Dillard, J.F., Dujon, V., Magisy, M.C.K., Eds.; Routledge: London, UK, 2009; Volume 40, pp. 629–648. [Google Scholar]
- Yiftachel, O.; Hedgcock, D. Urban social sustainability: The planning of an Australian city. Cities 1993, 10, 139–157. [Google Scholar] [CrossRef]
- Kay, A. Territorial justice and devolution. Br. J. Politics Int. Relat. 2005, 7, 544–560. [Google Scholar] [CrossRef]
- Piketty, T. Capital in the Twenty-First Century; Harvard University Press: Cambridge, MA, USA; London, UK, 2014. [Google Scholar] [CrossRef]
- Vallance, S.; Perkins, H.C.; Dixon, J.E. What is social sustainability? A clarification of concepts. Geoforum 2011, 42, 342–348. [Google Scholar] [CrossRef]
- Bramley, G.; Dempsey, N.; Power, S.; Brown, C.; Watkins, D. Social Sustainability and Urban Form: Evidence from Five British Cities. Environ. Plan. A Econ. Space 2009, 41, 2125–2142. [Google Scholar] [CrossRef]
- Bramley, G.; Brown, C.; Dempsey, N.; Power, S.; Watkins, D. Social Acceptability. In Dimensions of the Sustainable City; Future City; Jenks, M., Jones, C., Eds.; Springer: Dordrecht, The Netherlands, 2010; Volume 2. [Google Scholar] [CrossRef]
- Dave, S. High Urban Densities in Developing Countries: A Sustainable Solution? Built Environ. 2010, 36, 9–27. Available online: http://www.jstor.org/stable/23289981 (accessed on 10 March 2024). [CrossRef]
- Dave, S. Neighbourhood density and social sustainability in cities of developing countries. Sustain. Dev. 2011, 19, 189–205. [Google Scholar] [CrossRef]
- Kyttä, M.; Broberg, A.; Haybatollahi, M.; Schmidt-Thomé, K. Urban happiness: Context-sensitive study of the social sustainability of urban settings. Environ. Plan. B Plan. Des. 2016, 43, 34–57. [Google Scholar] [CrossRef]
- Shirazi, M.R.; Keivani, R. The triad of social sustainability: Defining and measuring social sustainability of urban neighbourhoods. Urban Res. Pract. 2019, 12, 448–471. [Google Scholar] [CrossRef]
- Shields, R. Spatial stress and resistance: Social meanings of spatialization. In Space and Social Theory: Interpreting Modernity and Postmodernity; Benko, G., Strohmayer, U., Eds.; Blackwell: Oxford, UK, 1997; pp. 33–186. [Google Scholar]
- Shirazi, M.R.; Keivani, R. (Eds.) Urban Social Sustainability: Theory, Policy and Practice, 1st ed.; Routledge: London, UK, 2019. [Google Scholar] [CrossRef]
- McFarlane, C. The geographies of urban density: Topology, politics and the city. Prog. Hum. Geogr. 2016, 40, 629–648. [Google Scholar] [CrossRef]
- Ali, S.H.; Keil, R. Contagious Cities. Geogr. Compass 2007, 1, 1207–1226. [Google Scholar] [CrossRef]
- Kendall, C.; Hudelson, P.; Leontsini, E.; Winch, P.; Lloyd, L.; Cruz, F. Urbanization, Dengue, and the Health Transition: Anthropological Contributions to International Health. Med. Anthropol. Q. 2009, 5, 257–268. [Google Scholar] [CrossRef]
- Andrew, M. Human Culture, Ecological Change, and Infectious Disease: Are We Experiencing History’s Fourth Great Transition? Ecosyst. Health 2001, 7, 107–115. [Google Scholar] [CrossRef]
- United Nations. Policy Brief: COVID-19 in an Urban World; United Nations: New York, NY, USA, 2020; Available online: https://unsdg.un.org/resources/policy-brief-covid-19-urban-world (accessed on 15 July 2021).
- Kadi, N.; Khelfaoui, M. Population Density, a Factor in the Spread of COVID-19 in Algeria: Statistic Study—Bulletin of the National Research Centre; Springer Open: London, UK, 2020; Available online: https://BNRC.springeropen.com/articles/10.1186/s42269-020-00393-x (accessed on 23 August 2022).
- Wong, D.W.; Li, Y. Spreading of COVID-19: Density matters. PLoS ONE 2020, 15. [Google Scholar] [CrossRef] [PubMed]
- Bhadra, A.; Mukherjee, A.; Sarkar, K. Impact of population density on Covid-19 infected and mortality rate in India. Model Earth Syst. Environ. 2021, 7, 623–629. [Google Scholar] [CrossRef] [PubMed]
- Fang, W.; Wahba, S. Urban Density Is Not an Enemy in the Coronavirus Fight: Evidence from China. World Bank Sustainable Cities Blog, 20 April 2020. Available online: https://blogs.worldbank.org/sustainablecities/urban-density-not-enemy-coronavirus-fight-evidence-china (accessed on 20 November 2021).
- Hamidi, S.; Ewing, R.; Sabouri, S. Longitudinal analyses of the relationship between development density and the COVID-19 morbidity and mortality rates: Early evidence from 1,165 metropolitan counties in the United States. Health Place 2020, 64, 102378. [Google Scholar] [CrossRef] [PubMed]
- Carozzi, F.; Provenzano, S.; Sefi, R. Urban Density and COVID-19; CEP Discussion Papers (1711); Centre for Economic Performance; LSE: London, UK, 2020. [Google Scholar]
- Henao-Cespedes, V.; Garcés-Gómez, Y.A.; Ruggeri, S.; Henao-Cespedes, T.M. Relationship analysis between the spread of COVID-19 and the multidimensional poverty index in the city of Manizales, Colombia. Egypt. J. Remote Sens. Space Sci. 2022, 25, 197–204. [Google Scholar] [CrossRef]
- WHO. Coronavirus Disease COVID-19 Dashboard. 2023. Available online: https://data.who.int/dashboards/covid19/cases?m49=250&n=c (accessed on 6 September 2023).
- Reuters. 4 October 2022. France’s 8th Wave of COVID is Gaining in Intensity, Health Official Says. 21 June 2023. Available online: https://www.reuters.com/business/healthcare-pharmaceuticals/frances-8th-wave-covid-is-gaining-intensity-health-official-2022-10-04/ (accessed on 21 June 2023).
- Santé Publique France. Coronavirus-covid-19. 5 March 2021. Available online: https://www.santepubliquefrance.fr/dossiers/coronavirus-covid-19/coronavirus-chiffres-cles-et-evolution-de-la-covid-19-en-france-et-dans-le-monde#block-266151 (accessed on 5 March 2020).
- Pasteur Institut. Une Modélisation Indique Qu’entre 5 et 7% des Français ont été infectés. 21 April 2020. Available online: https://www.pasteur.fr/fr/espace-presse/documents-presse/modelisation-indique-qu-entre-3-7-francais-ont-ete-infectes (accessed on 22 February 2021).
- Santé Publique France. GEODES. 22 March 2021. Available online: https://geodes.santepubliquefrance.fr/#c=home (accessed on 22 March 2021).
- World Bank. Data Bank, Metadata Glossary. 2023. Available online: https://databank.worldbank.org/metadataglossary/jobs/series/EN.POP.DNST (accessed on 31 January 2024).
- INSEE. Demographic Report 2023. 23 November 2024. Available online: https://www.insee.fr/en/statistiques/7757334 (accessed on 21 January 2024).
- INSEE. France, Portrait Social. 16 January 2023. Available online: https://www.insee.fr/fr/statistiques/7666835?sommaire=7666953&q=densite+departement (accessed on 21 January 2024).
- Romanova, E. Increase in population density and aggravation of social and psychological problems in areas with high-rise construction. E3S Web Conf. 2018, 33, 03061. [Google Scholar] [CrossRef]
- Santé Publique France. GEODES. 30 May 2021. Available online: https://geodes.santepubliquefrance.fr/#bbox=-1878154,6775601,4220720,1847697&c=indicator&f=0&i=covid_hospit.dc&s=2021-05-30&t=a01&view=map2 (accessed on 3 June 2021).
- INSEE. Définitions, Méthodes et Qualité, Départment. 27 March 2018. Available online: https://www.insee.fr/fr/metadonnees/definition/c1762 (accessed on 10 July 2021).
- INSEE. France, Portrait Social-Pauvreté. 3 December 2020. Available online: https://www.insee.fr/fr/statistiques/4797606?sommaire=4928952 (accessed on 30 April 2021).
- INSEE. Tableaux de L’Économie Française. 27 July 2020. Available online: https://www.insee.fr/fr/statistiques/4277596?sommaire=4318291 (accessed on 10 July 2021).
- INSEE. Tableaux de L’Économie Française-Régions—Départements Population. 27 February 2018. Available online: https://www.insee.fr/fr/statistiques/3303305?sommaire=3353488 (accessed on 30 May 2021).
- Siddique, A.B.; Haynes, K.E.; Kulkarni, R.; Li, M. Regional poverty, and infection disease: Early exploratory evidence from the COVID-19 pandemic. Ann. Reg. Sci. 2023, 70, 209–236. [Google Scholar] [CrossRef] [PubMed]
- Brunner, A. Rapport sur Les Inégalités, 2023 ed. Observatoire Des Inégalités. 12 June 2023. Available online: https://www.inegalites.fr/Rapport-sur-les-inegalites-edition-2023 (accessed on 10 September 2023).
- France Stratégie. 2017/2027 Voir plus Loin, Voir plus Clair. Présentation de la démarche. France Stratégie. 2016. Available online: http://francestrategie1727.fr/wp-content/uploads/2016/02/17-27-dexxmarche-29.02-1.pdf (accessed on 7 January 2024).
- Altakarli, N. China’s Response to the COVID-19 Outbreak: A Model for Epidemic Preparedness and Management. Dubai Med. J. 2020, 3, 44–49. [Google Scholar] [CrossRef]
- Lehman, A. JMP for Basic Univariate and Multivariate Statistics: A Step-by-Step Guide; Sas Press: Stockholm, Sweden, 2005. [Google Scholar]
- SENAT. Un Nouveau Pacte de Solidarité Pour les Quartiers, Annexe 8-La Seine-Saint-Denis: Un département Contrasté. 2021. Available online: https://www.senat.fr/rap/r06-049-1/r06-049-166.html (accessed on 11 June 2021).
- Boterman, W. Population density and SARS-CoV-2 pandemic: Comparing the geography of different waves in the Netherlands. Urban Stud. 2023, 60, 1377–1402. [Google Scholar] [CrossRef] [PubMed]
- Aw, S.B.; Teh, B.T.; Ling, G.H.T.; Leng, P.C.; Chan, W.H.; Ahmad, M.H. The COVID-19 Pandemic Situation in Malaysia: Lessons Learned from the Perspective of Population Density. Int. J. Environ. Res. Public Health 2021, 18, 6566. [Google Scholar] [CrossRef]
- Wang, J.; Yang, Y.; Peng, J.; Yang, L.; Gou, Z.; Lu, Y. Moderation effect of urban density on changes in physical activity during the coronavirus disease 2019 pandemic. Sustain. Cities Soc. 2021, 72, 103058. [Google Scholar] [CrossRef]
- Marí-Dell’Olmo, M.; Gotsens, M.; Pasarín, M.I.; Rodríguez-Sanz, M.; Artazcoz, L.; Garcia de Olalla, P.; Rius, C.; Borrell, C. Socioeconomic inequalities in COVID-19 in a European urban area: Two waves, two patterns. Int. J. Environ. Res. Public Health 2021, 18, 1256. [Google Scholar] [CrossRef]
- Sauze, L.; Chanut, F.E.E.C. Assurance Maladie: Un Futur à (Re)construire; Après-Demain: Lausanne, Switzerland, 2009; Volume 12, pp. 20–23. ISSN 0003-7176. [Google Scholar] [CrossRef]
- Aubry, A. Déserts Médicaux. Pourquoi Manque-t-on Tant de Médecins en France ? La Vie. 19 octobre 2022. Available online: https://www.lavie.fr/actualite/societe/pourquoi-manque-t-on-tant-de-medecins-en-france-84789.php (accessed on 20 March 2024).
- Figaro, L. Coronavirus: Le Déficit de la Sécu Plonge à 41 Milliards d’euros [Archive]. 22 April 2020. Available online: https://www.lefigaro.fr/economie/coronavirus-le-deficit-de-la-secu-plonge-a-41-milliards-d-euros-20200422 (accessed on 11 June 2021).
- Sik, D. Towards a post-pandemic social contract. Thesis Elev. 2023, 174, 62–80. [Google Scholar] [CrossRef]
- Alexander, A.; Morita, J.; Ridell, N.G.; Hoek, T.V.L. Social Contracts, and the Problem of Asymmetries. In Remaking the Urban Social Contract: Health, Energy, and the Environment; Pagano, M.A., Ed.; University of Illinois Press: Champaign, IL, USA, 2016; pp. 114–120. Available online: http://www.jstor.org/stable/10.5406/j.ctt1hfr0bc.10 (accessed on 11 June 2021).
- Brandily, P.; Brebion, C.; Briole, S.; Khoury, L. A Poorly Understood Disease? The Unequal Distribution of Excess Mortality Due to COVID-19 Across French Municipalities; SSRN Scholarly Paper ID 3682513; Social Sciences Research Network: Rochester, NY, USA, 2020. [Google Scholar] [CrossRef]
- Khafaie, M.A.; Rahim, F. Cross-Country Comparison of Case Fatality Rates of COVID-19/SARS-COV-2. Osong Public Health Res. Perspect. 2020, 11, 74–80. [Google Scholar] [CrossRef] [PubMed]
- Feldman, J.M.; Bassett, M. The Relationship between Neighborhood Poverty and COVID-19 Mortality within Racial/Ethnic Groups (Cook County, Illinois). MedRxiv 2020, 15. [Google Scholar] [CrossRef]
- Alirol, E.; Getaz, L.; Stoll, B.; Chappuis, F.; Loutan, L. Urbanisation and infectious diseases in a globalised world. Lancet Infect. Dis. 2011, 11, 131–141. [Google Scholar] [CrossRef]
- Butler, J.C.; Crengle, S.; Cheek, J.E.; Leach, A.J.; Lennon, D.; O’Brien, K.L.; Santosham, M. Emerging infectious diseases among indigenous peoples. Emerg. Infect. Dis. 2001, 7 (Suppl. S3), 554–555. [Google Scholar] [CrossRef] [PubMed]
- Mena, G.E.; Martinez, P.P.; Mahmud, A.S.; Marquet, P.A.; Buckee, C.O.; Santillana, M. Socioeconomic status determines COVID-19 incidence and related mortality in Santiago, Chile. Science 2021, 372, eabg5298. [Google Scholar] [CrossRef]
- Cattell, V. Poor people, poor places, and poor health: The mediating role of social networks and social capital. Soc. Sci. Med. 2001, 52, 1501–1516. [Google Scholar] [CrossRef]
- Kapitsinis, N. The underlying factors of the COVID-19 spatially uneven spread. Initial evidence from regions in nine EU countries. Reg. Sci. Policy Pract. 2020, 12, 1027–1045. [Google Scholar] [CrossRef]
- Salje, H.; Tran Kiem, C.; Lefrancq, N.; Courtejoie, N.; Bosetti, P.; Paireau, J.; Andronico, A.; Hozé, N.; Richet, J.; Dubost, C.L.; et al. Estimating the burden of SARS-CoV-2 in France. Science 2020, 369, 208–211. [Google Scholar] [CrossRef]
- Di Domenico, L.; Pullano, G.; Sabbatini, C.E.; Boëlle, P.Y.; Colizza, V. Impact of lockdown on COVID-19 epidemic in Île-de-France and possible exit strategies. BMC Med. 2020, 18, 240. [Google Scholar] [CrossRef] [PubMed]
- Islam, N.; Sharp, S.J.; Chowell, G.; Shabnam, S.; Kawachi, I.; Lacey, B.; Massaro, J.M.; D’Agostino Sr, R.B.; White, M. Physical distancing interventions and incidence of coronavirus disease 2019: Natural experiment in 149 countries. BMJ 2020, 370, m2743. [Google Scholar] [CrossRef] [PubMed]
- Bouchet, C.; Duvoux, N. Post-COVID-19 poverty in France: Magnitude, manifestations, and actors from nine case studies. Int. J. Sociol. Soc. Policy 2023, 43, 823–837. [Google Scholar] [CrossRef]
- OECD. Cities policy responses (updated May 2020). 2020. Available online: https://www.oecd.org/coronavirus/policy-responses/cities-policy-responses-fd1053ff/ (accessed on 5 April 2024).
- OECD. Implementation toolkit of the OECD Principles on urban policy. In OECD Regional Development Papers, 31st ed.; OCDE: Paris, France, 2022. [Google Scholar] [CrossRef]
- Stratigea, A. The Concept of ‘Smart Cities. Towards Community Development? Netcom. 2012, 26, pp. 375–388. [CrossRef]
- Duan, Z.; Kim, S. Progress in Research on Net-Zero-Carbon Cities: A Literature Review and Knowledge Framework. Energies 2023, 16, 6279. [Google Scholar] [CrossRef]
- Seto, K.C.; Churkina, G.; Hsu, A.; Keller, M.; Newman PW, G.; Qin, B.; Ramaswami, A. From Low- to Net-Zero Carbon Cities: The Next Global Agenda. Annu. Rev. Environ. Resour. 2021, 46, 377–415. [Google Scholar] [CrossRef]
- World Economic Forum. The Global Risks Report 2024. Switzerland. 2024. Available online: https://www3.weforum.org/docs/WEF_The_Global_Risks_Report_2024.pdf (accessed on 6 April 2024).
- Flaxman, S.; Mishra, S.; Gandy, A.; Unwin, H.J.T.; Mellan, T.A.; Coupland, H.; Whittaker, C.; Zhu, H.; Berah, T.; Eaton, J.W.; et al. Estimating the effects of non-pharmaceutical interventions on COVID-19 in Europe. Nature 2020, 257–261. [Google Scholar] [CrossRef]
- World Economic Forum. Why We Need a New Social Contract for the 21st Century. Davos Agenda. 2022. Available online: https://www.weforum.org/agenda/2022/01/a-new-social-contract-for-21st-century/ (accessed on 5 April 2024).
Figure 1.
Distribution of regions and departments in France as of 2023.Note: The numbers on the map represent the official codes assigned to each department. France comprises 101 departments in total, 96 in metropolitan France and five overseas. Source: Author, based on information from https://www.regions-departements-france.fr/ (accessed on 19 February 2023).

Figure 3.
Analysis demonstrated a notable correlation between population density and infection/death rates during the third wave in 2021 across French departments. Source: Author, using data from [57,59,61,62,67].
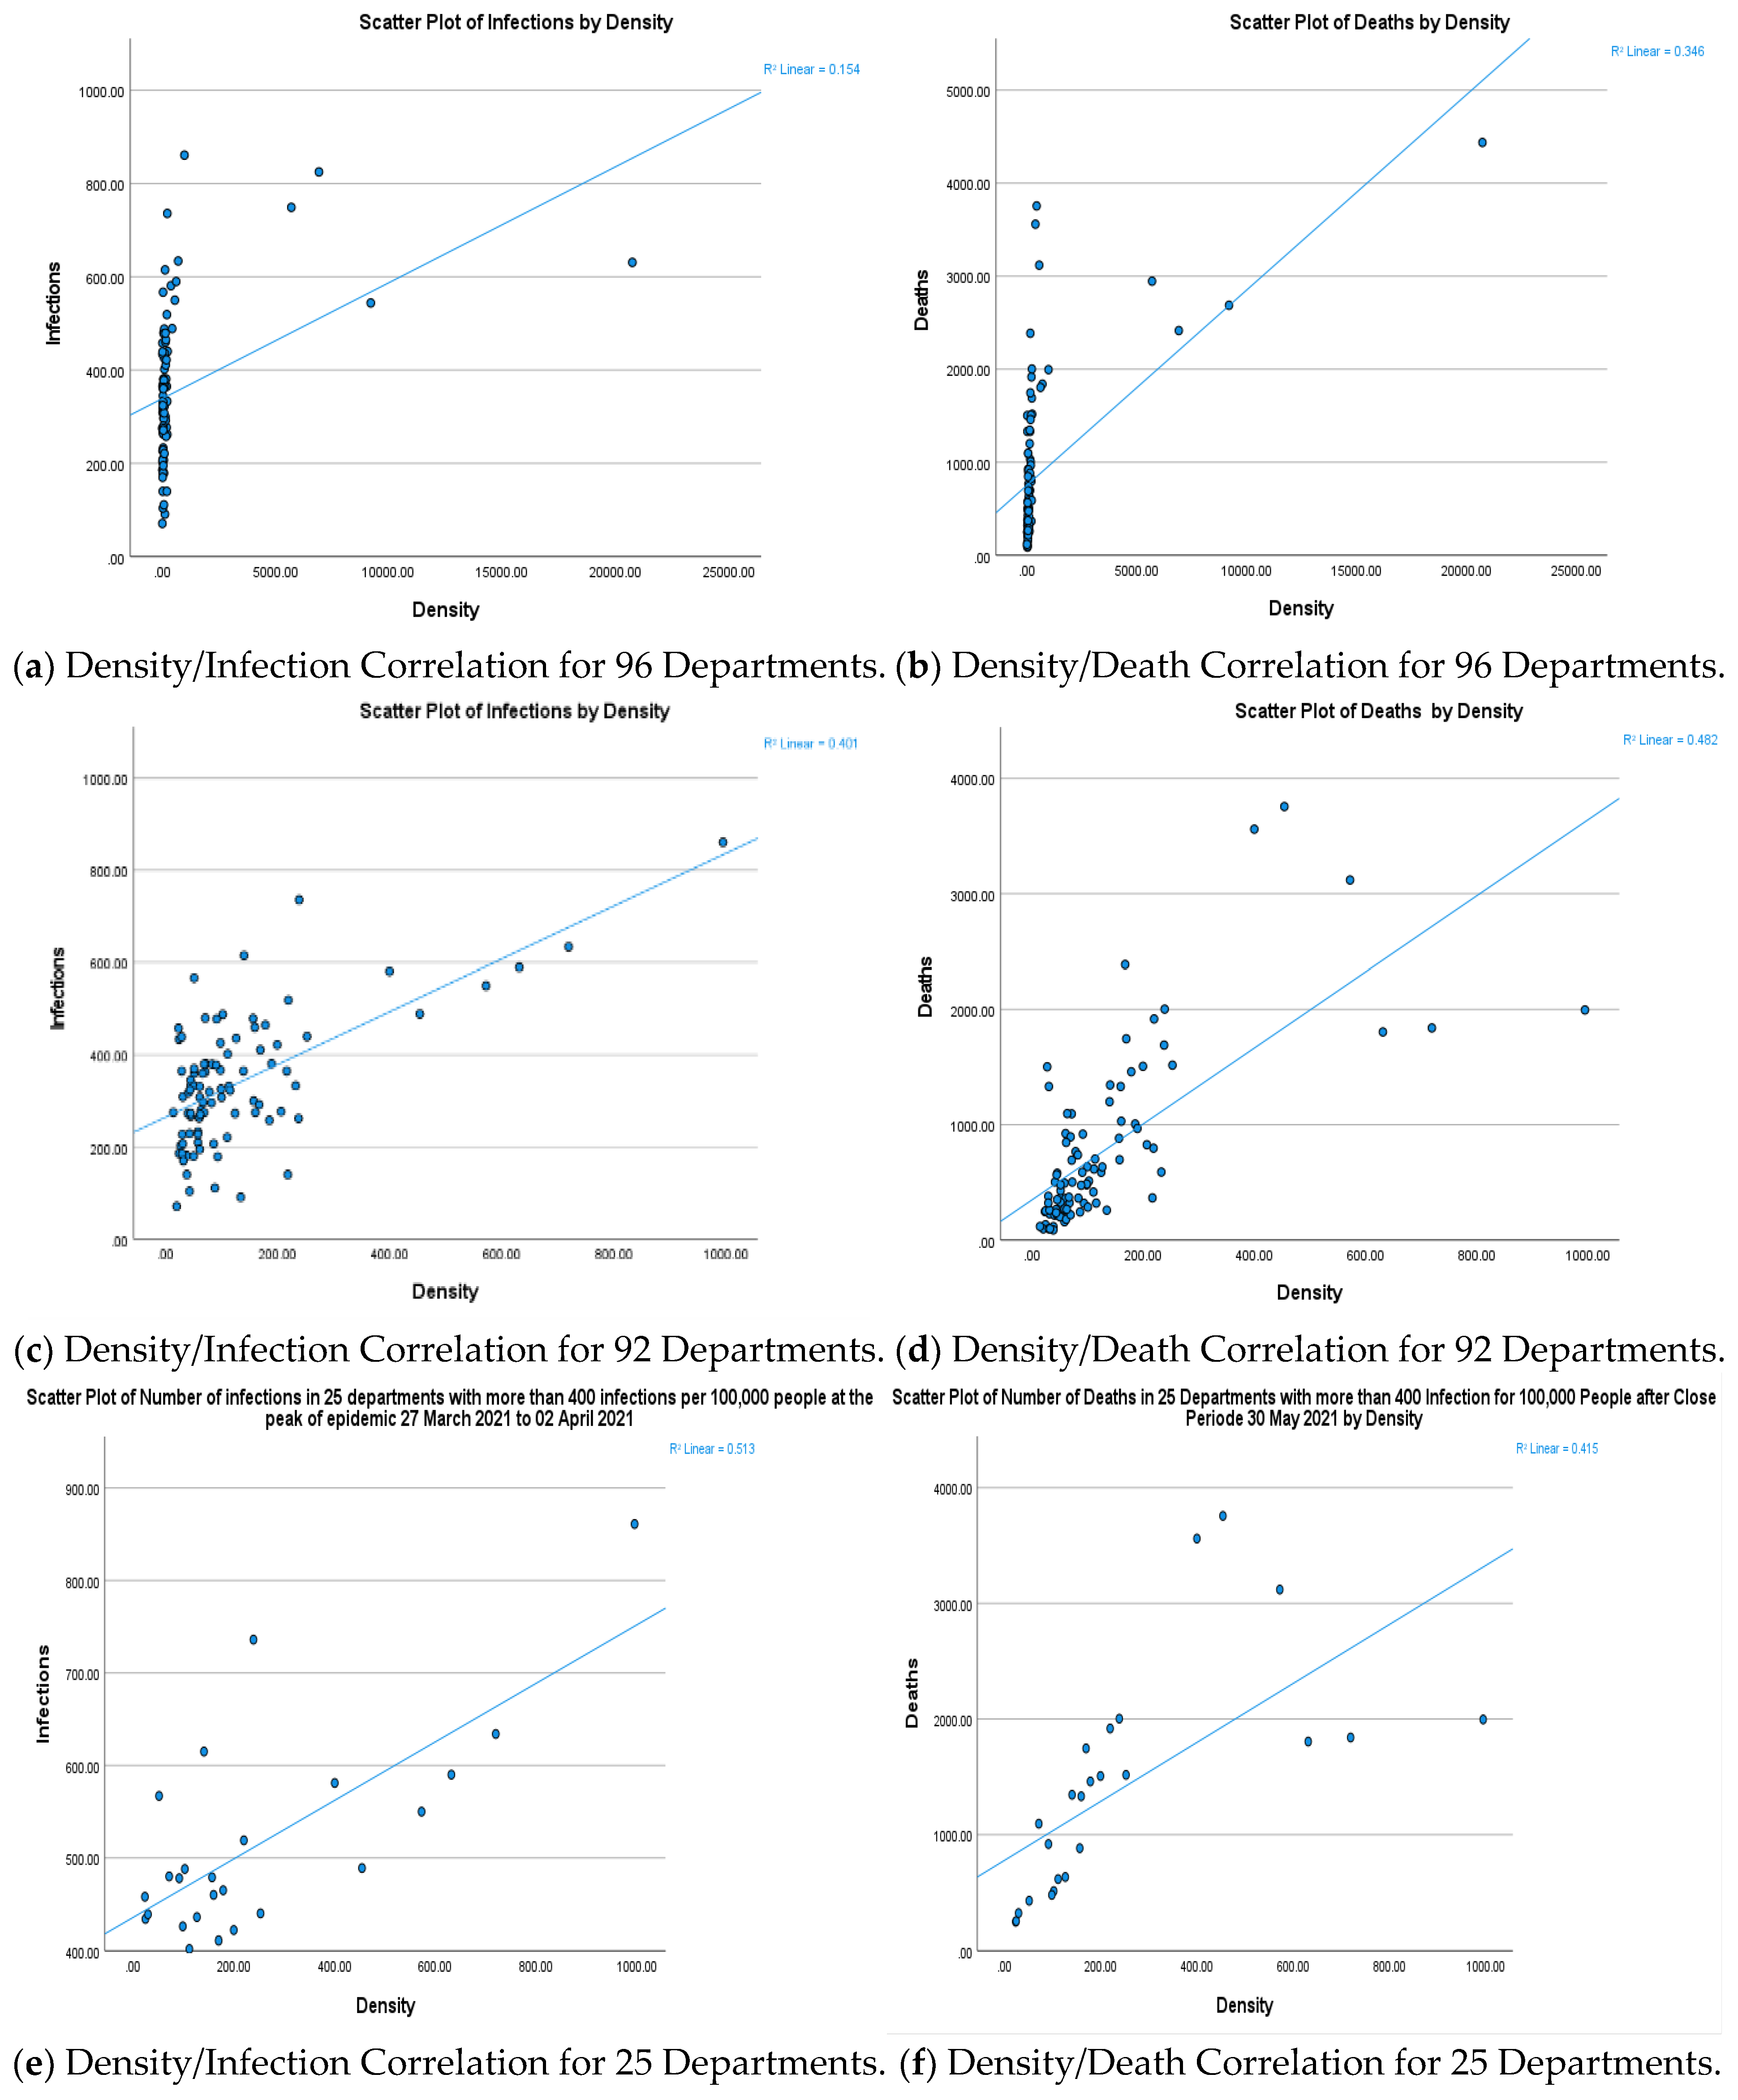
Figure 4.
Effect of lockdown policies during the third wave (27 March to 27 April 2021). (1) Before the peak; (2) During the peak; (3) Lockdown period; (4) End of lockdown. Source: Author, using data from [54,56,59].

Figure 5.
The urban policy concept and principles. Source: Based on OECD concept [92].
Figure 5.
The urban policy concept and principles. Source: Based on OECD concept [92].

Table 2.
Overview of Findings for 96, 92, and 25 Departments.
| The Results for 96 Departments | |||||
|---|---|---|---|---|---|
| Density | Poverty | Infections * | Death * | ||
| Density | Pearson correlation | 1 | 0.137 | 0.393 ** | 0.589 ** |
| Sig. (2-tailed) | 0.183 | <0.001 | <0.001 | ||
| Poverty | Pearson correlation | 0.137 | 1 | 0.267 ** | 0.197 |
| Sig. (2-tailed) | 0.183 | 0.108 | 0.055 | ||
| Infections * | Pearson correlation | 0.393 ** | 0.267 ** | 1 | 0.654 ** |
| Sig. (2-tailed) | <0.001 | 0.009 | <0.001 | ||
| Deaths * | Pearson correlation | 0.589 ** | 0.197 | 0.654 ** | 1 |
| Sig. (2-tailed) | <0.001 | 0.055 | <0.001 | ||
| The Results for 92 Departments | |||||
| Density | Pearson correlation | 1 | 0.030 | 0.633 ** | 0.695 ** |
| Sig. (2-tailed) | 0.779 | <0.001 | <0.001 | ||
| Poverty | Pearson correlation | 0.030 | 1 | 0.135 | 0.136 |
| Sig. (2-tailed) | 0.779 | 0.198 | 00.197 | ||
| Infections * | Pearson correlation | 0.633 ** | 0.135 | 1 | 0.579 ** |
| Sig. (2-tailed) | <0.001 | 0.198 | <.001 | ||
| Deaths * | Pearson correlation | 0.695 ** | 0.136 | 0.579 ** | 1 |
| Sig. (2-tailed) | <0.001 | 0.197 | <0.001 | ||
| The Results for 25 Departments | |||||
| Density | Pearson correlation | 1 | 0.037 | 0.716 ** | 0.644 ** |
| Sig. (2-tailed) | 0.860 | <0.001 | <0.001 | ||
| Poverty | Pearson correlation | −0.037 | 1 | −0.140 | 0.158 |
| Sig. (2-tailed) | 0.860 | 0.860 | 0.452 | ||
| Infections * | Pearson correlation | 0.716 ** | -0.040 | 1 | 0.391 |
| Sig. (2-tailed) | <0.001 | 0.850 | 0.053 | ||
| Deaths * | Pearson correlation | 0.644 ** | 0.158 | 0.391 | 1 |
| Sig. (2-tailed) | <0.001 | 0.452 | 0.053 | ||
Table 3.
COVID-19 Rates in 29 French Departments Exceeding 400 infections per 100,000 Inhabitants, Wave 3.
Table 3.
COVID-19 Rates in 29 French Departments Exceeding 400 infections per 100,000 Inhabitants, Wave 3.
| Departements | Density hab/km2 | Number of Infections for 100,000 Habitants | ||||
|---|---|---|---|---|---|---|
| Before the 2.Peak of Epidemic 22–28 March 2021 | During the Peak of Epidemic 27 March–2 April 2021 | The Close Period 05–11 April 2021 | After the Close Period 27 April–3 May 2021 | |||
| 1 | Seine Saint- Denis (93) | 7822 | 779 | 825 | 686 | 379 |
| 2 | Val-de-Marne (94) | 7103 | 716 | 749 | 609 | 380 |
| 3 | Paris (75) | 21,000 | 608 | 631 | 525 | 310 |
| 4 | Seine et Marne (77) | 319 | 695 | 736 | 544 | 331 |
| 5 | Val-d’Oise (95) | 1133 | 813 | 861 | 672 | 355 |
| 6 | Essonne (91) | 956 | 560 | 634 | 522 | 332 |
| 7 | Bouches-du-Rhône (13) | 376 | 531 | 581 | 490 | 288 |
| 8 | Oise (60) | 129 | 557 | 615 | 478 | 299 |
| 9 | Hauts de Seine (92) | 10,866 | 501 | 544 | 472 | 283 |
| 10 | Yvelines (78) | 774 | 554 | 590 | 464 | 248 |
| 11 | Rhône (69) | 573 | 500 | 550 | 441 | 267 |
| 12 | Loire (42) | 27 | 437 | 460 | 434 | 278 |
| 13 | Doubs (25) | 97 | 483 | 488 | 415 | 229 |
| 14 | Vaucluse (84) | 149 | 461 | 479 | 404 | 256 |
| 15 | Nord (59) | 475 | 544 | 489 | 405 | 273 |
| 16 | Pas-de-Calais (62) | 217 | 496 | 519 | 399 | 255 |
| 17 | Nièvre (58) | 38 | 395 | 439 | 394 | 225 |
| 18 | Aisne (02) | 66 | 473 | 480 | 390 | 277 |
| 19 | Gard (30) | 114 | 392 | 436 | 371 | 227 |
| 20 | Seine Maritime (76) | 191 | 312 | 422 | 369 | 263 |
| 21 | Var (83) | 220 | 452 | 465 | 361 | 177 |
| 22 | Somme (80) | 72 | 454 | 478 | 352 | 233 |
| 23 | Eure (27) | 98 | 331 | 426 | 345 | 208 |
| 24 | Aube (10) | 71 | 531 | 567 | 339 | 196 |
| 25 | Alpes-de-Hautes de Provence (04) | 27 | 410 | 458 | 332 | 196 |
| 26 | Ain (01) | 145 | 289 | 402 | 314 | 184 |
| 27 | Isère (38) | 224 | 308 | 411 | 308 | 173 |
| 28 | Hautes-Alpes (05) | 29 | 370 | 434 | 291 | 190 |
| 29 | The Alpes Maritimes (06) | 402 | 402 | 440 | 274 | 110 |
Table 4.
Pairwise Comparisons of Infections During COVID-19’s Third Wave in France.
| Measure: MEASURE_1 | ||||||
|---|---|---|---|---|---|---|
| (I) Lockdown Impact | (J) Lockdown Impact | Mean Difference (I–J) | Std. Error | Sig. b | 95% Confidence Interval for Difference b | |
| Lower Bound | Upper Bound | |||||
| (1) Before the peak | 2 | −43.279 * | 6.388 | <0.001 | −61.411 | −25.141 |
| 3 | 67.379 * | 10.648 | <0.001 | 37.150 | 97.609 | |
| 4 | 239.034 * | 16.640 | <0.001 | 191.795 | 286.274 | |
| (2) During the peak | 1 | 43.276* | 6.388 | <0.001 | 25.141 | 61.411 |
| 3 | 110.655 * | 8.444 | <0.001 | 86.682 | 134.628 | |
| 4 | 282.310 * | 14.914 | <0.001 | 239.969 | 324.651 | |
| (3) Lockdown period | 1 | −67.379 * | 10.648 | <0.001 | −97.609 | −37.150 |
| 2 | −110.655 * | 8.444 | <0.001 | −134.628 | −86.682 | |
| 4 | 171.655 * | 9.682 | <0.001 | 144.168 | 199.143 | |
| (4) End of Lockdown | 1 | −239.034 * | 16.640 | <0.001 | −286.274 | −191.795 |
| 2 | −282.310 * | 14.914 | <0.001 | −324.651 | −239.969 | |
| 3 | −171.655 * | 9.682 | <0.001 | −199.143 | −144.168 | |
Disclaimer/Publisher’s Note: The statements, opinions and data contained in all publications are solely those of the individual author(s) and contributor(s) and not of MDPI and/or the editor(s). MDPI and/or the editor(s) disclaim responsibility for any injury to people or property resulting from any ideas, methods, instructions or products referred to in the content. |
© 2024 by the author. Licensee MDPI, Basel, Switzerland. This article is an open access article distributed under the terms and conditions of the Creative Commons Attribution (CC BY) license (https://creativecommons.org/licenses/by/4.0/).
Share and Cite
MDPI and ACS Style
Maya, R. Social and Spatial Inequalities during COVID-19: Evidence from France and the Need for a New Sustainable Urban and Regional Development Paradigm. Sustainability 2024, 16, 3501. https://doi.org/10.3390/su16083501
AMA Style
Maya R. Social and Spatial Inequalities during COVID-19: Evidence from France and the Need for a New Sustainable Urban and Regional Development Paradigm. Sustainability. 2024; 16(8):3501. https://doi.org/10.3390/su16083501
Chicago/Turabian StyleMaya, Roula. 2024. "Social and Spatial Inequalities during COVID-19: Evidence from France and the Need for a New Sustainable Urban and Regional Development Paradigm" Sustainability 16, no. 8: 3501. https://doi.org/10.3390/su16083501
Note that from the first issue of 2016, this journal uses article numbers instead of page numbers. See further details here.