Article

The Mathematical Modeling, Diffusivity, Energy, and Enviro-Economic Analysis (MD3E) of an Automatic Solar Dryer for Drying Date Fruits

by
Khaled A. Metwally
1,
Awad Ali Tayoush Oraiath
2,*,
I. M. Elzein
3,
Tamer M. El-Messery
4,
Claude Nyambe
4,
Mohamed Metwally Mahmoud
5,*,
Mohamed Anwer Abdeen
6,7,
Ahmad A. Telba
8,
Usama Khaled
5,
Abderrahmane Beroual
9 and
Abdallah Elshawadfy Elwakeel
10,*
1
Soil and Water Sciences Department, Faculty of Technology and Development, Zagazig University, Zagazig 44511, Egypt
2
Department of Agricultural Engineering, Faculty of Agriculture, Omar Al Mukhtar University, Al Bayda P.O. Box 991, Libya
3
Department of Electrical Engineering, College of Engineering and Technology, University of Doha for Science and Technology, Doha P.O. Box 24449, Qatar
4
International Research Centre “Biotechnologies of the Third Millennium”, Faculty of Biotechnologies (BioTech), ITMO University, St. Petersburg 191002, Russia
5
Department of Electrical Engineering, Faculty of Energy Engineering, Aswan University, Aswan 81528, Egypt
6
College of Engineering, South China Agricultural University, Guangzhou 510642, China
7
Agricultural Engineering Department, College of Agriculture, Zagazig University, Zagazig 44519, Egypt
8
Electrical Engineering Department, King Saud University, P.O. Box 800, Riyadh 11421, Saudi Arabia
9
AMPERE Lab UMR CNRS 5005, Ecole Centrale de Lyon, University of Lyon, 36 Avenue Guy de Collongue, 69130 Ecully, France
10
Department of Agricultural Engineering, Faculty of Agriculture and Natural Resources, Aswan University, Aswan 81528, Egypt
*
Authors to whom correspondence should be addressed.
Sustainability 2024, 16(8), 3506; https://doi.org/10.3390/su16083506
Submission received: 23 March 2024 / Revised: 7 April 2024 / Accepted: 15 April 2024 / Published: 22 April 2024

Abstract

:
Date fruit drying is a process that consumes a significant amount of energy due to the long duration required for drying. To better understand how moisture flows through the fruit during drying and to speed up this process, drying studies must be conducted in conjunction with mathematical modeling, energy analysis, and environmental economic analysis. In this study, twelve thin-layer mathematical models were designed utilizing experimental data for three different date fruit varieties (Sakkoti, Malkabii, and Gondaila) and two solar drying systems (automated solar dryer and open-air dryer). These models were then validated using statistical analysis. The drying period for the date fruit varieties varied between 9 and 10 days for the automated solar dryer and 14 to 15 days for open-air drying. The moisture diffusivity coefficient values, determined using Fick’s second law of diffusion model, ranged from 7.14 × 10⁻¹² m2/s to 2.17 × 10⁻¹¹ m2/s. Among the twelve thin-layer mathematical models, we chose the best thin drying model based on a higher R2 and lower χ2 and RMSE. The Two-term and Modified Page III models delivered the best moisture ratio projections for date fruit dried in an open-air dryer. For date fruit dried in an automated solar dryer, the Two-term Exponential, Newton (Lewis), Approximation diffusion or Diffusion Method, and Two-term Exponential modeling provided the best moisture ratio projections. The energy and environmental study found that the particular amount of energy used varied from 17.936 to 22.746 kWh/kg, the energy payback time was 7.54 to 7.71 years, and the net CO2 mitigation throughout the lifespan ranged from 8.55 to 8.80 tons. Furthermore, economic research showed that the automated solar dryer’s payback period would be 2.476 years.

1. Introduction

Drying date fruits in Egypt presents several challenges. Every year, a large quantity of date fruits is harvested. While only a small portion of the annual harvest is consumed fresh locally, the farmers frequently dry the fruits to sell them throughout the year, especially during Ramadan [1]. Drying is a well-known food preservation technique that is widely utilized in the processing of a variety of industrial and agricultural goods [2,3,4,5]. It is critical to eliminate moisture from the product using heat to ensure safe storage, avoid marketing degradation within a set duration, ease processing, and permit product transportation [2,6]. Sun drying is the traditional way of drying agricultural goods in many developing countries, including Egypt, and entails spreading the produce on an open floor or field under the sun for a certain period until the required moisture content is obtained [7,8,9]. However, this approach is prone to contamination by dust, dirt, sand particles, and insects [10,11]. Furthermore, sun drying is labor- and time-intensive, and it frequently results in nutritional deterioration, flavor and color alterations, and diminished functionality in dried fruits [12,13]. Dryers offer a suitable alternative to open sun drying for agricultural products, addressing the associated problems [14,15]. These dryers can be categorized as conventional or non-conventional, depending on the type of energy they use. Conventional dryers rely on electricity and fossil fuels, resulting in high operating costs and environmental pollution. Non-conventional dryers, on the other hand, use solar energy to minimize drying costs, pollution, and the consumption of energy [16,17]. By employing solar drying methods, agricultural products can be dried in enclosed structures, overcoming the issues associated with traditional sun drying [18]. The use of solar energy in the drying process reduces dependency on fossil fuels (such as coal, gas, and oil), resulting in lower pollutant emissions [19,20]. Solar drying is seen as a potential method of food preservation since it efficiently uses solar energy [21]. When compared to typical sun drying methods, solar dryers considerably shorten the drying time, eliminate product losses, and improve product quality. Egypt, with a high yearly daily average solar radiation on a horizontal plane (8 kW/m2·day) and average daily sunlight duration (about 11 h), offers enormous potential for using solar energy as an efficient energy source for food drying [7,22]. Drying is an energy-intensive process, with estimates indicating that drying operations account for 10–15% of overall energy needs in industrialized nations’ food sectors [23,24,25].
The precise mathematical modeling of drying data constitutes a vital factor in determining the optimal drying settings, equipment design, optimization, and improvement of food quality. As such, the acquisition of accurate, reliable, and representative data on the drying process plays a central role in the advancement of drying technology and its applications in various industries [24,25]. Mathematical modeling, especially thin-layer modeling, is critical for both summarizing experimental data and improving the drying process. Moreover, this can reduce the total energy requirements of the process [25]. Thin-layer drying is a commonly used method for prolonging the shelf life of agricultural goods. Thin-layer drying models are highly popular owing to their simplicity and convenience of usage. Unlike more sophisticated models, thin-layer models do not need the estimate of many parameters [26]. In thin-layer drying, the words “thin layer” indicate a layer of material with a sufficiently thin thickness so that the air properties inside the layer may be deemed uniform. Thin-layer drying is the process of removing moisture from a porous material via evaporation while passing excess drying air over a thin layer of the material until it achieves an equilibrium moisture content [27,28]. Individual particles or grains of the material are dried by fully exposing them to the drying air. The thin-layer drying process is generally divided into two phases, which are the constant drying rate phase and the decreasing drying rate phase [29]. The drying constant is a mixture of different drying transport parameters, including moisture diffuseness, specific heat, interface heat, thermal conductivity, density, and mass coefficients [30]. The kinetics of thin-layer drying have been studied on a variety of agricultural goods, including seeds, grains, fruit, and commercially significant plant species [31]. The mathematical modeling of the drying process under various operating circumstances is critical for creating models that may be used to regulate commercial-scale drying plants and improve the overall product quality [32]. Several mathematical models have been developed to study the drying properties of various products, for example, garlic slices [33], pearl millet [34], tomato [35,36,37,38,39,40], pumpkin slices [41], potato cubes [42], maize seeds [43], galangal [32], paddy grains [44], mint [7,45], onion [46], unbleached kraft pulpboard [47], apple [48], moringa oleifera leaves [2], kodo millet grains and fenugreek seeds [49], sorghum seeds [50], olive [51], black tea [52], and date fruit [53,54,55,56]. When evaluating the applicability of a mathematical model, higher values of R2 and lower values of χ 2, RMSE, and E% are generally considered more favorable [57,58,59].
The deployment of solar dryers has emerged as a viable solution to address the issue of over-reliance on conventional sources of energy, particularly fossil fuels [1]. By harnessing solar energy, these dryers effectively reduce the emission of carbon dioxide gas, which is the primary cause of global warming, and, as such, can be viewed as a valuable tool in the endeavor to safeguard the environment. The adoption of solar dryers offers numerous benefits, including the conservation of natural resources, reduction in energy costs, and the promotion of sustainable development goals. Furthermore, the deployment of solar dryers presents an opportunity to mitigate the effects of climate change and environmental degradation, which continue to pose significant challenges for industries worldwide. As such, the use of solar dryers represents a significant step towards achieving a cleaner, more sustainable future [60]. According to Sodha et al. [61], unconventional dryers have a 10-year lifespan and surpass conventional dryers powered by fossil fuels. Dryers’ economic viability and sustainability must be assessed using a variety of economic indicators, ecological factors, and energy attributes [62,63]. With growing fossil fuel costs and rising power consumption, as well as the environmental consequences of fossil fuel use, it is critical to conduct a complete examination into dryers’ economical, energy, and environmental repercussions [64], where economic considerations include calculating the payback period, greenhouse dryer cost, and product drying cost. The energy parameters require evaluating the dryer’s embodied energy and specific energy usage.
Currently, there is a scarcity of research on drying kinetics-based analyses of the Aswan date fruit varieties. Given these considerations, the current study aims to investigate the mathematical modeling and diffusivity of the drying process, as well as studying the energy required for drying Aswan date fruit varieties using both open-air and solar dryers. This study also identifies the best appropriate mathematical model by fitting the drying curves of the current study to previous drying models. In addition, it aims to study the impact of using a solar dryer to dry date fruits on the environmental impact (climate change or global warming). Finally, an economic study is undertaken to determine the solar dryer’s operation costs and payback time.

2. Materials and Methods

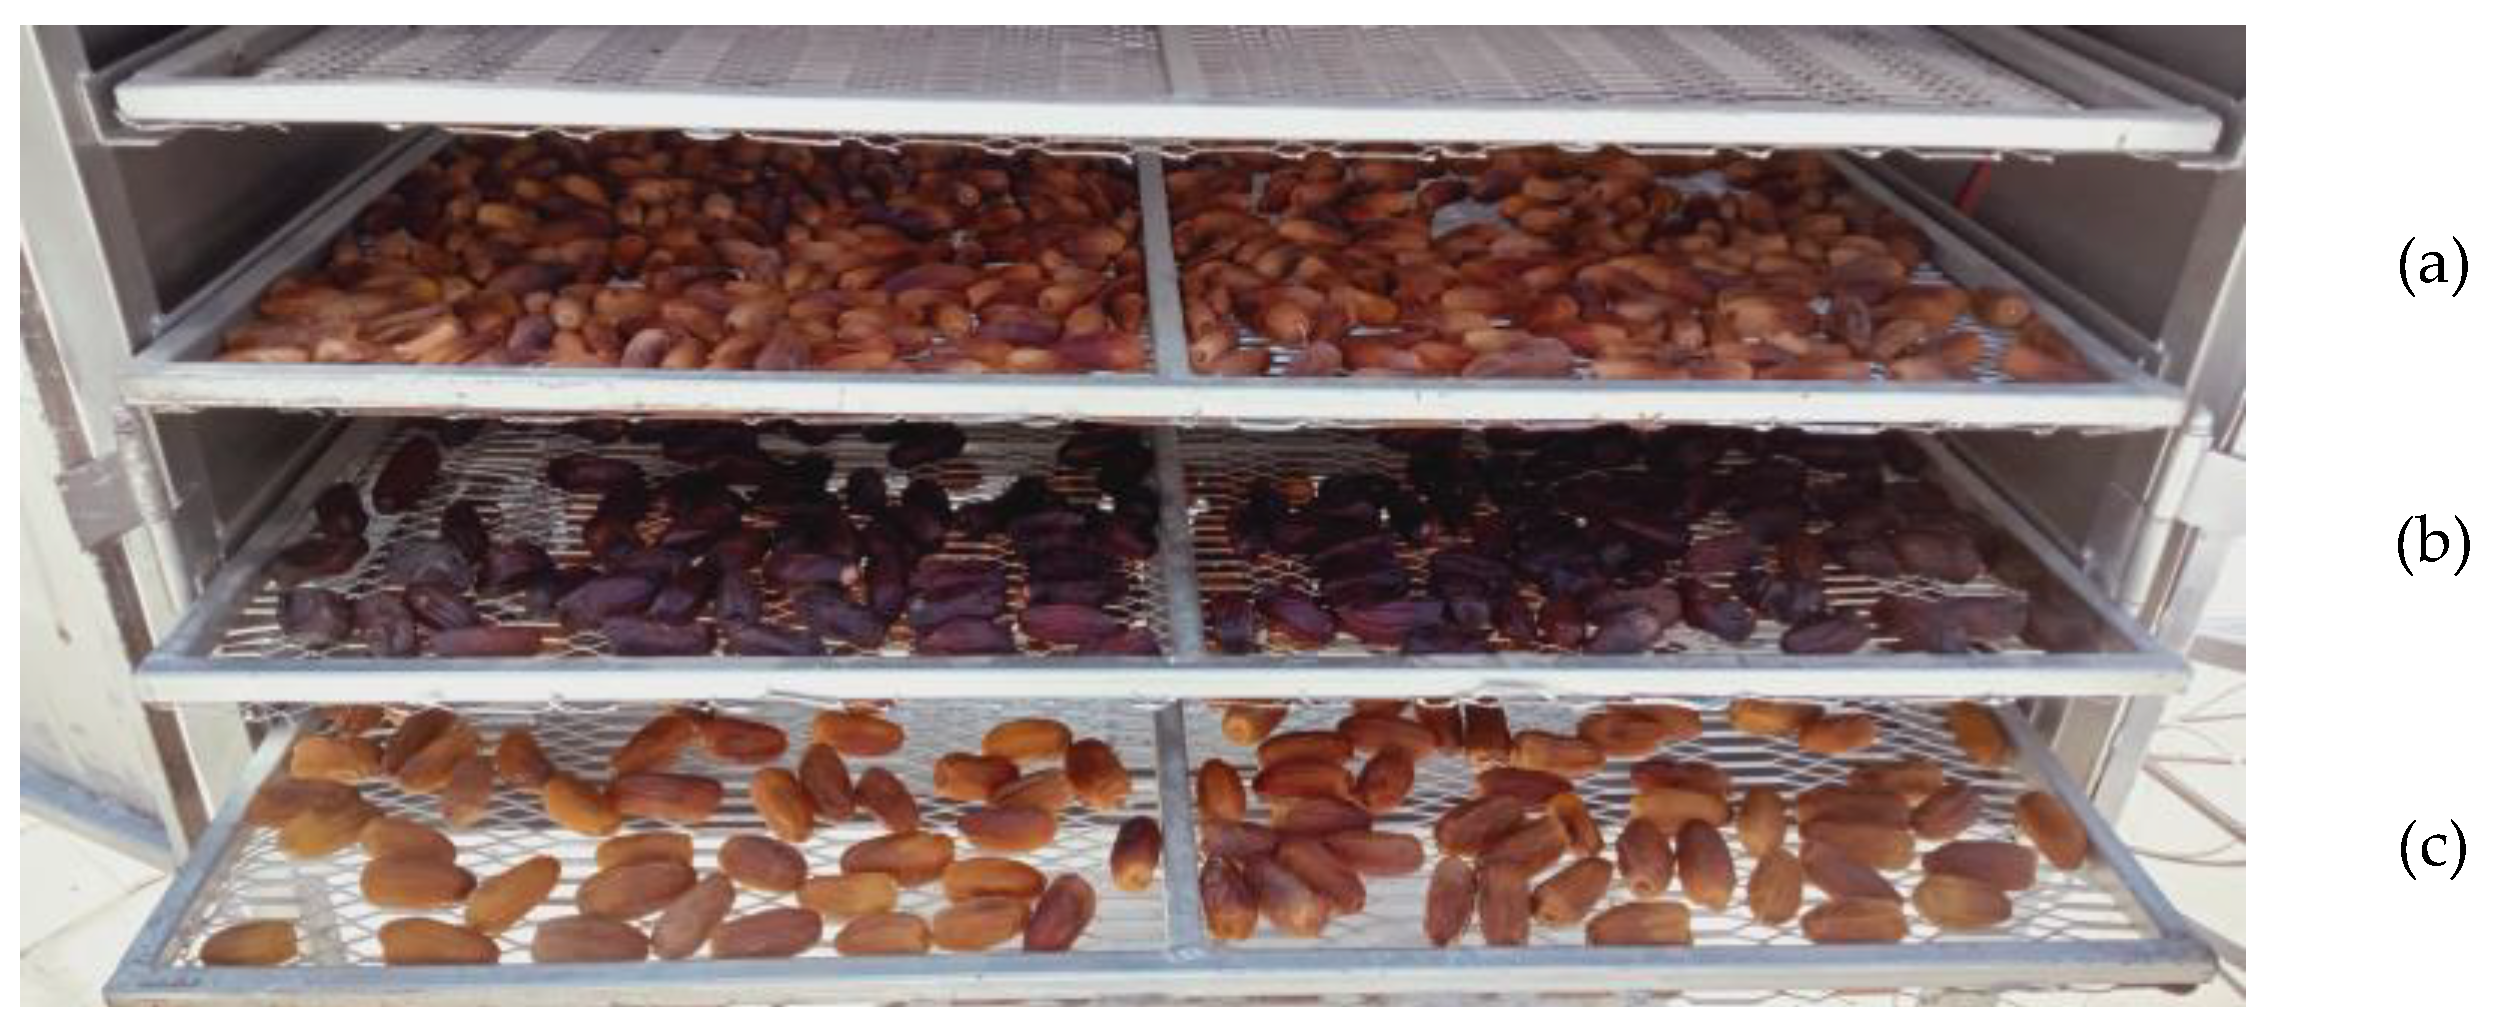
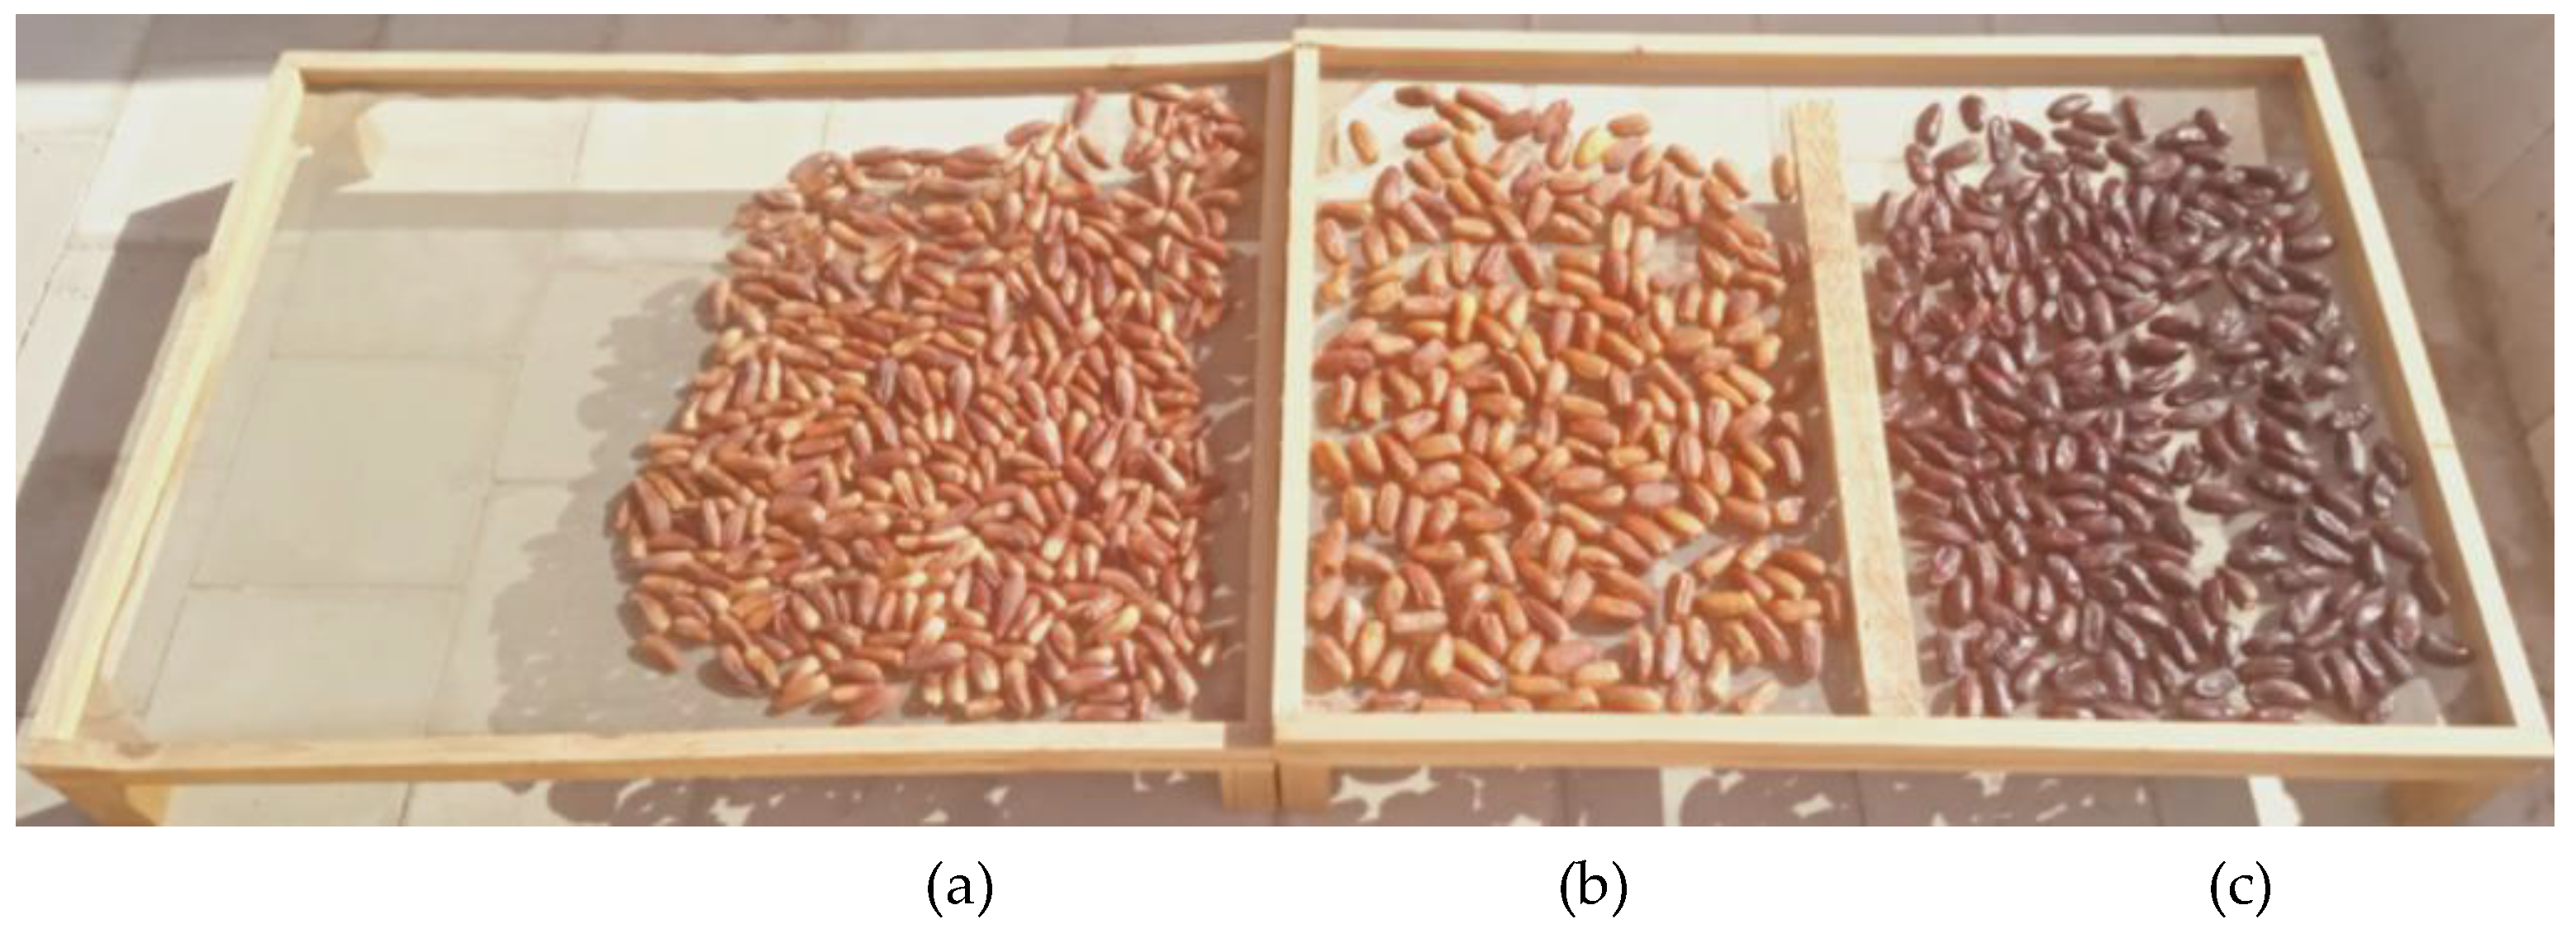
2.1. Sample Preparation

Prior to the dehydration process, three date fruit varieties from Aswan city, Egypt, were kept in bags made of polyethylene in a refrigerator at 4 ± 1 °C. To enable the date fruit samples to acclimate to the ambient temperature, they were removed from the refrigerator about an hour before the field experiment. Then, the first part of the date fruit samples (2500 g of each variety) was spread uniformly on the automated solar dryer (ASD) where each date fruit variety was spread on a separate drying tray; the second part of the date fruit samples (2500 g of each variety) was distributed uniformly on the open-air drying system, as demonstrated in Figure 1 and Figure 2 according to [1].
The initial moisture contents of several date fruit samples (% wb and % db) were determined using the usual approach [65,66] by drying the date fruit varieties on an electrical oven at 105 °C until a constant weight (equilibrium moisture content (EMC)) was obtained at the Food Science and Technology Lab, Faculty of Agriculture, Aswan University. The moisture content (MC) was estimated using Equations (1) and (2).
M C ,   %   d b = W w W d W d × 100
M C ,   %   w b = W w W d W w × 100
where Ww and Wd represent the wet and dry weight of the date fruit samples, respectively, and db and wb denote the moisture content on a dry basis and wet basis, respectively.
Meanwhile, the daily moisture content was calculated by calculating the amount of evaporated water (daily loss in date weight) relative to the total weight using a sensitive balance. In addition, the EMC for each treatment was calculated by continuing the drying process until a consistent weight was observed in the repeated measurements of date fruits.

2.2. Description of ASD

For the current study, an automated solar dryer (ASD) designed by Elwakeel et al. [1] was utilized. The ASD includes several components:
  • Solar Collector: The solar collector is made of angle steel (L) measuring 3 × 3 cm, with dimensions of 300 cm in length and 100 cm in breadth. The solar absorber’s surface comprises galvanized corrugated sheets that are 1.0 mm thick. The surface is coated matte black to optimize sunlight absorption. Sawdust is used as thermal insulation in between the main frame and the adsorbent surface to reduce heat loss.
  • Drying Room and Trays: The primary structure of the drying room is built using square metal bars measuring 3.0 × 3.0 cm. The dimensions of the drying room are 45 cm in width, 100 cm in length, and 98 cm in height. The drying room’s sides are clad in two layers of galvanized sheets, each 1.00 mm thick. Sawdust is sandwiched between the layers to prevent heat loss via the sidewalls. Trays are used for placing the date fruit samples within the drying room.
  • Automatic Controller: The automatic controller consists of various components, including a channel relay model, an Arduino Uno (ATmega328P, Microchip Technology Inc., Chandler, AZ, USA), a light intensity sensor (model: GL5506, Generic, Chaina), and a weather sensor (model: BME280, Bosch, Gerlingen, Germany). These components help in monitoring and controlling the drying process based on environmental conditions.
  • Photovoltaic Solar Panel: A 100 W photovoltaic solar panel is utilized to generate electricity for powering the ASD.
  • AC Suction Fan: A 50 W AC suction fan is employed to facilitate air circulation within the drying room, aiding in the drying process.
  • Measuring Unit: A DHT-22 measuring unit is used to determine both humidity and air temperature in the drying chamber.

2.3. Experimental Procedure

All tests associated with the drying process were carried out at Aswan University, during October 2023. The drying process and data collection began at 7 a.m. and finished at 5 p.m. for 10 h each day. Every day at 12 p.m., the relative humidity and temperature were measured. Every day at 5 p.m., the sample weight for each variety was measured and recorded.

2.4. Calculations and Measurements

2.4.1. Drying Rate

The drying rate was determined using Equation (3), as reported by [2,67].
D R = M t + d t M t d t
where Mt denotes the moisture content at time ‘t’, while M t + d t denotes the moisture content at t + d t , and dt is the time variation between two subsequent drying period of times.

2.4.2. Moisture Ratio

The moisture ratio (MR) was calculated during the drying tests using the moisture content information collected from the samples at various drying temperatures and time intervals. The following procedure was used to calculate the MR using Equation (4), which is described by Rabha et al. [12],
M R = M t M e M 0 M e  
where ‘t’ is the drying time (day), MR is the moisture ratio, and M0, Me, and Mt are the starting, equilibrium, and moisture content at ‘t’, respectively. Using appropriate mathematical models, the moisture ratio was utilized to investigate the kinetics of date fruit drying. The value of Me can be disregarded, because it is comparatively minor to the values of Mt and M0. Thus, according to Kadam et al. [26], the moisture ratio of dates may be written as
M R = M M 0

2.4.3. Effective Moisture Diffusivity (EMD)

The knowledge of effective moisture diffusivity is imperative in the design and modeling of mass transfer processes, such as the dehydration, adsorption, and desorption of moisture during storage. The Regular Regime approach is commonly used to determine the moisture-dependent diffusivity of food products that contain sugars. This approach considers the negligible influence of initial drying conditions on the drying process, and the concentration at the center of the drying sample changes with time. Desorption (time–weight change) curves are utilized to determine the concentration-dependent effective diffusivity using several methods [68]. Fick’s diffusion equation can be used to characterize the drying properties of biological products during the falling rate period [69]. The sample has been assumed to be initially uniformly distributed with moisture, to have constant thermo-physical properties, to shrink or deform minimally during drying, to have a cylindrical shape, to have negligible resistance to transfer in the medium surrounding the cylinder, to generate negligibly little heat inside the moist sample, and to have negligible radiation effects. The general equation for mass transfer for a cylinder shape is illustrated in Equation (6):
M M 0 = 6 π 2 n = 0 1 n 2 e x p D e f f × n 2 × π 2 × t R 2

2.4.4. Drying Constant (k) (Coefficient)

A mixture of many drying transport parameters, such as moisture diffusivity, thermal conductivity, density, specific heat, interface heat, and mass coefficients, are represented by the drying constant in the context of thin-layer drying [30]. Therefore, applying any transport equation requires an understanding of these material and transport features [70]. The drying time and moisture ratio were found to have an exponential connection, which yielded the drying constant, also known as the coefficient. Furthermore, the determination coefficient was derived from the identical connection for two drying techniques and three distinct date varieties. Thus, drying constants are necessary to completely characterize the dynamics of material drying [71,72], and it was calculated according to [73,74,75]. The drying constant (k) can be calculated using Equation (7).
M R = exp k × t

2.4.5. Mathematical Modeling of Date Drying

The present study aims to evaluate the effectiveness of selected thin-layer drying models in the context of drying data analysis. The models are assessed based on their ability to accurately and efficiently predict the drying behavior of various products. The study conducted by Buzrul [76] identifies certain thin-layer drying models that are deemed inadequate for this purpose and provides reasons for such eliminations. Specifically, the arbitrary use of thin-layer drying models is discouraged, and it is recommended that models with two adjustable parameters be utilized for drying data analysis. Additionally, the study concludes that complex models often result in insignificant parameters and should, therefore, be avoided. Finally, the use of logarithmic transformation in generating heteroscedastic data is found to be inappropriate and, hence, must be avoided. These findings demonstrate the importance of selecting appropriate models for thin-layer drying data analysis, which can help ensure the accuracy and efficiency of the predictions.
Table 1 shows numerous thin-layer drying models used to analyze and describe the experimental data gathered during the drying process. These models were fitted to the experimental data for each drying process. The coefficients of the models were obtained using non-linear regression analysis in Microsoft Excel. The most effective model was chosen using parameters like the lowest chi-square (χ2), RMSE (root-mean-square error), and the highest R2 (coefficient of determination). The model that best matches the experimental data was identified using the previously indicated criteria [57,58,59].
Equations (8)–(10) can be used to compute these parameters in accordance with [12,77,78,79,80,81],
R 2 = 1 i = 1 N ( M R p r e ,   i M R o b s ,   i ) 2 i = 1 N ( M ¯ R p r e M R o b s ,   i ) 2  
χ 2 = 1 i = 1 N ( M R p r e ,   i M R o b s ,   i ) 2 N n
R M S E = 1 N i = 1 N ( M R p r e ,   i M R o b s ,   i ) 2
The ith experimental and expected values are represented by M R o b s ,   i and M R p r e ,   i , respectively, whereas M ¯ R p r e   represents the average predicted value. Wang et al. [82] defined N as the number of observations and n as the number of constants in a model.
Table 1. Selected mathematical modeling to demonstrate the drying process of dates.
No.Model NameModel Equation *References
1Newton (Lewis) M R = e x p k t [83]
2Page M R = e x p k t n [84,85]
3Modified Page III M R = k   exp t d 2 n [29]
4Henderson and Pabis M R = a   exp k t [59,86]
5Modified Henderson and Pabis M R = a exp k t + b   e x p g t + c   e x p h t [70]
6Two-term M R = a exp k 0 t + b   e x p k 1 t [87]
7Two-term Exponential M R = a exp k t + 1 a e x p k a t [57,88]
8Approximation diffusion or Diffusion Approach M R = a exp k t + 1 a e x p k b t [89,90]
9Logarithmic M R = a exp k t + c [91]
10Combined Two-term and Page M R = a   e x p k t n + b   e x p h t n [92]
11Simplified Fick’s Diffusion M R = a exp c t L 2 [93]
12Logistics M R = b 1 + a exp k t   [94]
* MR is the moisture ratio (dimensionless); L is the slab thickness (m); the drying constants are k, k0, and k1 (day−1); the model constants are a, b, c, d, g, h, and n (dimensionless); the drying time is t (day).

2.5. Economic Analysis

From the standpoint of commercial viability, the economic analysis of the ASD was carried out, and the commercial sustainability was computed. The estimation of the economic performance criteria is based on the Egyptian financial climate. ELkhadraoui et al. [95], Mohammed and Al Dulaimi [96], and Singh and Gaur [97] identified the annualized cost of drying, payback time, and net present value as the major performance indicator criteria that determine economic performance. The parameters given in Equation (11) were used to compute the ASD annualized investment cost (Ca).
C a = C a c + C m V a
where Cac represents the yearly capital cost, Va represents the salvage value of the ASD, and Cm represents maintenance expenses, which are deducted 8% of the annual capital cost.
C a c = C c c × F c
F c = d 1 + d n 1 + d n 1  
whereby the operational life is considered to be equal to 10 years for the ASD and 20 years for the PV system, and Ccc is the ASD total capital cost. Fc is the capital recovery factor, and d is the interest rate (equal to 20%).
According to [1,95,96,97,98,99], and other sources, the drying cost per kg of date fruit within the ASD (CS) is computed as
C s = C a M y    
The annual quantity (My) of dried date fruit inside the ASD is computed as
M y = M d × D D d  
where D is the number of days the ASD is open each year, Md is the amount of date fruit dried within the ASD every batch, and Dd is the drying time per batch.
According to [95,96,97], the price of one kilogram of the dried date fruit product is as follows:
C d s = C d p + C s
where Cdp is the price of fresh date fruit per kilogram of dried product.
C d p = C f d × M f M d  
where Mf is the quantity of fresh date fruit placed into the ASD, and Cfd is the fresh date fruit cost.
The savings made on one kilogram of dried date fruit (Skg) are represented by Equation (18),
S k g = S P c C d s
The selling price of dried date fruit per kilogram is denoted as SPc.
The amount saved by ASD application for each batch of date fruit drying (Sb) is denoted by Equation (19),
S b = S k g × M d  
However, the daily savings (Sd) derived from the ASD can be obtained by Equation (20),
S d = S b D  
The savings from the ASD following j years is obtained by Equation (21),
S j = S d × D × 1 + j j 1  
The payback time (N) for the ASD is obtained according to the recommendation by [95,96,97,100],
N = l n 1 C c c S 1 d i ln 1 + i 1 + d  
where i represents the inflation rate (which is equal to 39.7%), and S1 is the ASD savings after the very first year.

2.6. Environmental Analysis

2.6.1. Specific Energy Consumed (SEC)

The SEC for drying the different date fruit varieties is obtained by the following Equation (23), according to [101].
S E C = E i n M o u t  
where Ein is the input energy to the drying chamber, and Mout is the moisture removed from the date fruit varieties.

2.6.2. Energy Analysis

The solar collector’s energy input ( E i n . c   i n   J ) is stated in the approach given by [102,103],
E i n . c = A c 0 t I n s c t d t  
The following is the energy output ( E o u t . c   i n   J ) from the solar air collector according to [102,103],
E o u t . c = 0 t m ˙ t × C p a T c T i n   d t  
where Ac is the solar collector’s surface area, measured in m2, I n s c is the solar intensity, expressed in W/m2, m is the mass air flow rate, expressed in kg/s, Cpa is the air’s specific energy, expressed in kJ/kg·k, and T c T i n is the temperature differential, expressed in k.

2.7. Embodied Energy

Table 2 shows the embodied energy of several materials utilized in the tunnel drying system. Embodied energy is the whole amount of energy necessary to produce an object, good, or service. The table shows the embodied energy values for various materials used in the tunnel drying system.

2.7.1. Time of Energy Payback (Ep)

The time of energy payback is defined as the time needed to repay the embodied energy of the developed ASD and computed using Equation (26) [105]:
E p = E m E a o
where Em denotes the embodied energy, and it was listed in Table 2, kW·h, and Eao is the yearly energy output, kW·h.

2.7.2. CO2 Emission

The emission of the CO2/year ( E C O 2 ) can be determined as described by [105]:
E CO 2 = E m × 0.98 n s y s .  
where n s y s .   is the ASD lifetime, where it was assumed to be 10 years.

2.7.3. Carbon Mitigation

In this study, to lessen CO2 emissions and reduce the carbon footprint, the ASD was powered by a photovoltaic (PV) system. The ASD runs entirely on solar power and does not need any other energy sources to function. It is non-polluting and ecologically benign because of its features. The knowledge of the yearly CO2 emissions related to ASD development is crucial for evaluating its environmental effect. The embodied energy required to manufacture a solar collector, a drying chamber, and a PV system, among other ASD components, is listed in Table 2. The potential for climate change is gauged by CO2 mitigation. In comparison to conventional fuel systems utilized for air heating and electricity production, CO2 emissions are considerably reduced by using solar thermal energy and a photovoltaic system to power the ASD. Cumulative CO2 mitigations are documented per kilowatt-hour in comparison with alternative power generating systems. When a customer uses a unit of electricity and the losses from the subpar household equipment are La (taken as 10%), the amount of power delivered is equal to 1 1 L a units. Assuming 45% losses in both distribution and transmission (Ltd), the power plant generates electricity in units of 1 1 L a × 1 1 L t d . An average CO2 equivalent intensity of 0.98 kg/kWh is demonstrated when coal is used to generate electricity at the source.
Thus, for the unit electricity consumption by a user utilizing a PV system,
T h e   C O 2   m i t i g a t i o n   p e r   k W h   o f   t h e   d r y e r = 1 1 L a × 1 1 L t d × 0.98  
According to Nayak et al. [107], the CO2 mitigation throughout the system lifespan is as follows:
T h e   C O 2   m i t i g a t i o n   o v e r   t h e   s y s t e m   l i f e t i m e   k g = E i n × 1 1 L a × 1 1 L t d × 0.98
The difference between the total CO2 emissions included in the dryer and the total CO2 emissions’ mitigation potential was used to calculate the net reduction in CO2 emissions during the solar dryer’s lifetime.
Net mitigation over the lifetime (kg) = Total CO2 mitigation—Total CO2 emission
Net   mitigation   over   the   lifetime   ( kg ) = E o u t × n s y s . × 1 1 L a × 1 1 L t d × 0.98 E i n  
where Eout is the dryer’s annual thermal output (kWh), nsys is the system lifespan (considered as 20 years for a PV system and 10 years for an ASD), and Ein is an input of the embodied energy (kWh) for the PV-powered ASD (Table 2).

2.8. Annual Thermal Outputs

An integrated solar dryer’s annual energy production is calculated by adding the net electricity produced by PV panels and the thermal output produced by the dryer [107]. This is where Equations (32) and (33) of [108] may be used to determine the net daily average electrical output (PDN) and the net annual average electrical output (PNA) from a PV panel.
P N D = P P V ,   o u t P l o a d ,   o n
P N D = F F × I S C × V O C ( I L × V L )   =   26.4   W
where P P V ,   o u t is the output power from the PV system, W, and P l o a d ,   o n is the power consumed by the air suction fan, W.
P N A = P N D × N d y × d p s × 10 3   = 26.4 × 300 × 8 × 10 3   =   63.36   kW · h / year
where Ndy is the annual number of days with sunlight, day/year, and dps is the daily peak sunshine hours, h/day, and the daily peak sunlight hours (h/day) are represented by dps.
As stated by Eltawil et al. [108], the following equation can be used to obtain the net average equivalent thermal output per year ( P N A ,   a v e ),
P N A ,   a v e = P N A 0.38 = 63.36   kW · h / year 0.38 = 166.74   k W · h / year
The thermal output of the ASD per day (Eth,D) was calculated as stated by Eltawil et al. [108].
E t h , D = M e v . × h L 3.6 × 10 6
where hL is the latent heat, expressed in terms of J/kg, and Mev is the moisture evaporated, expressed in kilograms.
The ASD’s annual thermal output (Eth,y) was determined as recommended by Eltawil et al. [108].
E t h , y = E t h , D × N d y  
Therefore, the ASD’s annual thermal output (Eth,y) can be estimated by Equation (36).
E T t h , y = P N A ,   a v e + E t h , y  

3. Results and Discussion

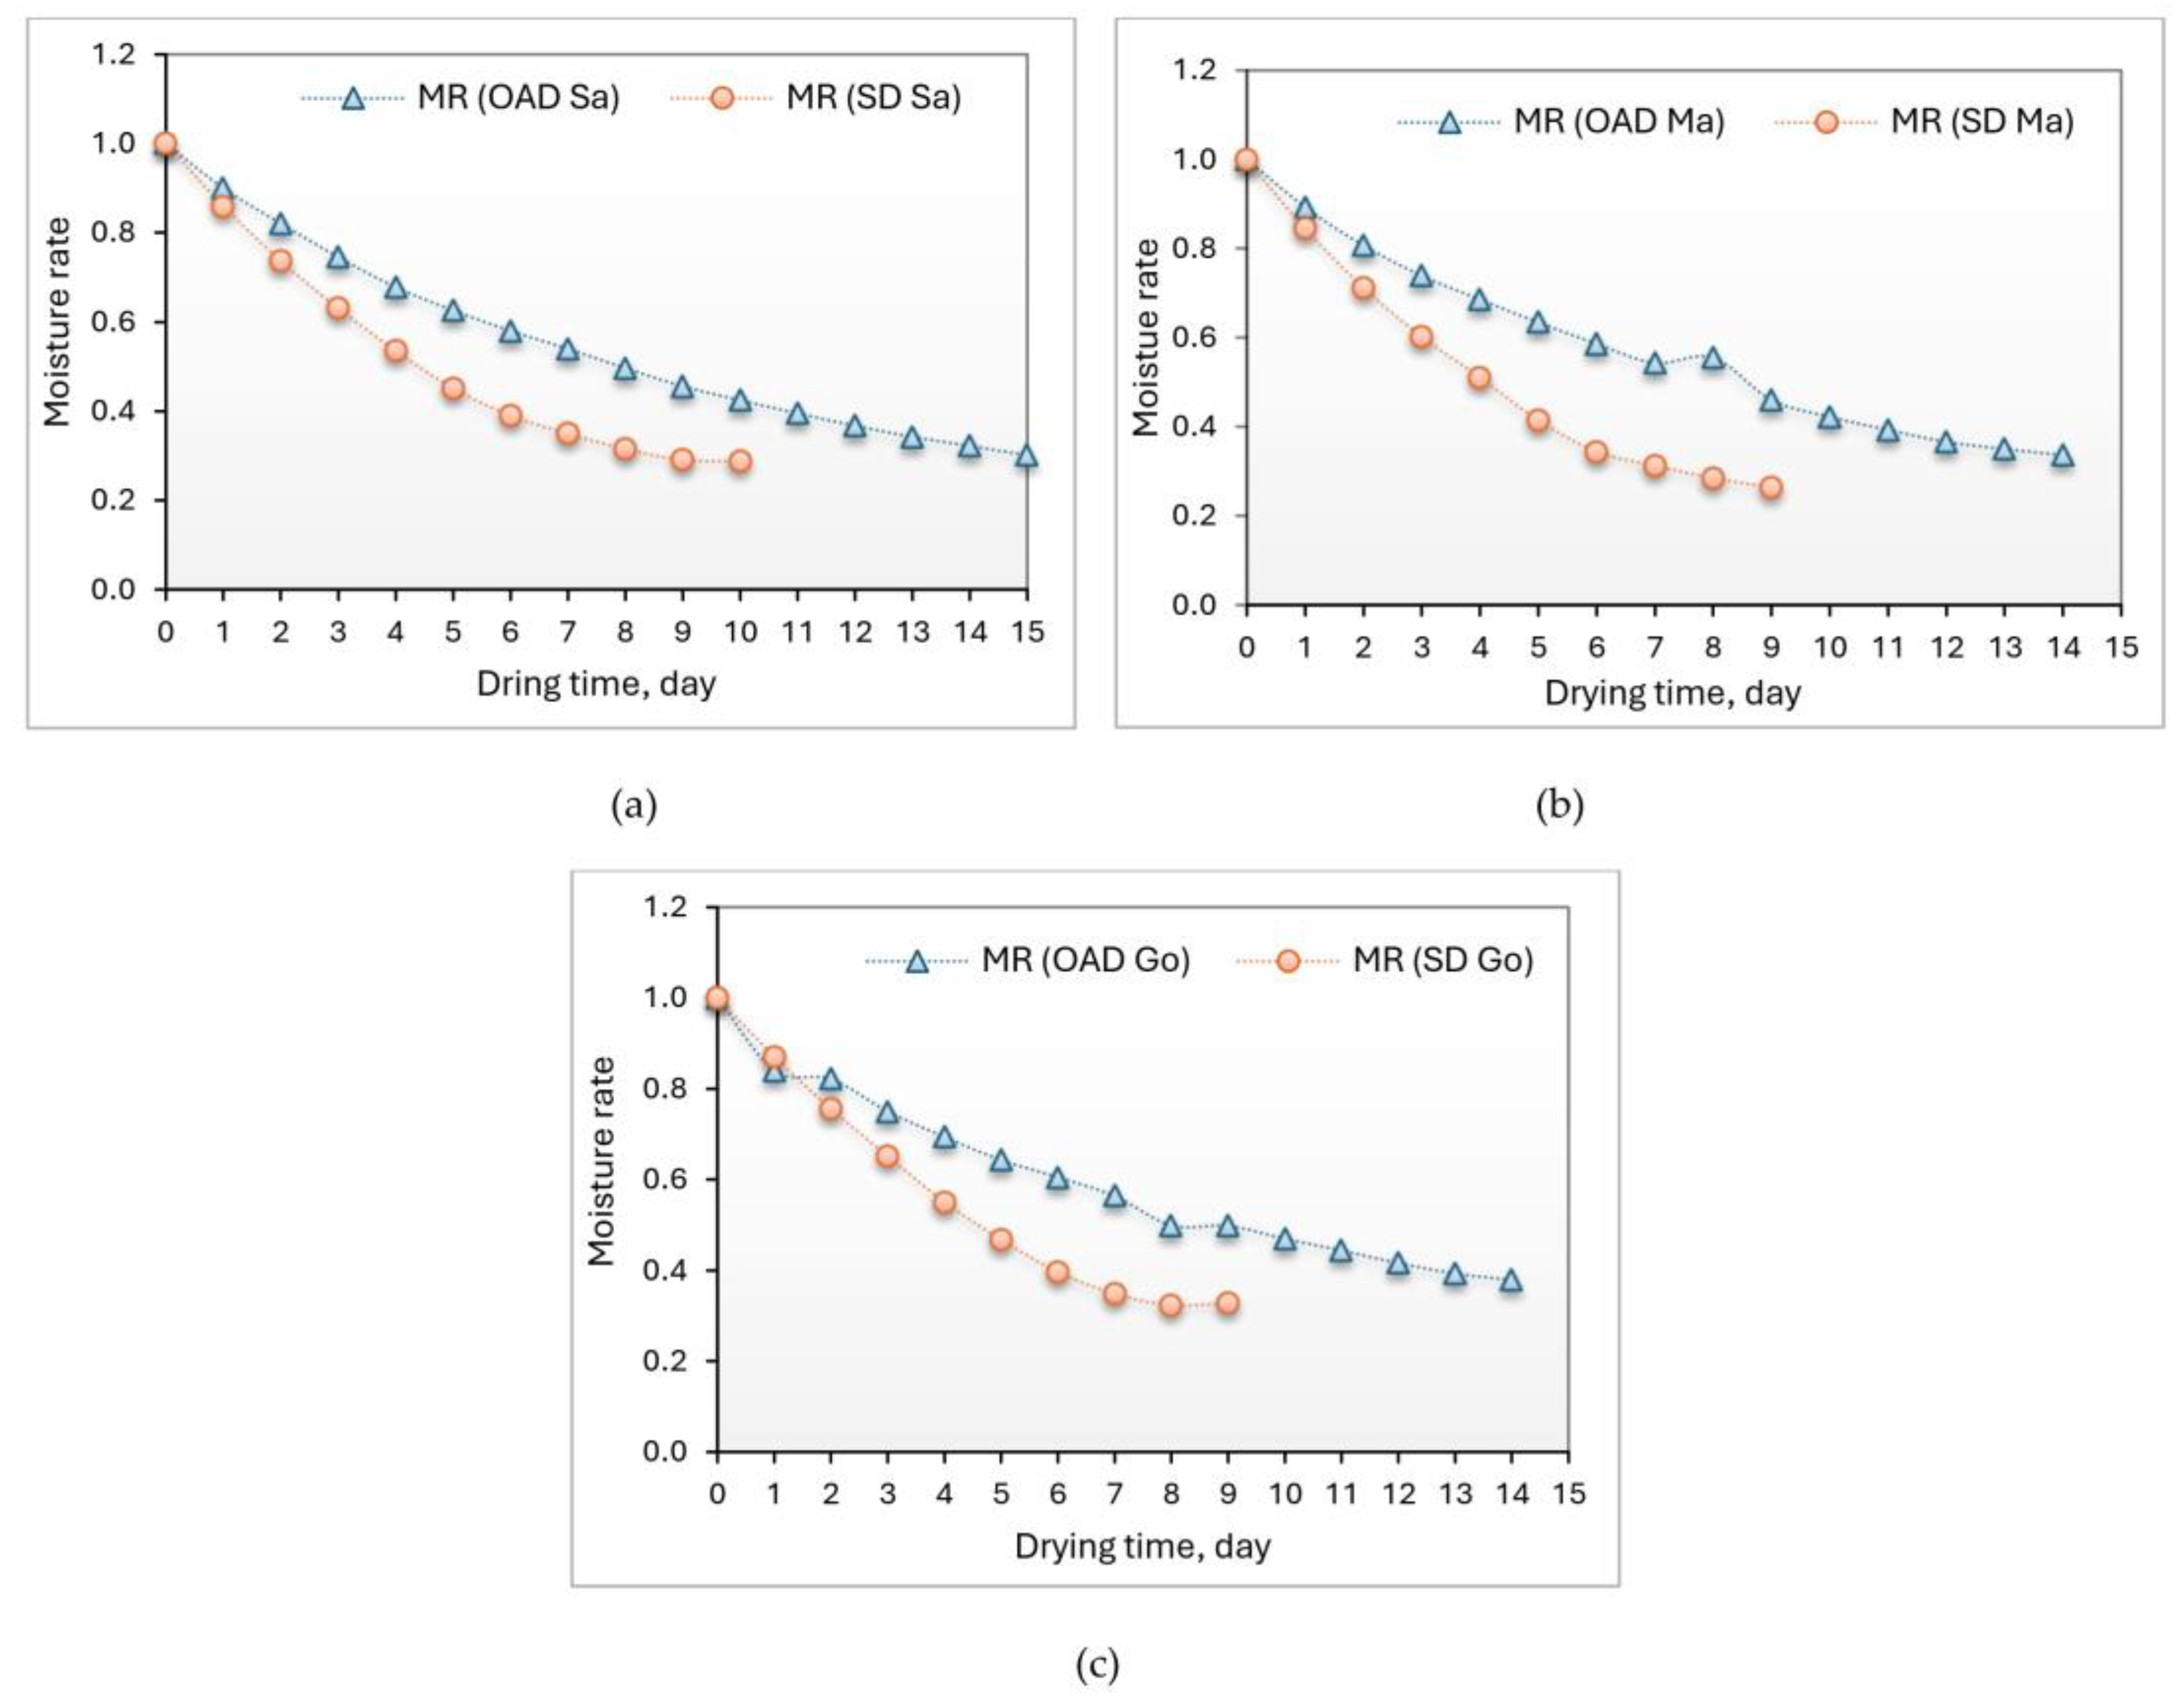
3.1. Moisture Content
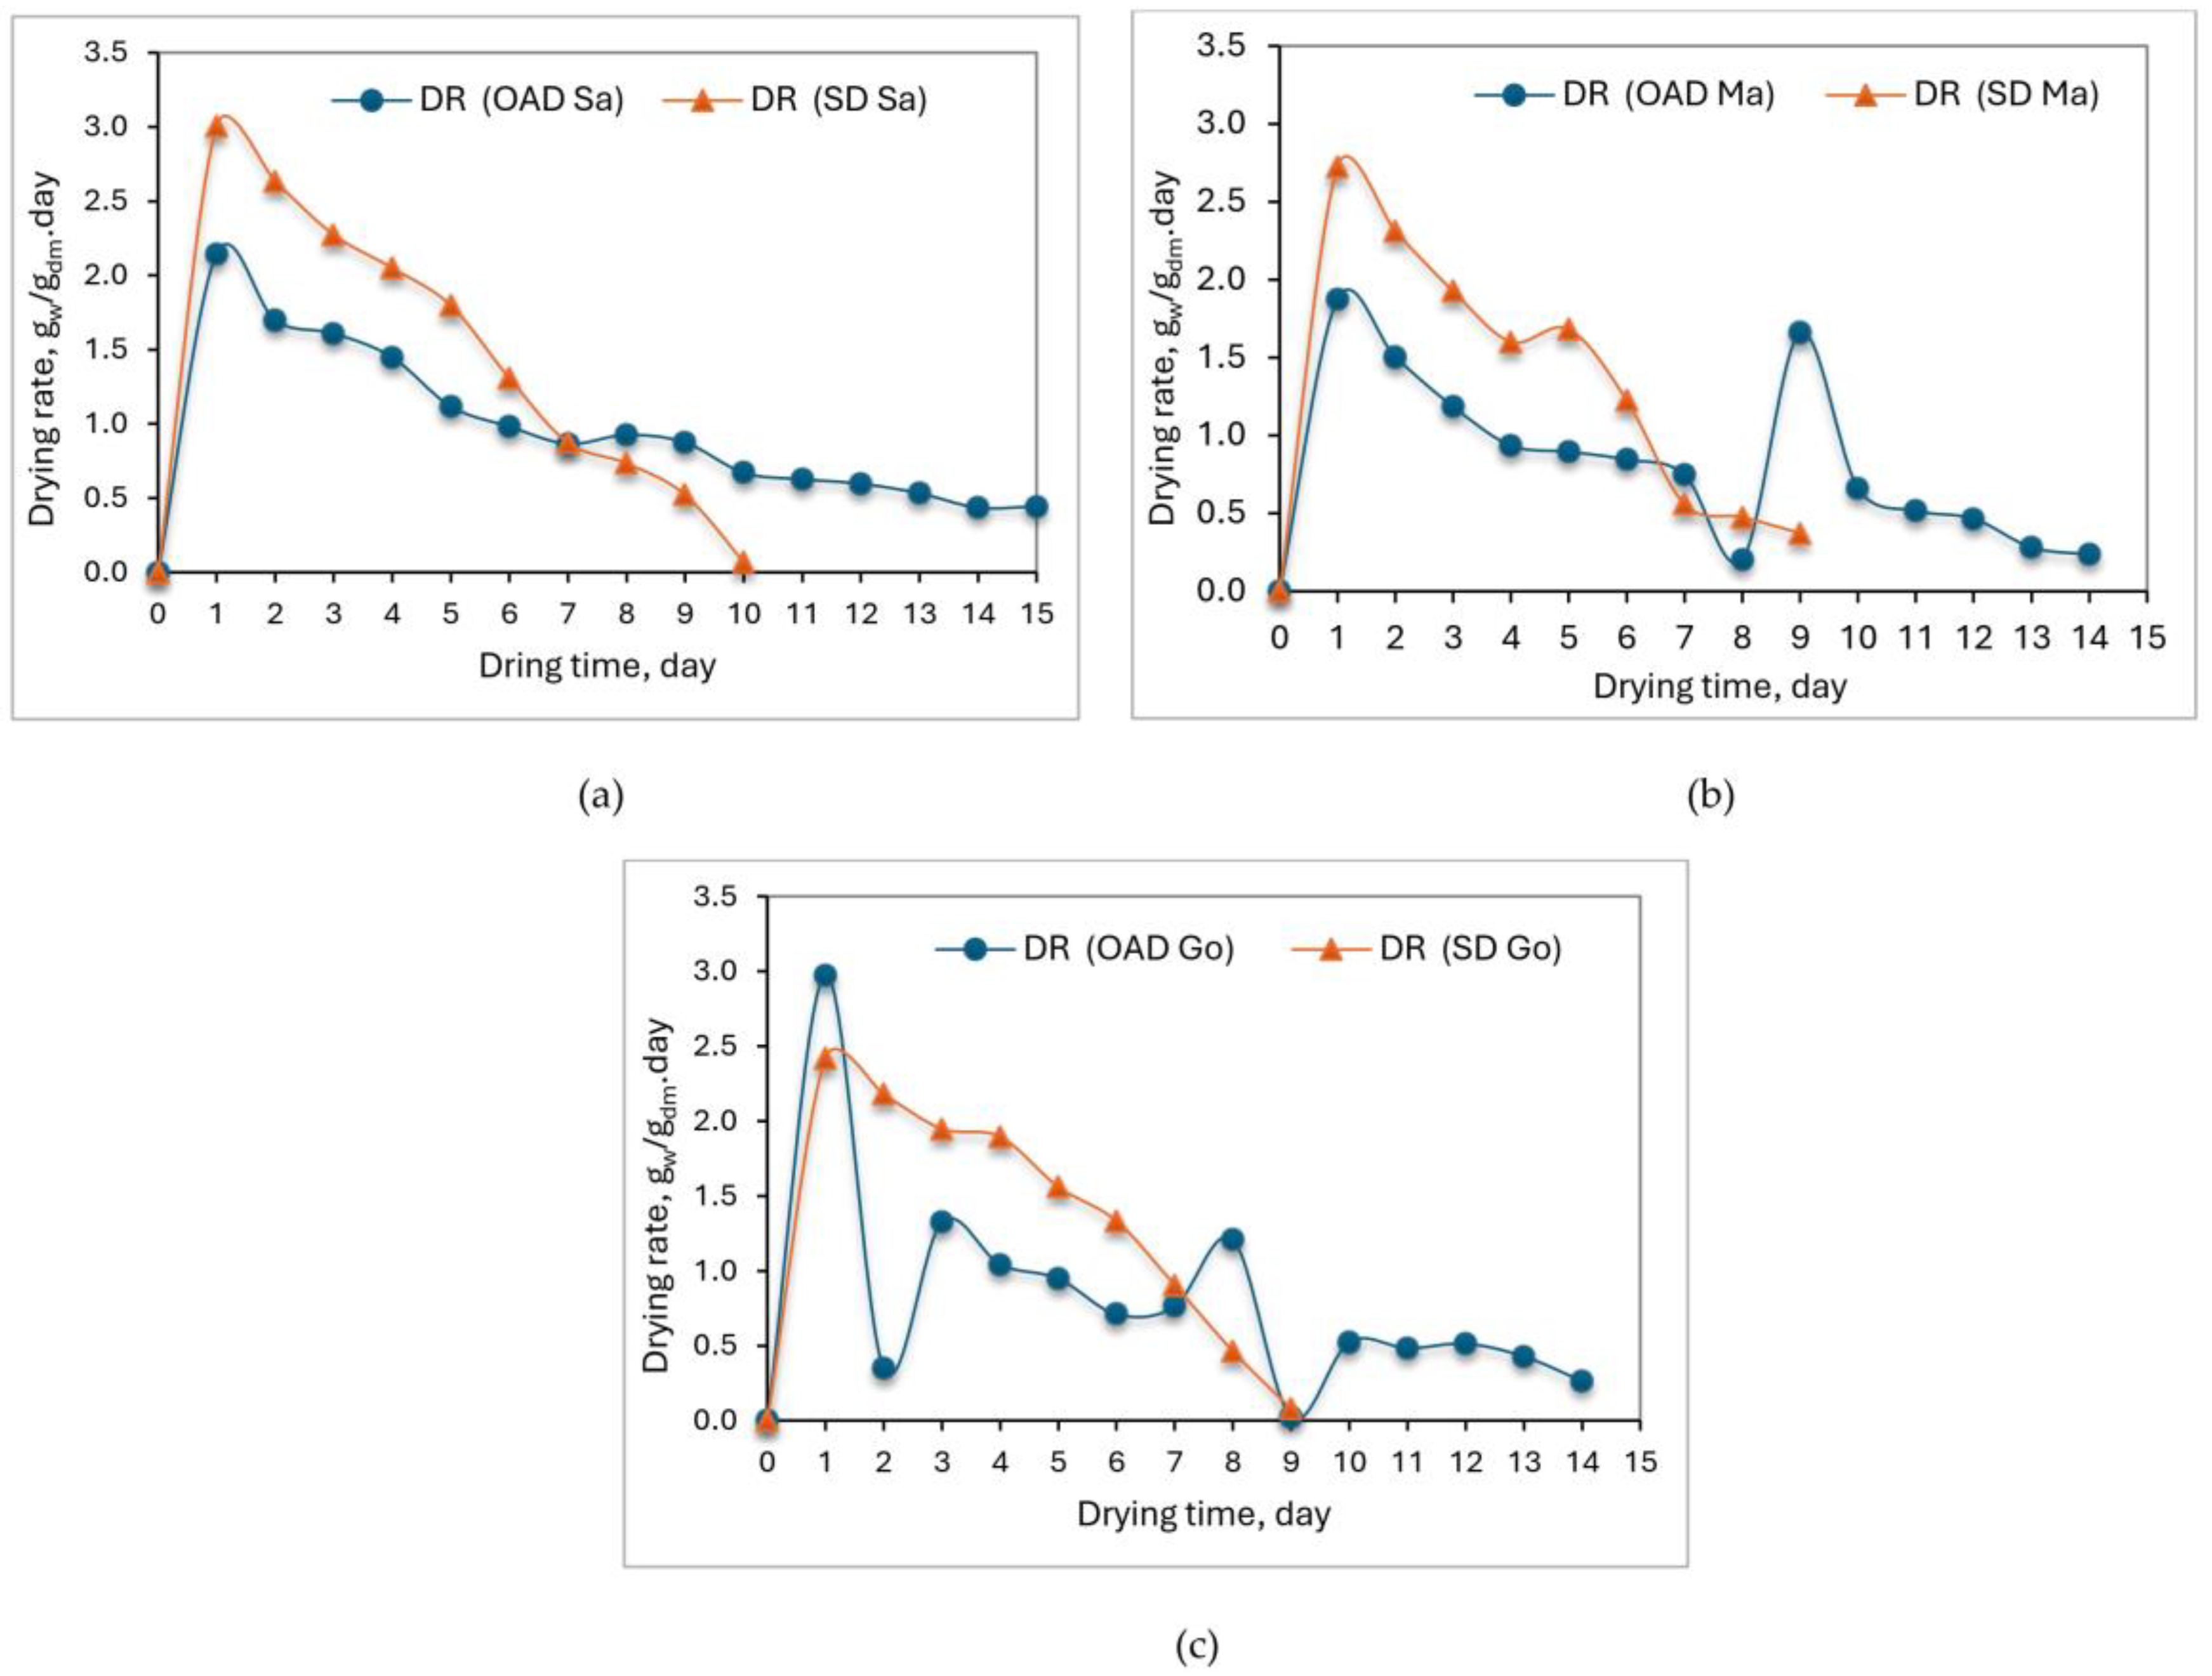
The preliminary MC in different date fruit varieties used in the current study was estimated under laboratory conditions at the Food Science and Technology Lab, Aswan University. The initial moisture content in dry basis in Sakkoti, Malikabii, and Gondila prior to the drying process was 17.64%, 14.89%, and 15.68%, respectively, while the final moisture content was 6.06%, 5.56%, and 6.58% in dry basis in Sakkoti, Malikabii, and Gondila, respectively, as shown in Figure 3. Elghazali et al. [109,110] stated that the MC (d.b.) of fresh and dried date varieties Sakkoti, Bartamuda, Gondaila, Malikabii, and Shamia was 18.28% and 4.16%, 19.49% and 3.25%, 14.38% and 3.35%, 13.47% and 3.48%, and 17.20% and 4.93%, respectively.
Based on the average weight of the date fruit samples, the moisture rate was computed and plotted against time, as Figure 1 illustrates. The other samples, which dried in the open, had a lower moisture rate than the ASD-dried date fruit samples. In contrast to the varied date samples that dried in the ASD for 9 days, the drying process in the open-air samples took up to 15 days to achieve EMC. According to Sengkhamparn et al. [111], Deng et al. [112], and Kamal et al. [113] the lowest moisture rate aided in hastening the drying process, making it simpler to remove moisture and reducing the drying period. Furthermore, drying time curves demonstrated a substantially quicker reduction in the MR during the first drying phase and a slower decline subsequently, according to Ambawat et al. [2]. Table 3 lists the drying coefficient (k) and determination coefficient (R2) for the Sakkoti, Malkabii, and Gondaila date fruit varieties along with their corresponding drying techniques. Compared to OAD, the drying coefficient (k) increases, as the drying air temperature within the ASD rises. These findings conformed well to the comparable pattern observed in the drying rate data. Doymaz [114], Kaleta et al. [115], and Meziane [116] had similar observations.

3.2. Drying Rate

The data on the moisture content of date fruits over time were transformed into a dimensionless metric known as the moisture ratio against time to standardize the drying curves. Figure 4 shows the differences in the drying rate for different types of date fruits as a function of drying time. The results are consistent with those of He et al. [117], who found that drying rates often decreased as the moisture content dropped. Figure 4 demonstrates that a significant amount of moisture was lost during the decreasing rate phase, which is consistent with other studies [25,38,65,117,118,119,120,121,122,123,124,125,126,127].
The plotted data in Figure 4 show that the solar-dried date fruit samples had the highest drying rate in comparison with the date fruit samples dried in the open air. In this experiment, the highest drying rate was approximately 3.0 gwater/gdry matter.day in the solar-dried Sakkoti variety, followed by the Malkabii variety, while the lowest drying rate of the solar-dried date fruit samples was 2.4 gwater/gdry matter.day with the Gondaila variety. This phenomenon is due to the fact that the increase in temperature in the solar dryer compared to drying in the open air increases the drying rate, and this result is consistent with [2,7,117,128].

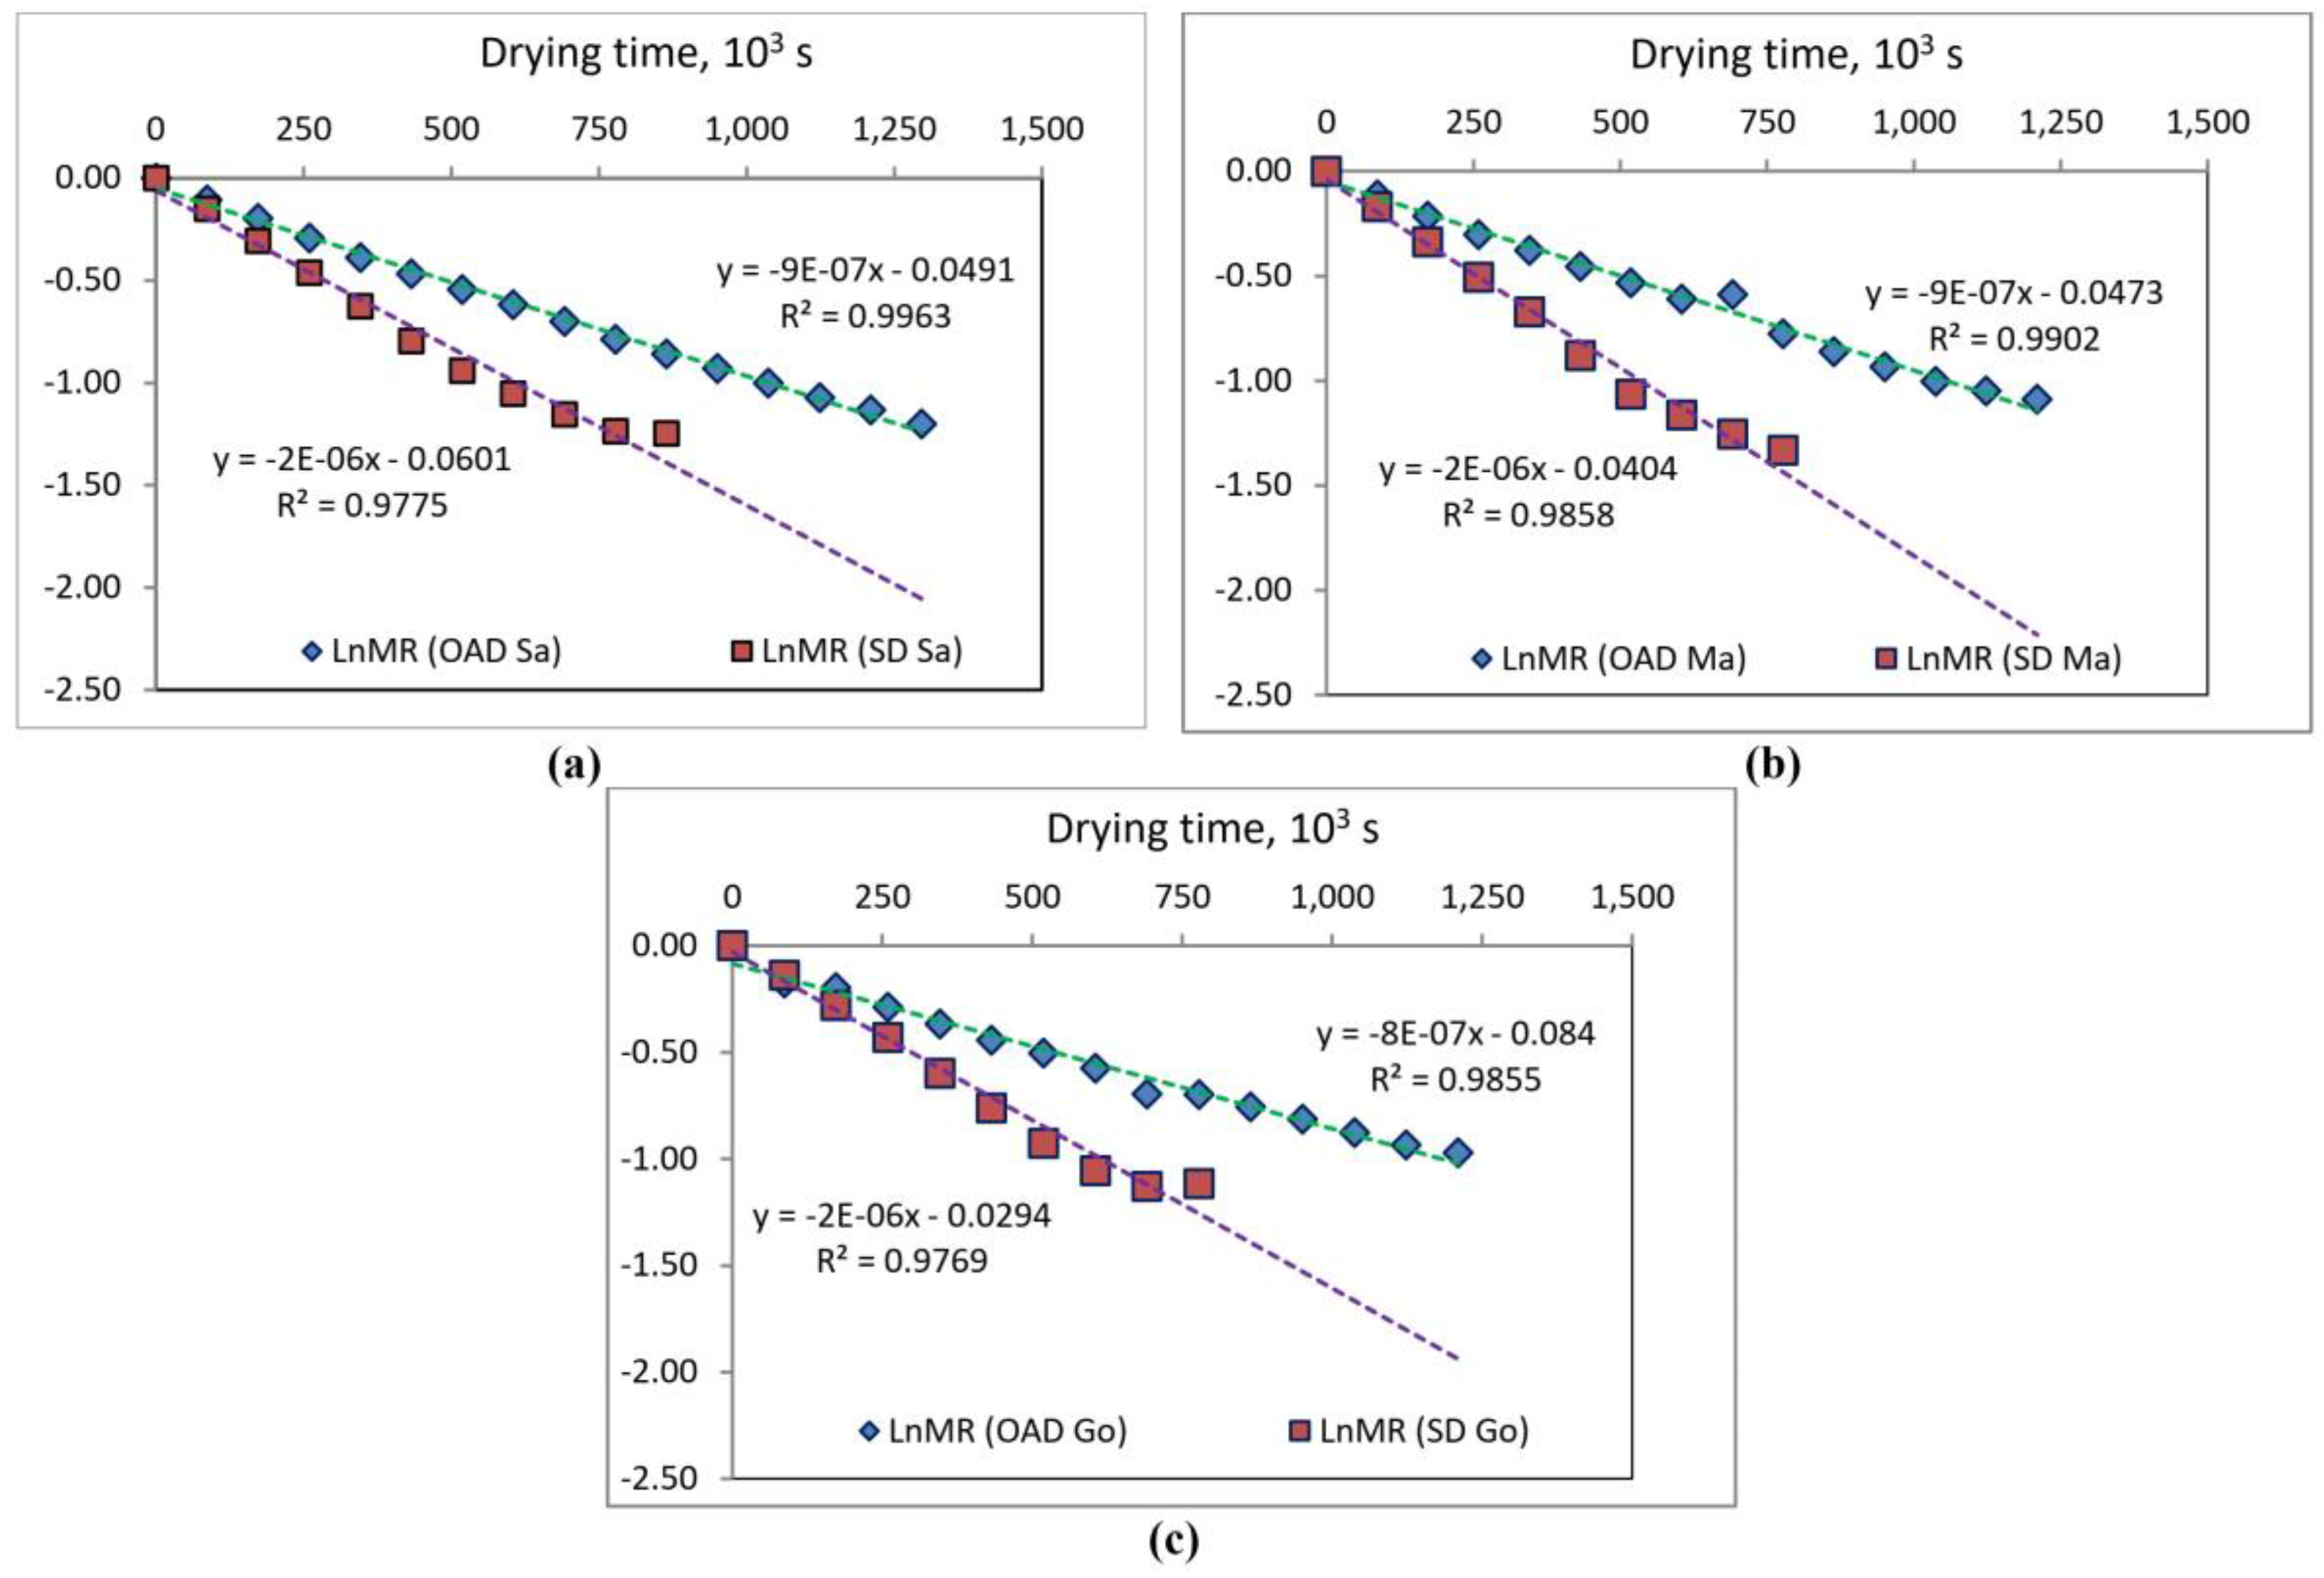
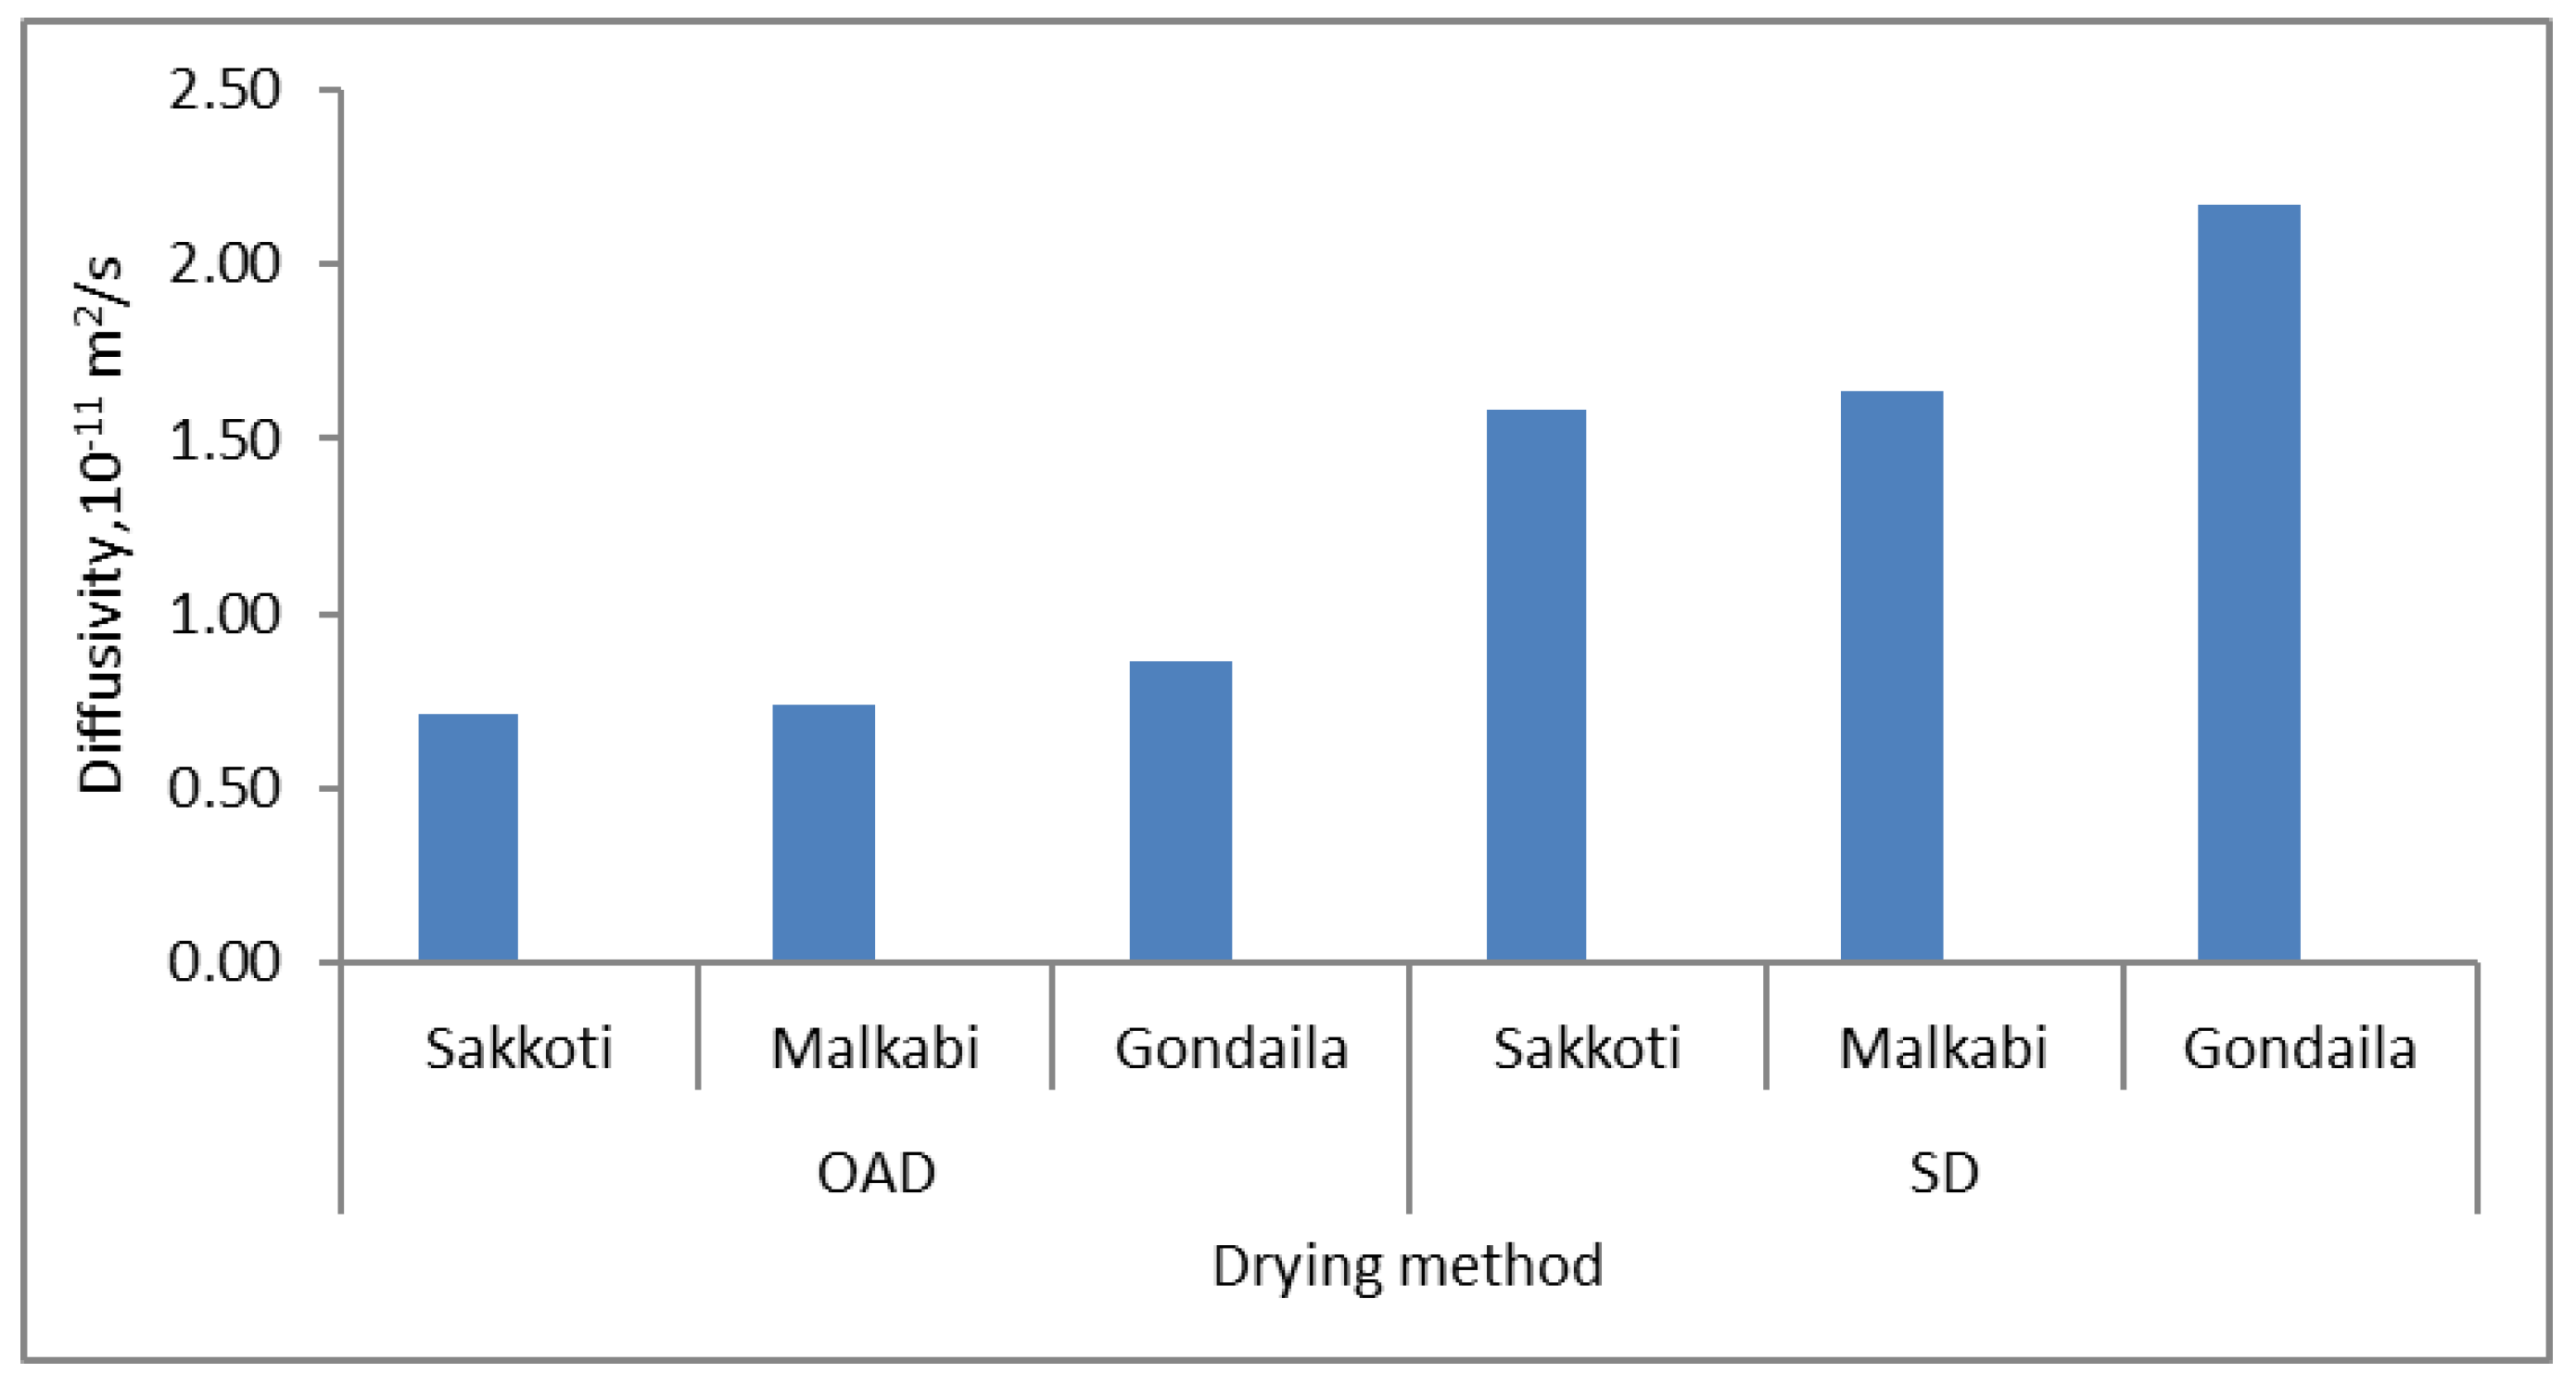
3.3. Effective Moisture Diffusivity (EMD)

Figure 5 shows the EMD of many date fruit varieties, including Sakkoti, Malkabii, and Gondaila, during OAD and SD. According to Touil et al. [129], the EMD value is affected by the shorter distance that the moisture must travel before evaporating into the surrounding atmosphere. Moisture gradients that are formed inside the food during the drying process cause strains to develop in the cellular structure. As noted by Mayor and Sereno [130], this may lead to the collapse of the structure, resulting in physical changes such as modifications to the material’s volume, form, or dimensions. The period of time that moisture diffuses from the food’s inside to its outside is impacted by the rupture of cell walls. (Figure 6). As indicated by Touil et al. [129], this feature should be included in mathematical models to guarantee precise forecasts of the sample moisture content during drying or to ascertain the appropriate EMD. Numerous parameters, including the pre-treatment solution, AT, and the characteristics of the dried materials, had an impact on the EMD [15,131]. Due to the greater air temperature within the ASD, the largest EMD was discovered in the current study when comparing the dry date fruit samples outside with the SD date fruit samples.
In addition, the EMD values for different date fruit varieties had a similar value for both drying systems, where the EMD was 7.14 × 10⁻¹² m2/s and 2.17 × 10⁻¹¹ m2/s for different dried date fruit varieties by ASD and OAD, respectively. (Table 4).

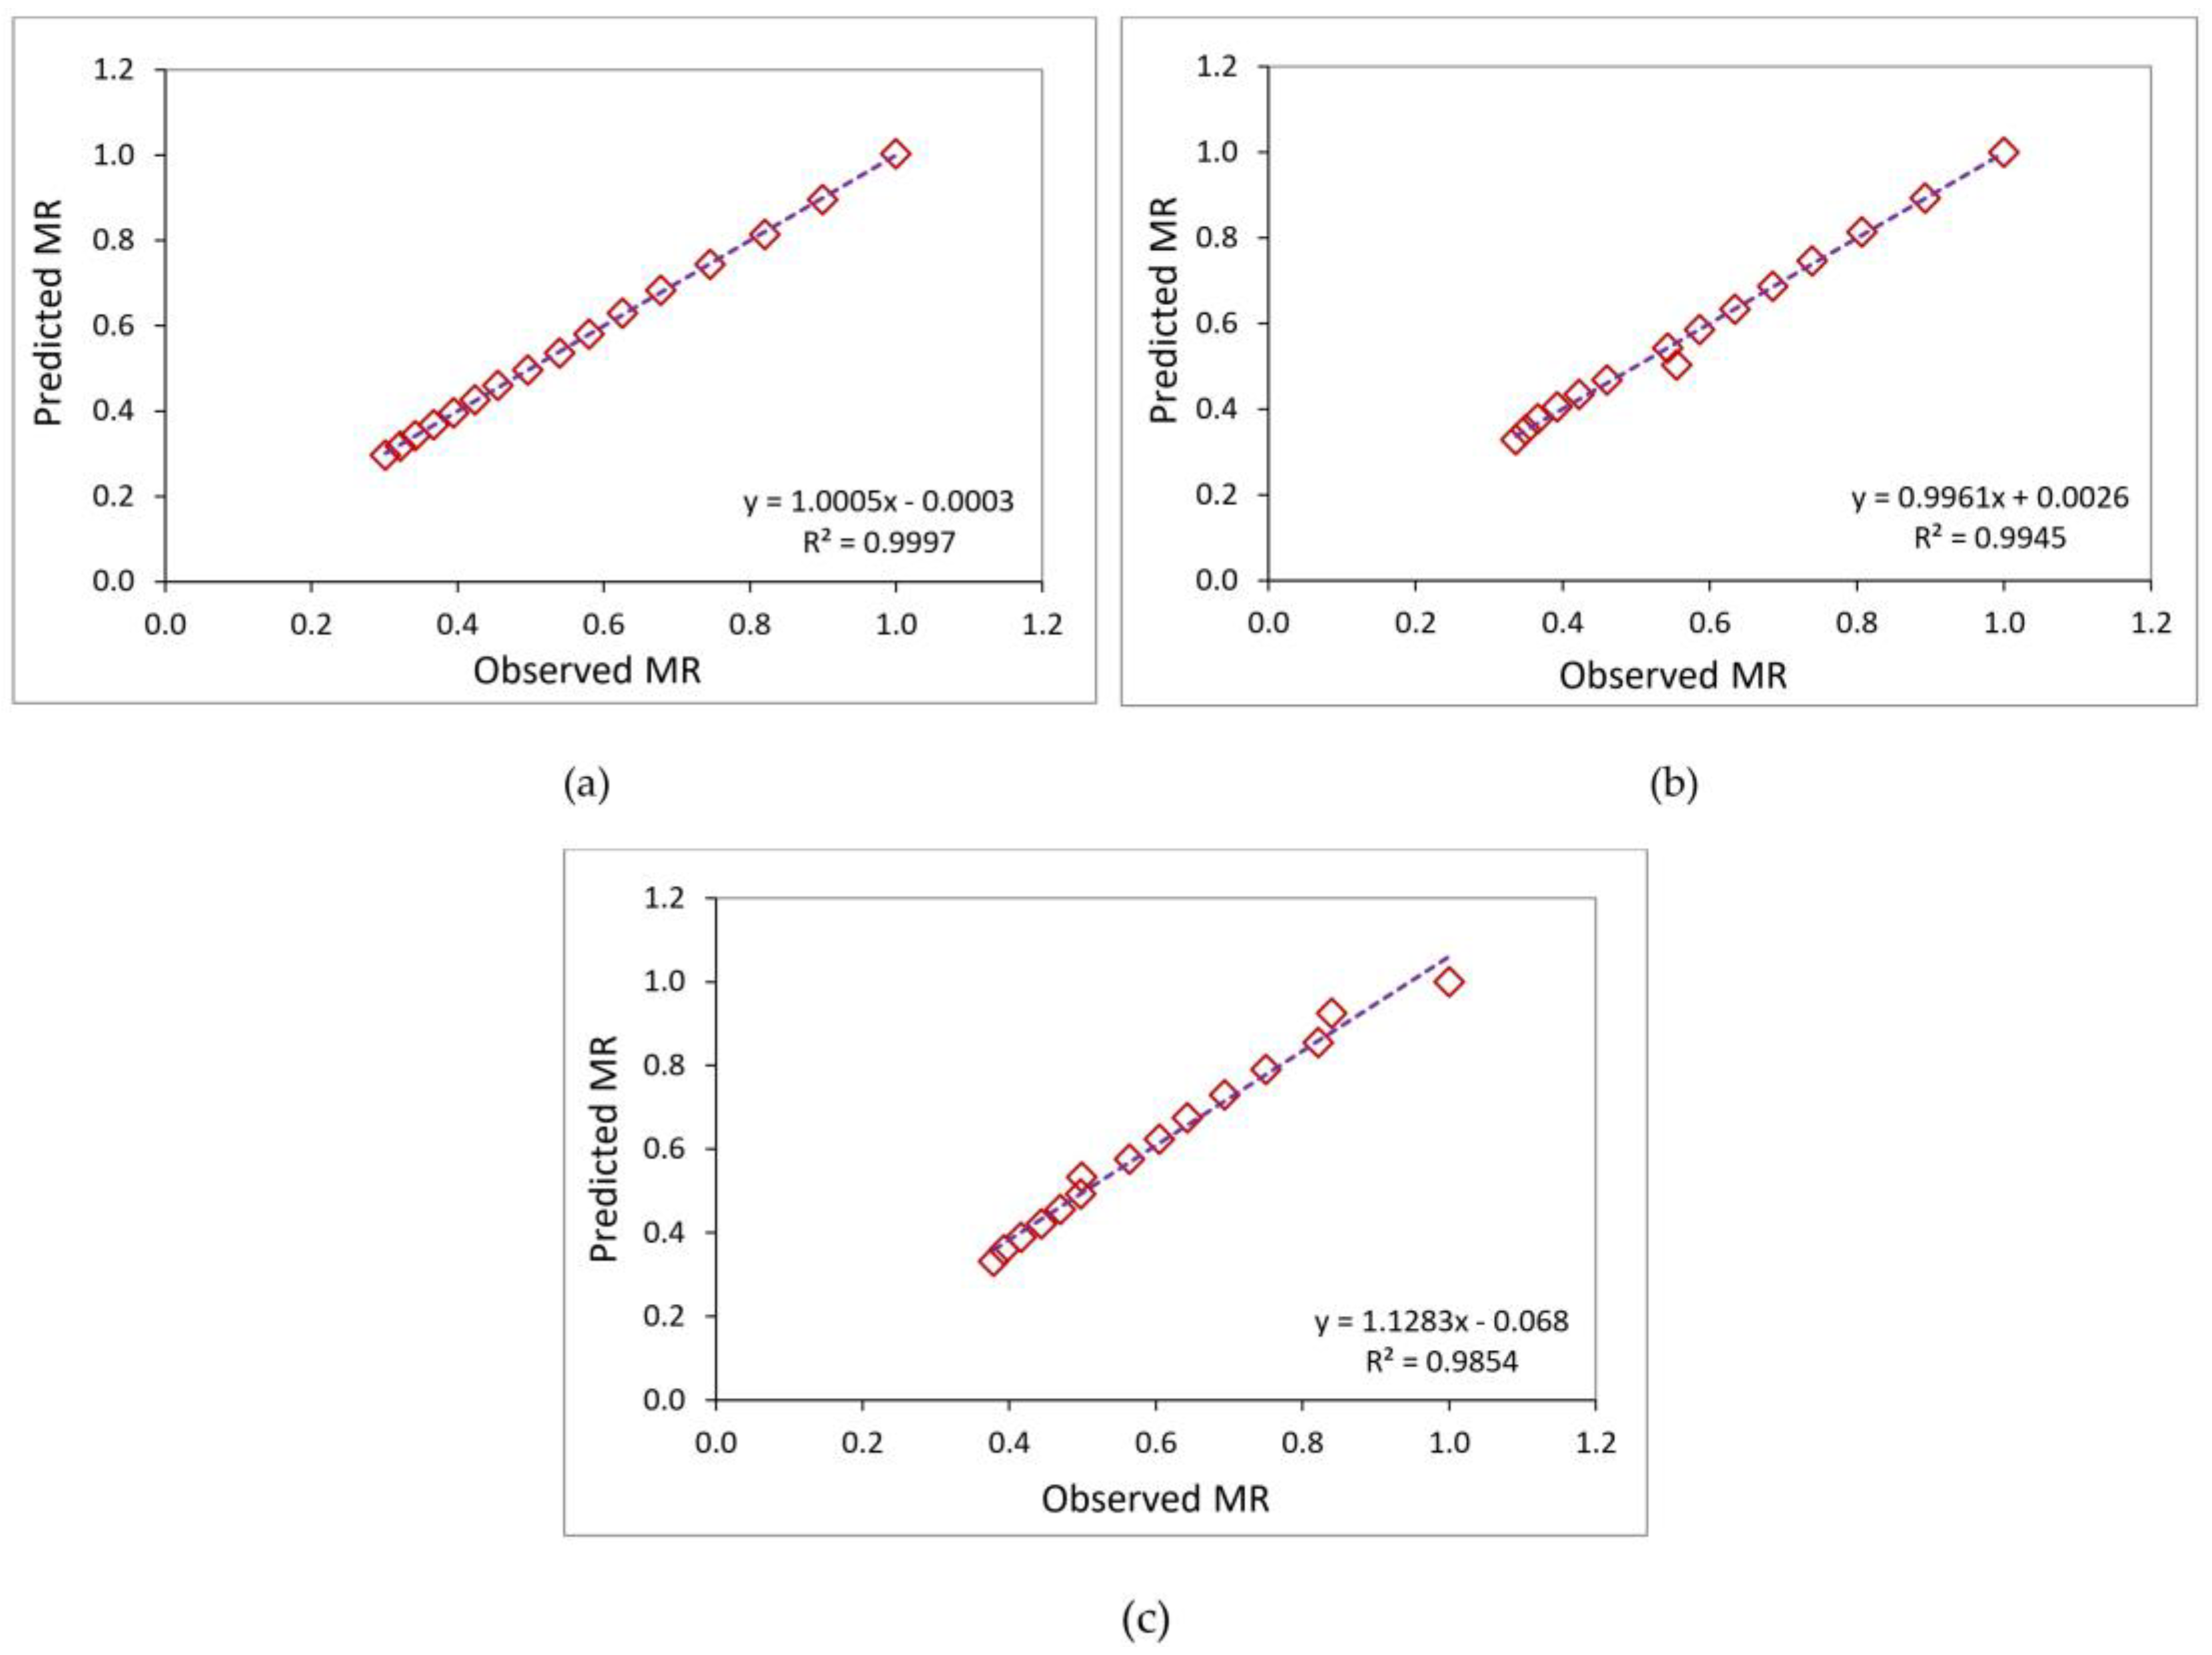
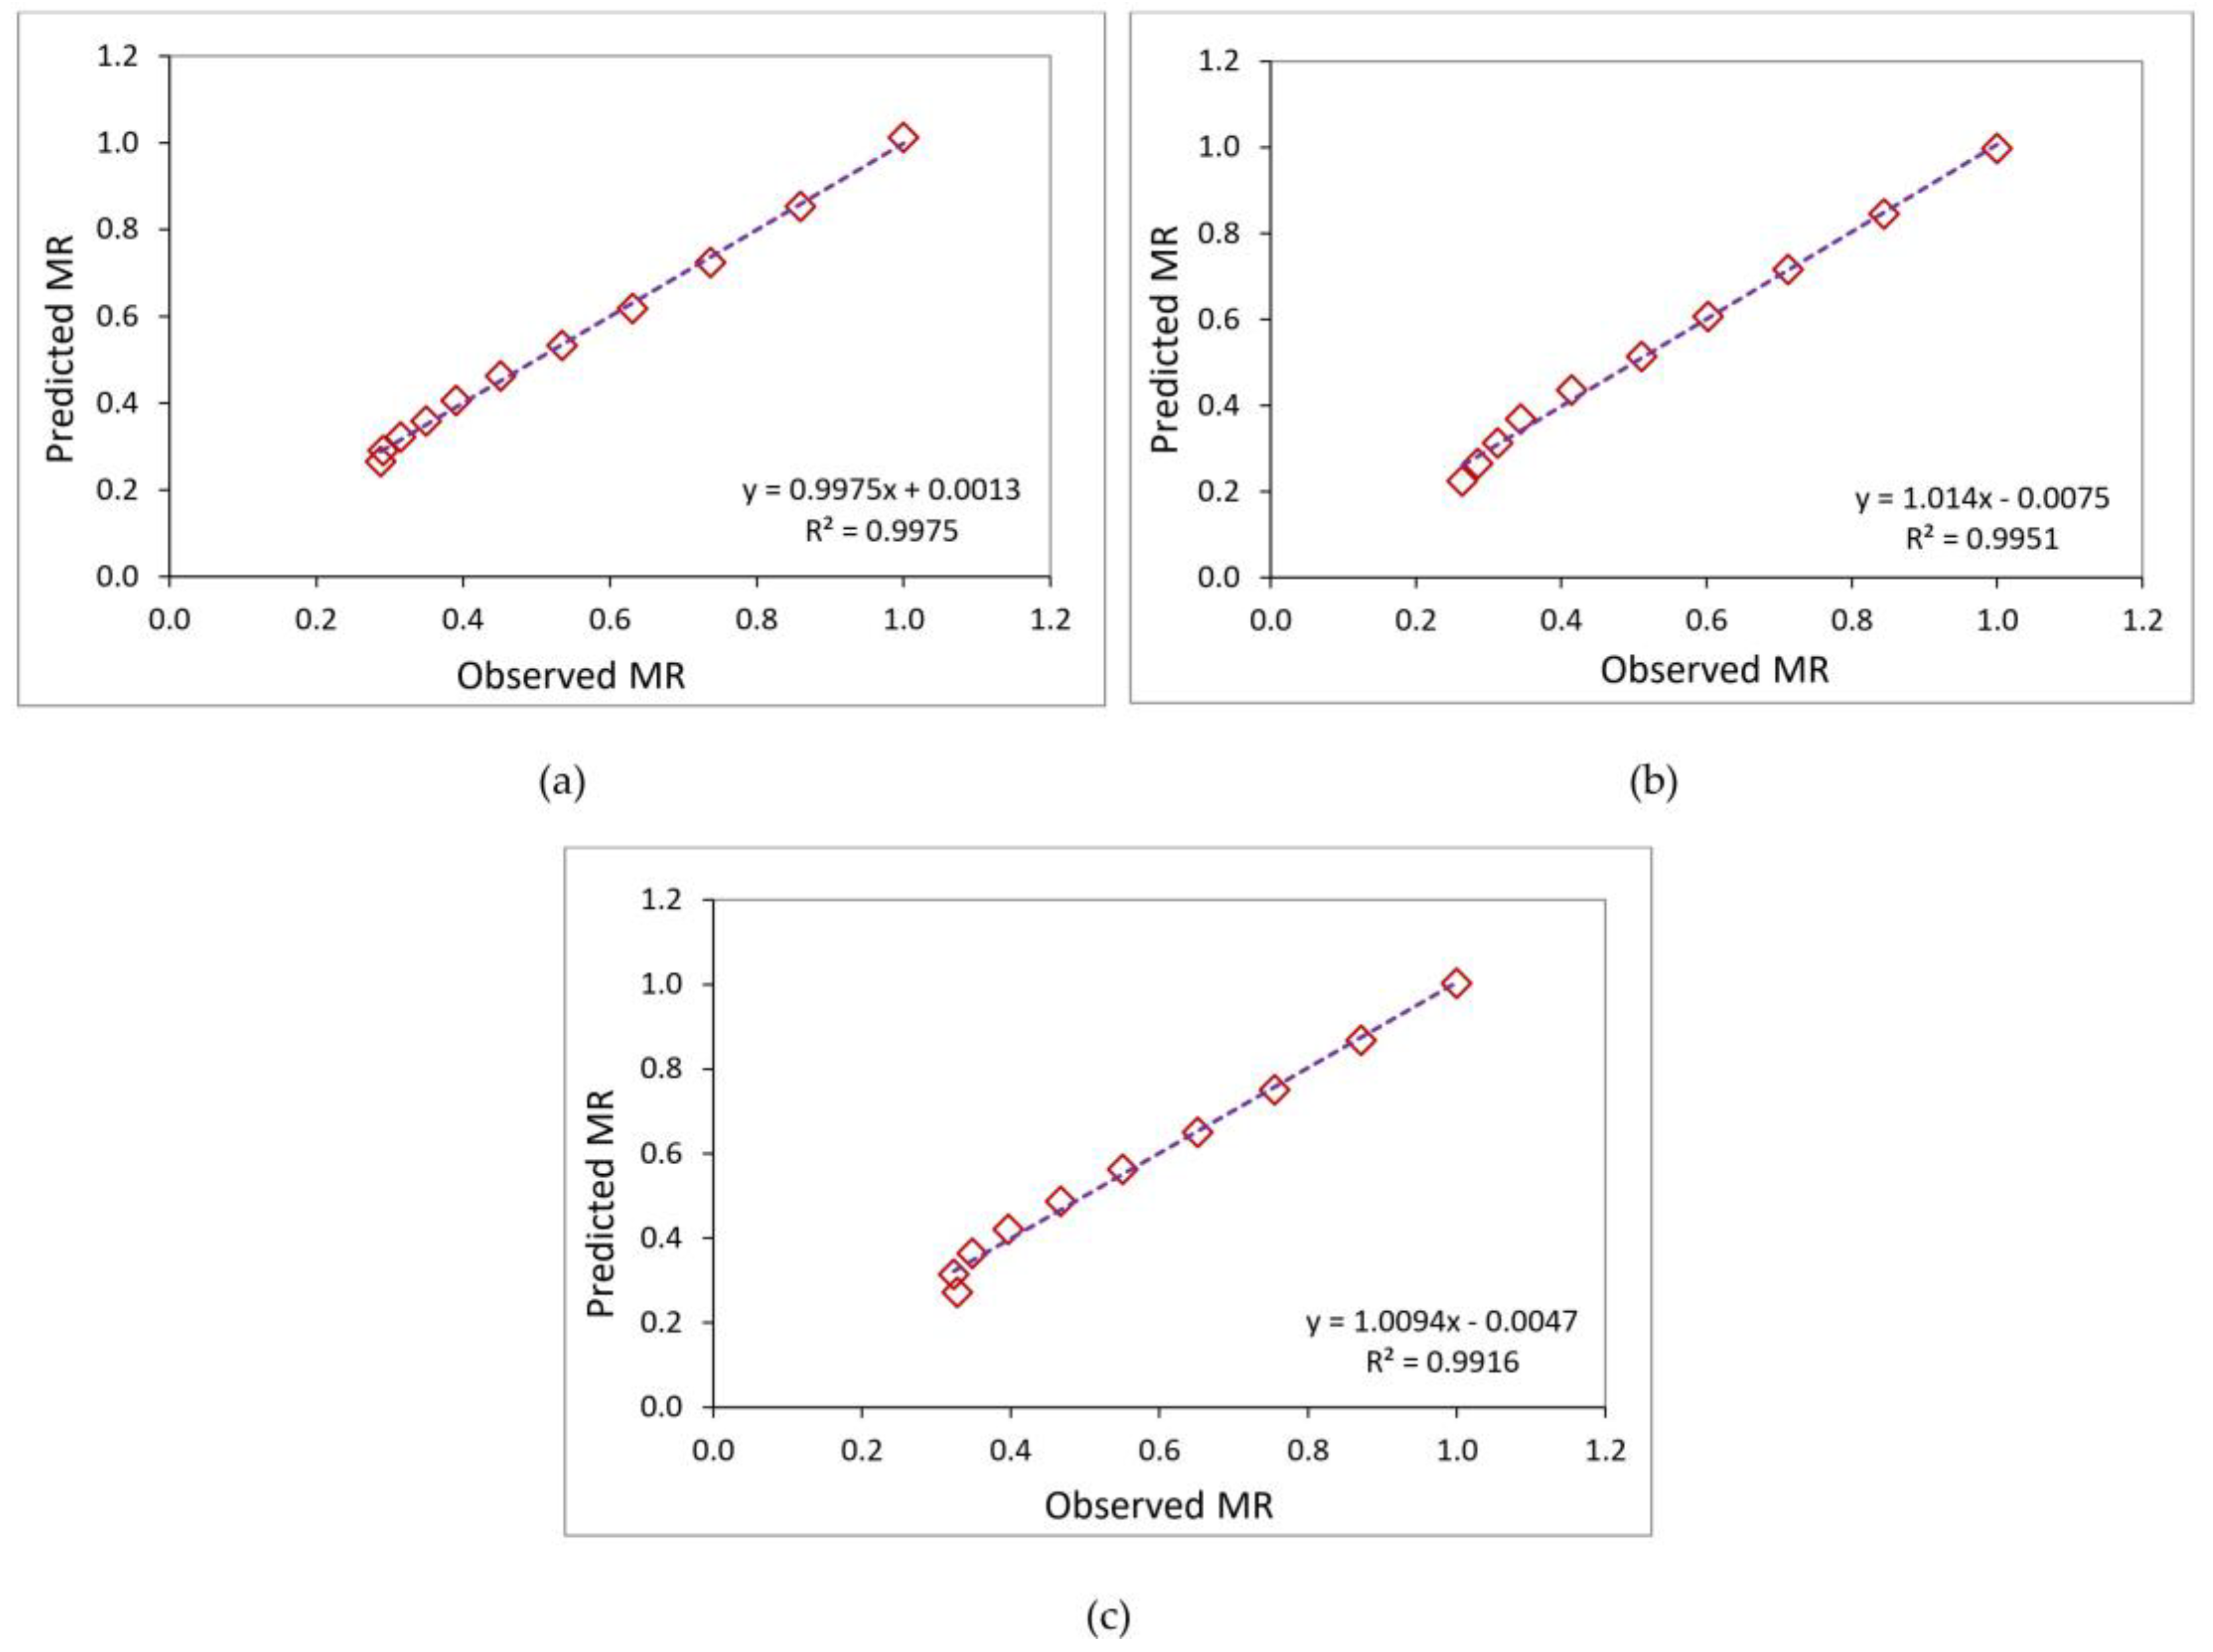
3.4. Evaluation of Drying Models

The comprehension of the fundamental transport mechanism involved in the thin-layer drying of materials is an essential prerequisite to simulate and scale up the entire process for optimizing or controlling the operating conditions. Empirical drying practices without due consideration of the mathematical aspects of the drying kinetics can significantly impair dryer efficiency, escalate production costs, and diminish the quality of the dried product. To ensure effective process design, optimization, energy integration, and control, it is imperative to have an efficient model. The use of mathematical models to determine the drying kinetics of agricultural products is indispensable [138].
Standard computations and methods were used for the moisture content data collected for several date fruit varieties. After that, the moisture content was converted into the moisture ratio expression, and twenty various drying models were used to compute curve fitting. The findings of the statistical analysis show that all the drying models had an overall high correlation coefficient (R2) (Table 5). The selection of a suitable model or models is crucial for accurately predicting the drying behavior of various products. When working with empirical models, it is essential to have a thorough understanding of the parameters and their effects on the shape of the curve. Once a suitable model has been identified, attention can be focused on finding secondary models that can lead to the prediction of drying curves under non-isothermal conditions. However, the selection of the most appropriate model for describing the drying behavior of fruits and vegetables cannot be based solely on the number of constants. The selection process should instead be guided by various statistical indicators that have been used successfully in selecting the most suitable drying models, as reported in the literature. Therefore, it is essential to carefully consider these statistical indicators when selecting a model, ensuring that the choice of the model is well informed and backed by empirical evidence, where R2, a reduced χ2, and RMSE are examples of statistical measures that were used to assess the quality of the fitted models. Prior research [57,58,59] demonstrated that the model most suited for defining the thin-layer drying of date fruits was the one with the greatest R2 and the lowest χ2 and RMSE values. A number of models were found to exhibit good fit to the experimental data of various date fruit varieties dried using ASD and OAD methods. These models included Newton (Lewis), Page, Modified Page III, Henderson and Pabis, Logarithmic, Two-term, Two-term Exponential, Approximation diffusion or Diffusion Approach, Modified Henderson and Pabis, Combined Two-term and Page, Simplified Fick’s Diffusion, and Logistics models. These findings were based on recorded observations. These models’ R2 values varied from 0.99020 to 0.99967.
Table 6 indicates that, out of all the tested models on the OAD system, the Two-term model was the most appropriate for Sakkoti and Malkabii varieties, and the Modified Page III model was the most appropriate for the Gondaila variety. The Newton (Lewis) model, Page and Combined Two-term and Page model, and Combined Two-term and Page model were the next most appropriate models for Sakkoti, Malkabii, and Gondaila varieties, respectively. By using the ASD, we discovered that the Two-term Exponential model was the best fit to describe the drying system for the Sakkoti variety, followed by the Logarithmic model. Similarly, for the Malkabii variety, the Newton (Lewis) and Approximation diffusion models (Diffusion Approach model) were the most appropriate, with the highest R2 and the lowest reduced χ2 and RMSE, followed by the Logistics model. Furthermore, according to the tabulated data in the same table, the Two-term Exponential model was the best drying model for the Gondaila variety, followed by the Logarithmic model.
Figure 7, Figure 8, Figure 9 and Figure 10 represent the comparison between the observed moisture ratio (MR) and the predicted MR obtained from the first and second appropriate drying models for different varieties of date fruits dried under OAD and ASD conditions. The clustering of data points around the 45 °C straight lines indicate a remarkable agreement between the observed and projected MR values. This shows that the chosen models successfully represent how various types of date fruits dry. The high coefficient of determination (nearly 1) obtained at different drying periods indicates that the experimental and predicted MR values successfully matched. Table 5 contains the statistical analysis findings and the coefficient of determination. A strong match to the data was indicated by R2 values above 0.99 for most of the mathematical models. However, the adjusted Page and Newton (Lewis) models exhibited lower R2 values of 0.9828 and 0.9854, respectively, for the Gondaila variety drying under OAD.

3.5. Economic Analysis

The principal aim of the economic analysis carried out in this study was to evaluate the feasibility of integrating the ASD with a photovoltaic system for financially advantageous functioning. Equations (11)–(22) were used in this study, which considered the life cycle savings strategy and the simple payback methodology. Important factors were taken into account, as shown in Table 7 and Table 8, while also considering the current status of the Egyptian economy and the expected cost of the ASD components. The findings show that, when used for drying date fruits, the ASD has the potential to produce significant savings, a total of USD 6.3622 per day and USD 229.04 per year. Notable is that these savings were made in just 34 days, and the ASD may be used all year long to dry different crops, which would add to the total savings. The study also shows that the ASD is appropriate for the industrial production of dried date fruits. USD 57.26 was determined to be the cost of utilizing the ASD to dry a batch of date fruits. It was found that the payback period (Pb), which stands for the amount of time needed to recoup the initial expenditure, was 2.476 years. In comparison to the anticipated 10-year lifespan of the dryer and the anticipated 20-year lifespan of the PV system, this figure is rather low. This suggests that, barring any unforeseen risks, the dryer would recover its initial capital cost of USD 531.25 in around 2.476 years, or less than three years, and proves to be cost-effective. The economic characteristics that are dependent on the dried date fruits inside the ASD are shown in Table 8. The initial cost of the integrated system and the yearly savings from the ASD impact the payback period of the ASD integrated with the PV system.

3.6. Environmental Analysis

This study performed six different energy assessments of the ASD using energy analysis. Table 9 shows the energy density of the materials utilized in the ASD construction along with other pertinent information. Sakkoti, Malkabii, and Gondaila are the three date fruit types for which the specific energy consumption, or energy consumed per unit of product, was assessed. The results showed that the three date fruit varieties had respective specific energy consumptions of 17.936 kWh/kg, 22.746 kWh/kg, and 21.264 kWh/kg. Additionally, calculations were made to determine the combined yearly thermal output of the ASD and PV system, as well as their annual thermal output. The total yearly thermal output of the ASD and PV system ranged from 388.72 kW·h to 397.16 kW·h. The annual thermal output varied from 96.719 kW·h. to 105.16 kW·h. These figures demonstrate the ASD and the combined ASD-PV system’s energy production and efficiency.
For the three types of date fruit—Sakkoti, Malkabii, and Gondaila—the energy payback period was determined. Based on the data, the energy payback times for these kinds are 7.71 years, 7.58 years, and 7.54 years, respectively. The time required by the ASD to recoup the energy used during operation is estimated by this statistic. As a gauge of the PV power system’s capacity to mitigate climate change, it helps to reduce CO2 emissions. Per kilowatt-hour, the total CO2 mitigations were calculated. For the Sakkoti, Malkabii, and Gondaila date fruit varieties, the corresponding net CO2 mitigation throughout the ASD’s lifespan was 8.80 tons, 8.55 tons, and 8.75 tons. These findings align with the previous studies conducted by the authors of [108,139]. A wider range of sun drying system designs, especially those aimed at commercial operations, can benefit from the methodologies and insights explored in this work [108,140].

4. Conclusions and Future Work

This research was conducted to examine the drying behavior of three date fruit varieties dried in the ASD and OAD. The regression study findings showed that the Two-term and Modified Page III models, out of twelve thin-layer drying models, provide the best prediction of the moisture ratio for date fruit varieties dried by OAD. However, for date fruit varieties dried by the ASD, Two-term Exponential, Newton (Lewis), Approximation diffusion or Diffusion Approach, and Two-term Exponential give the best prediction of the moisture ratio. The effective moisture diffusivity (Deff) values of the date fruit samples dried in the ASD were greater than those of the date fruit samples dried in OAD. The effective moisture diffusivity coefficient values, as determined by Fick’s second law of diffusion model, ranged from 7.14 × 10⁻¹² m2/s to 2.17 × 10⁻¹¹ m2/s. A particular energy consumption, energy payback period, and net CO2 mitigation during the lifespan ranged between 17.936 and 22.746 kWh.kg, 7.54 and 7.71 years, and 8.55 and 8.80 tons, according to the energy and environmental study. Furthermore, the economic research revealed that the ASD had a 2.476-year payback period.
Design engineers must have a comprehensive understanding of the material to be dried, along with its drying kinetics, to create an efficient drying system. By utilizing this information, engineers can select the appropriate kinetic model equations and process parameters to design drying chambers and equipment. The use of drying kinetic models is crucial for achieving significant cost and time savings. Engineers can predict and optimize drying processes, eliminating the need for costly experimentation and pilot plants to study drying systems. This leads to a much more efficient design and development process. Furthermore, the use of drying kinetic models can significantly aid in developing highly effective drying systems for the food industry. These models allow for the design of optimal and energy-efficient drying systems by predicting the moisture content at any given moment during the drying process under different conditions.
In conclusion, design engineers must utilize drying kinetic models to save time and money, improve drying procedures, and develop effective drying systems for various industries, particularly the food industry. Failure to do so could lead to inefficient and costly designs, which may negatively impact the industry as a whole.

Author Contributions

Conceptualization, K.A.M. and A.E.E.; Methodology, K.A.M. and A.E.E.; Software, K.A.M. and A.E.E.; Validation, K.A.M., A.A.T.O., T.M.E.-M., M.M.M., M.A.A. and A.E.E.; Investigation, K.A.M., A.A.T.O., T.M.E.-M., M.M.M., M.A.A., and A.E.E.; Resources, K.A.M., A.A.T.O., I.M.E., T.M.E.-M., C.N., M.M.M., M.A.A., A.A.T., U.K., A.B. and A.E.E.; Data curation, K.A.M., A.A.T.O., I.M.E., T.M.E.-M., C.N., M.M.M., M.A.A., A.A.T., U.K., A.B. and A.E.E.; Writing—original draft, K.A.M., A.A.T.O., I.M.E., T.M.E.-M., C.N., M.M.M., M.A.A., A.A.T., U.K., A.B. and A.E.E.; Writing—review & editing, K.A.M., A.A.T.O., I.M.E., T.M.E.-M., C.N., M.M.M., M.A.A., A.A.T., U.K., A.B. and A.E.E.; Supervision, K.A.M. and A.E.E.; Project administration, A.A.T. and A.A.T.O.; Funding acquisition, A.A.T. and A.A.T.O. All authors have read and agreed to the published version of the manuscript.

Funding

The authors present their appreciation to King Saud University for funding this research through the Researchers Supporting Program number (RSPD2024R1108), King Saud University, Riyadh, Saudi Arabia.

Institutional Review Board Statement

Not applicable.

Informed Consent Statement

Not applicable.

Data Availability Statement

All data are presented within the article.

Acknowledgments

The authors are grateful for the support by the Researchers Supporting Project (number RSPD2024R1108), King Saud University, Riyadh, Saudi Arabia.

Conflicts of Interest

The authors declare no conflict of interest.

References

  1. Elwakeel, A.E.; Wapet, D.E.M.; Mahmoud, W.A.E.M.; Abdallah, S.E.; Mahmoud, M.M.; Ardjoun, S.A.E.M.; Tantawy, A.A. Design and Implementation of a PV-Integrated Solar Dryer Based on Internet of Things and Date Fruit Quality Monitoring and Control. Int. J. Energy Res. 2023, 2023, 7425045. [Google Scholar] [CrossRef]
  2. Ambawat, S.; Sharma, A.; Saini, R.K. Mathematical Modeling of Thin Layer Drying Kinetics and Moisture Diffusivity Study of Pretreated Moringa oleifera Leaves Using Fluidized Bed Dryer. Processes 2022, 10, 2464. [Google Scholar] [CrossRef]
  3. Zhang, Q.-A.; Song, Y.; Wang, X.; Zhao, W.-Q.; Fan, X.-H. Mathematical modeling of debittered apricot (Prunus armeniaca L.) kernels during thin-layer drying. CyTA-J. Food 2016, 14, 509–517. [Google Scholar] [CrossRef]
  4. Mahmoud, W.A.E.-M.; Elwakeel, A. elshawadfy Study on some Properties of Tomato Fruits for Natural Sun Drying. J. Soil Sci. Agric. Eng. 2021, 12, 763–767. [Google Scholar]
  5. Eissa, A.S.; Gameh, M.A.; Mostafa, M.B.; Elwakeel, A.E. Some Engineering Factors Affecting Utilization of Solar Energy in Drying Tomato Fruits Introduction. Aswan Univ. J. Environ. Stud. 2024, 5, 52–68. [Google Scholar] [CrossRef]
  6. Senadeera, W.; Adiletta, G.; Önal, B.; Di Matteo, M.; Russo, P. Influence of different hot air drying temperatures on drying kinetics, shrinkage, and colour of persimmon slices. Foods 2020, 9, 101. [Google Scholar] [CrossRef]
  7. Kishk, S.; El-reheem, S.A.; Elgamal, A. Experimental and mathematical modeling study for solar drying of mint. Misr J. Agric. Eng. 2018, 35, 1327–1344. [Google Scholar] [CrossRef]
  8. Mahmoud, M.M.; Atia, B.S.; Ratib, M.K.; Aly, M.M.; Elwakeel, A.E.; Abdel-Rahim, A.-M.M. Investigations on OTC-MPPT strategy and FRT capability for PMSG wind system with the support of optimized wind side controller based on GWO technique. Energy 2021, 4, 79–91. [Google Scholar]
  9. Abd-Allah, Y.S.; Ahmed, T.H.; Metwally, K.A. Evaluation of The Drying Process of Paddy Rice with a Biogas Continuous Rotary Dryer. Misr J. Agric. Eng. 2023, 40, 59–74. [Google Scholar] [CrossRef]
  10. Sallam, Y.I.; Aly, M.H.; Nassar, A.F.; Mohamed, E.A. Solar drying of whole mint plant under natural and forced convection. J. Adv. Res. 2015, 6, 171–178. [Google Scholar] [CrossRef]
  11. Sreekumar, A.; Manikantan, P.E.; Vijayakumar, K.P. Performance of indirect solar cabinet dryer. Energy Convers. Manag. 2008, 49, 1388–1395. [Google Scholar] [CrossRef]
  12. Rabha, D.K.; Muthukumar, P.; Somayaji, C. Experimental investigation of thin layer drying kinetics of ghost chilli pepper (Capsicum Chinense Jacq.) dried in a forced convection solar tunnel dryer. Renew. Energy 2017, 105, 583–589. [Google Scholar] [CrossRef]
  13. Kassem, R.; Mahmoud, M.M.; Ibrahim, N.F.; Alkuhayli, A.; Khaled, U.; Beroual, A.; Saleeb, H. A Techno-Economic-Environmental Feasibility Study of Residential Solar Photovoltaic / Biomass Power Generation for Rural Electrification: A Real Case Study. Sustainability 2024, 16, 2036. [Google Scholar] [CrossRef]
  14. Elwakeel, A.E.; Tantawy, A.A.; Alsebiey, M.M.; Elliby, A.K. The date fruit drying systems: Acritical over review. Al-Azhar J. Agric. Eng. 2022, 2, 26–36. [Google Scholar] [CrossRef]
  15. Elwakeel, A.E.; Gameh, M.A.; Eissa, A.S.; Mostafa, M.B. Recent Advances in Solar Drying Technology for Tomato Fruits: A Comprehensive Review. Int. J. Appl. Energy Syst. 2024, 6, 37–44. [Google Scholar] [CrossRef]
  16. Prakash, O.; Kumar, A. Historical review and recent trends in solar drying systems. Int. J. Green Energy 2013, 10, 690–738. [Google Scholar] [CrossRef]
  17. Sharma, A.; Chen, C.R.; Lan, N.V. Solar-energy drying systems: A review. Renew. Sustain. Energy Rev. 2009, 13, 1185–1210. [Google Scholar] [CrossRef]
  18. El-Sebaii, A.A.; Aboul-Enein, S.; Ramadan, M.R.I.; El-Gohary, H.G. Experimental investigation of an indirect type natural convection solar dryer. Energy Convers. Manag. 2002, 43, 2251–2266. [Google Scholar] [CrossRef]
  19. Santos, B.M.; Queiroz, M.R.; Borges, T.P.F. A solar collector design procedure for crop drying. Braz. J. Chem. Eng. 2005, 22, 277–284. [Google Scholar] [CrossRef]
  20. Metwally Mahmoud, M. Improved current control loops in wind side converter with the support of wild horse optimizer for enhancing the dynamic performance of PMSG-based wind generation system. Int. J. Model. Simul. 2022, 43, 952–966. [Google Scholar] [CrossRef]
  21. Sekyere, C.K.K.; Forson, F.K.; Adam, F.W. Experimental investigation of the drying characteristics of a mixed mode natural convection solar crop dryer with back up heater. Renew. Energy 2016, 92, 532–542. [Google Scholar] [CrossRef]
  22. El-Beltagy, A.; Gamea, G.R.; Essa, A.H.A. Solar drying characteristics of strawberry. J. Food Eng. 2007, 78, 456–464. [Google Scholar] [CrossRef]
  23. Keey, R.B. Drying: Principles and Practice; Elsevier: Amsterdam, The Netherlands, 2013; Volume 13, ISBN 1483146332. [Google Scholar]
  24. Klemes, J.; Smith, R.; Kim, J.-K. Handbook of Water and Energy Management in Food Processing; Elsevier: Amsterdam, The Netherlands, 2008; ISBN 1845694678. [Google Scholar]
  25. Onwude, D.I.; Hashim, N.; Janius, R.B.; Nawi, N.M.; Abdan, K. Modeling the thin-layer drying of fruits and vegetables: A review. Compr. Rev. food Sci. food Saf. 2016, 15, 599–618. [Google Scholar] [CrossRef] [PubMed]
  26. Kadam, D.M.; Goyal, R.K.; Singh, K.K.; Gupta, M.K. Thin layer convective drying of mint leaves. J. Med. Plants Res. 2011, 5, 164–170. [Google Scholar]
  27. Ronoh, E.K.; Kanali, C.L.; Mailutha, J.T.; Shitanda, D. Thin layer drying kinetics of amaranth (Amaranthus cruentus) grains in a natural convection solar tent dryer. Afr. J. Food Agric. Nutr. Dev. 2010, 10. [Google Scholar] [CrossRef]
  28. Omid, M.; Yadollahinia, A.R.; Rafiee, S. A thin-layer drying model for paddy dryer. In Proceedings of the International Conference on Innovations in Food and Bioprocess Technologies, AIT, Pathumthani, Thailand, 12–14 December 2006. [Google Scholar]
  29. Ertekin, C.; Firat, M.Z. A comprehensive review of thin-layer drying models used in agricultural products. Crit. Rev. Food Sci. Nutr. 2017, 57, 701–717. [Google Scholar] [CrossRef] [PubMed]
  30. Marinos-Kouris, D.; Maroulis, Z.B. Transport properties in the drying of solids. Handb. Ind. Dry. 2020, 2, 113–159. [Google Scholar]
  31. Carteri Coradi, P.; de Castro Melo, E.; Pereira da Rocha, R. Modelación matemática de la cinética de secado de las hojas de hierba de limón (Cymbopogon citratus Stapf) y sus efectos sobre la calidad. Idesia 2014, 32, 43–56. [Google Scholar] [CrossRef]
  32. Sukmawaty, S.; Putra, G.M.D.; Setiawati, D.A.; Kurniawan, H.; Reinhart, I.E.P. The application of mathematical model drying of galangal (Alpiniagalanga L.) using hybrid dryer equipment with rotary type of rack. AIP Conf. Proc. 2019, 2199, 030001. [Google Scholar]
  33. Younis, M.; Abdelkarim, D.; El-abdein, A.Z. Saudi Journal of Biological Sciences Kinetics and mathematical modeling of infrared thin-layer drying of garlic slices. Saudi J. Biol. Sci. 2018, 25, 332–338. [Google Scholar] [CrossRef]
  34. Yogendrasasidhar, D.; Setty, Y.P. Engineering Science and Technology, an International Journal Experimental studies and thin layer modeling of pearl millet using continuous multistage fluidized bed dryer staged externally. Eng. Sci. Technol. Int. J. 2019, 22, 428–438. [Google Scholar] [CrossRef]
  35. Quality, E. Mathematical Modeling of Thin-Layer Drying Kinetics of Tomato Peels: Influence of Drying Temperature on the Energy Requirements and Extracts Quality. Foods 2023, 12, 3883. [Google Scholar] [CrossRef]
  36. Badaoui, O.; Hanini, S.; Djebli, A.; Haddad, B.; Benhamou, A. Experimental and modelling study of tomato pomace waste drying in a new solar greenhouse: Evaluation of new drying models. Renew. Energy 2019, 133, 144–155. [Google Scholar] [CrossRef]
  37. Gürlek, G.; Özbalta, N.; Güngör, A. Solar tunnel drying characteristics and mathematical modelling of tomato. J. Therm. Sci. Technol. 2009, 29, 15–23. [Google Scholar]
  38. Sacilik, K.; Keskin, R.; Elicin, A.K. Mathematical modelling of solar tunnel drying of thin layer organic tomato. J. Food Eng. 2006, 73, 231–238. [Google Scholar] [CrossRef]
  39. Hussein, J.B.; Filli, K.B.; Oke, M.O. Thin layer modelling of hybrid, solar and open sun drying of tomato slices. Res. J. Food Sci. Nutr. 2016, 1, 15–27. [Google Scholar] [CrossRef]
  40. Azeez, L.; Adebisi, S.A.; Oyedeji, A.O.; Adetoro, R.O.; Tijani, K.O. Bioactive compounds’ contents, drying kinetics and mathematical modelling of tomato slices influenced by drying temperatures and time. J. Saudi Soc. Agric. Sci. 2019, 18, 120–126. [Google Scholar] [CrossRef]
  41. Benseddik, A.; Azzi, A.; Zidoune, M.N.; Allaf, K. Engineering in Agriculture, Environment and Food Mathematical empirical models of thin-layer air fl ow drying kinetics of pumpkin slice. Eng. Agric. Environ. Food 2018, 11, 220–231. [Google Scholar] [CrossRef]
  42. Azadbakht, M.; Aghili, H.; Ziaratban, A.; Torshizi, M.V. Application of arti fi cial neural network method to exergy and energy analyses of fl uidized bed dryer for potato cubes. Energy 2017, 120, 947–958. [Google Scholar] [CrossRef]
  43. Petru, C.; Marius, B.; Rat, R.; Arsenoaia, V.N.; Ros, G.R. Drying Process Modeling and Quality Assessments Regarding an Innovative Seed Dryer. Agriculture 2023, 13, 328. [Google Scholar] [CrossRef]
  44. Mehran, S.; Nikian, M.; Ghazi, M.; Zareiforoush, H.; Bagheri, I. Experimental investigation and energy analysis of a solar-assisted fluidized- bed dryer including solar water heater and solar-powered infrared lamp for paddy grains drying. Sol. Energy 2019, 190, 167–184. [Google Scholar] [CrossRef]
  45. Akpinar, E.K. Drying of mint leaves in a solar dryer and under open sun: Modelling, performance analyses. Energy Convers. Manag. 2010, 51, 2407–2418. [Google Scholar] [CrossRef]
  46. Kaveh, M.; Amiri, R.; Golpour, I. Food and Bioproducts Processing Evaluation of exergy performance and onion drying properties in a multi-stage semi-industrial continuous dryer: Artificial neural networks (ANNs) and ANFIS models. Food Bioprod. Process. 2021, 127, 58–76. [Google Scholar] [CrossRef]
  47. Province, S.; Lumpur, K.; Province, S. Evaluation of Thin-layer Models for Kinetic Analysis in Unbleached Kraft Pulpboard Drying. Iran. J. Chem. Chem. Eng. 2022, 41, 1022–1033. [Google Scholar]
  48. Kaleta, A.; Górnicki, K. Evaluation of drying models of apple (var. McIntosh) dried in a convective dryer. Int. J. Food Sci. Technol. 2010, 45, 891–898. [Google Scholar] [CrossRef]
  49. Yogendrasasidhar, D.; Setty, Y.P. Drying kinetics, exergy and energy analyses of Kodo millet grains and Fenugreek seeds using wall heated fluidized bed dryer. Energy 2018, 151, 799–811. [Google Scholar] [CrossRef]
  50. Sandeepa, K.; Rao, S.R.M. Studies on Drying of Sorghum Seeds in a Fluidized Bed Dryer. In Proceedings of the 14th International Conference on Fluidization—From Fundamentals to Products, Noordwijkerhout, The Netherlands, 26–31 May 2013. [Google Scholar]
  51. Celma, A.R.; Rojas, S.; Lopez-Rodriguez, F. Mathematical modelling of thin-layer infrared drying of wet olive husk. Chem. Eng. Process. Process Intensif. 2008, 47, 1810–1818. [Google Scholar] [CrossRef]
  52. Panchariya, P.C.; Popovic, D.; Sharma, A.L. Thin-layer modelling of black tea drying process. J. Food Eng. 2002, 52, 349–357. [Google Scholar] [CrossRef]
  53. Ertekin, Ö.; İpek, Y. Modeling of drying processes of dates (Phoenix, arecaceae) with oven or TGA and microbiological properties of fresh and dried dates. Int. J. Fruit Sci. 2020, 20, S1530–S1538. [Google Scholar] [CrossRef]
  54. Seerangurayar, T.; Al-Ismaili, A.M.; Janitha Jeewantha, L.H.; Al-Nabhani, A. Experimental investigation of shrinkage and microstructural properties of date fruits at three solar drying methods. Sol. Energy 2019, 180, 445–455. [Google Scholar] [CrossRef]
  55. Boubekri, A.; Benmoussa, H.; Mennouche, D. Solar drying kinetics of date palm fruits assuming a step-wise air temperature change. J. Eng. Sci. Technol. 2009, 4, 292–304. [Google Scholar]
  56. Abodunrin, O.D. Mathematical Modelling of Thin Layer Drying Kinetics of Pre-Treated Date Fruits (Phonenix dactylifera L.). Ph.D. Thesis, Federal University of Technology, Akure, Nigeria, 2023. [Google Scholar]
  57. Midilli, A.; Kucuk, H. Mathematical modeling of thin layer drying of pistachio by using solar energy. Energy Convers. Manag. 2003, 44, 1111–1122. [Google Scholar] [CrossRef]
  58. Akpinar, E.K.; Bicer, Y. Mathematical modeling and experimental study on thin layer drying of strawberry. Int. J. Food Eng. 2006, 2. [Google Scholar] [CrossRef]
  59. Akpinar, E.K.; Bicer, Y.; Cetinkaya, F. Modelling of thin layer drying of parsley leaves in a convective dryer and under open sun. J. Food Eng. 2006, 75, 308–315. [Google Scholar] [CrossRef]
  60. Elhage, H.; Herez, A.; Ramadan, M.; Bazzi, H.; Khaled, M. An investigation on solar drying: A review with economic and environmental assessment. Energy 2018, 157, 815–829. [Google Scholar] [CrossRef]
  61. Sodha, M.S.; Chandra, R.; Pathak, K.; Singh, N.P.; Bansal, N.K. Techno-economic analysis of typical dryers. Energy Convers. Manag. 1991, 31, 509–513. [Google Scholar] [CrossRef]
  62. Chauhan, P.S.; Kumar, A.; Nuntadusit, C. Thermo-environomical and drying kinetics of bitter gourd flakes drying under north wall insulated greenhouse dryer. Sol. Energy 2018, 162, 205–216. [Google Scholar] [CrossRef]
  63. Anil Kumar, A.K.; Renu Singh, R.S.; Om Prakash, O.P.; Ashutosh, A. Review on global solar drying status. Agric. Eng. Int. CIGR J. 2015, 16, 161–177. [Google Scholar]
  64. Fudholi, A.; Sopian, K.; Gabbasa, M.; Bakhtyar, B.; Yahya, M.; Ruslan, M.H.; Mat, S. Techno-economic of solar drying systems with water based solar collectors in Malaysia: A review. Renew. Sustain. Energy Rev. 2015, 51, 809–820. [Google Scholar] [CrossRef]
  65. Tesfaye, A.; Habtu, N.G. Fabrication and performance evaluation of solar tunnel dryer for ginger drying. Int. J. Photoenergy 2022, 2022, 6435080. [Google Scholar] [CrossRef]
  66. AOAC Int. Official Methods of Analysis of AOAC Int.; AOAC Int.: Gaithersburg, MD, USA, 2007. [Google Scholar]
  67. Etim, P.J.; Eke, A.B.; Simonyan, K.J. Effect of air inlet duct features and grater thickness on cooking banana drying characteristics using active indirect mode solar dryer. Niger. J. Technol. 2019, 38, 1056–1063. [Google Scholar] [CrossRef]
  68. Dak, M.; Pareek, N.K. Effective moisture diffusivity of pomegranate arils under going microwave-vacuum drying. J. Food Eng. 2014, 122, 117–121. [Google Scholar] [CrossRef]
  69. Doymaz, İ. Influence of pretreatment solution on the drying of sour cherry. J. Food Eng. 2007, 78, 591–596. [Google Scholar] [CrossRef]
  70. Karathanos, V.T. Determination of water content of dried fruits by drying kinetics. J. Food Eng. 1999, 39, 337–344. [Google Scholar] [CrossRef]
  71. Temple, S.J.; Van Boxtel, A.J.B. Thin layer drying of black tea. J. Agric. Eng. Res. 1999, 74, 167–176. [Google Scholar] [CrossRef]
  72. Karathanos, V.T.; Belessiotis, V.G. Application of a thin-layer equation to drying data of fresh and semi-dried fruits. J. Agric. Eng. Res. 1999, 74, 355–361. [Google Scholar] [CrossRef]
  73. Palipane, K.B.; Driscoll, R.H. The thin-layer drying characteristics of macadamia in-shell nuts and kernels. J. Food Eng. 1994, 23, 129–144. [Google Scholar] [CrossRef]
  74. Pahlavanzadeh, H.; Basiri, A.; Zarrabi, M. Determination of parameters and pretreatment solution for grape drying. Dry. Technol. 2001, 19, 217–226. [Google Scholar] [CrossRef]
  75. Doymaz, I.; Pala, M. The thin-layer drying characteristics of corn. J. Food Eng. 2003, 60, 125–130. [Google Scholar] [CrossRef]
  76. Buzrul, S. Reassessment of Thin-Layer Drying Models for Foods: A critical short communication. Processes 2022, 10, 118. [Google Scholar] [CrossRef]
  77. Elwakeel, A.E.; Mazrou, Y.S.A.; Tantawy, A.A.; Okasha, A.M.; Elmetwalli, A.H.; Elsayed, S.; Makhlouf, A.H. Designing, Optimizing, and Validating a Low-Cost, Multi-Purpose, Automatic System-Based RGB Color Sensor for Sorting Fruits. Agriculture 2023, 13, 1824. [Google Scholar] [CrossRef]
  78. Elwakeel, A.E.; Mazrou, Y.S.; Eissa, A.S.; Okasha, A.M.; Elmetwalli, A.H.; Makhlouf, A.H.; Metwally, K.A.; Mahmoud, W.A.; Elsayed, S. Design and Validation of a Variable-Rate Control Metering Mechanism and Smart Monitoring System for a High-Precision Sugarcane Transplanter. Agriculture 2023, 13, 2218. [Google Scholar] [CrossRef]
  79. Elsayed, S.; El-Hendawy, S.; Elsherbiny, O.; Okasha, A.M.; Elmetwalli, A.H.; Elwakeel, A.E.; Memon, M.S.; Ibrahim, M.E.M.; Ibrahim, H.H. Estimating Chlorophyll Content, Production, and Quality of Sugar Beet under Various Nitrogen Levels Using Machine Learning Models and Novel Spectral Indices. Agronomy 2023, 13, 2743. [Google Scholar] [CrossRef]
  80. Elwakeel, A.E.; Mohamed, S.M.A.; Tantawy, A.A.; Okasha, A.M.; Elsayed, S.; Elsherbiny, O.; Farooque, A.A. Design, construction and field testing of a manually feeding semiautomatic sugarcane dud chipper. Sci. Rep. 2024, 14, 5373. [Google Scholar] [CrossRef]
  81. Yang, L.; Nasrat, L.S.; Badawy, M.E.; Mbadjoun Wapet, D.E.; Ourapi, M.A.; El-Messery, T.M.; Aleksandrova, I.; Mahmoud, M.M.; Hussein, M.M.; Elwakeel, A.E. A new automatic sugarcane seed cutting machine based on internet of things technology and RGB color sensor. PLoS ONE 2024, 19, e0301294. [Google Scholar] [CrossRef]
  82. Wang, Z.; Sun, J.; Liao, X.; Chen, F.; Zhao, G.; Wu, J.; Hu, X. Mathematical modeling on hot air drying of thin layer apple pomace. Food Res. Int. 2007, 40, 39–46. [Google Scholar] [CrossRef]
  83. Lewis, W.K. The rate of drying of solid materials. Ind. Eng. Chem. 1921, 13, 427–432. [Google Scholar] [CrossRef]
  84. Aghbashlo, M.; Kianmehr, M.H.; Khani, S.; Ghasemi, M. Mathematical modelling of thin-layer drying of carrot. Int. Agrophys. 2009, 23, 313–317. [Google Scholar]
  85. Page, G.E. Factors Influencing the Maximum Rates of Air Drying Shelled Corn in Thin Layers; Purdue University: West Lafayette, IN, USA, 1949; ISBN 1083231995. [Google Scholar]
  86. Henderson, S.M.; Pabis, S. Grain drying theory. 1. Temperature effect on drying coefficient. J. Agric. Eng. Res. 1961, 6, 169–174. [Google Scholar]
  87. Henderson, S.M. Progress in developing the thin layer drying equation. Trans. ASAE 1974, 17, 1167–1168. [Google Scholar] [CrossRef]
  88. Sharaf-Eldeen, Y.I.; Blaisdell, J.L.; Hamdy, M.Y. A model for ear-corn drying. Trans. ASAE 1981, 23, 1261–1265. [Google Scholar] [CrossRef]
  89. Yaldýz, O.; Ertekýn, C. Thin layer solar drying of some vegetables. Dry. Technol. 2001, 19, 583–597. [Google Scholar] [CrossRef]
  90. Kassem, A.S. Comparative studies on thin layer drying models for wheat. In Proceedings of the 13th International Congress on Agricultural Engineering, Rabat, Morocco, 2–6 February 1998; Volume 6. [Google Scholar]
  91. Chandra, P.K.; Singh, R.P. Applied Numerical Methods for Food and Agricultural Engineers; CRC Press: Boca Raton, FL, USA, 2017; ISBN 1351465953. [Google Scholar]
  92. Hii, C.L.; Law, C.L.; Cloke, M. Modelling of thin layer drying kinetics of cocoa beans during artificial and natural drying. J. Eng. Sci. Technol. 2008, 3, 1–10. [Google Scholar]
  93. Crank, J. The Mathematics of Diffusion; Oxford University Press: Oxford, UK, 1975. [Google Scholar]
  94. Shah, S.; Joshi, M. Modeling microwave drying kinetics of sugarcane bagasse. Int. J. Electron. Eng. 2010, 2, 159–163. [Google Scholar]
  95. ELkhadraoui, A.; Kooli, S.; Hamdi, I.; Farhat, A. Experimental investigation and economic evaluation of a new mixed-mode solar greenhouse dryer for drying of red pepper and grape. Renew. Energy 2015, 77, 1–8. [Google Scholar] [CrossRef]
  96. Mohammed, I.A.; Al Dulaimi, M.A.K. An Economic Analysis of The Costs of Producing Tomato Under Greenhouse in Anbar Governorate For the Agricultural Season 2019–2020. IOP Conf. Ser. Earth Environ. Sci. 2021, 904, 012061. [Google Scholar] [CrossRef]
  97. Singh, P.; Gaur, M.K. Environmental and economic analysis of novel hybrid active greenhouse solar dryer with evacuated tube solar collector. Sustain. Energy Technol. Assessments 2021, 47, 101428. [Google Scholar] [CrossRef]
  98. Metwally, K.A.; Zaki, R.I.; Fouda, S.S.; Alruhaimi, R.S.; Alqhtani, H.A.; Aldawood, N.; Mahmoud, A.M.; Naiel, M.A.E. Effects of feeding rate and formula fineness degree of ring die pellet mill on mechanical property, physical quality, energy requirements, and production cost of poultry diets. Int. J. Agric. Biol. Eng. 2023, 16, 30–36. [Google Scholar] [CrossRef]
  99. Radwan, M.E.; Zaki, R.I.; El-Said, A.F.; Metwally, K.A. Impact of Die Surface Holes Distribution Patterns of Fish Feed Extruder on Performance Indicators and Pellets Quality. J. Soil Sci. Agric. Eng. 2021, 12, 337–343. [Google Scholar] [CrossRef]
  100. Atheaya, D. Economics of Solar Drying. In Solar Drying Technology; Springer: Berlin/Heidelberg, Germany, 2017. [Google Scholar] [CrossRef]
  101. Fudholi, A.; Sopian, K.; Yazdi, M.H.; Ruslan, M.H.; Gabbasa, M.; Kazem, H.A. Performance analysis of solar drying system for red chili. Sol. Energy 2014, 99, 47–54. [Google Scholar] [CrossRef]
  102. Bala, B.K.; Janjai, S. Solar Drying of Fish (Bombay Duck) Using Solar Tunnel Dryer. Int. Energy J. 2005, 6, 91–102. [Google Scholar]
  103. Usub, T.; Lertsatitthanakorn, C.; Poomsa-ad, N.; Wiset, L.; Yang, L.; Siriamornpun, S. Experimental performance of a solar tunnel dryer for drying silkworm pupae. Biosyst. Eng. 2008, 101, 209–216. [Google Scholar] [CrossRef]
  104. Prakash, O.; Kumar, A. Environomical analysis and mathematical modelling for tomato flakes drying in a modified greenhouse dryer under active mode. Int. J. Food Eng. 2014, 10, 669–681. [Google Scholar] [CrossRef]
  105. Prakash, O.; Kumar, A. Solar greenhouse drying: A review. Renew. Sustain. Energy Rev. 2014, 29, 905–910. [Google Scholar] [CrossRef]
  106. Baird, G.; Alcorn, A.; Haslam, P. The energy embodied in building materials-updated New Zealand coefficients and their significance. Trans. Inst. Prof. Eng. N. Zeal. Civ. Eng. Sect. 1997, 24, 46–54. [Google Scholar]
  107. Nayak, S.; Naaz, Z.; Yadav, P.; Chaudhary, R. Economic analysis of hybrid photovoltaic-thermal (PVT) integrated solar dryer. Int. J. Eng. Invent. 2012, 1, 21–27. [Google Scholar]
  108. Eltawil, M.A.; Azam, M.M.; Alghannam, A.O. Energy analysis of hybrid solar tunnel dryer with PV system and solar collector for drying mint (MenthaViridis). J. Clean. Prod. 2018, 181, 352–364. [Google Scholar] [CrossRef]
  109. Elghazali, M.N.; Tawfeuk, H.Z.; Gomaa, R.A.; Abbas, A.A.; Aml, A. Effect of Dehydration Methods on Physicochemical Properties of Aswan Dry Dates. Assiut J. Agric. Sci. 2020, 51, 50–64. [Google Scholar] [CrossRef]
  110. Elghazali, M.N.; Tawfeuk, H.Z.; Gomaa, R.A.; Tantawy, A.A. Technological Studies on Aswan Dry Dates Products After Dehydration. Assiut J. Agric. Sci. 2020, 51, 32–49. [Google Scholar] [CrossRef]
  111. Sengkhamparn, N.; Chanshotikul, N.; Assawajitpukdee, C.; Khamjae, T. Effects of blanching and drying on fiber rich powder from pitaya (Hylocereus undatus) peel. Int. Food Res. J. 2013, 20, 1595. [Google Scholar]
  112. Deng, L.Z.; Pan, Z.; Mujumdar, A.S.; Zhao, J.H.; Zheng, Z.A.; Gao, Z.J.; Xiao, H.W. High-humidity hot air impingement blanching (HHAIB) enhances drying quality of apricots by inactivating the enzymes, reducing drying time and altering cellular structure. Food Control 2019, 96, 104–111. [Google Scholar] [CrossRef]
  113. Kamal, M.M.; Ali, M.R.; Shishir, M.R.I.; Mondal, S.C. Thin-layer drying kinetics of yam slices, physicochemical, and functional attributes of yam flour. J. Food Process Eng. 2020, 43, e13448. [Google Scholar] [CrossRef]
  114. Doymaz, İ. Evaluation of some thin-layer drying models of persimmon slices (Diospyros kaki L.). Energy Convers. Manag. 2012, 56, 199–205. [Google Scholar] [CrossRef]
  115. Kaleta, A.; Górnicki, K.; Winiczenko, R.; Chojnacka, A. Evaluation of drying models of apple (var. Ligol) dried in a fluidized bed dryer. Energy Convers. Manag. 2013, 67, 179–185. [Google Scholar] [CrossRef]
  116. Meziane, S. Drying kinetics of olive pomace in a fluidized bed dryer. Energy Convers. Manag. 2011, 52, 1644–1649. [Google Scholar] [CrossRef]
  117. He, C.; Wang, H.; Yang, Y.; Huang, Y.; Zhang, X.; Arowo, M.; Ye, J.; Zhang, N.; Xiao, M. Drying behavior and kinetics of drying process of plant-based enteric hard capsules. Pharmaceutics 2021, 13, 335. [Google Scholar] [CrossRef] [PubMed]
  118. Dissa, A.O.; Desmorieux, H.; Bathiebo, J.; Koulidiati, J. A comparative study of direct and indirect solar drying of mango. Glob. J. Pure Appl. Sci. 2011, 17, 273–294. [Google Scholar]
  119. Navale, S.R.; Harpale, V.M.; Mohite, K.C. Comparative study of open sun and cabinet solar drying for fenugreek leaves. Int. J. Renew. Energy Technol. Res. 2015, 4, 1–9. [Google Scholar]
  120. Manjunatha, S.S.; Ravi, N.; Negi, P.S.; Raju, P.S.; Bawa, A.S. Kinetics of moisture loss and oil uptake during deep fat frying of Gethi (Dioscorea kamoonensis Kunth) strips. J. Food Sci. Technol. IB 2014, 51, 3061–3071. [Google Scholar] [CrossRef]
  121. Babar, O.A.; Tarafdar, A.; Malakar, S.; Arora, V.K.; Nema, P.K. Design and performance evaluation of a passive flat plate collector solar dryer for agricultural products. J. Food Process Eng. 2020, 43, e13484. [Google Scholar] [CrossRef]
  122. Etim, P.J.; Eke, A.B.; Simonyan, K.J. Design and development of an active indirect solar dryer for cooking banana. Sci. Afr. 2020, 8, e00463. [Google Scholar] [CrossRef]
  123. Hossain, M.A.; Amer, B.M.A.; Gottschalk, K. Hybrid solar dryer for quality dried tomato. Dry. Technol. 2008, 26, 1591–1601. [Google Scholar] [CrossRef]
  124. Song, X.; Zhang, M.; Mujumdar, A.S. Effect of vacuum-microwave predrying on quality of vacuum-fried potato chips. Dry. Technol. 2007, 25, 2021–2026. [Google Scholar] [CrossRef]
  125. Farag, S.E.-S.; Hassan, S.R.; Younes, O.S.; Taha, S.A. Methods of drying of tomato slices and the effect of the using of its powder on the production and characteristics of extruded snacks. Misr J. Agric. Eng. 2016, 33, 1537–1558. [Google Scholar] [CrossRef]
  126. Téllez, M.C.; Figueroa, I.P.; Téllez, B.C.; Vidaña, E.C.L.; Ortiz, A.L. Solar drying of Stevia (Rebaudiana Bertoni) leaves using direct and indirect technologies. Sol. Energy 2018, 159, 898–907. [Google Scholar] [CrossRef]
  127. Ismail, O.; Akyol, E. Open-air sun drying: The effect of pretreatment on drying kinetic of cherry tomato. Sigma J. Eng. Nat. Sci. 2016, 34, 141–151. [Google Scholar]
  128. Manalu, L.P.; Tambunan, A.H.; Nelwan, L.O.; Hoetman, A.R. The thin layer drying of temu putih herb. In Proceedings of the 6th Asia-Pacific Drying Conference (ADC2009), Bangkok, Thailand, 19–21 October 2009; pp. 402–409. [Google Scholar]
  129. Touil, A.; Chemkhi, S.; Zagrouba, F. Moisture diffusivity and shrinkage of fruit and cladode of Opuntia ficus-indica during infrared drying. J. food Process. 2014, 2014, 175402. [Google Scholar] [CrossRef]
  130. Mayor, L.; Sereno, A.M. Modelling shrinkage during convective drying of food materials: A review. J. Food Eng. 2004, 61, 373–386. [Google Scholar] [CrossRef]
  131. Doymaz, İ.; İsmail, O. Drying characteristics of sweet cherry. Food Bioprod. Process. 2011, 89, 31–38. [Google Scholar] [CrossRef]
  132. Lee, G.; Hsieh, F. Thin-layer drying kinetics of strawberry fruit leather. Trans. ASABE 2008, 51, 1699–1705. [Google Scholar] [CrossRef]
  133. Kaya, A.; Aydin, O.; Demirtas, C.; Akgün, M. An experimental study on the drying kinetics of quince. Desalination 2007, 212, 328–343. [Google Scholar] [CrossRef]
  134. Doymaz, İ. Effect of pre-treatments using potassium metabisulphide and alkaline ethyl oleate on the drying kinetics of apricots. Biosyst. Eng. 2004, 89, 281–287. [Google Scholar] [CrossRef]
  135. Aghbashlo, M.; Samimi-Akhijahani, H. Influence of drying conditions on the effective moisture diffusivity, energy of activation and energy consumption during the thin-layer drying of berberis fruit (Berberidaceae). Energy Convers. Manag. 2008, 49, 2865–2871. [Google Scholar] [CrossRef]
  136. Ruiz-Cabrera, M.A.; Flores-Gómez, G.; González-García, R.; Grajales-Lagunes, A.; Moscosa-Santillan, M.; Abud-Archila, M. Water diffusivity and quality attributes of fresh and partially osmodehydrated cactus pear (Opuntia ficus indica) subjected to air-dehydration. Int. J. Food Prop. 2008, 11, 887–900. [Google Scholar] [CrossRef]
  137. Tireki, S. Effective diffusivity determination of date (Phoenix dactylifera L.) leather in infrared drying: Effect of cooking time. Niğde Ömer Halisdemir Üniversitesi Mühendislik Bilim. Derg. 2023, 12, 1558–1565. [Google Scholar] [CrossRef]
  138. Inyang, U.E.; Oboh, I.O.; Etuk, B.R. Kinetic models for drying techniques—Food materials. Adv. Chem. Eng. Sci. 2018, 8, 27–48. [Google Scholar] [CrossRef]
  139. Shrivastava, V.; Kumar, A. Embodied energy analysis of the indirect solar drying unit. Int. J. Ambient Energy 2017, 38, 280–285. [Google Scholar] [CrossRef]
  140. Prakash, O.; Kumar, A.; Laguri, V. Performance of modified greenhouse dryer with thermal energy storage. Energy Rep. 2016, 2, 155–162. [Google Scholar] [CrossRef]
Figure 1. Different date fruit varieties inside the ASD, (a) Sakkoti, (b) Malkabii, and (c) Gondaila [1].
Sustainability 16 03506 g001
Figure 2. Different date fruit varieties during OSD, (a) Sakkoti, (b) Gondaila, and (c) Malkabii [1].
Sustainability 16 03506 g002
Figure 3. Moisture rate of different date fruit samples for open-air drying (OAD) and solar drying (SD), for (a) Sakkoti, (b) Malkabii, and (c) Gondaila.
Sustainability 16 03506 g003
Figure 4. Drying time of different date fruit samples for open-air drying (OAD) and solar drying (SD), for (a) Sakkoti, (b) Malkabii, and (c) Gondaila.
Sustainability 16 03506 g004
Figure 5. EMD of different date fruit samples for OAD and SD.
Sustainability 16 03506 g005
Figure 6. Effective moisture diffusivity of different date fruits for OAD and ASD, for (a) Sakkoti, (b) Malkabii, and (c) Gondaila.
Sustainability 16 03506 g006
Figure 7. Predicted and observed moisture rate of different date fruits for open-air drying, for (a) Sakkoti (using Two-term mathematical model), (b) Malkabii (using Two-term mathematical model), and (c) Gondaila (using Modified Page mathematical model).
Sustainability 16 03506 g007
Figure 8. Predicted and observed moisture rate of different date fruits for solar drying, for (a) Sakkoti (using Two-term mathematical model), (b) Malkabii (using Newton (Lewis) mathematical model), and (c) Gondaila (using Two-term mathematical model).
Sustainability 16 03506 g008
Figure 9. Predicted and observed moisture rate of different date fruits for open-air drying, for (a) Sakkoti (using Two-term and Page mathematical model), (b) Malkabii (using Page mathematical model), and (c) Gondaila (using Newton (Lewis) mathematical model).
Sustainability 16 03506 g009
Figure 10. Predicted and observed moisture rate of different date fruits for solar drying, for (a) Sakkoti (using Logarithmic mathematical model), (b) Malkabii (using Logistics mathematical model), and (c) Gondaila (using Logarithmic mathematical model).
Sustainability 16 03506 g010
Table 2. Embodied energy calculation data for ASD manufacturing.
No.MaterialsEmbodied Energy Weight Embodied Energy (kW·h)References
Solar collector
1Metal frame 55.28 (kW·h/kg)20.0 (kg)1105.6[104,105]
2Glass cover7.28 (kW·h/kg)10 (kg)72.8[106]
3Wood dust2.0 (kW·h/kg)2.0 (kg)4.0
4Paint25.11(kW·h/kg)1.0 (kg)25.11
5Absorber plate9.636 (kW·h/kg)10.5 (kg)101.18
Drying room
1Metal frame 55.28 (kW·h/kg)25 (kg)1382[104,105]
2Wood dust2.0 (kW·h/kg)2.0 (kg)4.0[106]
3Paint25.11 (kW·h/kg)1.0 (kg)25.11
4Hinges55.28 (kW·h/kg)0.05 (kg)2.764[104,105]
Handel 55.28 (kW·h/kg)0.05 (kg)2.764
5Suction fan 1. Plastic parts2. Motor and cooper wires19.44 (kW·h/kg)19.61(kW·h/kg)0.20 (kg)0.20 (kg)3.8883.922
6Drying trays 1. Wire mesh 2. Metal frame9.67 (kW·h/kg)55.28 (kW·h/kg)3 (kg)5 (kg)29.01276.4
Total embodied energy for ASD (solar collector + drying room) (kWh)1932.95
PV system
1Metal frame55.28 (kW·h/kg)4.5 (kg)248.76[104,105]
2PV system1130.6 kW·h/m20.65 m2734.89
3Battery 148.4515--46.00
4Battery charger ----33.00
Total embodied energy for PV system (kWh)1062.65
Table 3. Drying coefficient (k) and determination coefficient (R2) for different date fruit varieties and drying methods.
Date Fruit VarietyOADASD
kR2kR2
Sakkoti0.0790.99630.1330.9775
Malkabii0.0780.99020.1550.9858
Gondaila0.0690.9860.1360.9769
Table 4. Previous studies of EMD of dried product.
ReferenceDried Product EMD, m2/s
Ambawat et al. [2]Moringa oleifera leaves3.59 × 10−10–2.92 × 10⁻¹⁰
Quality [35]Tomato1.01 × 10−9–1.53 × 10⁻⁹
Sandeepa and Rao [50]Sorghum Seeds3.01 × 10−10–5.50 × 10⁻¹⁰
Akpinar and Bicer [58]Strawberry4.52 × 10−10–9.63 × 10⁻¹⁰
Pahlavanzadeh et al. [74]Grapes2.4 × 10−10–6.22 × 10⁻¹⁰
Lee and Hsieh [132]Strawberry2.4 × 10−9–12.1 × 10⁻⁹
Kaya et al. [133]Quince0.65 × 10−10–6.92 × 10⁻¹⁰
Doymaz [134]Apricot6.76 × 10−10–12.6 × 10⁻¹⁰
Aghbashlo and Samimi-Akhijahani [135]Berberis3.32 × 10−10–90 × 10−10
Ruiz-Cabrera et al. [136]Cactus pears1.51 × 10−10–5.32 × 10⁻¹⁰
TİREKİ [137]Date fruit1.53 × 10−9–1.74 × 10⁻⁹
Current studyDate fruit7.14 × 10−12–2.17 × 10⁻¹¹
Table 5. Statistical analysis of different mathematical thin-layer models for different date fruit varieties and drying methods.
Drying TypeOADASD
Model
No.
Model NameDate Fruit VarityModel Constant *R2 χ 2 RSMEModel ConstantR2 χ 2 RSME
1.Newton (Lewis)Sakkoti k = 0.086410.992850.000360.01826k = 0.147590.990200.000670.02458
Malkabii k = 0.084970.986630.000650.02457k = 0.166340.994960.000390.01862
Gondaila k = 0.078770.996320.001420.03635k = 0.144200.992090.000560.02228
2.PageSakkoti k = 0.11193
n = 0.88133
0.999700.000020.00379k = 0.17392
n = 0.90575
0.994030.000470.01942
Malkabii k = 0.11294
n = 0.86684
0.994730.000270.01534k = 0.18233
n = 0.94401
0.996080.000350.01640
Gondaila k = 0.13018
n = 0.76603
0.994380.000240.01441k = 0.15348
n = 0.96291
0.992570.000600.02158
3.Modified Page IIISakkoti k = 0.97113
d = 2.33661
n = 0.45109
0.996170.000230.01356k = 0.98502
d = 2.01894
n = 0.58914
0.991120.000800.02370
Malkabii k = 0.96601
d = 2.24414
n = 0.40458
0.991370.000450.01962k = 0.99207
d = 1.80709
n = 0.53739
0.995130.000500.01829
Gondaila k = 0.93937
d = 2.37609
n = 0.39832
0.998310.000770.02461k = 0.99821
d = 1.90394
n = 0.52134
0.992100.000740.02227
4.Henderson and PabisSakkoti k = 0.08262
a = 0.97113
0.996170.000210.01356k = 0.14454
a = 0.98502
0.991120.000700.02370
Malkabii k = 0.08034
a = 0.96601
0.991370.000450.01962k = 0.16456
a = 0.99207
0.995130.000430.01829
Gondaila k = 0.07055
a = 0.93938
0.983550.000710.02461k = 0.14382
a = 0.99821
0.992100.000640.02227
5.LogarithmicSakkoti k = 0.11357
a = 0.84061
c = 0.15245
0.999610.000020.00431k = 0.20565
a = 0.85583
c = 0.15644
0.997620.000220.01228
Malkabii k = 0.10644
a = 0.84005
c = 0.14246
0.993520.000370.01701k = 0.20680
a = 0.90099
c = 0.10759
0.997670.000240.01265
Gondaila k = 0.12380
a = 0.71555
c = 0.25526
0.992300.000360.01686k = 0.18640
a = 0.88519
c = 0.12941
0.994790.000490.01810
6.Two-termSakkoti ko = 0.05115
k1 = 0.16597
a = 0.57410
b = 0.42183
0.999790.000010.00319ko = 0.0000
k1 = 0.20565
a = 0.15644
b = 0.85583
0.997620.000250.01228
Malkabii ko = 0.08034
k1 = 0.08034
a = 0.48300
b = 0.48300
0.991370.000540.01962ko = 0.16456
k1 = 0.16456
a = 0.49603
b = 0.49603
0.995130.000600.01829
Gondaila ko = 0.07055
k1 = 0.07055
a = 0.46969
b = 0.46969
0.983550.000850.02461ko = 0.14382
k1 = 0.14382
a = 0.49911
b = 0.49911
0.992100.000890.02227
7.Two-term ExponentialSakkoti k = 0.09870
a = 0.97971
0.998980.000060.00703k = 0.17033
a = 0.98201
0.998560.000110.00956
Malkabii k = 0.08497
a = 1.00000
0.998590.000700.02457k = 0.18296
a = 0.98758
0.999670.000160.01118
Gondaila k = 0.10231
a = 0.95862
0.987300.000660.02178k = 0.16081
a = 0.98329
0.995230.000380.01727
8.Approximation diffusion or Diffusion ApproachSakkoti k = 0.08641
a = 1.00000
b = 1.00000
0.993120.000420.01826k = 0.14759
a = 1.00000
b = 1.00000
0.990490.000860.02458
Malkabii k = 0.08497
a = 1.00000
b = 1.00000
0.986630.000770.02457k = 0.16634
a = 1.00000
b = 1.00000
0.994960.000520.01862
Gondaila k = 0.07877
a = 1.00000
b = 1.00000
0.965140.001680.03635k = 0.14420
a = 1.00000
b = 1.00000
0.992090.000740.02228
9.Modified Henderson and PabisSakkoti k = 0.02618
a = 0.29215
b = 0.34879
c = 0.35322
g = 0.14614
h = 0.10983
0.999710.000020.00373k = 0.14454
a = 0.32834
b = 0.32834
c = 0.32834
g = 0.14454
h = 0.14454
0.991120.000800.02370
Malkabii k = 0.08034
a = 0.32200
b = 0.32200
c = 0.32200
g = 0.08034
h = 0.08034
0.991370.000670.01962k = 0.16456
a = 0.33069
b = 0.33069
c = 0.33069
g = 0.16456
h = 0.16456
0.995130.001000.01829
Gondaila k = 0.07055
a = 0.31312
b = 0.31312
c = 0.31312
g = 0.07055
h = 0.07055
0.983550.001060.02461k = 0.14382
a = 0.33274
b = 0.33274
c = 0.33274
g = 0.14382
h = 0.14382
0.992100.001490.02227
10.Combined Two-term and PageSakkoti k = 0.11429
a = 1.00391
b = 0.00000
h = 0.82522
n = 0.87436
0.999730.000020.00362k = 0.18152
a = 1.01091
b = 0.00000
h = 0.78848
n = 0.88943
0.994260.000730.01907
Malkabii k = 0.11343
a = 0.99892
b = 0.00077
h = 0.77768
n = 0.86410
0.994730.000410.01534k = 0.18902
a = 1.00368
b = 0.00000
h = 0.72906
n = 0.92519
0.996080.000610.01641
Gondaila k = 0.12499
a = 0.99237
b = 0.00000
h = 0.78021
n = 0.77924
0.994520.000310.01423k = 0.15986
a = 1.00925
b = 0.00000
h = 0.74414
n = 0.94662
0.992760.001020.02133
11.Simplified Fick’s DiffusionSakkoti a = 0.97113
c = 0.45109
L = 2.33661
0.996170.000230.01356a = 0.98502
c = 0.45737
L = 1.77887
0.991120.000800.02370
Malkabii a = 0.96601
c = 0.40458
L = 2.24414
0.991370.000490.01962a = 0.99207
c = 0.53739
L = 1.80709
0.995130.000500.01829
Gondaila a = 0.93937
c = 0.39832
L = 2.37609
0.983550.000770.02461a = 0.99821
c = 0.52134
L = 1.90394
0.992100.000740.02227
12.LogisticsSakkoti k = 0.08251
a = 154.858
b = 151.019
0.996080.000240.01373k = 0.14519
a = 2434.74
b = 2407.56
0.991090.000810.02375
Malkabii k = 0.08097
a = 43.0337
b = 42.4148
0.991130.000500.01991k = 0.16610
a = 207.685
b = 208.129
0.995010.000510.01853
Gondaila k = 0.07148
a = 332.550
b = 314.967
0.983390.000780.02475k = 0.145594
a = 86.73296
b = 87.99771
0.991940.000760.02253
* MR is the moisture ratio (dimensionless); L is the slab thickness (m); k, k0, and k1 are the drying constants (day-1); a, b, c, d, g, h, and n are the model constants (dimensionless); t is the drying time (day).
Table 6. The first and the second recommended mathematical models for different date fruit varieties and drying methods (the highest R2 and lowest χ 2
Date VarietyOADASD
The FirstThe SecondThe FirstThe Second
SakkotiTwo-termCombined Two-term and PageTwo-term ExponentialLogarithmic
MalkabiiTwo-termPage and Combined Two-term and PageNewton (Lewis)/Approximation or diffusion or Diffusion ApproachLogistics
GondailaModified Page IIINewton (Lewis)Two-term ExponentialLogarithmic
Table 7. Various costs related to the ASD and PV system.
Cost ParametersASDPV System
Capital cost, USD468.7562.5
Lifespan, years1020
Annual capital cost, USD112.0312.83
Annual maintenance cost, USD3.3690.385
Annual salvage value, USD8.9841.027
Annualized investment cost, USD106.4212.188
The annual cost of the ASD integrated PV system, USD118.61
Table 8. Economic analysis of ASD integrated with PV system.
Economic ParametersASD Integrated with PV System
Mass of date fruit dried per batch, kg35
Quantity of dried date fruit annually, kg175
Drying cost per kg of date fruit, USD0.677
Cost of 1 kg fresh date fruit, USD0.625
Mass of fresh date fruit per batch, kg38.5
Cost of fresh date fruit per kg of dried product, USD0.687
Cost of 1 kg of crop dried date fruit inside dryer, USD1.364
Selling price per kg of date fruit, USD3.0
Saving per Kg of date fruit, USD1.636
Saving per batch, USD57.26
Saving per day, USD6.3622
Saving after 1 year, USD229.04
Payback time, years2.476
Table 9. Analysis of different environmental parameters.
Date Fruit VarietySakkotiMalkabiiGondaila
Specific energy consumed, kW·h/kg17.93622.74621.264
Embodied energy, kW·h2995.62995.62995.6
Annual thermal output, kW·h105.1696.719103.458
Total annual thermal output, kW·h397.16388.72395.46
Energy payback time, year7.547.717.58
Net CO2 mitigation over the lifetime, tons8.808.558.75
CO2 emission241.5241.5241.5
Disclaimer/Publisher’s Note: The statements, opinions and data contained in all publications are solely those of the individual author(s) and contributor(s) and not of MDPI and/or the editor(s). MDPI and/or the editor(s) disclaim responsibility for any injury to people or property resulting from any ideas, methods, instructions or products referred to in the content.

