1. Introduction
With heightened awareness of climate change in society, the imperative to address the reduction of greenhouse gas (GHG) emissions from both transportation processes and industrial activities becomes increasingly pronounced [
1]. Natural gas (NG), distinguished by its lower carbon content relative to petroleum fuels like diesel and gasoline, has been in use for an extended period [
2]. Conventional NG and shale gas collectively contribute 1.12% and 1.19% to total GHG emissions, respectively. The substitution of diesel with NG yields a consequential 4–5% reduction in GHG emissions over a period of 100 years [
3]. Recognized for its clean combustion attributes, NG emerges as a promising alternative fuel to diesel, manifesting in its utilization either as compressed natural gas (CNG) or in the liquid state as liquefied natural gas (LNG). CNG finds applicability in light vehicles, while LNG suits heavy-duty vehicles [
4]. In an effort to reduce greenhouse gas emissions, researchers have conducted studies on improving the efficiency and sustainability of LNG filling stations and related infrastructure. Sharafian et al. [
5] emphasized the importance of LNG fueling stations and fuel supply chain designs for effective boil-off gas (BOG) management. Modeling of natural gas pipeline networks was accomplished with the help of mathematical methods by Tabkhi et al. [
6] Researchers have studied how to adapt the current natural gas transmission network to the transportation of hydrogen–natural gas mixtures. By modeling and analyzing the pressure-reducing station pipeline, Tan et al. [
7] proposed a small-scale liquefaction process without additional energy consumption for liquefying a portion of natural gas in a pressure-reducing station. The results showed that the liquefaction rate (LR) and the exergy utilization rate (EUR) were increased by 41.2 and 43.8% compared to the corresponding values from the literature. Comprising predominantly methane (83–99.7%), along with ethane, propane, butane, and nitrogen [
8], LNG stands as a cryogenic liquid characterized by its low-temperature storage at −162 °C. The evaporation of LNG, giving rise to BOG and subsequent pressure elevation, necessitates strategic heat management [
9]. LNG carriers adopt measures such as BOG release to the atmosphere, re-liquefaction, or utilization in their engines to maintain optimal LNG conditions [
10,
11]. The return of BOG from vehicles to the station poses an additional challenge, leading to sudden pressure spikes in LNG storage tanks and activating pressure relief valves [
12]. Powars [
13], in a rudimentary estimation, reported an average methane venting rate of about 1 vol% per delivery of unsaturated LNG to stations from LNG refueling stations. Despite the critical role of BOG management technologies in curbing excessive greenhouse gas emissions and ensuring the safety of LNG refueling stations, it is notable that 44% of LNG refueling station designs lack BOG management. Additionally, 28% rely on liquid nitrogen condensers or liquefiers, while another 28% employ compression for CNG production [
5]. In the realm of LNG terminals and refueling stations, cryogenic submerged pumps and storage tanks assume pivotal roles as transmission and reserve devices. The optimal design of pipelines connecting submersible pumps and storage tanks emerges as a critical facet of LNG refueling stations. Inadequate insulation, heightened fluid resistance, and imprudent height differentials in these pipelines may induce submersible pump cavitation and insufficient liquid flow from storage tanks, thereby jeopardizing the fulfillment of refueling gas demands and precipitating unwarranted BOG generation.
T-type tee junctions find common applications in the design of pipelines connecting submersible pumps to storage tanks. Numerous researchers have delved into the investigation of pressure drops in these tee configurations, recognizing their profound impact on gas transmission efficiency. Firstly, employing experimental methodologies, Costa et al. [
14] scrutinized the pressure drop of 90° tee junctions with both sharp and rounded corners, utilizing a Newtonian fluid as the forcing medium. Rahmeyer et al. [
15,
16] determined pressure loss coefficients for forged steel weld pipe tees and PVC pipe tees. Hirota et al. [
17] conducted a comprehensive analysis of velocity and concentration fields in a counter-flow-type T-junction through the amalgamation of particle image velocimetry (PIV) and planar laser-induced fluorescence (PLIF) techniques. Pérez-García et al. [
18] characterized energy losses at 90-degree T-junctions. Secondly, fluid dynamics research often relies on computational fluid dynamics (CFD) methods. These methods are widely embraced by scholars for their versatility and efficacy. In the realm of CFD, scholars have delved into an array of sophisticated mathematical techniques, which are used to unravel complex phenomena. For instance, Li et al. [
19] introduced a groundbreaking fluid–structure coupling modeling and sensing method to elucidate the vibration mechanism induced by multiple floating structures (MFSVs). Meanwhile, Yang et al. [
20] pioneered a nonlinear finite volume (FV) scheme tailored to nonlocal Nagumo-type nonlinear equations, addressing challenges posed by diffusion tensor coefficients. Further expanding the CFD toolkit, Yang et al. [
21] devised a novel positivity-preserving nonlinear method, particularly potent for scenarios involving strongly anisotropic and heterogeneous subdiffusion coefficient problems. Wang et al. [
22] contributed to the arsenal of techniques with a dual innovation: a unique double reduction order technique coupled with a nonlinear compact difference operator on graded meshes. This innovation enables the simulation of nonlocal fourth-order partial differential equations characterized by Burgers’ type of nonlinearity. In a similar vein, Li et al. [
23] proposed a fluid–structure coupling modeling and solution strategy leveraging the level set and residue theorems. Their methodology yields insights into the vibration evolution induced by gas-carrying vessels (GCVFs) at critical penetrating states. Meanwhile, Xiao et al. [
24] devised a fully-discrete alternating direction implicit (ADI) difference method tailored to three-dimensional fractional subdiffusion equations, adeptly handling variable coefficients. Beyond theoretical exploration, the CFD methods have also been used to analyze the performance of the tee as well as the internal flow field. Beneš et al. [
25] explored laminar and turbulent flows of Newtonian and non-Newtonian fluids in tee junctions through numerical simulations. Abdulwahid et al. [
26] predicted the pressure loss in turbulent incompressible flow through a 90° tee junction, revealing increased pressure and total energy losses with escalating flow rate ratios. Merzari et al. [
27] employed large eddy simulations (LESs) to calculate the flow field in a T-junction. Miranda et al. [
28] investigated laminar steady and unsteady flows in a two-dimensional T-junction via CFD analysis. Finally, some researchers integrated experimental and numerical simulation approaches to explore the T-type tee. Li et al. [
29] probed the drag reduction effect influenced by T-junction close-coupled pipes using both experimental and numerical methods. Chen et al. [
30] analyzed the mechanism of pressure loss under various operating conditions through a combination of experiments and numerical simulations. Bluestein et al. [
31] conducted an experimental and computational comparison of the turbulent flow field for a sharp 90-degree elbow and a plugged tee junction. In stark contrast, academic investigations into the dovetail tee, which also serve to link submerged pumps with storage tanks, are notably scarce.
Consequently, this study employed CFD methods to scrutinize both the T-type and dovetail tees. The investigation encompassed pressure and velocity distributions, pipeline head losses, and hydraulic calculations between LNG storage tanks and submersible pumps. By studying pressure and velocity distributions in distinct structural configurations of the tee junctions, analyzing head losses under different inlet flow conditions, and conducting hydraulic calculations before and after the transformation from the submersible pump to the pipeline, this study aimed to elucidate the elevation difference effects on LNG storage tank fittings and the hidden line elevation difference between the pump and the pipeline. In an effort to meet pump cavitation conditions and increase liquid volume, this study endeavored to minimize the pipeline elevation difference, thereby enhancing economic and environmental viability. The impact of a pipeline height difference was examined through the strategic replacement of certain pipe fittings. In conditions where pump cavitation was avoided, the gas transmission volume was ensured, and the pipeline height difference was controlled, this study sought to optimize economic and environmental factors. These enhancements have instructive significance for practical project applications.
2. CFD Simulation of Tee in LNG Pipeline
Despite the stipulation of coefficients of local resistance for various types of tees in specifications and manuals, the resistance of diverse local pipe fittings within the pipeline is marked by significant variation under disparate conditions. Furthermore, relying solely on the prescribed coefficient of local resistance in manuals may result in significant deviations from expected outcomes. Consequently, this study undertook a numerical and physical exploration of the flow characteristics of LNG within tees featuring distinct structures.
2.1. Modeling and Meshing
This study employed the Design Modeler within the geometry module of ANSYS Workbench to construct a 3D model, as illustrated in
Figure 1. Grid division was performed as depicted in
Figure 2. The model encompasses two distinct types of tees: T-type and dovetail tees. Hexahedral mesh was chosen for the pipe sections because it can align with streamlines and reduce computational complexity. In contrast, the tees utilized a tetrahedral mesh, which conforms to the pipe wall, ensuring superior adaptability.
Grid independence was rigorously examined through three iterations, employing mesh numbers of 841,760 and 805,976 for the T-type and dovetail tees, respectively.
2.2. Model Verification
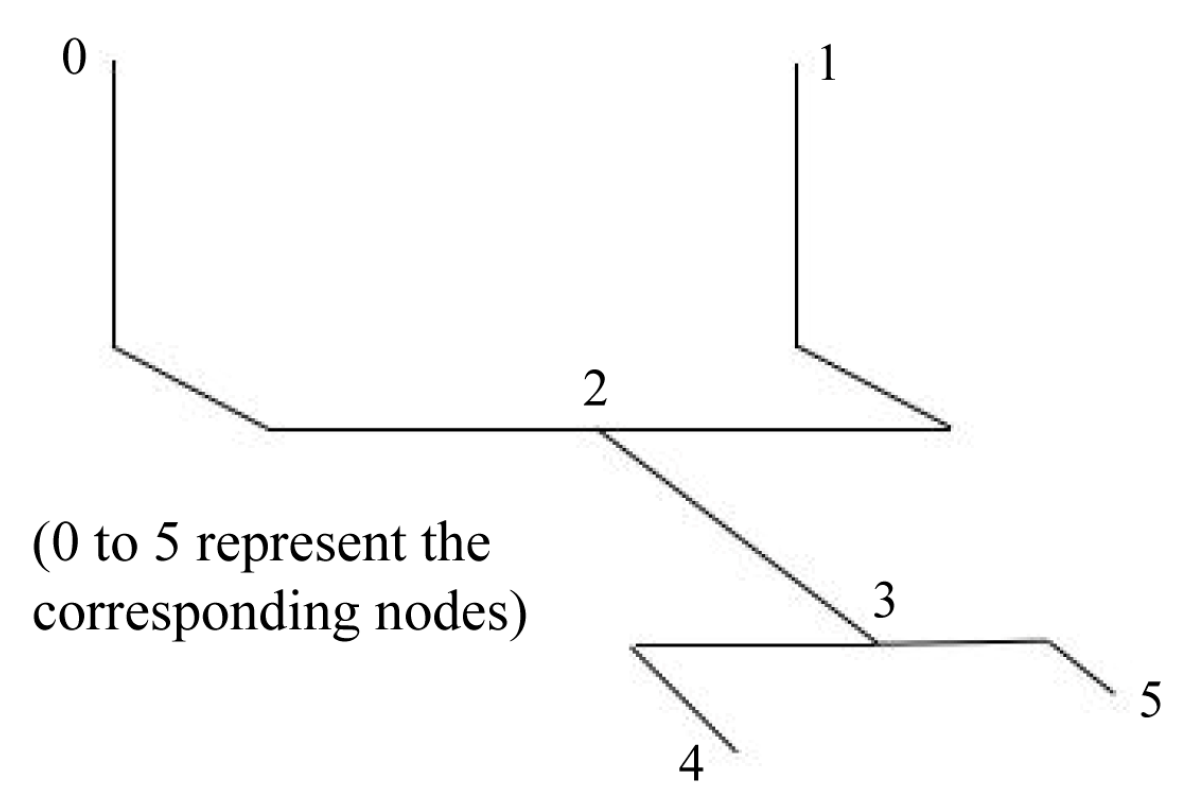
The reasonableness of the model for the T-type tee was examined in comparison with the test results for 50 mm equal-diameter T-type shunt tees in the literature [
32]. This type of tee was modelled as a single inlet on the lower side and a double outlet on the upper side, with water as the internal fluid material. Changes were made to the corresponding face designations as
Figure 3:
The physical tests in the literature counted the local resistance coefficients of the outlets at four different inlet flow rates, respectively (the difference between the local resistance coefficients of the two outlets was not significant, so the local resistance coefficients of only one outlet were calculated). According to the test conditions in the literature on the three-way model, we set the corresponding conditions as shown in
Table 1.
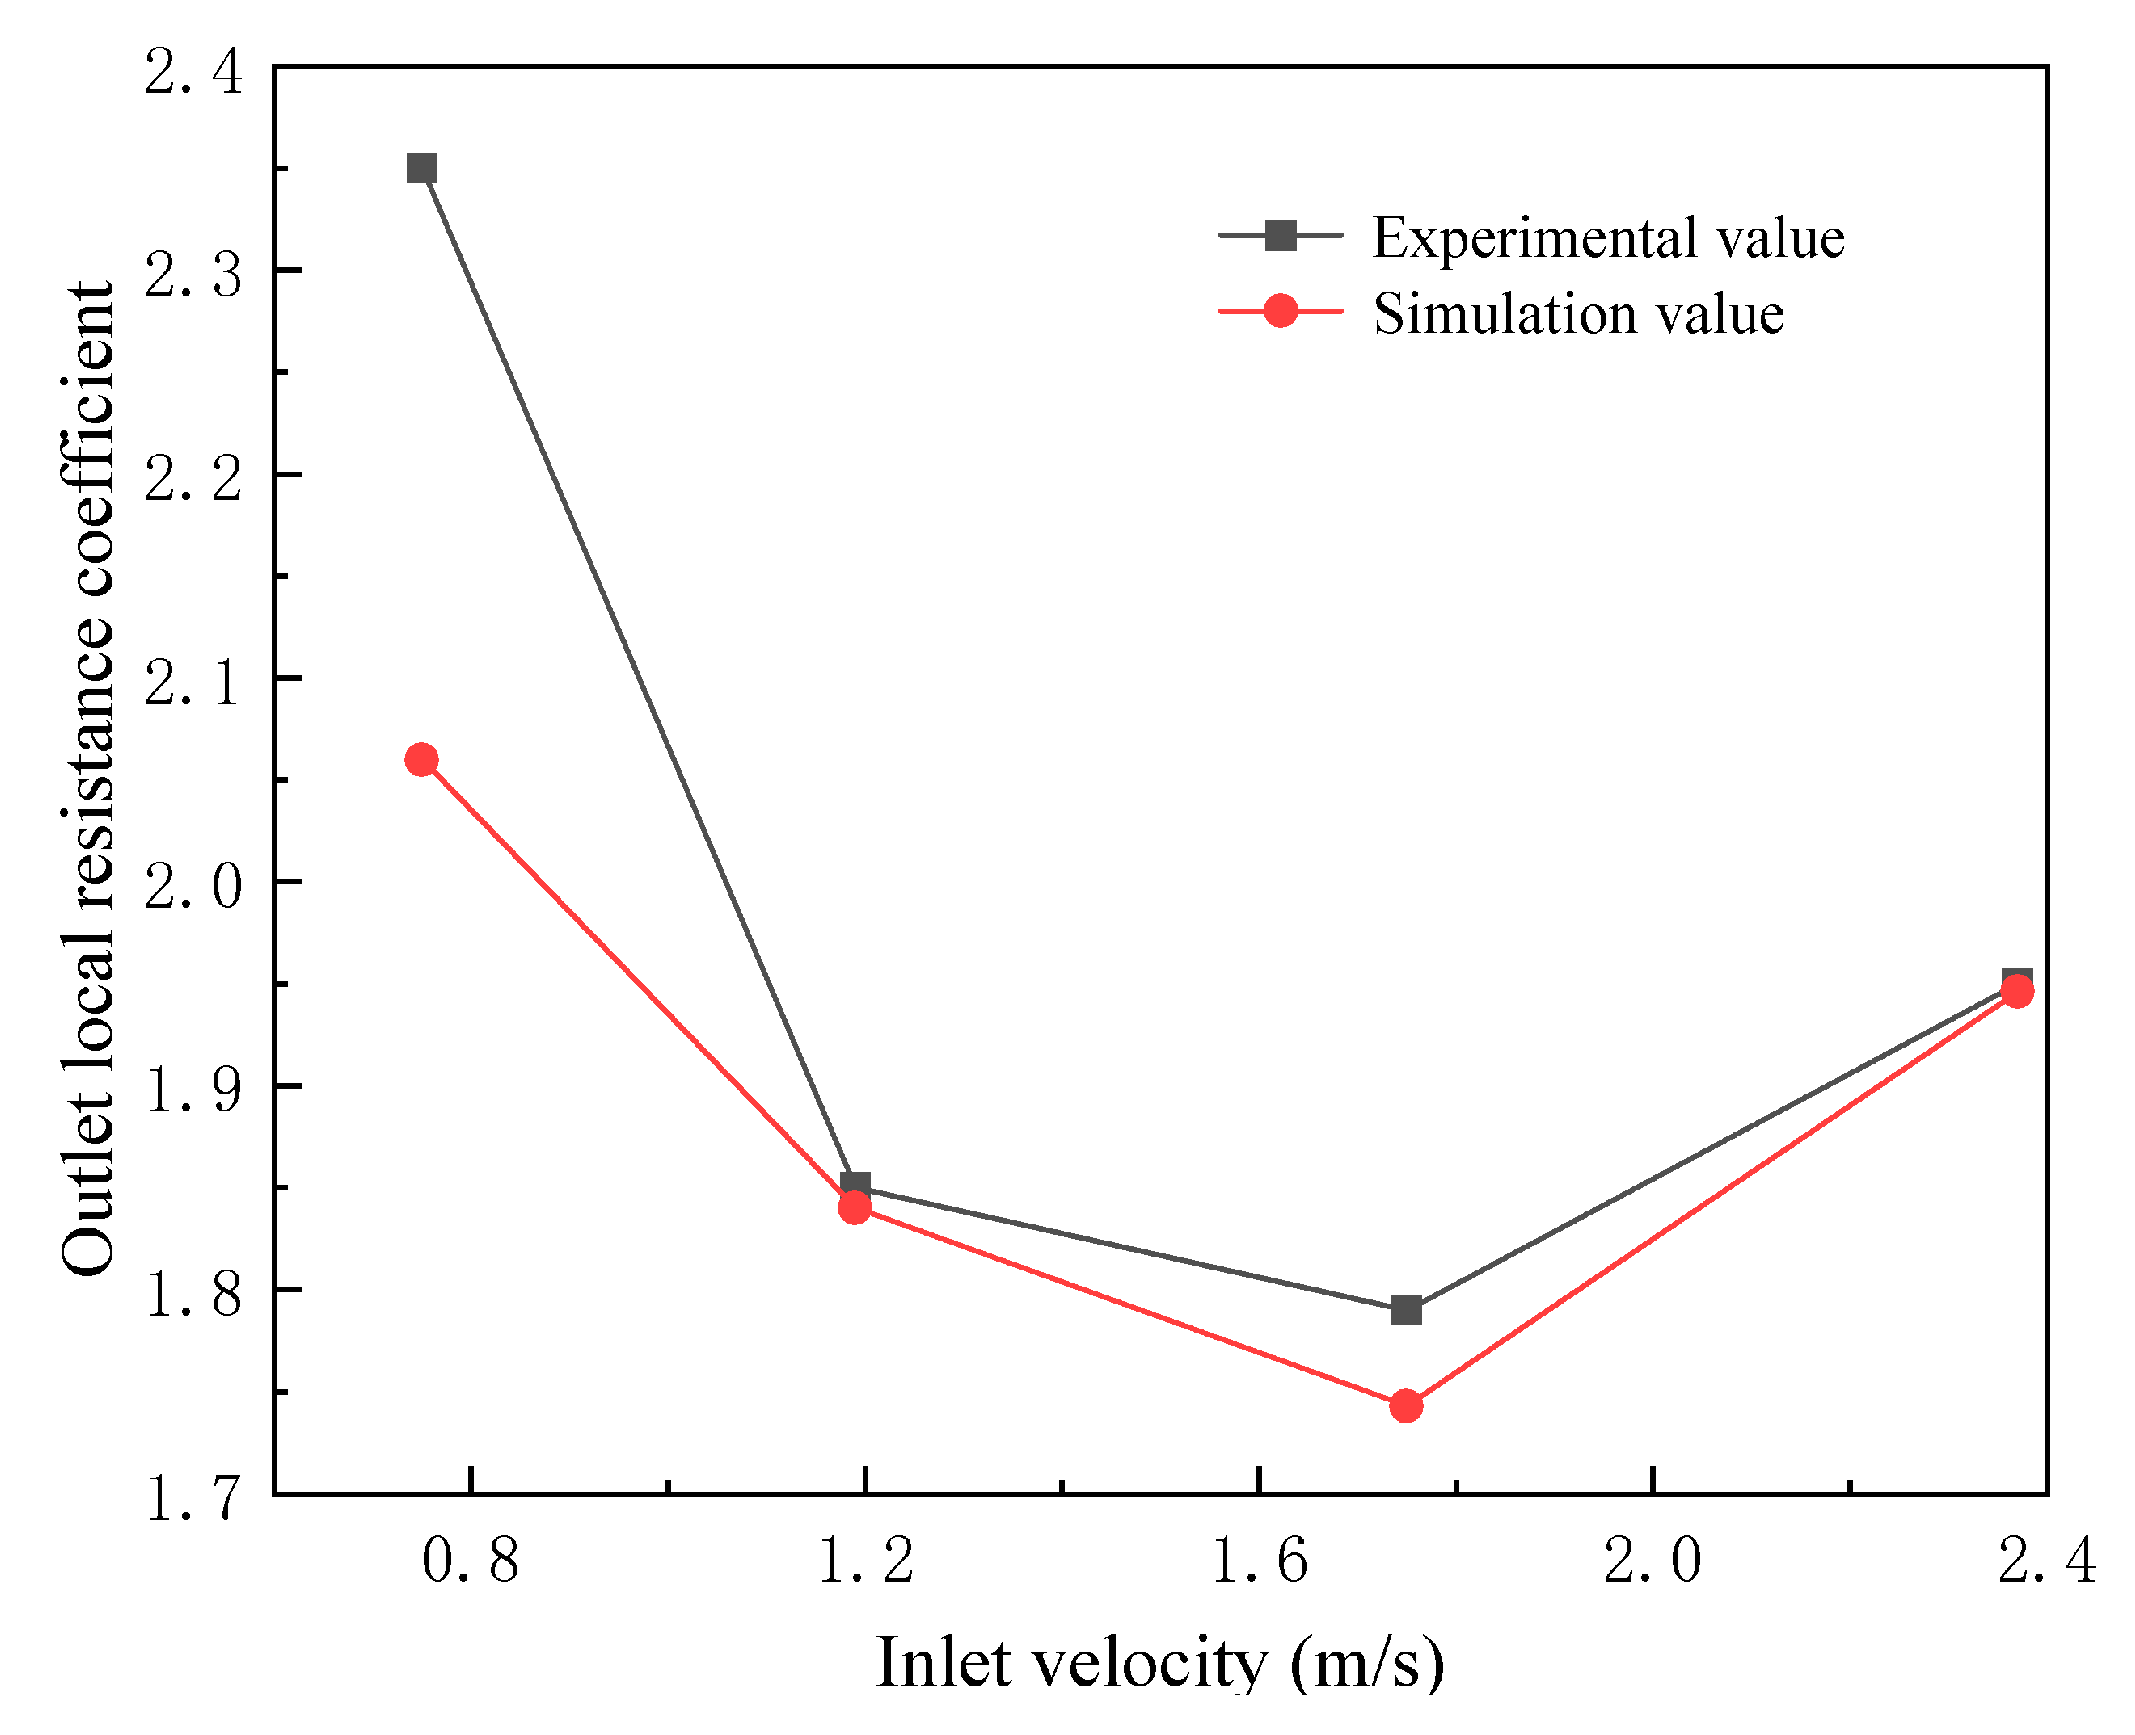
The results of our comparison of the simulation results with the experimental results from this study are shown in
Figure 4. The simulation data were in general agreement with the experimental data, with a more significant difference only at lower flow rates, with a minimum error of 0.2% and a maximum error of 12.3%. The error may have been due to the following: (a) simulation data with 20 °C water as the fluid, and the reality of the test where the viscosity of water, density, and other aspects created differences; (b) the test had errors while the conditions of the simulation were more ideal; and (c) the chosen turbulence model does not accurately simulate all ranges of Reynolds numbers.
Since the trend was largely the same as the test data and the error was not large, this could be regarded as a reasonable T-type tee model for use.
2.3. Model Setting
The turbulence model used in this study was the k-epsilon model. Two important physical properties of LNG, density and dynamic viscosity, were added to the material database as new material, with values of 439 kg/s2 and 9.36 × 10⁻⁵ Pa·s, respectively. For the boundary conditions of the two types of tees, the inlet condition was set as a mass-flow inlet with rates of 0.5 kg/s, 0.75 kg/s, 1 kg/s, and 1.5 kg/s, while the outlet boundary condition was defined as outflow. The pipe wall was set as a no-slip wall, with a default roughness height matching that of a stainless-steel pipe wall, at 0.0457 mm. The solution methodology was set to SIMPLEC. Convergence quality was assessed using standardized iterative residuals, with a threshold of 0.0001 set for the monitor, while other parameters were left unspecified, retaining their default values.
2.4. Calculation Condition Setting
The T-type and dovetail tees were divided into four operating conditions to perform simulation calculations, as shown in
Table 2.
Next, the static pressure, flow velocity nephogram, and vector diagram under the above four conditions of the T-type tee and dovetail tee were compared and analyzed.
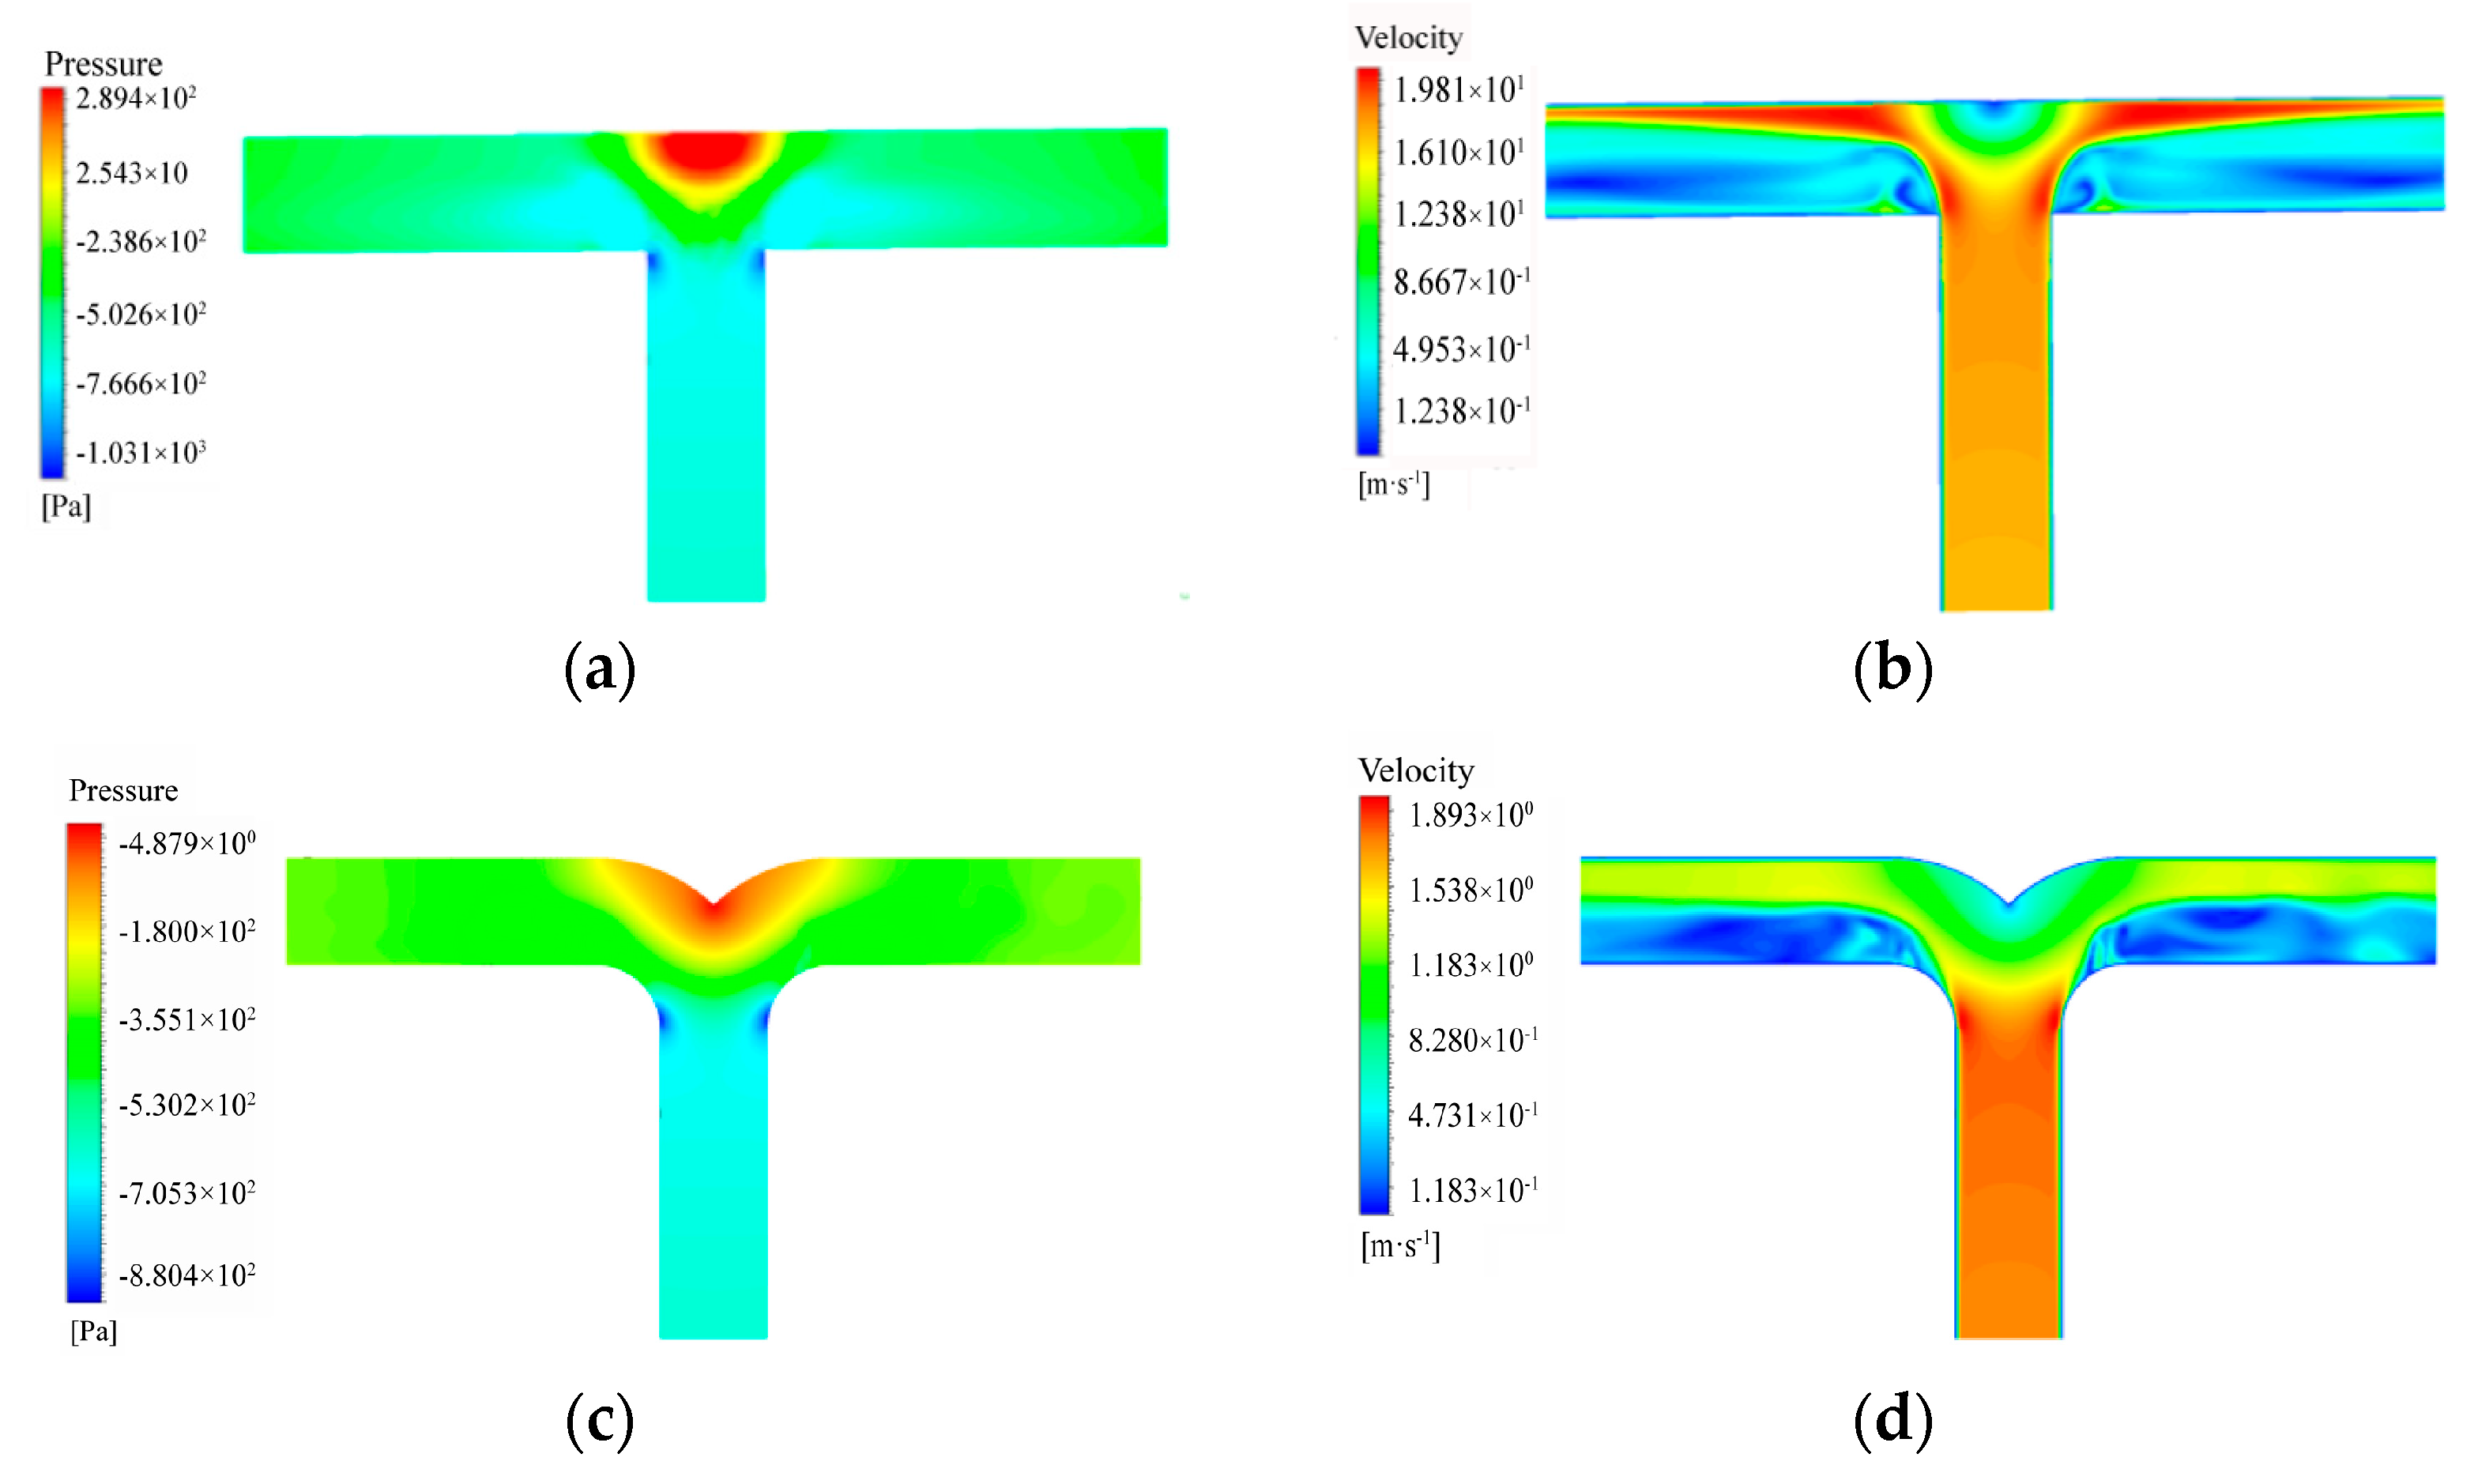
As shown in
Figure 5, in conditions 1 and 5, LNG enters through the lower side inlet and exits through the horizontal outlets. Within the dovetail tee, LNG enters the bifurcation area, and owing to the guiding and transitional effects of the arc section, the majority of the fluid flow line uniformly changes direction along the arc, exhibiting a smaller gradient of change in flow direction compared to the T-type tee. The exit section also exhibits upper and lower partitions, with the flow rate of the upper layer notably surpassing that of the lower layer. The upper side of the flow line in the dovetail tee is more uniform and straight in comparison to the T-type tee. The vortex generated in the outlet section of the dovetail tee is evidently weaker than that of the T-type tee, with a smaller separation zone. Moreover, the flow rate and pressure distribution in the dovetail tee are superior to those in the T-type tee, characterized by greater uniformity.
As shown in
Figure 6, the flow direction remains unchanged for conditions 2 and 6, except that the outlet on the right side is closed. The gradual curvature of the arc in the dovetail tee contributes to a more gradual change in flow rate and pressure compared to a T-type tee. Despite the slower turning of the flow line, the fluid near the left wall undergoes compression, resulting in lower static pressure and a higher flow rate. Nevertheless, this effect is relatively minor in comparison with that of the T-type tee, and minimal to no vortexing is discernible. The disparity in flow velocity between the top and bottom of the outlet section is relatively slight. A minute quantity of fluid flows into the right-hand branch, inducing some backflow.
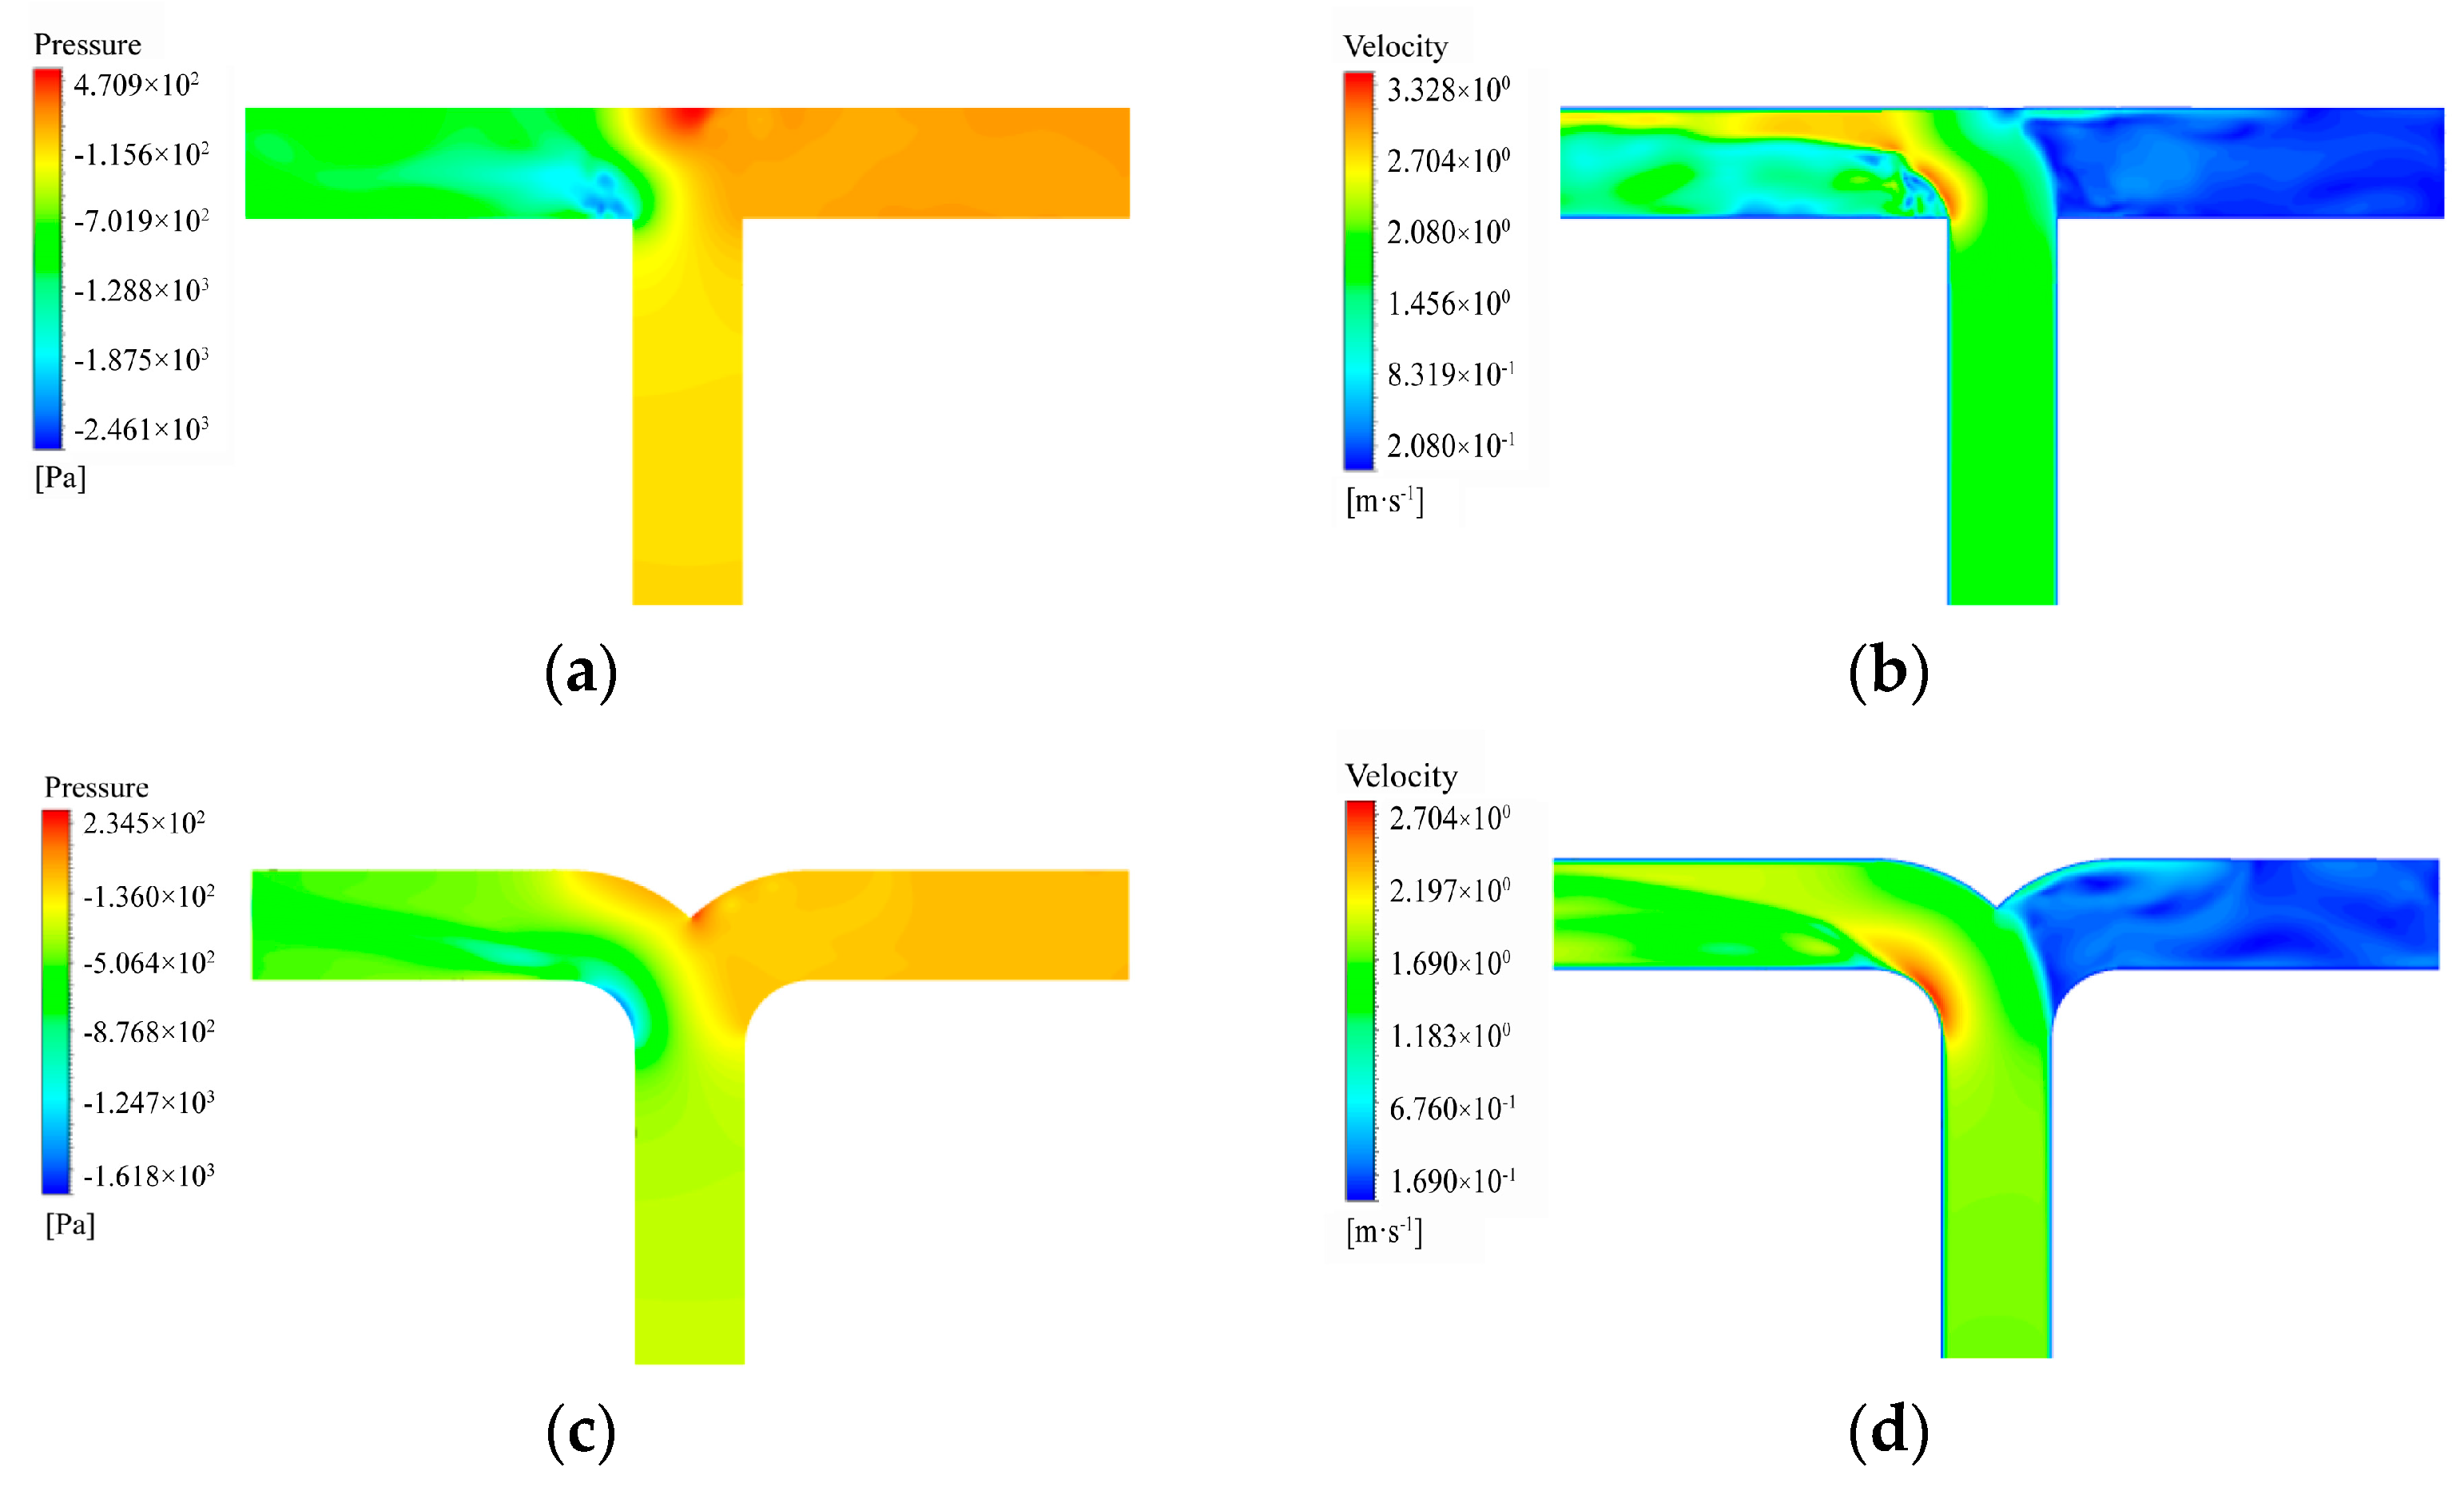
As shown in
Figure 7, for conditions 3 and 7, the fluid flows from the inlets on both sides of the main pipe, converges at the tee, and then proceeds into the outlet section. Within the dovetail tee, the upper layer of fluid experiences a collision with the upper arc wall at the tee fork, inducing a change in flow direction, a localized reduction in flow rate, and an increase in static pressure. Despite the occurrence of friction and collisions as fluid particles converge at the fork, the uniformity of the change in pressure and flow rate distribution is more pronounced than that observed for the T-type tee. Owing to the gradual flow of fluid, vortexing does not manifest in the outlet section.
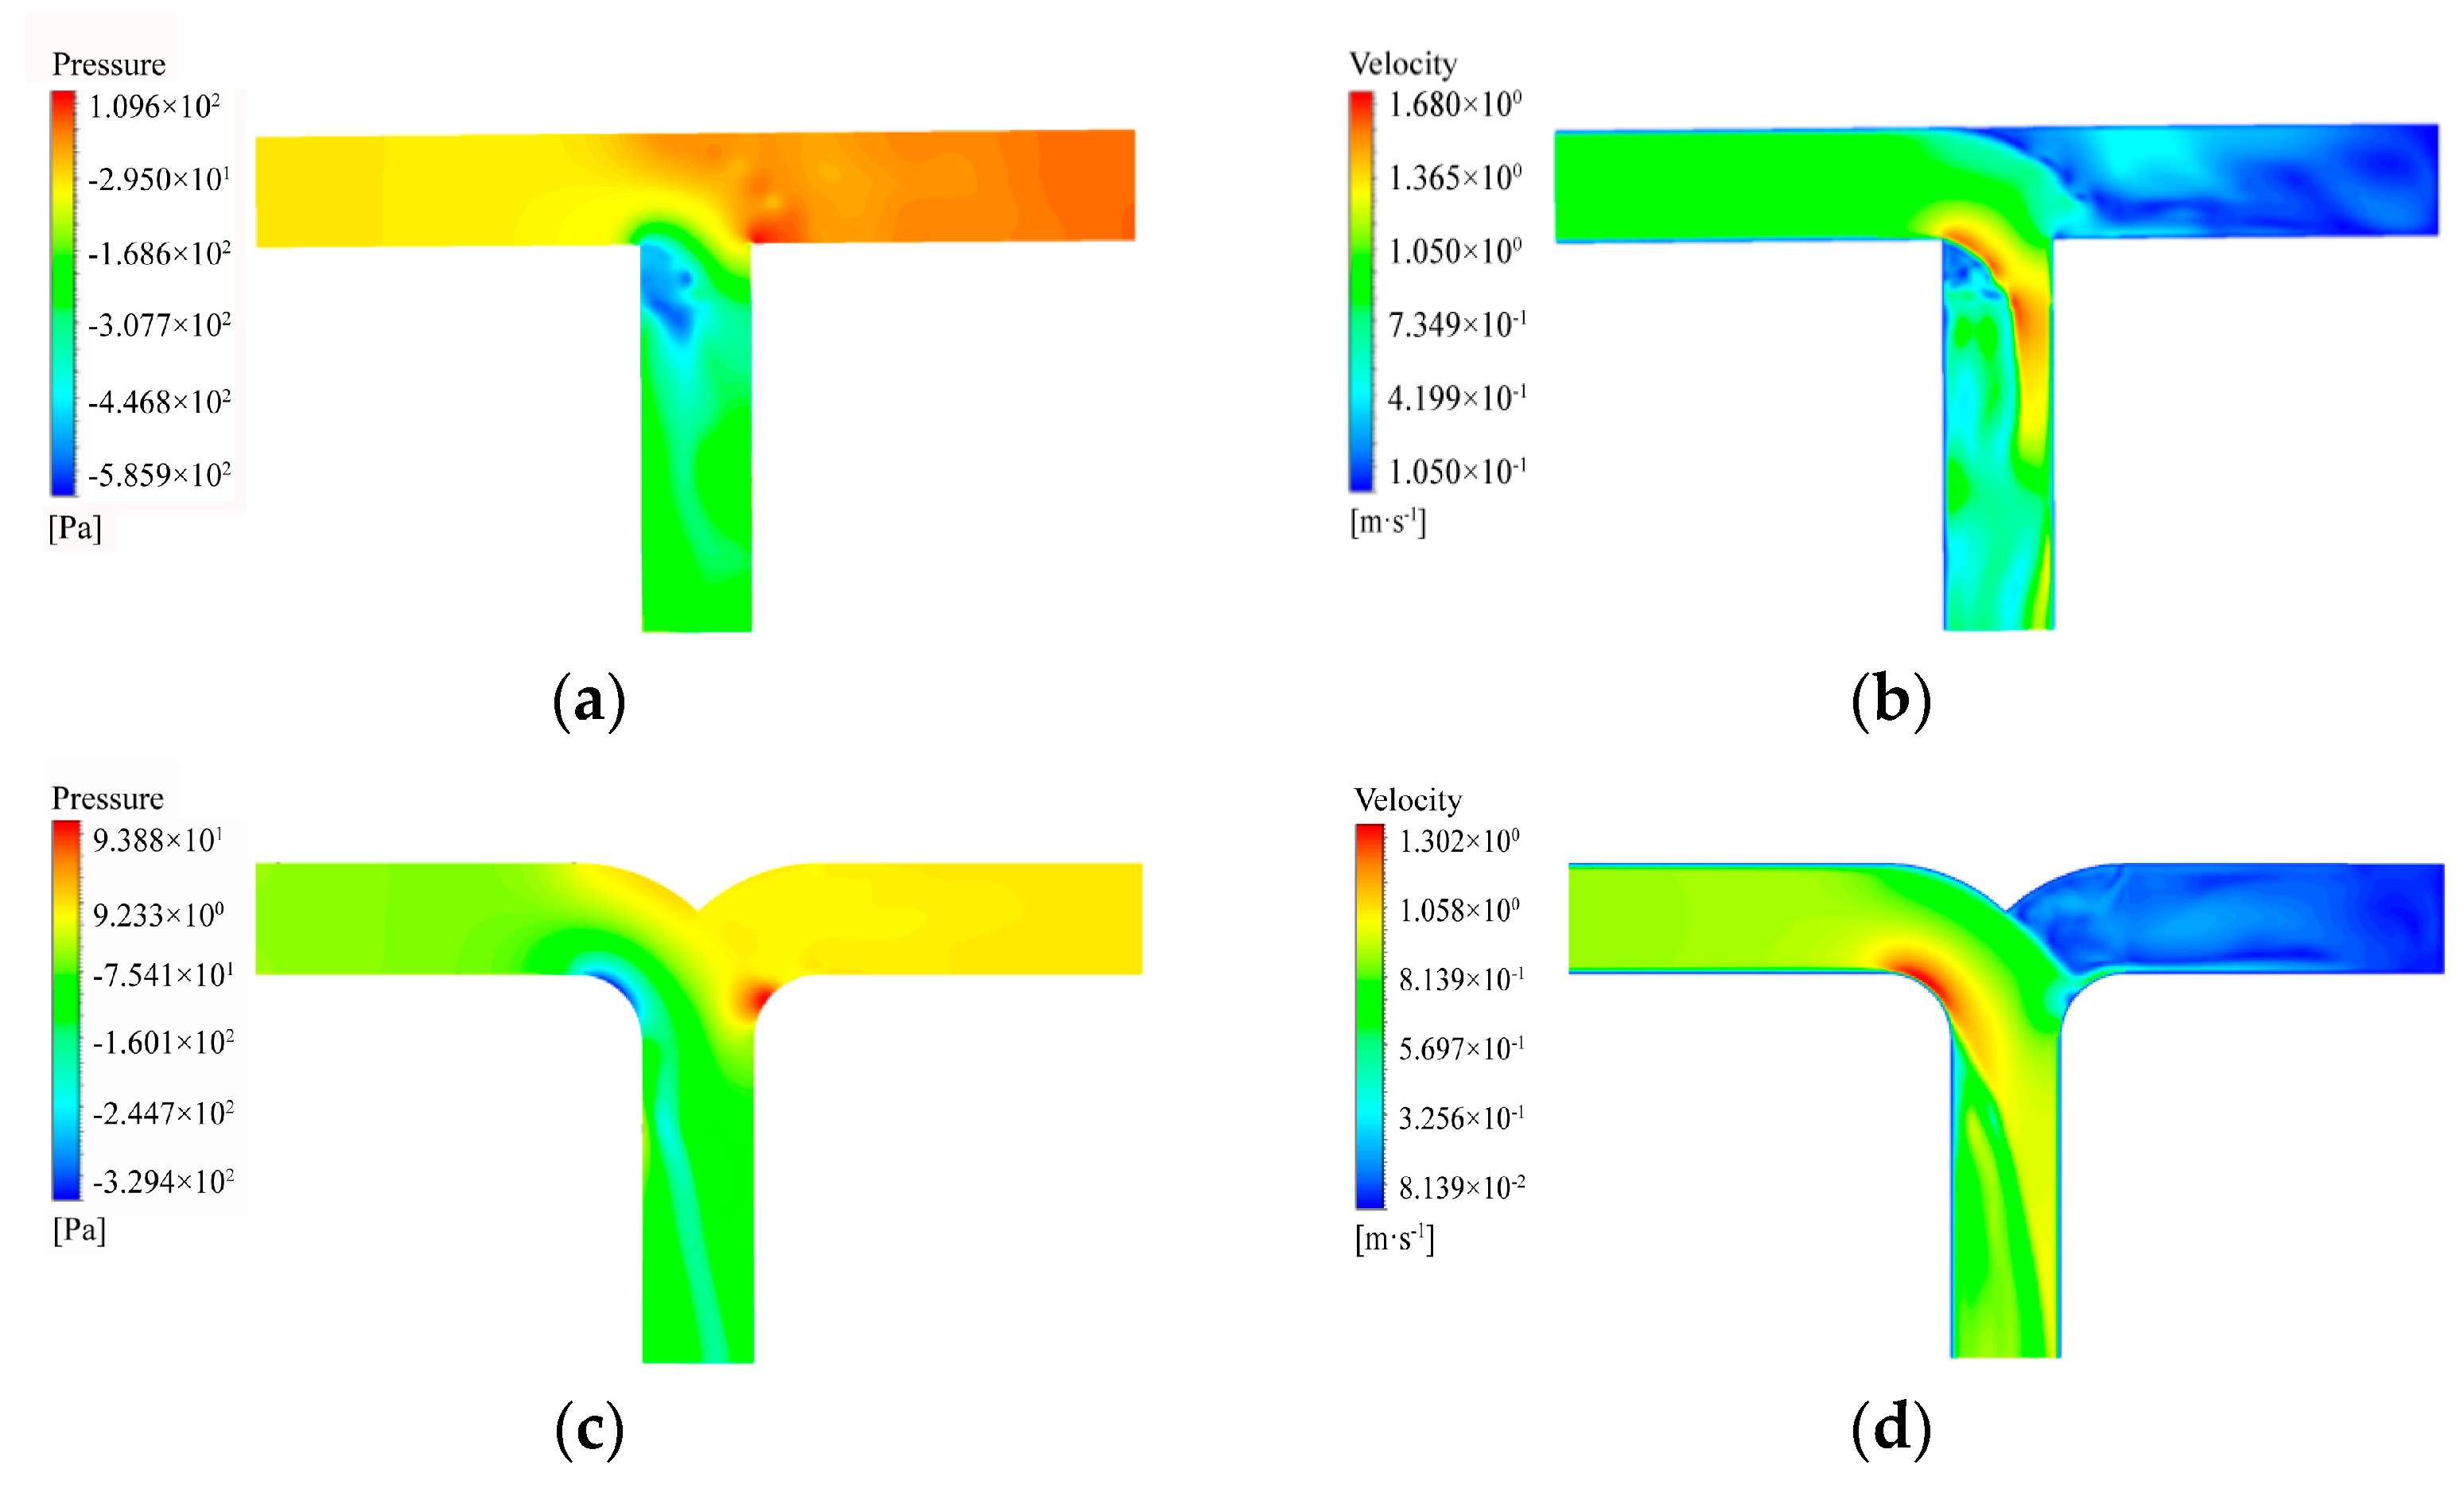
As illustrated in
Figure 8, the conditions 4 and 8 closely resemble condition 3, with the distinction of the closure of the inlet side. Within a dovetail tee, the fluid flow rate adjacent to the left side wall reaches a maximum, leading to a reduction in static pressure and a change in flow direction along the tangent of the arc. Simultaneously, the fluid at the right wall collides with the wall, resulting in a decrease in flow rate and an increase in pressure. However, the flow path is wider compared to the T-type tee, and no vortices are generated. Only a scant number of fluid particles enter the right inlet section, flowing back into the body.
In tee fittings, the inertia of fluid flow prevents it from changing direction with the pipe wall as it passes through the tee. This results in the main flow detaching from the wall, leading to the generation of a vortex. The vortex continuously extracts energy from the main flow, causing an increase in pressure, velocity gradient, pulsation, and exacerbating turbulence. The analysis indicated that, under the aforementioned four conditions, the dovetail tee exhibited a pronounced transition effect compared to the vertical wall of the T-type tee. This transition effect reduced or even eliminated the head loss caused by the vortex, thereby reducing energy consumption.
Table 3 shows that under the same conditions, the static pressure difference between the inlet and outlet of the dovetail tee was significantly lower than that of the T-type tee. In condition 3, this difference was reduced by 52.52%. The velocity distribution of the fluid in the pipeline became more uniform. Simultaneously, the velocity of the fluid near local components decreased, reducing local frictional resistance.
2.5. Comparison of Coefficients of Local Resistance of Different Tees
According to the results for the inlet and outlet pressure difference and flow velocity obtained from the above CFD simulation process, the coefficients of local resistance of the T-type tee and dovetail tee with different flow directions under different flow rates could be calculated.
Equation (1) was appropriate due to the energy conservation of LNG during pipeline flow:
where
H1 and
H2 are the height differences between section 1-1 or 2-2 and the selected datum, m;
P1 and
P2 are the relative pressures of sections 1-1 and 2-2, Pa;
v1 and
v2 are the liquid surface descent velocities at sections 1-1 and 2-2, m/s;
∑hf is the sum of all the resistances in sections 1-1 and 2-2, m; and
g is the local acceleration of gravity.
As the tee in the LNG pipeline was located in the horizontal plane,
H1 =
H2 = 0. Therefore, Equation (2) could be derived to obtain the local resistance of LNG pipelines. Then, by applying its inverse corollary, Equation (3) could be obtained to calculate the local resistance coefficient:
where
λ is the along-track resistance coefficient;
l is the pipe length, m;
d is the pipe diameter, mm; and
ζ is the local resistance coefficient.
Now, the coefficients of local resistance of the T-type tee and dovetail tee under various conditions obtained by simulation calculation were compared, as shown in
Figure 9.
As is evident from the above quartet of comparative charts, the coefficient of local resistance of the dovetail tee exhibited a markedly superior performance compared to the T-type conduit across the four distinct operational scenarios characterizing the liquefied natural gas (LNG) pipeline. This discernible trend was accentuated at points of confluence. Specifically, the coefficient of local resistance of the T-type tee surpassed that of the dovetail tee by a factor of 2.79 ± 0.2 in condition 1, approximately 5.36 ± 0.51 in condition 2, around 10.22 ± 1.15 in condition 3, and about 5.72 ± 0.92 in condition 4. This phenomenon was most conspicuous in the T-type configuration, primarily attributed to the broader spectrum of coefficients of local resistance compared to its curved counterpart.
3. Hydraulic Calculation of Height Difference in Pipeline before and after Reconstruction
This section of the article concerns pipeline reconstruction, focusing on the pipeline configuration between the storage tank and the submersible pump at an LNG filling station situated in the city of Qingdao. We conducted a hydraulic calculation of the elevation disparity in the pipeline, subsequently scrutinizing the repercussions of altering local pipe fittings in the LNG pipeline on the said elevation difference. The findings of this analysis bear relevance and offer valuable insights for the prospective implementation of similar projects.
3.1. Theoretical Calculation of Height Difference for Liquid Outlet
Initially, for the sake of computational simplification, we set certain conditions based on the prevailing circumstances: Under idealized assumptions, we considered a scenario where the pipeline exhibited optimal cold insulation attributes, devoid of vapor generation within its confines. Moreover, we disregarded the impact of gas flow resistance relative to the liquid. Grounded in empirical data, we ascertained the presumed LNG flow within the pipeline at a liquid filling rate typical of the majority of industry gas stations, set at 45 kg/min. The analysis further overlooked alterations in physical parameters throughout the course of LNG flow in the pipeline. Subsequently, we streamlined and scrutinized the pipeline between the LNG storage tank and the submersible pump (e.g.,
Figure 10), delineating pertinent hydraulic equations in accordance with the principles of energy conservation.
We presumed the minimum liquid level requisite for the LNG storage tank to be in section 1-1, designating the midpoint of the liquid inlet conduit of the submersible pump as the liquid level within the pump, denoted as section 2-2. Under the assumption that the inflow into the submersible pump aligned with empirical specifications—specifically, L = 0.00171 m3/s, with the pipeline diameter set at DN50—the LNG flow rate in the pipeline could be determined using the relevant equation. The density of LNG was denoted as ρ = 439 kg/m3, the dynamic viscosity as μ = 9.36 × 10⁻⁵ Pa·s, and there was no fluid machinery in the pipeline between the storage tank and the submersible pump, so it had no input or output of mechanical energy.
In accordance with principles of fluid mechanics, the energy conservation law governing fluid flow in sections 1-1 and 2-2 of the storage tank and submersible pump could be succinctly expressed as Equation (4):
In this manuscript, the liquid level at the submersible pump (section 2-2) is designated as the reference level for hydraulic calculations. Upon careful analysis and simplification of the aforementioned parameters, it was established that H1 represented the elevation difference between sections 1-1 and 2-2. As section 2-2 served as the reference, H2 was accordingly set to 0 m. A return pipe connected the storage tank to the gas space above the liquid level of the submersible pump, ensuring equal pressures in the regions above the liquid level in both entities. Additionally, in relation to section 1-1, the LNG storage tank outlet exhibited a diminished size, signifying a comparatively restrained decrease in LNG speed within section 1-1, thereby warranting consideration. Analogously, the liquid level within the submersible pump significantly surpassed its liquid inlet.
Given these considerations, the aforementioned formula could be succinctly simplified as Equation (5):
The Darcy formula can be used to obtain the resistance along the pipeline, as in Equation (6):
The drag coefficient along the path could be calculated by using the Alitsuri formula, as in Equation (7):
where
K is the equivalent absolute roughness of the inner wall of the pipe, mm (for a stainless-steel pipe, it is 0.0457 mm); and Re is the Reynolds number.
The local resistance was calculated as in Equation (8), and the coefficient of local resistance of an LNG pipeline can generally be obtained from the literature [
15]:
Based on the aforementioned expression, the requisite elevation difference for the liquid level between the LNG storage tank and the submersible pump could be computed. Subsequently, the height disparity between the two pipelines could be derived by subtracting the lowest liquid level height within the storage tank.
3.2. Comparative Analysis with LNG Filling Station Pipeline Renovation
This section of the article undertakes a comprehensive examination of the pipeline system within an LNG filling station situated in the city of Qingdao, utilizing it as an illustrative case. Early interactions with station personnel unveiled challenges impeding refueling continuity, notably including an abundance of elbows in the submersible pump pipeline, resulting in considerable local resistance. The storage tank’s location lacks hydraulic calculation documentation, relying solely on experiential placement, and fails to adequately provide the required liquid outlet elevation difference. Furthermore, the absence of slope control in the pipeline direction impedes the optimal progression of the two-phase flow process. Adding to the predicament, the pipeline’s cold insulation measures are protracted, with certain sections left uninsulated. In summary, this station typifies an LNG filling station grappling with substantial refueling issues due to suboptimal pipeline configuration. Against that backdrop, this paper endeavors to address the challenges faced, aiming to alleviate local resistance, minimize the necessary liquid outlet height difference, and enhance the overall liquid outlet capacity of the LNG filling station.
3.2.1. Hydraulic Calculation of the Original Pipeline
The Qingdao LNG filling station comprises one LNG storage tank and one submersible pump each in the north and south directions, totaling two tanks and two pumps. During actual operations, the north and south directions of the tank or submersible pump may not be concurrently active. Consequently, hydraulic calculations for the pipeline between the storage tank and submersible pump must be conducted under diverse operating scenarios.
Figure 11 shows a simplified diagram of the original pipeline route for the Qingdao LNG filling station. The reference liquid outlet height difference was selected based on the most unfavorable condition. The operational conditions of the filling station’s storage tank and submersible pump were categorized into six distinct types, as delineated in
Table 4.
The schematic representation of the pipeline is segmented based on various operational conditions. The parameters for each section of the pipeline in the diagram are enumerated in
Table 5.
Calculation of the total pipeline resistance was conducted under the assumption that the storage tank was at its minimum liquid level for each of the six specified operational conditions.
As is evident from
Table 6, subsequent to determining the pipeline resistance between the LNG storage tank and the submersible pump under diverse operational conditions, the liquid level difference between them could be ascertained using the provided formula. Furthermore, specifications indicated that the volume corresponding to the lowest liquid level of the storage tank typically constituted about 15% to 20% of its total volume, with the pump automatically halting downstream operation if this threshold was breached. During such instances, the minimum liquid level in the LNG filling station tank was estimated to be approximately 1.0 m. It was surmised that, to ensure adequate liquid filling and prevent pump cavitation damage, the pipeline height difference between the storage tank and the submersible pump needed to be at least 1.58 m. However, the design height difference between the storage tank and the submersible pump in the station, according to data from the LNG filling station, is 1.25 m. This falls short of meeting the requirements under the most unfavorable conditions (specifically, single-tank and double-pump), thus deviating from the intended design expectations. Consequently, judicious and necessary optimization and transformation of the inlet pipeline between the storage tank and submersible pump at the LNG filling station are imperative.
3.2.2. Hydraulic Calculation of Pipeline after Modification
From the analysis, it was evident that the elevation difference between the LNG tank and the submersible pump was intricately linked to the magnitude of resistance within the conduit. Therefore, without altering the positions of the LNG tank and submersible pump, the following transformation program was proposed: a judicious reduction in the number of elbows to mitigate local resistance, an L-shaped arrangement of the LNG tank discharge pipeline section to further reduce resistance, and the substitution of T-type tees with dovetail tees to diminish local resistance. Consequently, post-transformation, the pipeline arrangement between the LNG tank and the submersible pump is configured as in
Figure 12.
As is evident from
Figure 12, in the modified pipeline arrangement, there is a reduction of two elbows, resulting in a decreased local resistance coefficient at two locations in the pipeline. Additionally, it is noteworthy that the post-modification condition for division of the pipeline between the storage tank and the submersible pump, as well as the calculation parameters of relevant pipe sections under each condition, remain consistent with those predating the renovation (and are hence omitted from further reportage). The ensuing hydraulic calculation of the modified storage tank and submersible pump pipeline under various conditions is presented below, along with the results.
As is evident from
Table 7, the requisite height difference for the pipeline between the LNG storage tank and the submersible pump after modification is 1.18 m, marking a 25.32% reduction compared to the height difference required before the alteration. Notably, the alteration of the tee configuration contributes to a 17.58% decrease in the necessary height difference. As a result, the pipeline height difference between the storage tank and the submersible pump at the station is calculated to be 1.25 m, meeting the specified requirements.


