
Health Monitoring Analysis of an Urban Rail Transit Switch Machine
1
College of Urban Rail Transit and Logistics, Beijing Union University, Beijing 100101, China
2
College of Arts & Science, New York University, New York, NY 10012, USA
*
Authors to whom correspondence should be addressed.
Sustainability 2024, 16(9), 3527; https://doi.org/10.3390/su16093527
Submission received: 2 March 2024
/
Revised: 11 April 2024
/
Accepted: 11 April 2024
/
Published: 23 April 2024
(This article belongs to the Special Issue Innovative and Sustainable Planning, Control and Optimization Methods for Urban Transportation System)
Abstract
:This paper discusses the health evaluation of an urban rail transit switch machine. In this paper, the working current data of the S700K switch machine are processed, and four common abnormal operating current curves are obtained through the existing data. Then, the MLP is used as the feature extractor of the action current curve to analyze the input action current data, learn and capture deep features from raw current data as Q-networks, and build MLP-DQN models. The monitoring of the abnormal state operation current of the switch machine is optimized by learning and optimizing the model weight through repeated experience. The experimental results show that the training accuracy of this model is stable at about 96.67%. Finally, the Fréchet distance was used to analyze the abnormal motion current curve, combined with the occurrence frequency and repair complexity of the abnormal type curve, the calculated results were analyzed, and the health of the switch machine was evaluated, which proved the high efficiency and superiority of the MLP-DQN method in the fault diagnosis of the switch machine equipment. The good health evaluation function of the switch machine can effectively support the maintenance of the equipment, and it has an important reference value for the intelligent operation and maintenance of subway signal equipment. The research results mark the maintenance of key equipment of urban rail transit systems, represent a solid step towards intelligent and automated transformation, and provide strong technical support for the safe operation and intelligent management of future rail transit systems.
1. Introduction
With the rapid expansion of subway systems in our country, the maintenance of subway equipment is facing unprecedented challenges. Among these devices, the turnout device plays a crucial role in ensuring safe track conversion for trains, and its safety and stability directly impact the normal operation of urban rail transit systems as a whole. However, due to their underground location and exposure to external factors such as climate and temperature variations, coupled with the impact of train operations on turnout equipment, there is a high probability of failure. In order to ensure the safe and stable operation of urban rail transit networks, continuous research into new methods for monitoring and managing turnouts is essential while utilizing advanced technologies to achieve scientific, intelligent, and efficient equipment management.
With the rapid development of artificial intelligence technology, neural network and deep-learning technologies have been widely used in various fields. The application of these intelligent technologies to the monitoring of subway switch equipment has become a future development trend. Although in some cases there may be significant visual differences between normal and abnormal current curves, due to the high complexity and constant changes in the urban rail transit environment (such as climate effects, equipment aging, and frequency changes), the variability of the current curve often makes it impossible for simple numerical criteria to accurately identify all possible abnormal patterns. Neural networks, especially in combination with deep reinforcement learning models, are capable of learning these complexities from data with their superior pattern recognition capabilities and show strong adaptability to new or previously unseen anomalies. This is essential to ensure the long-term stability and reliability of the system. By introducing advanced AI technology, we can significantly reduce the workload of maintenance personnel, improve maintenance efficiency, and drive the transformation of switch equipment to intelligent maintenance. At present, we mainly rely on the microcomputer monitoring system to capture and analyze the key data of the switch equipment during operation in real time, so as to carry out timely maintenance in the event of failure, or carry out regular planned maintenance.
However, the current maintenance methods of turnout equipment fail to achieve intelligent equipment status judgment and potential failure monitoring, which poses challenges in adapting to the rapid development of national railways and urban rail transit, as well as meeting the requirements for state repair and intelligent analysis of signal equipment. Therefore, this paper focuses on subway switching motor current monitoring and analysis. The contributions of this paper are outlined below:
- (1)
- This paper takes the metro switch machine as the research object, collects the current data of the switch machine in normal and abnormal conditions, and summarizes four common abnormal operation current conditions based on the data of the rail transit industry;
- (2)
- This paper first analyzes the current data monitored by the microcomputer of switch machine equipment in Hangzhou Metro Line 10, and extracts the characteristics of abnormal current data. The current data of the switch machine of Metro Line 10 are input into the MLP model for pre-training, which acts as the Q-network of the DQN algorithm. It is responsible for estimating the expected reward of each state–action pair, guiding the strategy selection, and continuously learning and optimizing the weight of the MLP model through experience replay. By comparing this method with the MLP model method, it proves that the MLP-DQN method is efficient and superior in the fault diagnosis of switch machine equipment.
This paper is organized as follows: Section 2 is a literature review, Section 3 is the action current data processing, Section 4 is the algorithm model training, Section 5 is the algorithm model training, and finally Section 6 is the summary and conclusion, which expounds on the main conclusions of this research.
2. Literature Review
Through the continuous efforts of domestic and foreign scholars, the research on the fault monitoring of turnout equipment has been developed to a certain extent. The health monitoring technology of switch machines has become a part of the intelligent operation and maintenance of rail transit. Through the application of advanced technology in the monitoring of turnout failure, the maintenance efficiency is improved, and the transformation of turnout equipment to intelligent maintenance is promoted. This paper focuses on the health monitoring of point machine equipment, combs and summarizes the current research technology status, and provides support for the subsequent health prediction of the point machine.
Reference [1] proposed a CDET/MPSO-SVM model, which used compensation distance evaluation technology to reduce the dimension of current feature set to select sensitive features. The particle swarm optimization (PSO) algorithm was improved, and the disturbance term and momentum term were added to optimize the parameters of a support vector machine (SVM). The comparison is made based on the ordinary SVM classification method, which can effectively distinguish different turnout fault types. Reference [2] selected the fault time point in the action current curve of S700K switch machine and established the a fault characteristic matrix based on it. This feature matrix is used as the input of a BP neural network for fault diagnosis. Reference [3] mainly puts forward the concept based on a baseline for switch equipment and uses a BP neural network method to identify the state in the process of switch operation. Simulation experiments show that this method has a certain feasibility and effectiveness, provides a reliable guarantee for the safe operation of switch equipment, and makes certain contributions to the state repair evolution of the switch equipment maintenance mode offer. In reference [4], orthogonal wavelet decomposition is carried out on the power signal under a specific fault mode, and the obtained results are used as input features of the neural network. The improved genetic algorithm is used to optimize the parameters of the BP neural network, and the trained BP neural network is used for fault diagnosis. The research shows that this method can be effectively applied to the fault detection of the S700K switch machine. Reference [5] combined CNN and LSTM and created a fault diagnosis model based on CNN-LSTM by using the ability of CNN in fault feature extraction and the advantage of LSTM in processing time-series data. Experimental results show that this model can effectively distinguish different types of turnout faults. Reference [6] proposed an improved density peak clustering algorithm to identify abnormal data. The algorithm is applied to the current data of the ZDJ9 switch machine, and the abnormal data are successfully identified, which verifies the effectiveness of the algorithm. According to the literature [7], the stuck problem caused by foreign matter occurred in sliding bed board of W0108# reentry turnout of Hangzhou Metro Line 1. The research team conducted a deep discussion on the problem of foreign matter stuck on the sliding bed board of a subway turnout in order to identify, analyze, and deal with the main research direction of the cause of the problem, and significantly reduce the incidence of failure. Reference [8] converts the one-dimensional current curve data of turnout operation into two-dimensional gray-scale pictures and inputs them into the CNN model for fault diagnosis. This approach has been shown to be effective. Reference [9] proposed a method for the fault diagnosis of a turnout based on a hidden Markov model. Through multi-state subdivision and feature extraction, it successfully realized the fault diagnosis of turnout equipment and could be used for the health state monitoring of turnout equipment. Reference [10] proposed an improved deep reinforcement learning method for fault diagnosis of a gas turbine rotor system. The deep Q-network and temporal differential error priority experience replay based on one-dimensional wide convolutional neural network fitting can be used for fast and effective fault diagnosis. Reference [11] proposed a fault diagnosis method of rolling bearing based on multi-layer perceptron and proximal policy optimization (MLP-PPO). A reinforcement learning agent based on a multi-layer perceptron (MLP) network was constructed. The policy gradient optimization method is used to fit the fault diagnosis objective function. It provides a new research idea for the fault diagnosis method of rolling bearing. Reference [12] proposed a bearing fault diagnosis method based on the whale optimization algorithm (WOA) to optimize a multi-layer perceptron (MLP), which effectively overcame the problem of MLP falling into a local optimum, and the performance of this method was significantly better than the traditional MLP method in bearing fault diagnosis. Reference [13] proposed an innovative rotating machinery fault diagnosis method combining a stacked autoencoder and a deep Q-network. By establishing an interactive fault diagnosis “game” model, the deep Q-network realizes the nonlinear mapping relationship between vibration data and fault state. Experimental results show that the method is effective and feasible. Reference [14] proposed that the anti-interference system model and Markov decision process of multi-user wireless communication are established, and the value function and dynamic ε-greedy strategy are fitted by neural network to solve the high-dimensional state space problem, and the anti-interference effect is improved. Reference [15] proposed a human-assisted deep reinforcement learning algorithm. The algorithm improves the learning efficiency of the agent through artificial strategy guidance. Firstly, an optimal scheduling model with minimal cost is constructed, and the scheduling process is modeled by a Markov decision process, and the reward function is designed. Then, the human-assisted depth deterministic strategy gradient algorithm is used to solve the model, and the optimal decision is realized by updating the parameters of the neural network.
To sum up, at present, scholars mainly focus on the classification of health data of turnout equipment, and there is a lack of health monitoring research and analysis of switch machine equipment. Therefore, in order to improve the research in this area, this paper analyzes and studies the current curve of the switch machine by combining the deep reinforcement learning algorithm, which is used to guide the subsequent health monitoring of the switch machine.
3. Data Processing
The data source of this paper is the three-phase current data of the switch machine in Hangzhou Metro Line 10 for 8 months, and 46,113 pieces of action current data information are obtained after screening and processing. After unified processing, each action current curve consists of 169 current data information.
3.1. Action Current Curve
Normal Operation Current Curve
At present, the speed increase switch equipment widely used in the railway field mainly includes the S700K and ZYJ7: two specifications. In this study, the S700K electro-hydraulic switch machine is used as the research object. S700K switch machine is mainly composed of a three-phase AC motor, gear set, holding connector and action rod, and other core components [16]. It not only acts as a switch and lock device, but also acts as a monitoring device for the position of the switch, which can accurately reflect the real-time state of the switch.
The signal microcomputer monitoring system, as a kind of technical preventive means with significant benefits, monitors the working current of the switch machine in the process of switch operation with a collection period of 40 milliseconds, and displays its current and power curve in the system software interface [17,18]. Based on this, the electrical professionals judge the operation state of the switch and switch machine.
This paper chooses to analyze the current curve of the switch mechanism. The data are read through Pandas, and the current data are parsed into a two-dimensional list (current data), where each row represents a time series. Using the predefined four kinds of abnormal threshold conditions, the action current data meeting the constraints are randomly selected and its curve is generated.
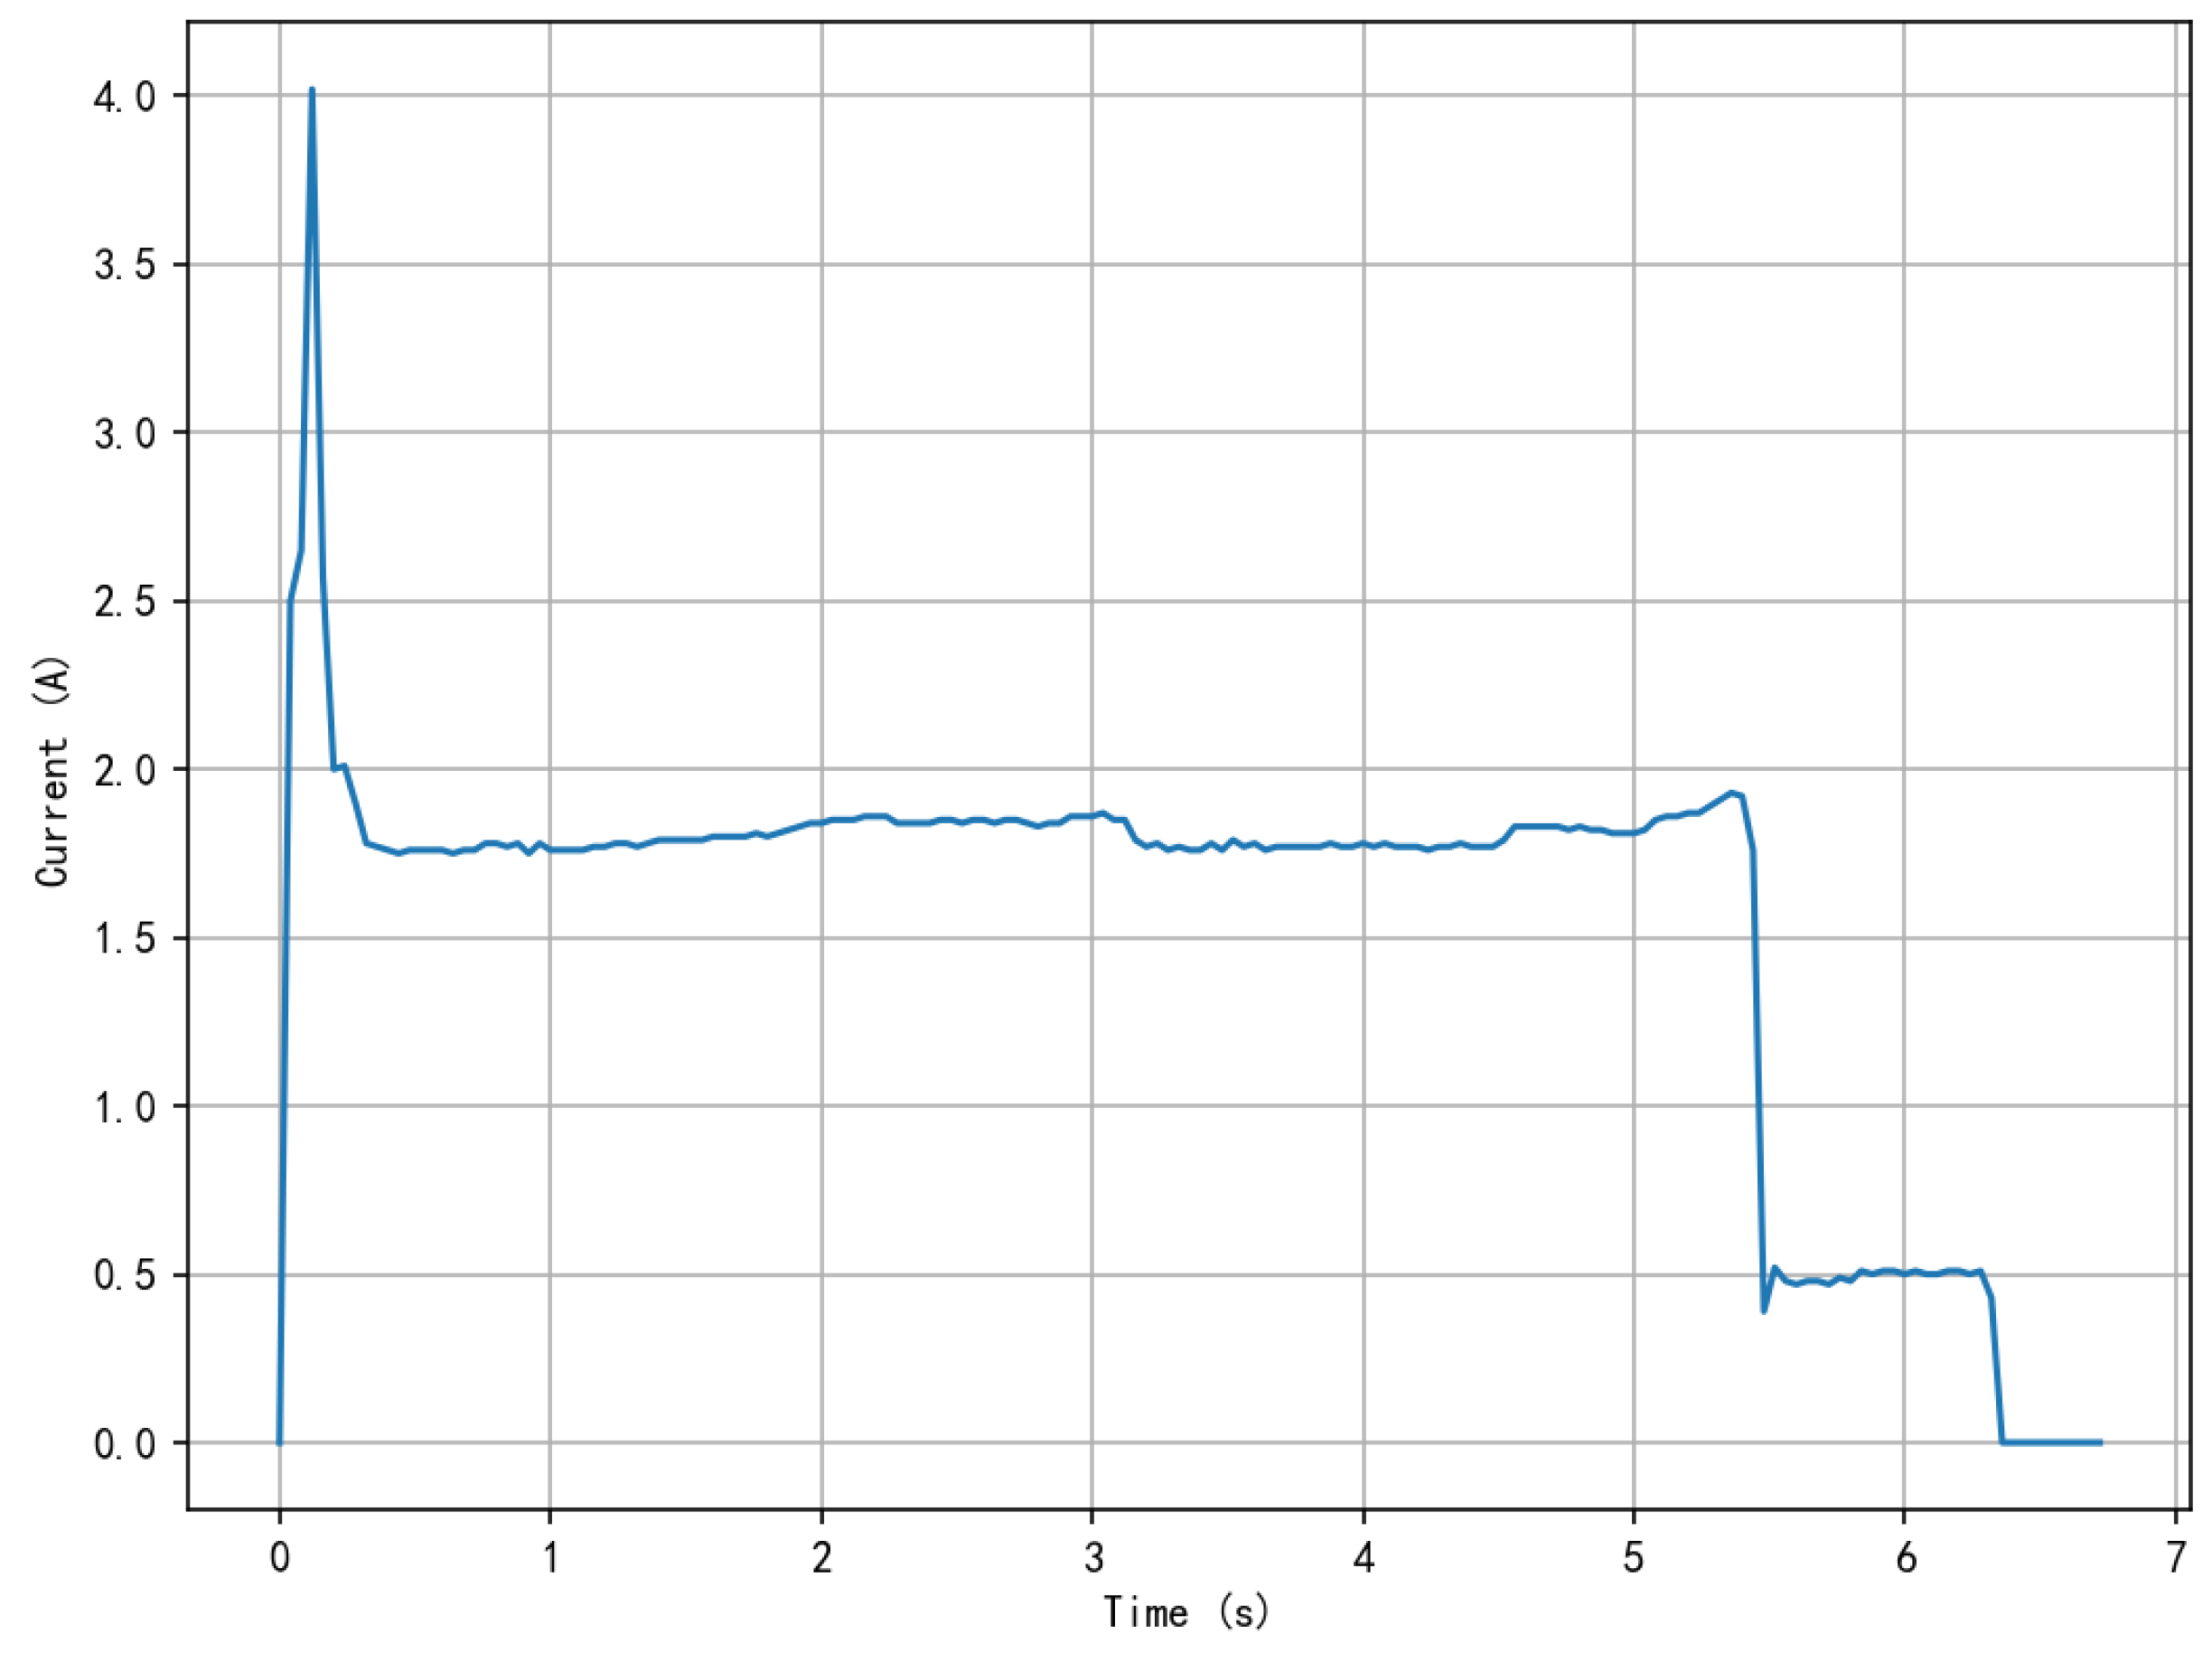
As shown in Figure 1, in standard operation, the current curve of the whole action flow of the S700K switch machine can be divided into five stages, where the horizontal coordinate represents the sampling time of the switch machine current, and the vertical coordinate represents the corresponding current value. The conversion time of the S700K switch machine is usually about 6.8 s, and its signal acquisition frequency is 25 Hz; that is, 25 sampling points are sampled per second [19]. As the initial stage of the whole action process, the start-up phase needs to generate an instantaneous large current to start the motor, which is shown as a peak in the current curve. This phase lasts about 1 s. In the unlocking and conversion phase, the resistance is small, and the switch machine can drive the sharp rail with a uniform and gentle speed, which is reflected in the current curve as a rapid decline from the peak value in the start-up phase and gradually become stable. The unlocking process takes about 1 s, and the conversion process takes about 2 s to operate. The duration of the locking phase is about 1 s, after the transfer of the heart rail to the specified position, the control circuit of the motor is disconnected, and the current curve amplitude shows a certain decrease, and then enters the easing phase [20]. Since there are still two-phase small currents flowing through the starting circuit, the current curve will show a “step” shape, and its current value will eventually drop to zero after 1DQJ is completely eased.
The action current of the turnout reveals the characteristics of the current change when describing the conversion action process of the turnout. It can directly or indirectly map the state of each component of the turnout, as well as the overall operation of the turnout [21]. The process can be divided into five main stages.
Phase T0–T1: The start-up phase. The system starts recording the action current of the turnout, and at the beginning of the phase, the first one triggered is 1DQJ.
Upon excitation of and polarity conversion of 2DQJ, the current is approximately zero at this time. Subsequently, the polarity of the 2DQJ relay switches, the switch starts the action, and the current value quickly rises to its peak value.
Phase T1–T2: The unlocking phase. In this phase, the turnout initiates the unlocking process. After unlocking, the action rod has a distance of several millimeters. At this time, the load torque of the motor is relatively low, and the speed of the switch machine rises, which causes the current to fall back quickly.
Phase T2–T3: The transition phase. The traction of the switch machine on the sharp rail is achieved at this stage. In the normal operation of the turnout equipment, the load torque of the motor at this stage is relatively stable, and the current is relatively stable.
Phase T3–T4: Release phase. The switch is completed, the contact point of the automatic opening and closing device is converted, the starting circuit is disconnected, the broken phase protection relay is unlocked, and the 1DQJ self-closing circuit is disconnected and enters the slow time to form the “step current”. The reason for the formation of the “step current” at this stage is caused by the outdoor circuit connected to the switch after it is locked.
Stages T4–T5: The easing phase. The 1DQJ relay gradually falls down, and the system completes the recording of the turnout action current.
In this process, each stage reflects the state and action of the turnout and the associated electrical components in different working links, and each step critically affects the integrity and accuracy of the turnout action.
In the unlocking phase of the switch, the internal motor of the S700K switch machine needs to overcome the resistance, and the external locking device performs the action through the gear set and other transmission mechanisms to realize the unlocking of the switch, so a relatively large starting current is generated [22]. In the switch stage, the switch machine through the external locking device to drive the sharp rail to move, after conversion to the specified position, the implementation of the switch lock, at this time the position of the switch is fixed; with the locking of the turnout, the power supply to the control circuit can be cut off, and the current value decreases rapidly.
3.2. Abnormal Action Current Curve
For the standard evaluation of the abnormal action current curve, the curve with a large difference from the standard normal action current curve can be preliminarily diagnosed as an abnormal curve [23]. The standard normal operation current curve selects the recent 1000 times of normal operation current curve of a certain turnout, calculates the average length and variance of each stage respectively, and forms the upper and lower boundaries of the normal fluctuation range of the operation curve. Finally, by calculating the average, median, and variance of the curve values at each time point within the fluctuation range, they were combined into a curve to form a standard normal action current curve [24]. And the abnormal threshold range is determined according to the similarity between the action current curve and the standard normal action current curve. The similarity r is calculated as follows.
where is the average value of variable X; is the mean value of the variable Y. X is reflected in the data as the time where the current data is located, and Y is reflected in the data as the numerical value of the current data. Standard normal action current curves are shown in Figure 2.
The similarity analysis between the action current curve and the standard normal action current curve is shown in Figure 3. Some action current curves are quite different from the standard normal action current curves [25]. Combined with the actual operation status and occurrence frequency, four common types of anomalies are obtained.
Abnormal Type 1: Delay in the start of the turnout.
As shown in Figure 4, before the start of the turnout, the value of the current curve continued to be zero for about 1.2 s, and then entered all stages of the current curve of the operation of the turnout, and everything showed a normal situation. This phenomenon was classified as the delay phenomenon of the start of the turnout. The causes of such phenomena can be mainly summarized into two categories: First, it may be a problem of poor contact of a relay contact in the switch starting circuit. Second, it may also come from the use of the relay over the years and its own characteristics gradually showing a bad state. Faced with this situation, the technical staff need to carry out a precise inspection and analysis of the relevant relays involved.
Abnormal Type 2: Delay in entering the coasting phase.
As shown in Figure 5, the delay in entering the buffer phase after the switch is completed can be attributed to the failure or wear of the switch mechanism of the switch.
Abnormal Type 3: No coasting phase action current.
As shown in Figure 6, the current data directly drop to 0 in the easing area, and there is no “step” phenomenon under normal conditions, indicating that a stable easing loop has not been formed at this moment. In general, the causes of such failures may include the open circuit phenomenon of the outdoor rectifier stack or a blockage of the junction of the switch close inspection device.
Abnormal Type 4: Coasting phase action current surge.
As shown in Figure 7, in the easing area, the current data suddenly increased in the later period and did not show the phenomenon of “step” decreasing smoothly under normal conditions. The causes of such faults may include a diode breakdown short circuit in the outdoor rectifier stack or the entry of a foreign object between the switches.
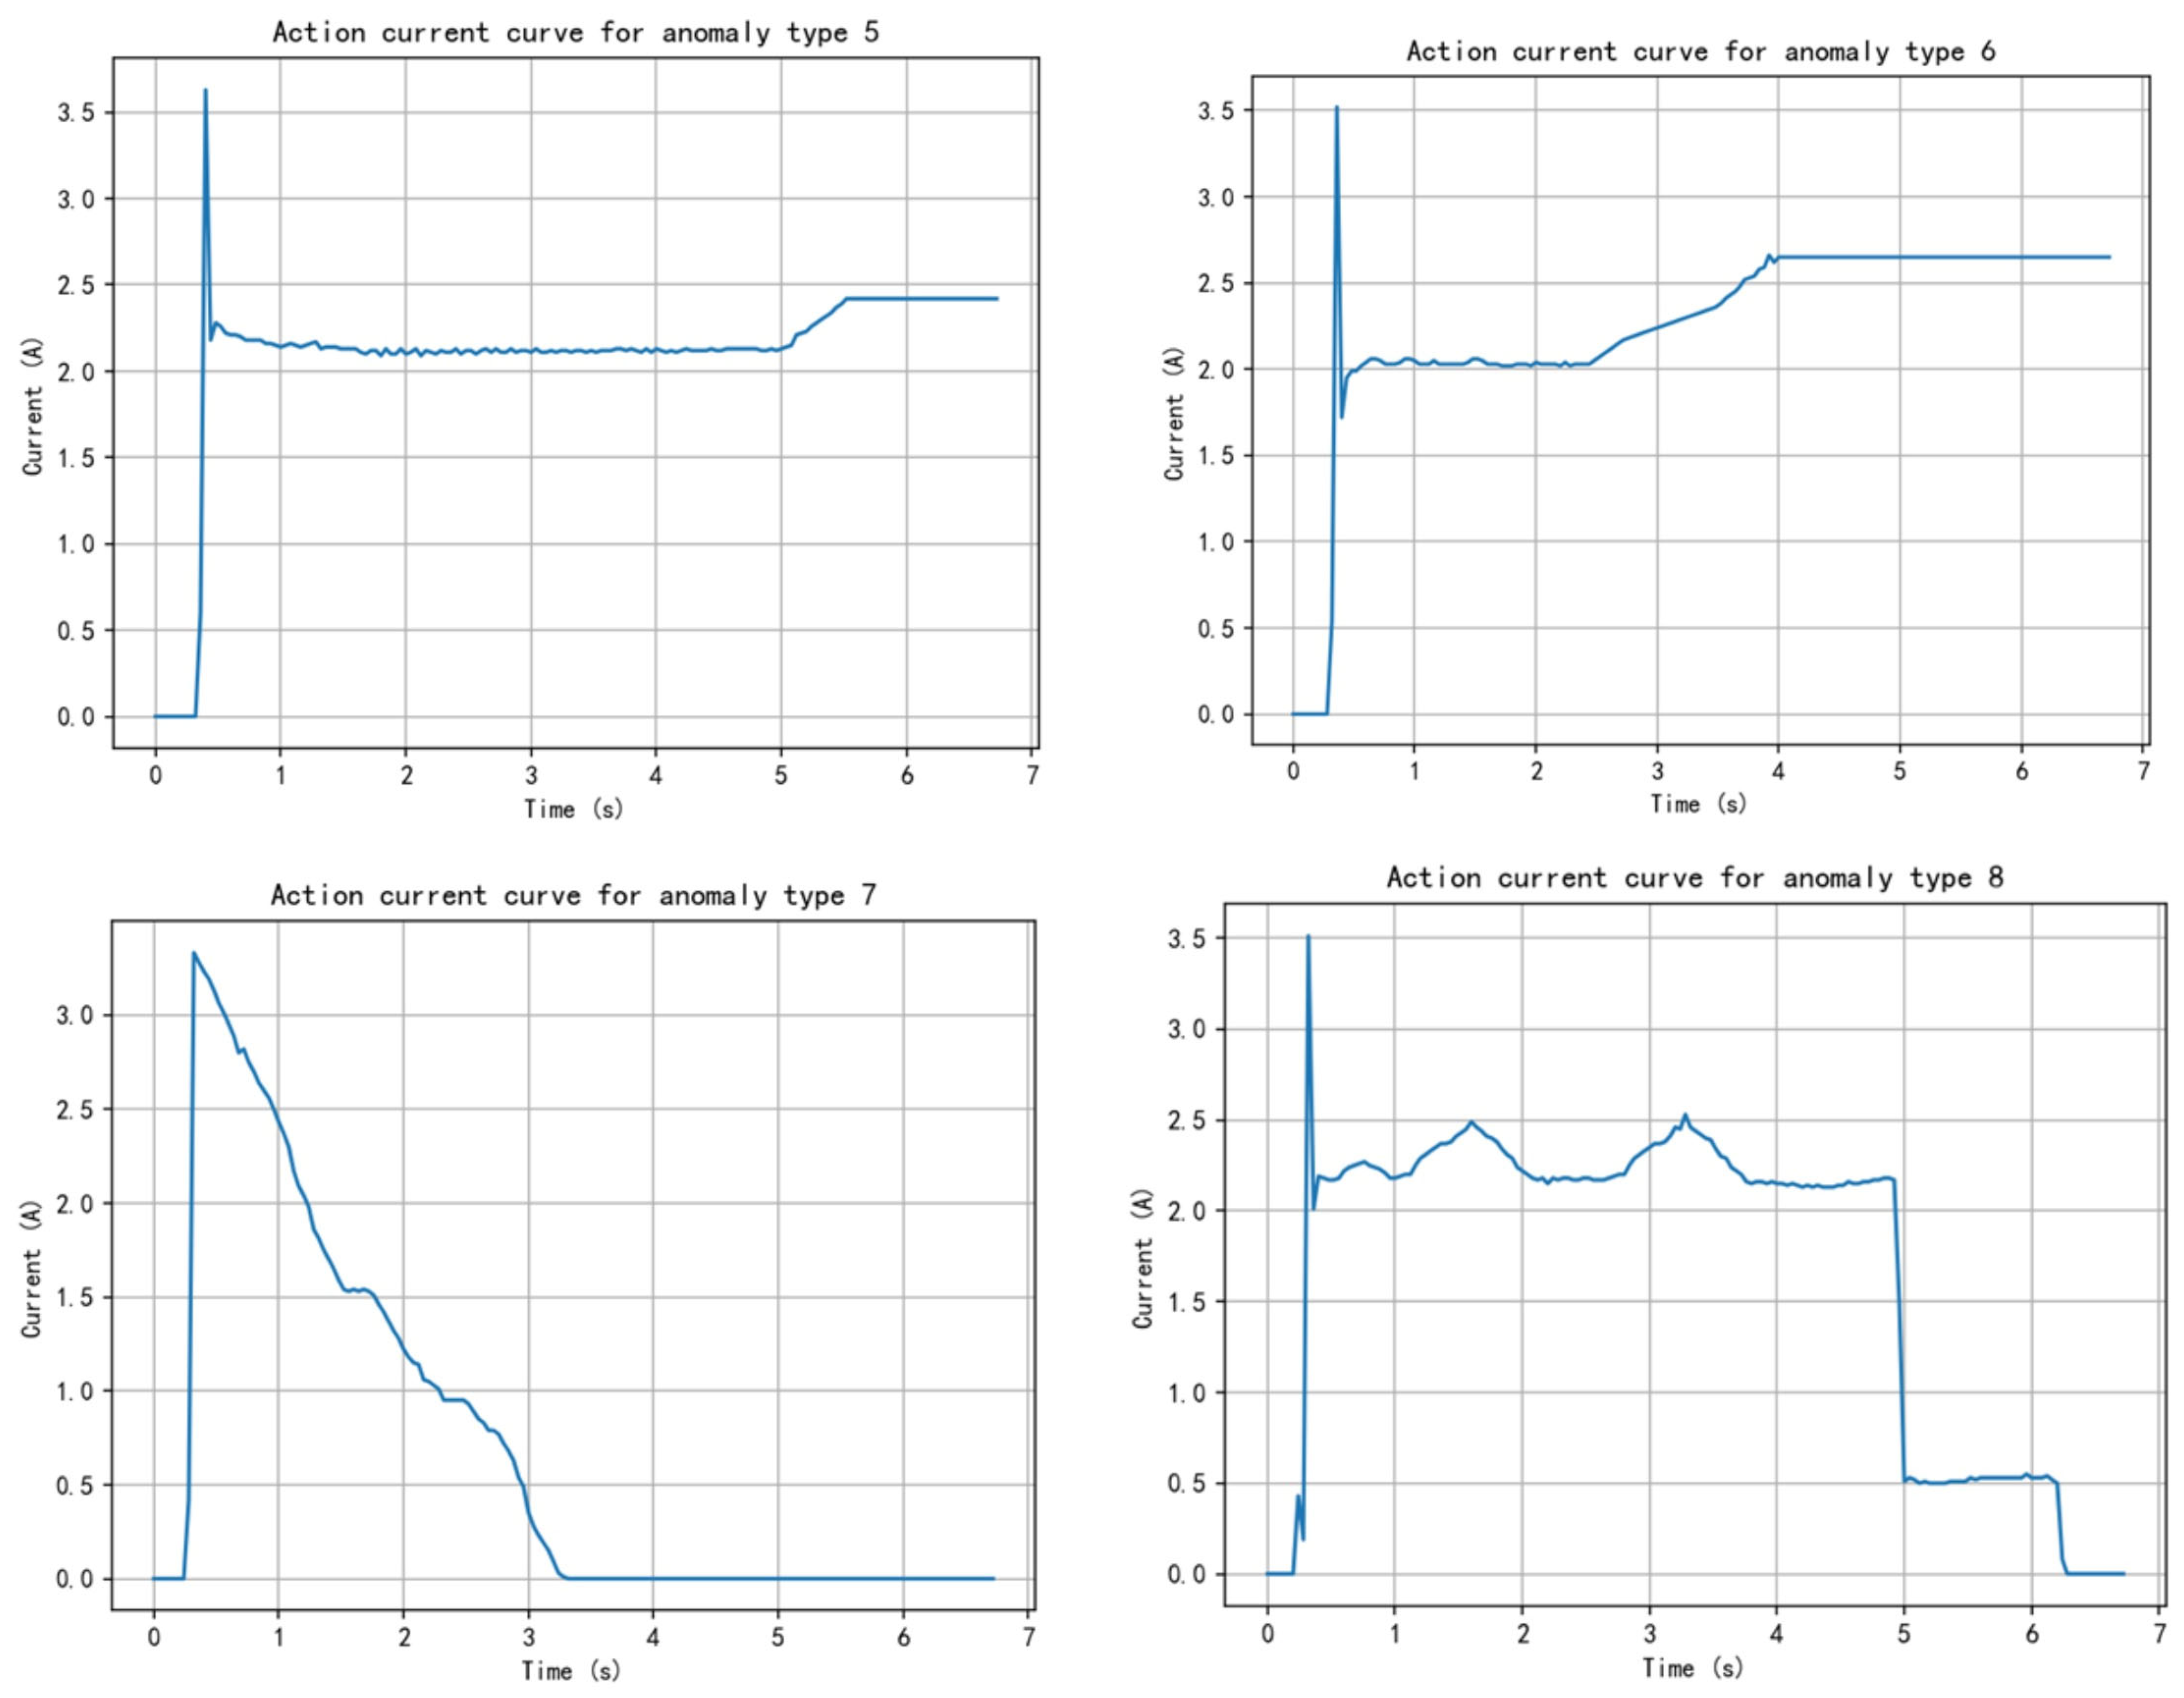
Abnormal Type 5: Switch not interlocked.
Figure 8 shows a situation in which the actuation current rises to the friction current level after the switch is completed. The cause of this phenomenon can be attributed to the inappropriate adjustment of the turnout gap.
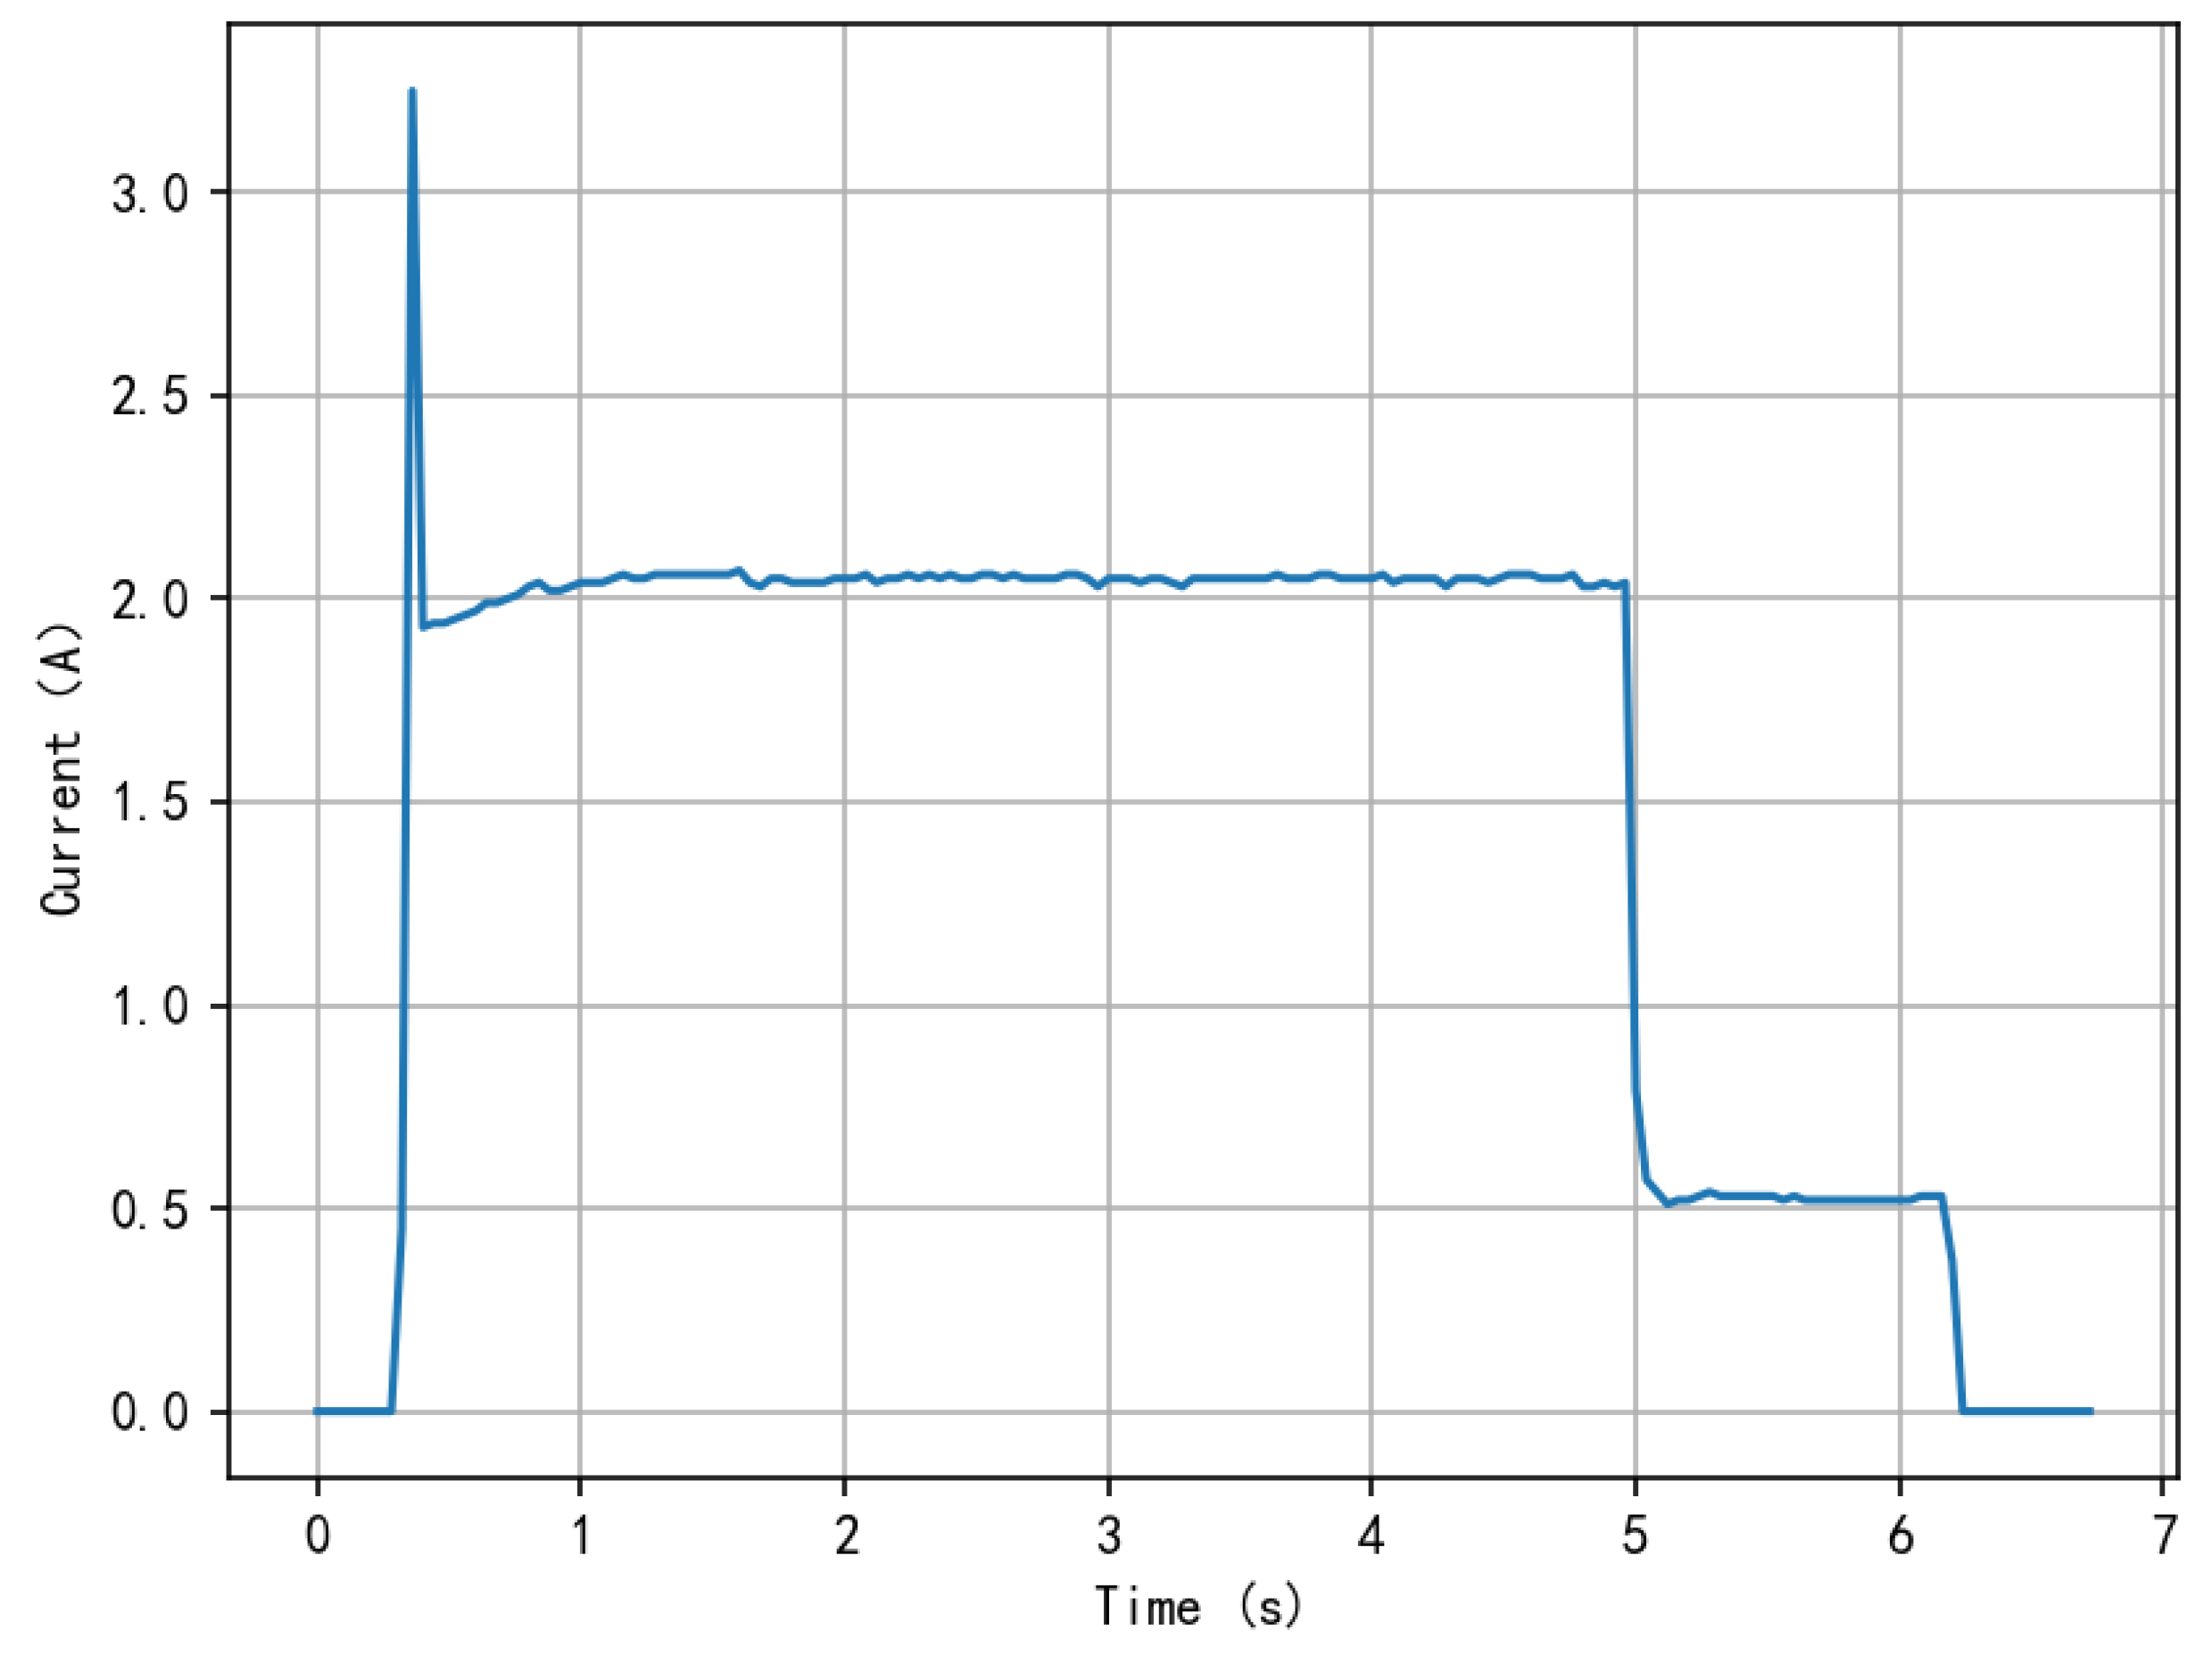
Abnormal Type 6: Switch obstruction.
At the switch stage, the operating current suddenly rises to the level of friction current, as shown in Figure 9. There are many factors that induce such faults, including but not limited to the blockage of the planetary gear inside the reducer, the blockage of the rack block, and a foreign body included in the sharp rail of the turnout.
Abnormal Type 7: Sudden stop after turnout activation.
As shown in Figure 10, after the switch is started and the switch is unlocked, the current curve drops to zero rapidly. At this point, the motor stops operation, and the switch fails to properly convert to the intended position, showing a “four-open” state, and there is no indication from the console. This situation usually comes from two possible factors. One is that the 1–2 coils of 1DQJ are not functioning well, so that the self-protection circuit of 1DQJ cannot be maintained stably. Second, there is a phenomenon of virtual connection in the starting circuit of the turnout, which leads to the motor stopping rotation during the conversion process of the turnout. Engineers and technicians need to conduct a detailed circuit inspection in order to accurately identify the root cause of the problem and implement the corresponding solution.
Abnormal Type 8: Unstable action current.
The current curve of the turnout action shown in Figure 11 shows unstable characteristics during the sharp rail transition stage, which manifests as a zigzag current waveform. The reason for this instability may be related to the factors such as inadequate cleaning of the slide bed plate of the pointed rail of the switch, or incomplete contact of the motor carbon brush or the commutator.
Based on the above analysis, the summary of abnormal types, abnormal phenomena, and abnormal causes of the turnout equipment studied in this paper is shown in Table 1, which includes one normal mode and eight abnormal modes.
Based on the overall processing of data, for all action current curves, the frequency of Abnormal Type 8 is much lower than other types, and the label of the abnormal type is ignored.
4. Algorithmic Model
4.1. Building the MLP Model
The MLP-DQN model was built using the Python3.8 development platform and the TensorFlow deep-learning framework [26]. The multi-layer perceptron (MLP) is widely recognized as a structured neural network, which includes an input layer, two hidden layers (Hidden1, Hidden2), dropout layer, and output layer. The size of the input matrix of the model is None× 169, 169 is the length of the sampling point of the action current and power curve data during the conversion of the switch machine, the acquisition cycle is 40 ms, and the curve of the interception time is 7 s. The normal operation time of the turnout is about 6.5 s. In total, 80% of the dataset is used as the training set and the remaining 20% of the dataset is used as the test set. The MLP model parameter settings are shown in Table 2.
Where the number of parameters in the dense layer depends on the number of neurons in the previous layer and the number of neurons in the current layer [27]. The architecture allows the model to reduce the risk of overfitting with dropout layers during training.
The MLP forward propagation formula is shown in Formulas (2)–(4).
In the multi-layer perceptron model, let d represent the parameter variables of the input layer, s represent the parameter variables of the hidden layer, and y denote the parameter variables of the output layer. The symbol sl represents the hidden layer parameters of Layer 1, ωki is the connection weight from the input layer to the hidden layer, vki is the connection weight between the hidden layers, and uij is the connection weight from the hidden layer to the output layer. In addition, θ, λ, γ are the bias values of the corresponding layer, respectively. The functions , , and each represent the activation functions of different layers. To ensure that the gradient does not disappear during backpropagation training, the activation function is usually chosen as the ReLU function, as shown in (5).
In the MLP model, the number of nodes in the hidden layer is often selected based on the comprehensive consideration of empirical formulas and experimental methods. This choice is often related to the number of nodes in the input and output, and usually lies in the same order of magnitude. The empirical formulas are given in (6) and (7).
where K is the number of nodes in the hidden layer, M is the number of nodes in the input layer, N is the number of nodes in the output layer, and A is a constant between 1 and 10.
4.2. Model Optimization
MLP is a feedforward neural network capable of learning nonlinear features of input data. In this method, MLP is used to extract key features from the action current signal data. By training the MLP model, we can obtain a set of highly abstract feature representations, which provide a solid basis for the subsequent abnormal state judgment. DQN combines the advantages of deep learning and reinforcement learning to learn optimal strategies through interaction with the environment [28]. Using the MLP as part of the DQN model allows the system to use the features extracted by the MLP to evaluate the potential value of taking different actions in the current state. By learning and utilizing the information contained in the current signal, the agent can continuously optimize its action strategy to deal with various abnormal situations [29]. In addition, the continuous learning and adaptation process enables the system to cope with new or unforeseen abnormal patterns, improving the generalization ability and practical value of the method.
MLP-DQN Model
From a structural perspective, deep reinforcement learning can be divided into feedforward neural networks, symmetrically connected networks, and recurrent neural networks. When considering from the dimension of learning strategies, it is primarily differentiated into methods based on value iteration and methods based on policy iteration. In deep reinforcement learning algorithms that are based on value iteration, deep neural networks are utilized to approximate the value function, thereby guiding the decision-making process of the agent. Within this category, the DQN (deep Q-network) algorithm is a quintessential example [30].
The DQN algorithm can map the state–action pair into a value function and input it into the deep neural network [31]. After the training and learning of the deep neural network, the network can nonlinearly approximate the corresponding Q value, as described in Formula (8). Based on the obtained q-value, the action with the largest expected reward can be selected and transferred to the corresponding state. Another approach is to directly determine the action with the maximum reward by considering only the state value as the input to the neural network and the action value as the output of the network [32].
where represents the training results of the deep neural network, represents the parameters of the deep neural network, and the fitting Q-value output of the neural network approximately expresses the Q-value.
The basic reward formula of the DQN algorithm is shown in Formula (9):
where is the reward at time step t, is the immediate reward at time step i, is the discount factor, which indicates how much the future reward will decay, and T is the time step at which the episode will end.
The loss function formula for the DQN algorithm is as shown in Formula (10).
where is the Q-value prediction of the current network, which represents the Q-value of selecting action a at state S, r is the immediate reward, is the discount factor, is the parameter of the current network, is the parameter of the target network, which is used to calculate the target Q-value, is the next state, is the action selected at the next state .
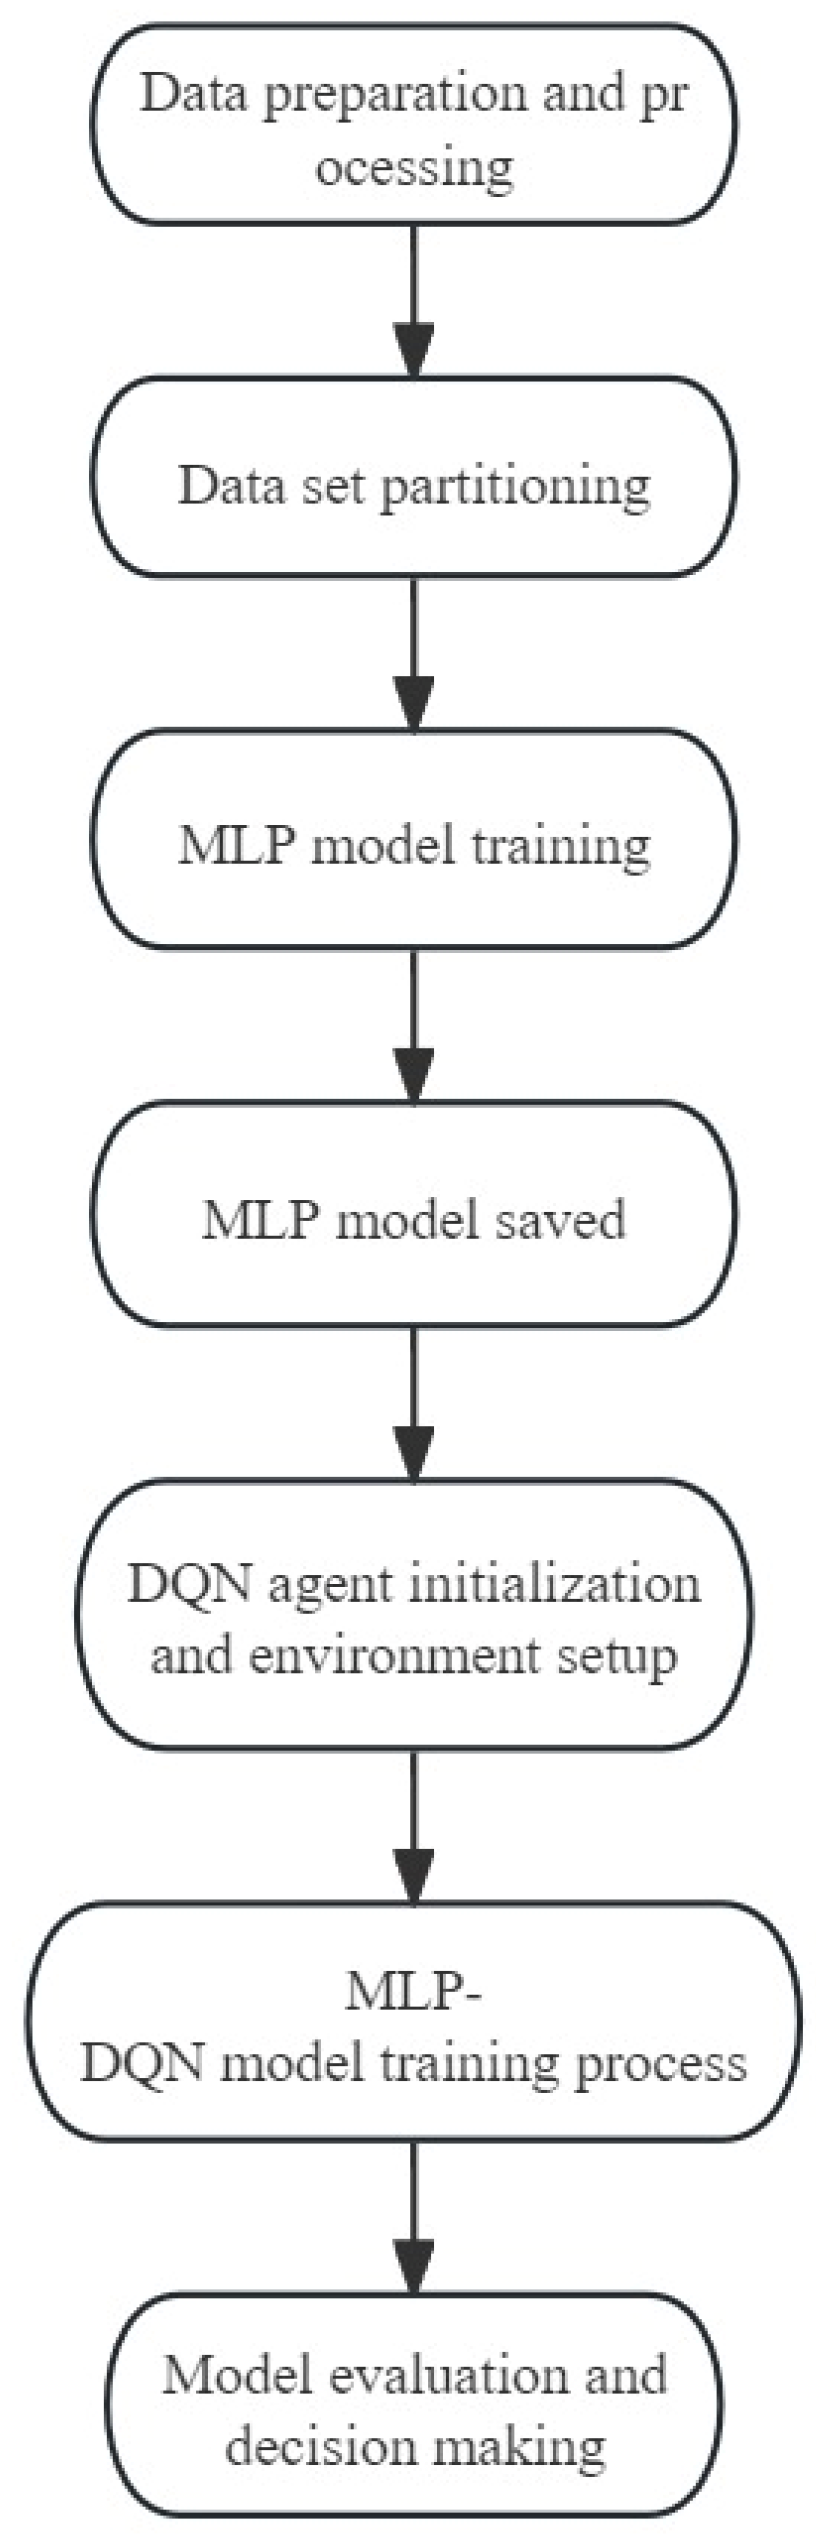
Compared with applying a large number of datasets to the Q-network, this paper uses the MLP structure as the Q-network model of the DQN, and defines a DQN agent, which can choose actions, store experience, and learn from its experience. For each training sample, in a given state, the DQN agent selects an action and then gives a reward based on whether its action is correct or not. These state–action reward combinations are stored in the experience replay cache. The agent updates its Q-value by randomly sampling from its stored experience and learning. The MLP-DQN model flow chart is shown in Figure 14.
4.3. Health Degree Model of Switch Machine
According to the above experiments, the abnormal type analysis of the current curve of the switch machine is completed, and the health model of the switch machine is established based on the current curve of the switch machine and the current weight curve of the normal standard operation of the switch machine, considering the difference of the current curve, the frequency of abnormal occurrence, and the complexity of repair. The difference was evaluated by measuring the Fréchet distance between the operating current curve of the switch machine and the standard normal current curve of the switch machine. The Fréchet distance is a highly effective distance metric that comprehensively captures the similarity between two curves. Unlike other distance measures, the Fréchet distance takes into account the overall shape and structure of the curve and is able to accommodate slight displacements of the curve in time or space.
At the same time, the relative frequency of the anomaly type and the cumbersome degree of repair are considered. The frequency of each anomaly type is counted and compared to the total number of anomaly curves to determine its weight among all anomalies. In addition, the repair complexity of each anomaly type is taken into account to reflect the severity and repair difficulty of different types of anomalies.
Considering these key factors comprehensively, a quantified health index formula has been defined. To standardize the dimensions, this formula integrates the normalized Fréchet distance between curves, the relative frequency of anomaly types, and the complexity of repairs. This provides a comprehensive assessment metric. The specific formula for calculating the health index H is shown in Formula (11):
where D′ represents the normalized Fréchet distance between the curve and the standard normal current curve.
C is the number of curves for a particular anomaly type, while T is the total number of curves for all anomalies, and C/T represents the frequency of that anomaly type relative to all anomalies. R is the repair complexity of the corresponding anomaly type. The higher the value of H is, the lower is the health degree of the switch machine. The formula for the Fréchet distance D is shown in (12):
and represent the moving paths along the two curves, respectively, and represents the maximum distance between points on these two paths among all possible path choices. We quantify the overall difference between the two current curves by calculating this maximum distance.
In order to make a fair comparison and effective integration of different variables under the same scale, by dimensioning, each Fréchet distance value is converted to a relative number between 0 and 1, so that the smallest distance value corresponds to 0, the largest to 1, and all other values in between. This relativization allows us to measure the difference between different curves more accurately and is more consistent with other evaluation metrics (frequency and repair complexity).
The formula for the Fréchet distance normalization is given in (13):
The number of abnormal action current curves is obtained by data processing. The complexity of abnormal type maintenance is obtained by “S700K Switch Machine Maintenance” and expert engineers, as shown in Table 3.
5. Model Training
5.1. Experimental Environment
5.2. Experiment Setup
This paper presents the performance of real-time monitoring of the health of subway switch machines. The data source is the flow data of the subway switch machine, and 46,113 pieces of operation current data information are filtered and processed. Due to the difference in the reading time of the sensor or other external interference in the acquisition process, the number of current data elements collected in the action current curve is different. In order to ensure data consistency and facilitate subsequent analysis and model training, the data length is unified to 169 current data elements. In addition, due to the high similarity between the three phases of the current, using all three phases may introduce redundant information that adds no additional predictive value to the model, but increases computational complexity. Therefore, in order to ensure the computational efficiency and the generalization ability of the model, we choose the A-phase current data. According to the training model, the training set, the test set, and the verification set of the dataset are trained, and the proportion is 7:2:1. The specific model parameter Settings are shown in Table 6.
5.3. Evaluation Index
This paper mainly uses the dataset of the subway switch motor operating current to train and test the model, in order to evaluate the performance of the proposed real-time health monitoring of the subway switch machine. The data source is the current data of the subway switch machine, and 46,113 pieces of action current data information are processed by screening. After unified processing, each action current curve consists of 169 pieces of current data information. According to the training model, the ratio of the dataset training set, test set, and validation set is 7:2:1. The specific model parameters are set as follows:
Accuracy is the simplest and most intuitive evaluation metric for classification models. For a given test dataset, accuracy is the ratio of the number of samples that the model predicts correctly (NCP) to the total number of samples (TNP), as shown in (14).
Categorical cross-entropy loss is a loss function used for multi-class classification problems. For each sample, it takes into account the probability that the model predicts for each class. If yi is a one-hot encoding of the true class of sample i, and p(yi) is the probability distribution predicted by the model for that sample (usually obtained via a soft-max function), then the categorical cross-entropy loss can be defined as, as shown in (15):
5.4. Experimental Result
5.4.1. Model Training Results
In the experiment, the multi-layer perceptron (MLP) model is used to train the steering motor current data. The experimental dataset consists of input vectors with feature dimension 169 and corresponding multi-class labels. The model architecture consists of an input layer, two hidden layers, and an output layer. Each hidden layer contains 24 neurons and uses the rectified linear unit (ReLU) activation function, while the output layer has the same number of neurons as the number of classification labels and uses the soft-max activation function to output the probability distribution.
Figure 15 shows how the accuracy of the model changes over the course of training and validation. It can be observed that the accuracy of the model on the training set is increasing, and the accuracy on the validation set reaches its peak at the 91st epoch, which is 96.67%. After that, although the accuracy on the training set continued to increase, the accuracy on the validation set started to decrease, implying that the model started to overfit.
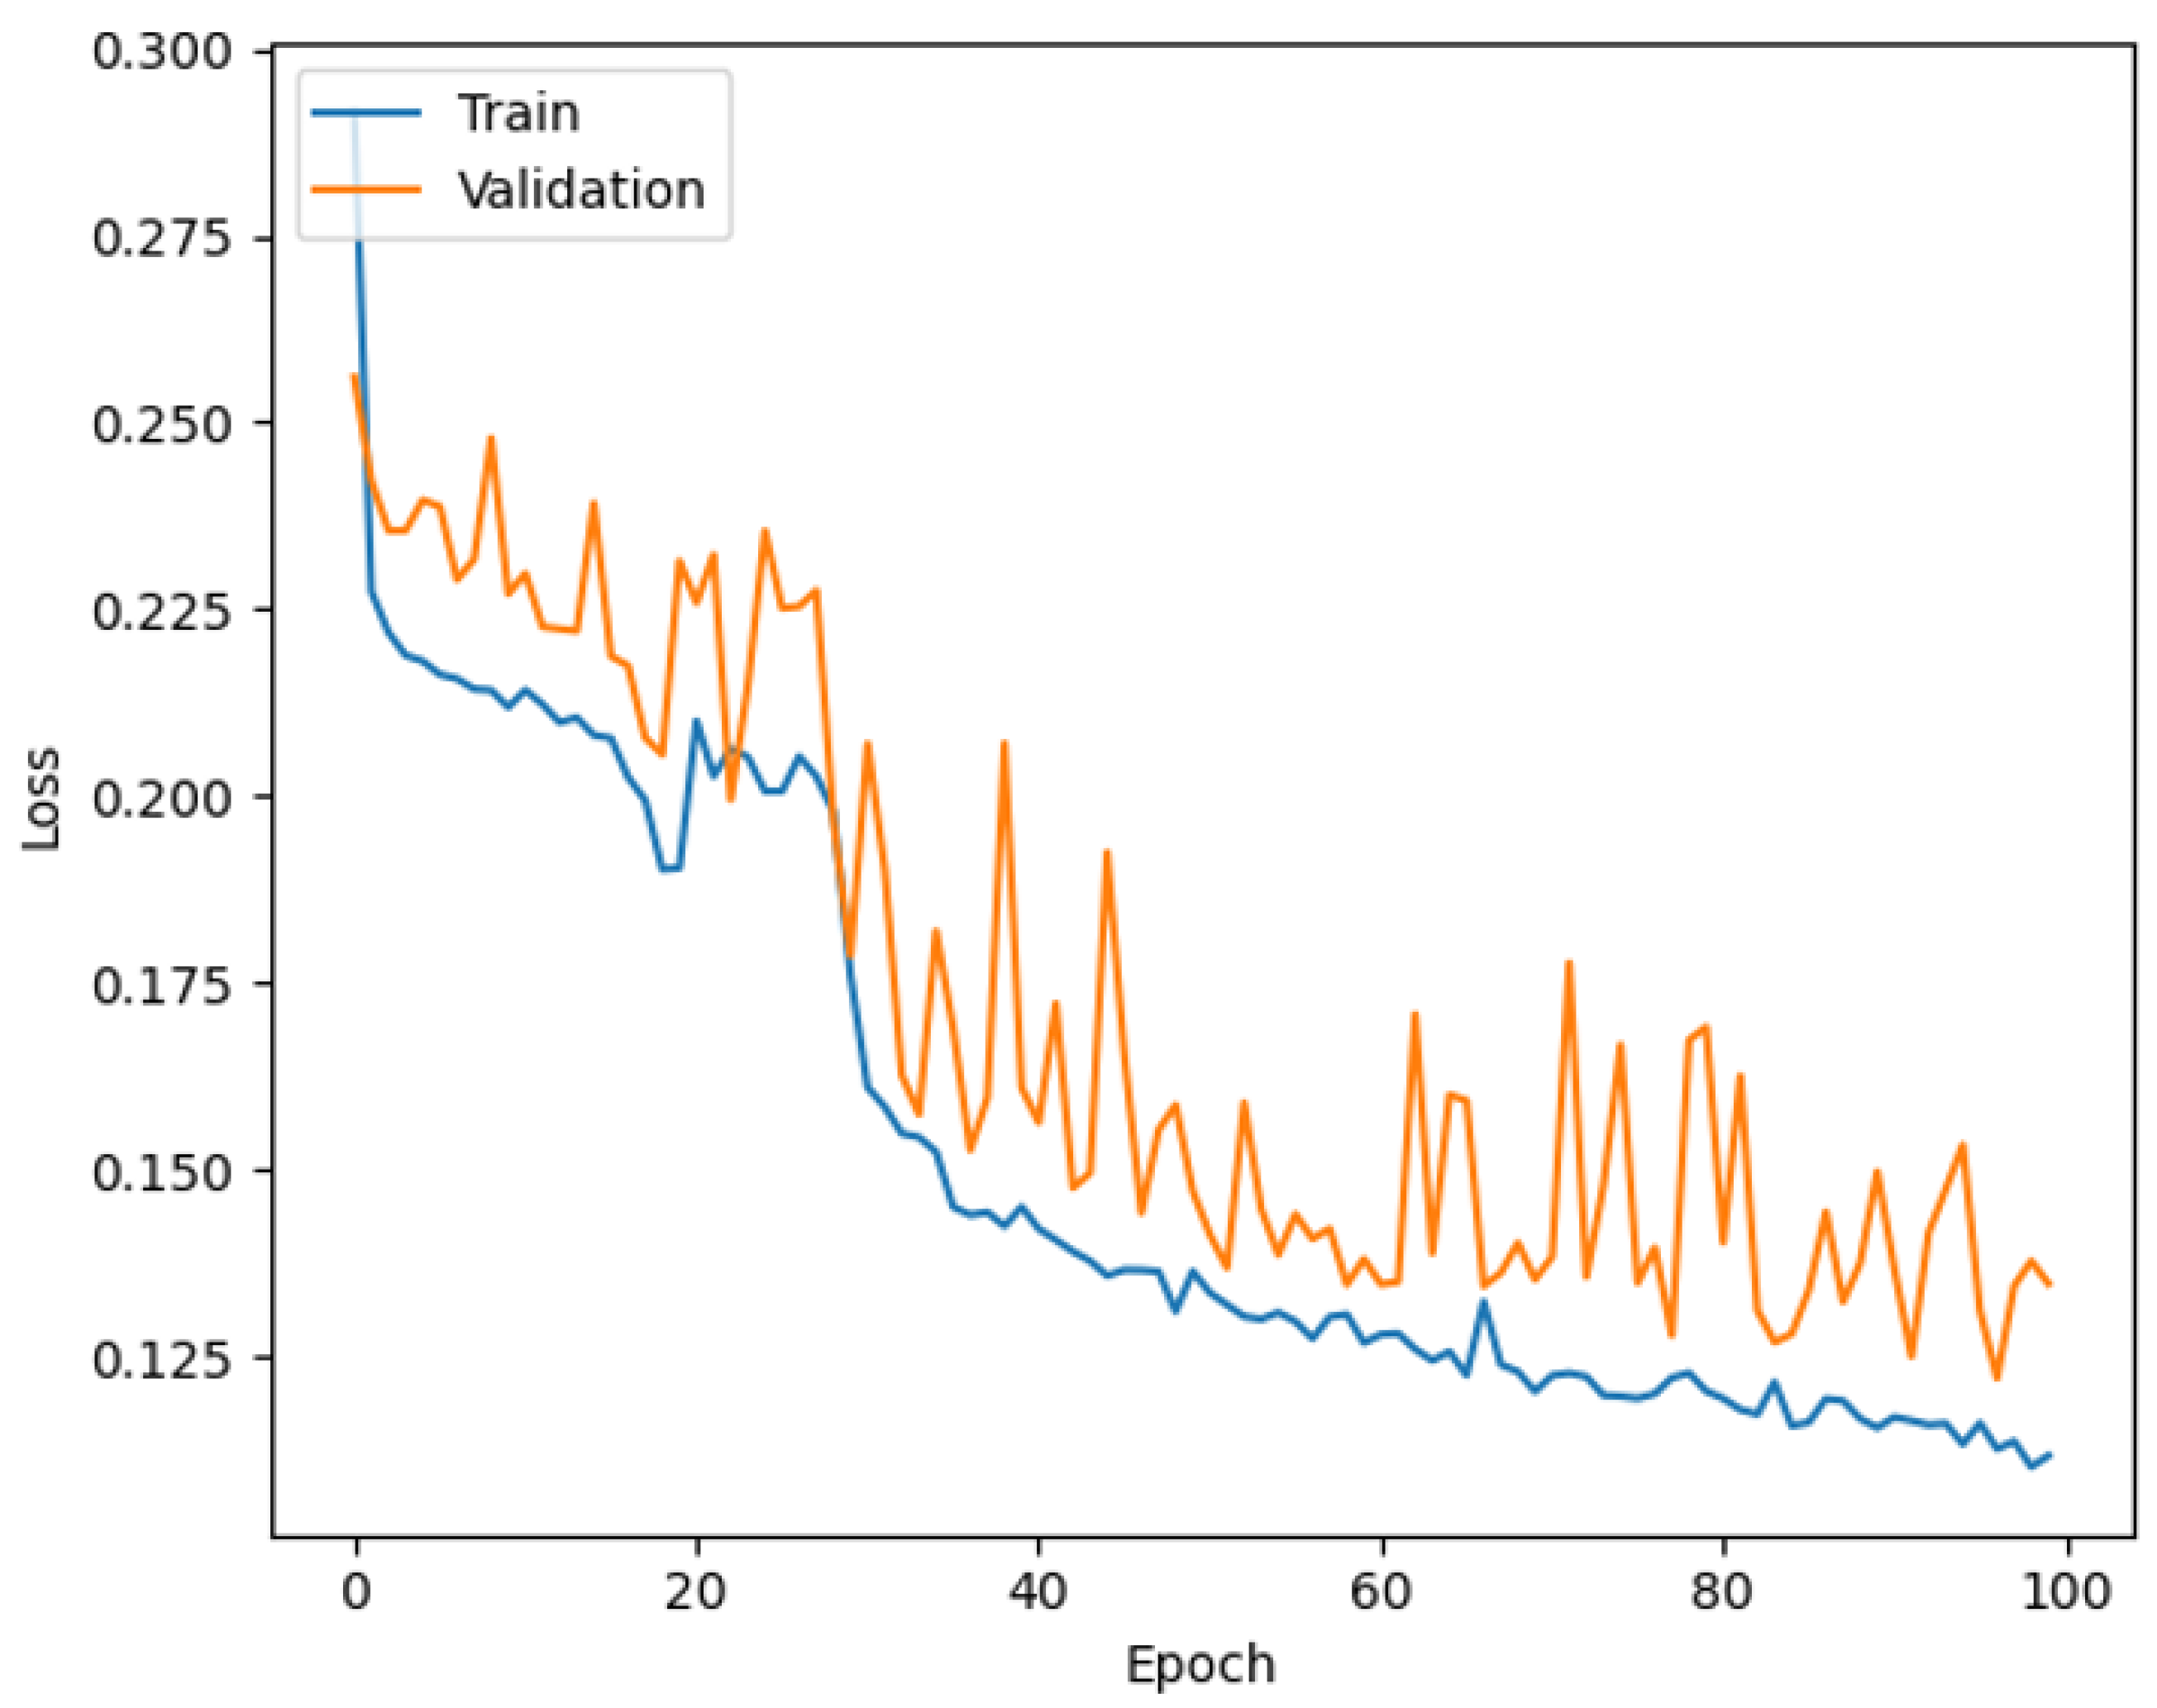
Figure 16 shows the change in the value of the loss function for the training and validation sets during the training process. Similar to the change in accuracy, the loss of the model on the training set gradually decreases, but the loss on the validation set starts to increase after reaching the minimum value. On the test dataset, the model achieves an accuracy of 96.67% and a loss value of 0.1221.
5.4.2. Switch Machine Health Results
According to Formulas (11)–(13), part of the health data of the switch machine are shown in Table 9:
The average health values of the four abnormal types are shown in Table 10.
According to the above health data, it can be seen that Abnormal Type 3 requires more attention and resources to repair when it occurs at a high frequency. Abnormal Type 2 has less impact on the overall health of the point machine and is a relatively easy problem to repair or manage.
6. Summary and Conclusions
This paper takes the S700K AC switch machine as the object, and its action current signal data are used to diagnose the abnormality. The core research contents of this paper are as follows:
In this paper, the classification of the input data is completed by constructing the MLP model and training it through the standard forward and inverse propagation. At the same time, combined with the DQN model, the MLP structure is used as the Q-network of the DQN model to effectively verify the data monitoring. The innovative features are as follows:
- (1)
- This study discusses the conversion process from positioning to reverse positioning of the turnout system, elaborates the five key stages of the working mechanism of the S700K, and makes in-depth analysis. In view of the unique characteristics of abnormal current curves, this paper summarizes eight common abnormal current curves of switch machines, and further analyzes their potential reasons for abnormality;
- (2)
- In the feature processing stage, the feature parameters are extracted from the time domain and frequency domain, and the features of the abnormal current curve data are extracted using the MLP model. Based on the obtained data characteristics, the MLP-DQN model is tested. The experimental results show that the loss function values of the model on the training set and the verification set show a specific change trend during the training process. With the progress of training, the loss value of the model on the training set gradually decreases, showing the improvement of the model’s learning ability. The average accuracy of the model is 96.67% and the loss value is 0.1221 on the test dataset, which proves the high efficiency and accuracy of the MLP-DQN model in the state evaluation of the switch machine. The above analysis not only demonstrates the powerful performance of the MLP-DQN model in processing current signal data from the switch maneuver, but also reflects the key observations during feature extraction and model training. These findings provide important insights into how models behave on different datasets and provide a basis for further optimization of model structure and parameters.
- (3)
- On the establishment of the health degree model of the switch machine, the Fréchet distance is used to calculate the health status of the switch machine by combining the occurrence frequency of the abnormal switch machine’s current curve and the maintenance complexity.
This study not only provides a new health monitoring scheme for the S700K switch machine, but also provides technical support for other types of rail transit equipment health monitoring. Future work will focus on collecting a wider range of anomaly data, considering feature construction that includes multiple parameters, such as current and voltage, to enhance the feature diversity, accuracy, and robustness of the model. In addition, the further optimization and application of this research method will provide an important technical basis for intelligent operation and maintenance, fault prevention, and maintenance decision-making of urban rail transit systems, and help to promote the development of rail transit system management to a more efficient and intelligent direction.
Meanwhile, in this study, the abnormal diagnosis of the S700K switch machine is deeply discussed, aiming to provide technical support for the maintenance and repair of switch machine. However, due to the limited collection of abnormal data, the research time frame, and the research ability of the author, there are some areas and problems that need to be deepened and improved in this study. In order to further improve the model, it is suggested to collect a wider range of abnormal data, and consider including multivariate parameters such as current and voltage in the feature construction, in order to enhance the feature diversity of the model, and further optimize the accuracy and robustness of the model.
The full name of the Notations and acronyms in this paper is shown in Table 11.
Author Contributions
Conceptualization, Z.W., D.S. and J.Z. (Jin Zhou); methodology, Z.W.; software, Z.W.; validation, Z.W.; formal analysis, K.G., J.Z. (Jiaxin Zhang) and X.K.; investigation, Z.W.; resources, D.S. and J.Z. (Jin Zhou); data curation, Z.W.; writing—original draft preparation, Z.W.; writing—review and editing, Z.W.; visualization, Z.W.; supervision, D.S., J.Z. (Jin Zhou) and K.G.; project administration, D.S. and J.Z. (Jin Zhou); funding acquisition, D.S. All authors have read and agreed to the published version of the manuscript.
Funding
This research received no external funding.
Institutional Review Board Statement
Not applicable.
Informed Consent Statement
Not applicable.
Data Availability Statement
The data presented in this study are available on request from the corresponding authors. The data is not made public due to privacy concerns.
Acknowledgments
Thanks to our families and colleagues who supported us morally.
Conflicts of Interest
The authors declare no conflicts of interest.
References
- He, H.; Dai, M.; Li, X.; Tao, W. Research on Intelligent Fault Diagnosis Method of Turnout based on DCNN-SVM. J. Chin. Railw. Soc. 2023, 45, 103–113. [Google Scholar]
- Zhang, K.; Du, K.; Ju, Y. Algorithm of Railway Turnout Fault Detection Based on BP Neural Network. In Proceedings of the 2014 International Conference on Advanced Computer Science and Engineering (ACSE 2014), Hangzhou, China, 13–14 December 2014. [Google Scholar]
- Zhang, K.; Du, K.; Ju, Y. Fault Diagnosis Algorithm of Speeding Turnout Based on BP Neural Network. J. Wuhan Univ. Technol. 2014, 36, 77–81. [Google Scholar]
- Zhang, T. Research on Intelligent Analysis of Current Curve of S700K Rotary Machine. Manuf. Autom. 2014, 36, 71–74+77. [Google Scholar]
- Tang, W.H. Research on Feature Extraction and identification of Turnout Fault Based on LSTM/NN. Comput. Appl. Softw. 2019, 36, 159–163. [Google Scholar]
- Li, Z.Y. Abnormal data mining of ZDJ9 Point Machine based on improved DPC algorithm. Railw. Commun. Signal Eng. Technol. 2012, 19, 1–6. [Google Scholar]
- Zhang, H.; Wu, M. Cause analysis and remediation measures of foreign matter on sliding bed plate of subway turnout—A case study of W0108# reentry turnout of Hangzhou Metro Line 1. Ind. Technol. Innov. 2023, 10, 69–76. [Google Scholar]
- Wang, Z.; Zhang, Z.; Qin, J.; Ji, C. Review of Mechanical Fault Diagnosis Technology Based on Convolutional Neural Network. Comput. Appl. 2022, 42, 1036–1043. [Google Scholar]
- Xu, Q.; Liu, Z.; Zhao, H. Bifurcation Fault Diagnosis Method Based on Hidden Markov Model. J. Railw. Sci. 2018, 40, 98–106. [Google Scholar]
- Cui, Y.; Wang, H.; Zhang, S.; Wang, X. Gas Turbine Rotor Fault Diagnosis Method Based on Improved DQN. Noise Vib. Control. 2023, 43, 109–115+199. [Google Scholar]
- Lu, Y. Rolling Bearing Fault Diagnosis Method Based on Multi-layer Perceptron and Proximal Strategy Optimization. Bearing, 1–8. Available online: http://kns.cnki.net/kcms/detail/41.1148.TH.20221230.1410.003.html (accessed on 23 December 2023).
- Meng, L.; Zheng, L.; Zheng, Z.; Liu, R. Based on the Whale MLP Algorithm Optimization of Rolling Bearing Fault Diagnosis. Bearing, 1–10. Available online: http://kns.cnki.net/kcms/detail/41.1148.TH.20230627.1618.006.html (accessed on 23 December 2023).
- Long, J. Rotating machinery fault diagnosis strategy based on depth of intensive study. J. Mech. Des. Manuf. 2021, 10, 7. [Google Scholar] [CrossRef]
- Ma, L. Reinforcement Learning Based on the Depth of Communication Anti-Jamming Technology Research. Master’s Thesis, Nanjing University of Posts and Telecommunications, Nanjing, China, 2023. [Google Scholar]
- Li, F.; Wang, H.; Lu, Z.; Wang, Z. Real-Time Optimal Scheduling of AC/DC Hybrid Microgrid Based on Artificial Auxiliary Deep Reinforcement Learning. Mod. Electr. Power 2023, 40, 577–586. [Google Scholar] [CrossRef]
- Zhang, D.; Li, G. Fault Diagnosis of S700K Switch Machine Based on Improved WNN analysis Power Curve. J. Railw. Sci. Eng. 2018, 15, 2123–2130. (In Chinese) [Google Scholar] [CrossRef]
- Wei, W.; Liu, X.; Zhang, M. Fault Diagnosis of S700K Switch Machine based on EEMD Multi-scale Fuzzy entropy. J. Railw. Sci. 2022, 44, 60–66. [Google Scholar]
- Li, L. Switch Based on Convolutional Neural Network Fault Diagnosis Method Research. Master’s Thesis, Lanzhou Jiaotong University, Lanzhou, China, 2019. [Google Scholar]
- Chen, Q.; Nicholson, G.; Ye, J.; Roberts, C. Fault Diagnosis Using Discrete Wavelet Transform (DWT) and Artificial Neural Network (ANN) for A Railway Switch. In Proceedings of the 2020 Prognostics and Health Management Conference (PHM-Besançon), Besancon, France, 4–7 May 2020. [Google Scholar]
- Zhou, F.; Xia, L.; Dong, W.; Sun, X.; Yan, X.; Zhao, Q. Fault diagnosis of high-speed railway turnout based on support vector machine. In Proceedings of the 2016 IEEE International Conference on Industrial Technology (ICIT), Taipei, Taiwan, 14–17 March 2016. [Google Scholar] [CrossRef]
- Zhang, K. The railway turnout fault diagnosis algorithm based on BP neural network. In Proceedings of the 2014 IEEE International Conference on Control Science and Systems Engineering, Yantai, China, 29–30 December 2014. [Google Scholar]
- Cheng, Y.; Zhao, H. Fault detection and diagnosis for railway switching points using fuzzy neural network. In Proceedings of the 2015 IEEE 10th Conference on Industrial Electronics and Applications (ICIEA), Auckland, New Zealand, 15–17 June 2015; pp. 860–865. [Google Scholar] [CrossRef]
- De Bruin, T.; Verbert, K.; Babuška, R. Railway Track Circuit Fault Diagnosis Using Recurrent Neural Networks. IEEE Trans. Neural Netw. Learn. Syst. 2016, 28, 523–533. [Google Scholar] [CrossRef] [PubMed]
- Huang, S.; Yang, L.; Zhang, F.; Chen, W.; Wu, Z. Turnout Fault Diagnosis Based on CNNs with Self-Generated Samples. J. Transp. Eng. Part A Syst. 2020, 146, 04020105. [Google Scholar] [CrossRef]
- Patel, R.A.; Bhalja, B.R. Condition monitoring and fault diagnosis of induction motor using support vector machine. Electr. Power Compon. Syst. 2016, 44, 683–692. [Google Scholar] [CrossRef]
- Zhang, R.; Zhao, H.; Hou, L.; Chen, F.; Shao, Z.; Ji, W.; Cai, B. Fault diagnosis method of offshore cementing pump based on MLP neural network. Autom. Instrum. 2022, 9, 54–57. [Google Scholar] [CrossRef]
- Kang, H.; Wu, Y.; Chen, L.; Zhang, X. Research on Device Modeling Technique Based on MLP Neural Network for Model Parameter Extraction. Appl. Sci. 2022, 12, 1357. [Google Scholar] [CrossRef]
- Wu, W.; Chen, J.; Liu, X.; Zhou, Z. Intelligent fault diagnosis method based on unsupervised feature representation Deep Q Learning. J. Cent. South Univ. 2022, 53, 1750–1759. [Google Scholar]
- Zhu, Z.; Zhang, X.; Chen, H. Voltage Control Method of Distribution Network with Intelligent Soft Switch Based on Deep reinforcement Learning. High Volt. Technol. 2024, 50. [Google Scholar] [CrossRef]
- Zhou, J. Rotating Machinery Fault Diagnosis Method Based on the Depth of Reinforcement Learning Research. Master’s Thesis, Chongqing Jiaotong University, Chongqing, China, 2020. [Google Scholar]
- Huang, Z. Hyperparameter Optimization Method Based on Improved DQN Algorithm and Its Application in Fault Diagnosis. Master’s Thesis, Huazhong University of Science and Technology, Wuhan, China, 2021. [Google Scholar]
- Li, F. Interturn Short Circuit Fault Diagnosis of Permanent Magnet Synchronous Motor Based on Deep Reinforcement Learning. Master’s Thesis, Jiangsu University of Science and Technology, Zhenjiang, China, 2022. [Google Scholar]
Figure 1.
Normal operation current curve.
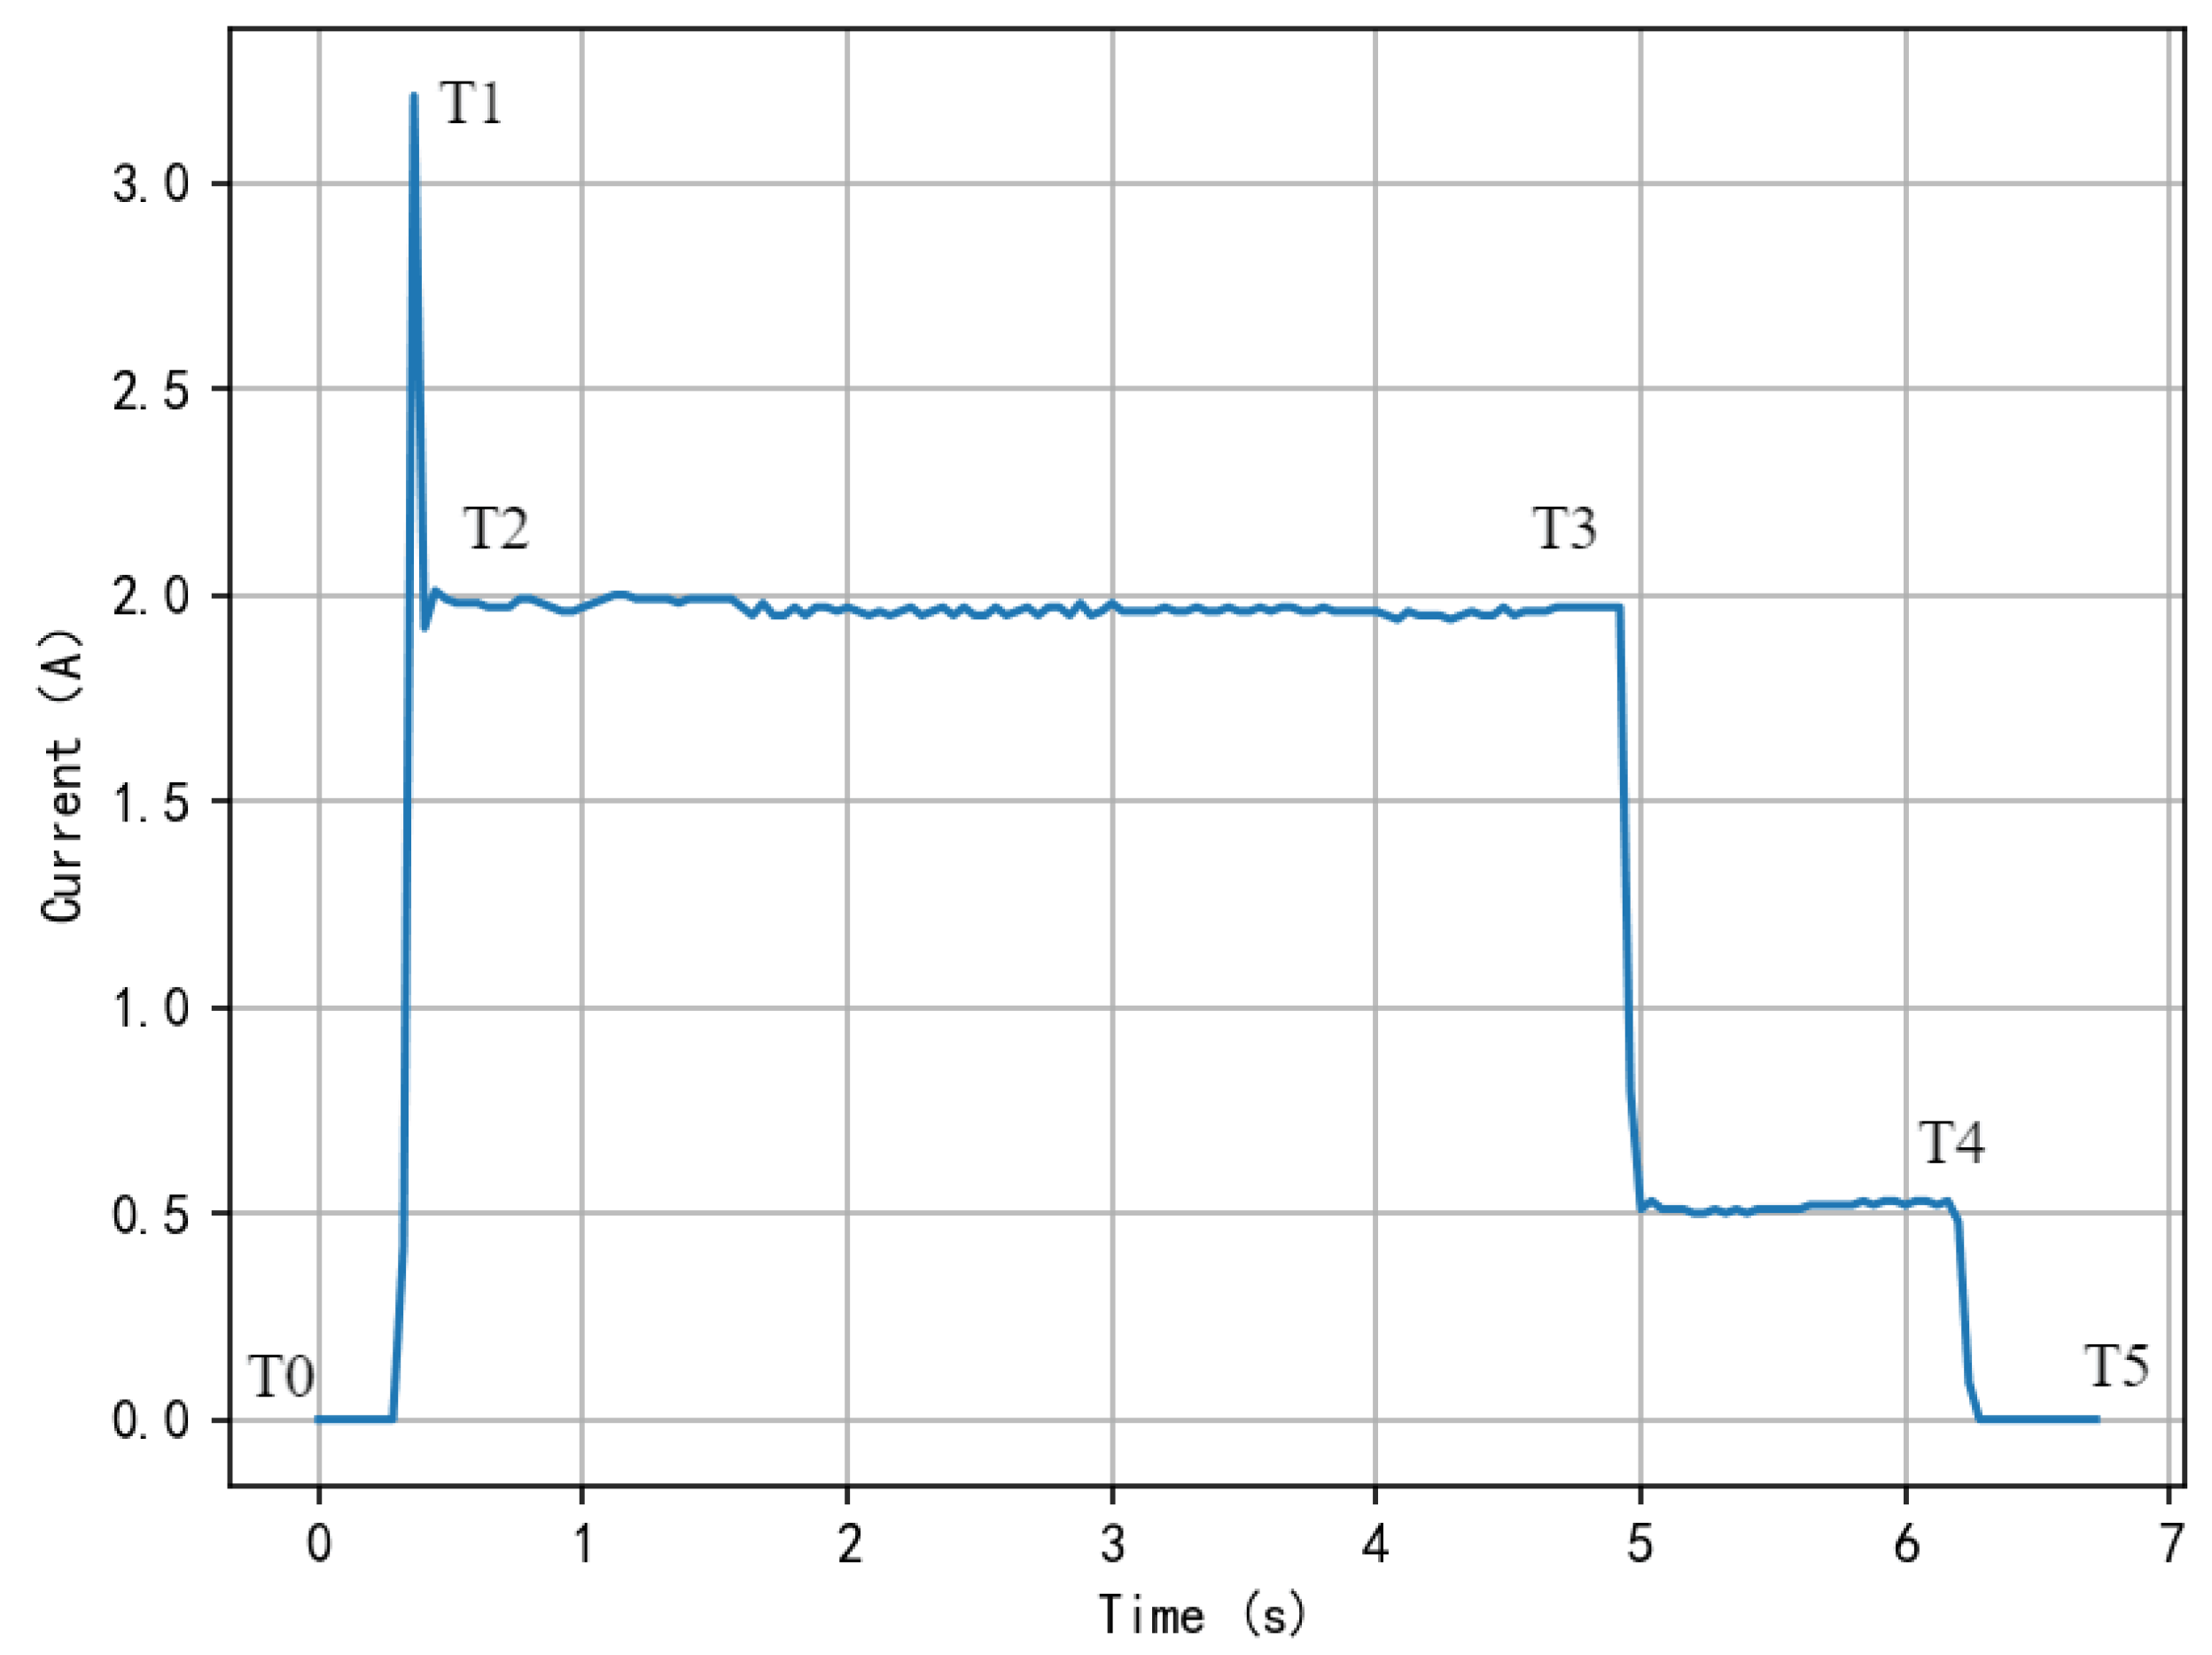
Figure 2.
Standard normal operation current curve.

Figure 3.
Similarity analysis of partial current data.

Figure 4.
Delay in the start of the turnout.
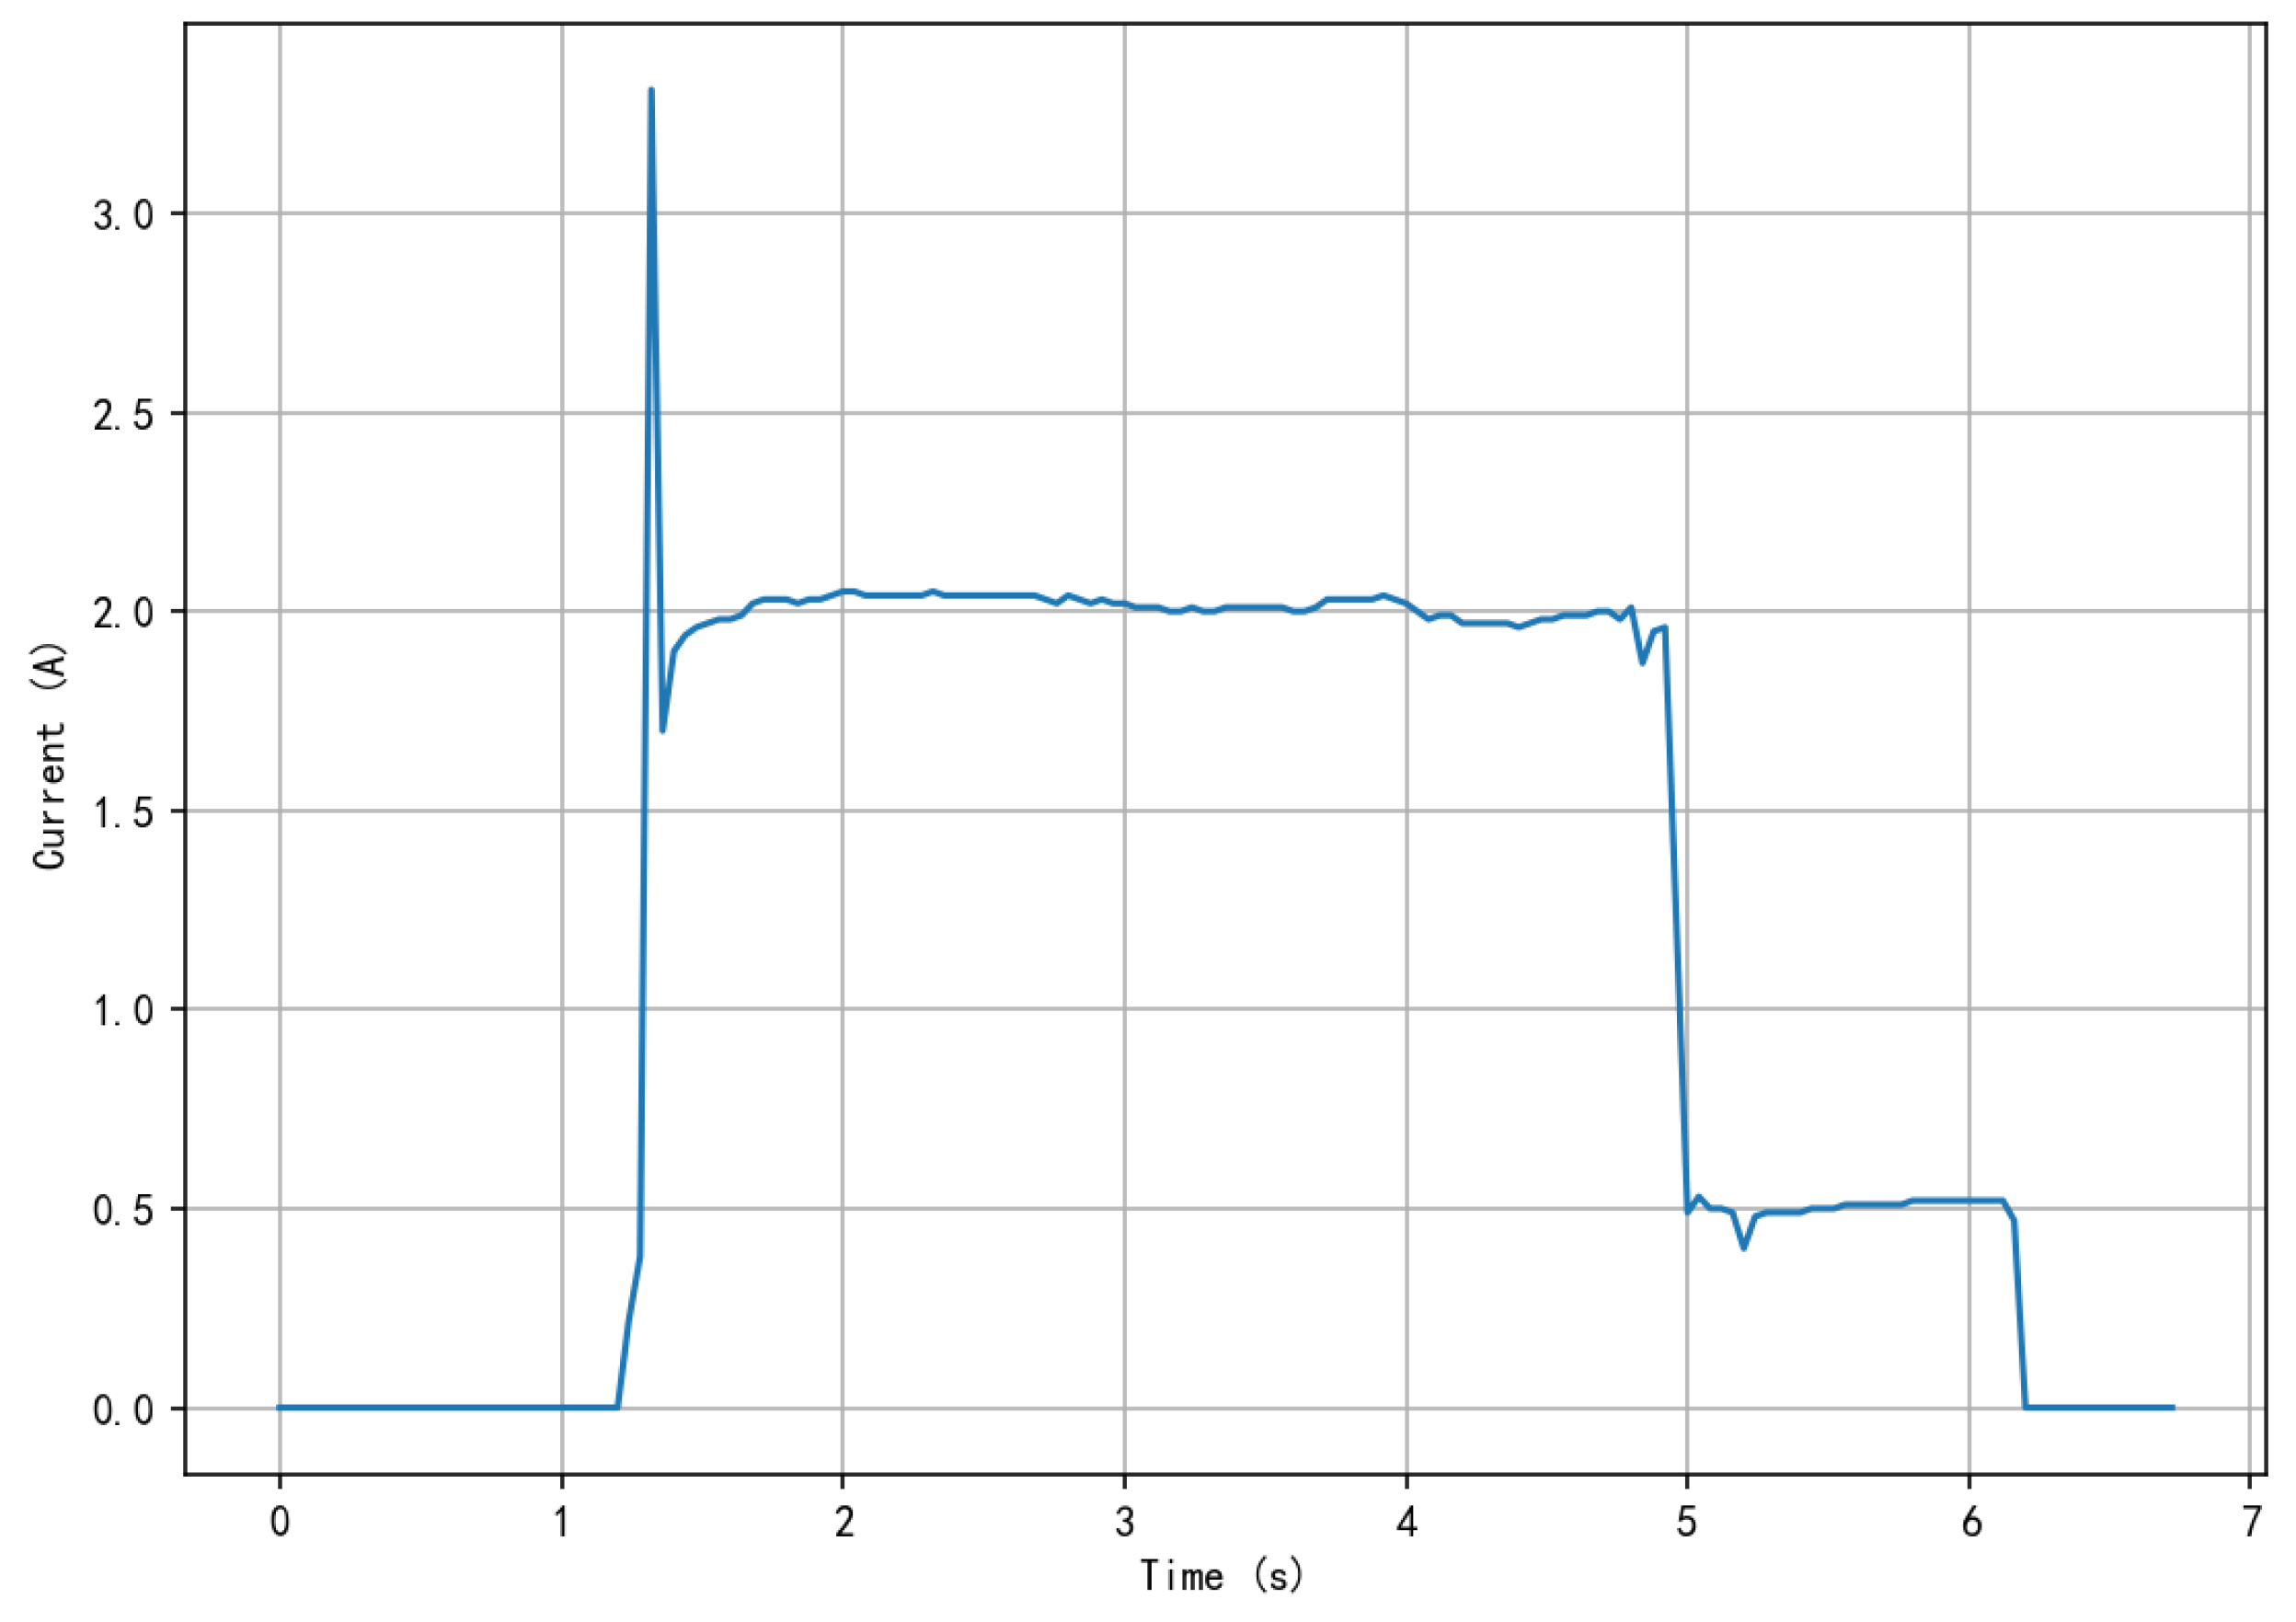
Figure 5.
Delay in entering the coasting phase.

Figure 6.
No coasting phase action current.

Figure 7.
Coasting phase action current surge.

Figure 8.
Switch not interlocked.
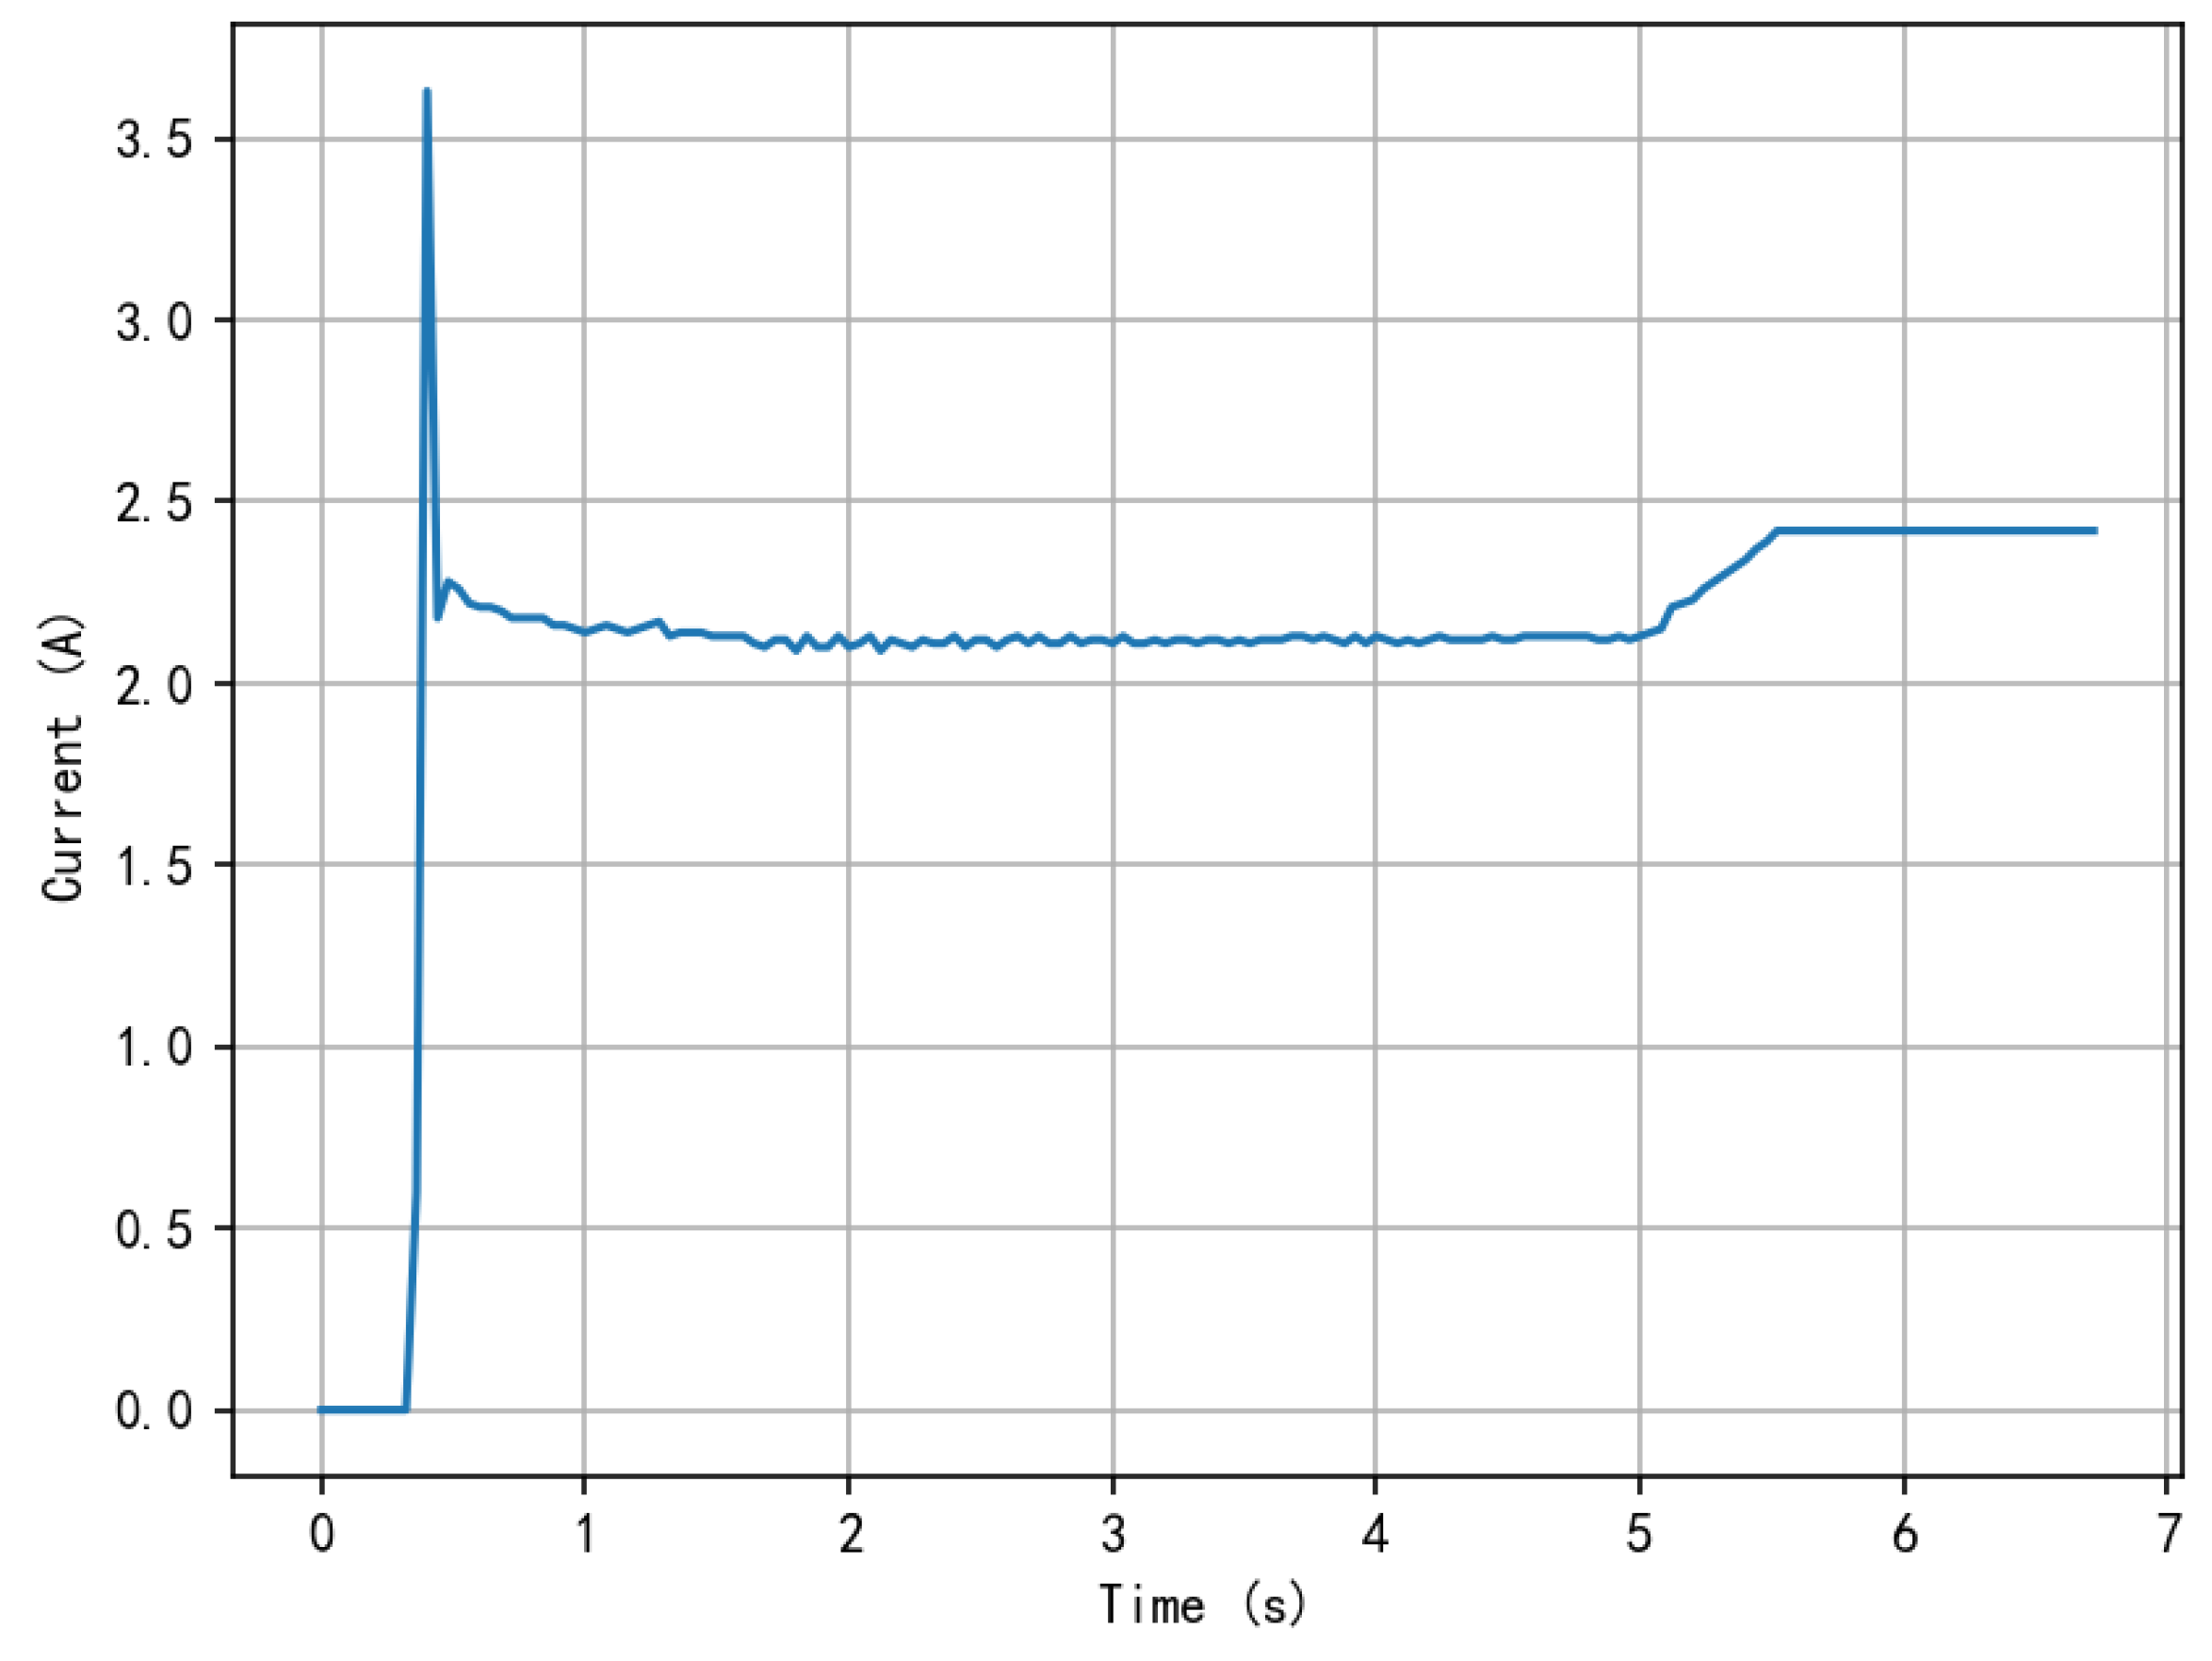
Figure 9.
Switch obstruction.
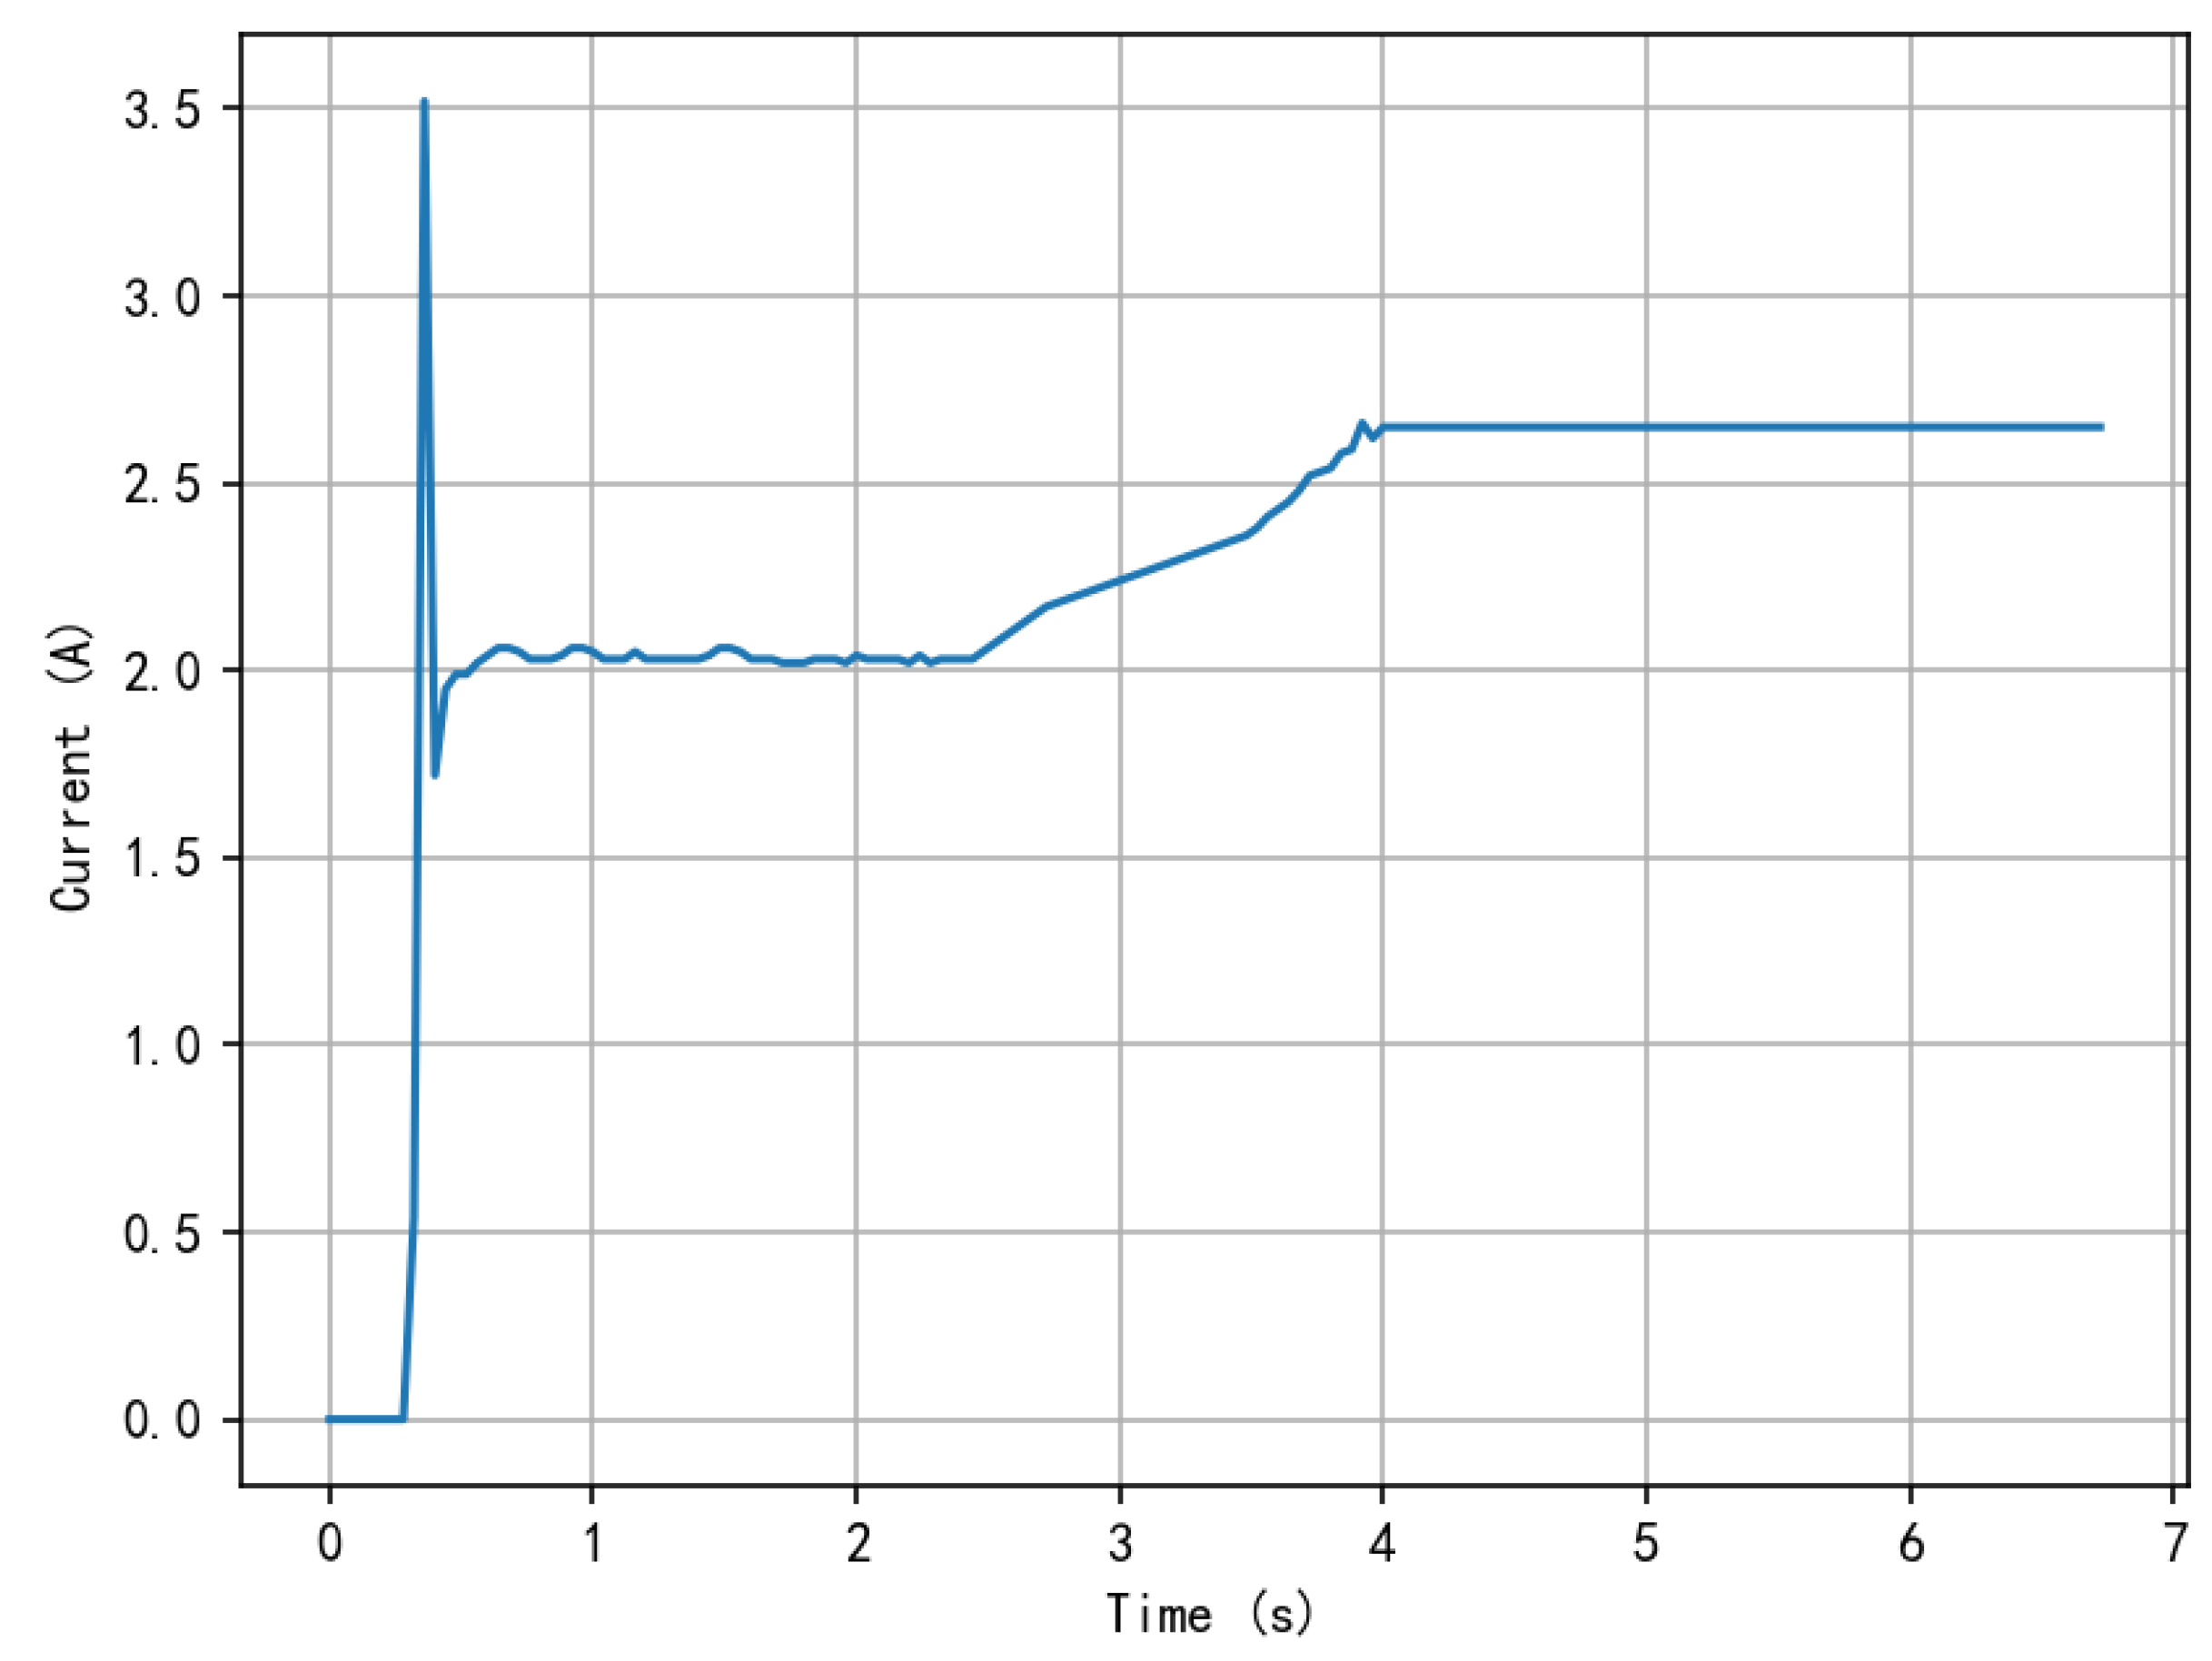
Figure 10.
Sudden stop after turnout activation.
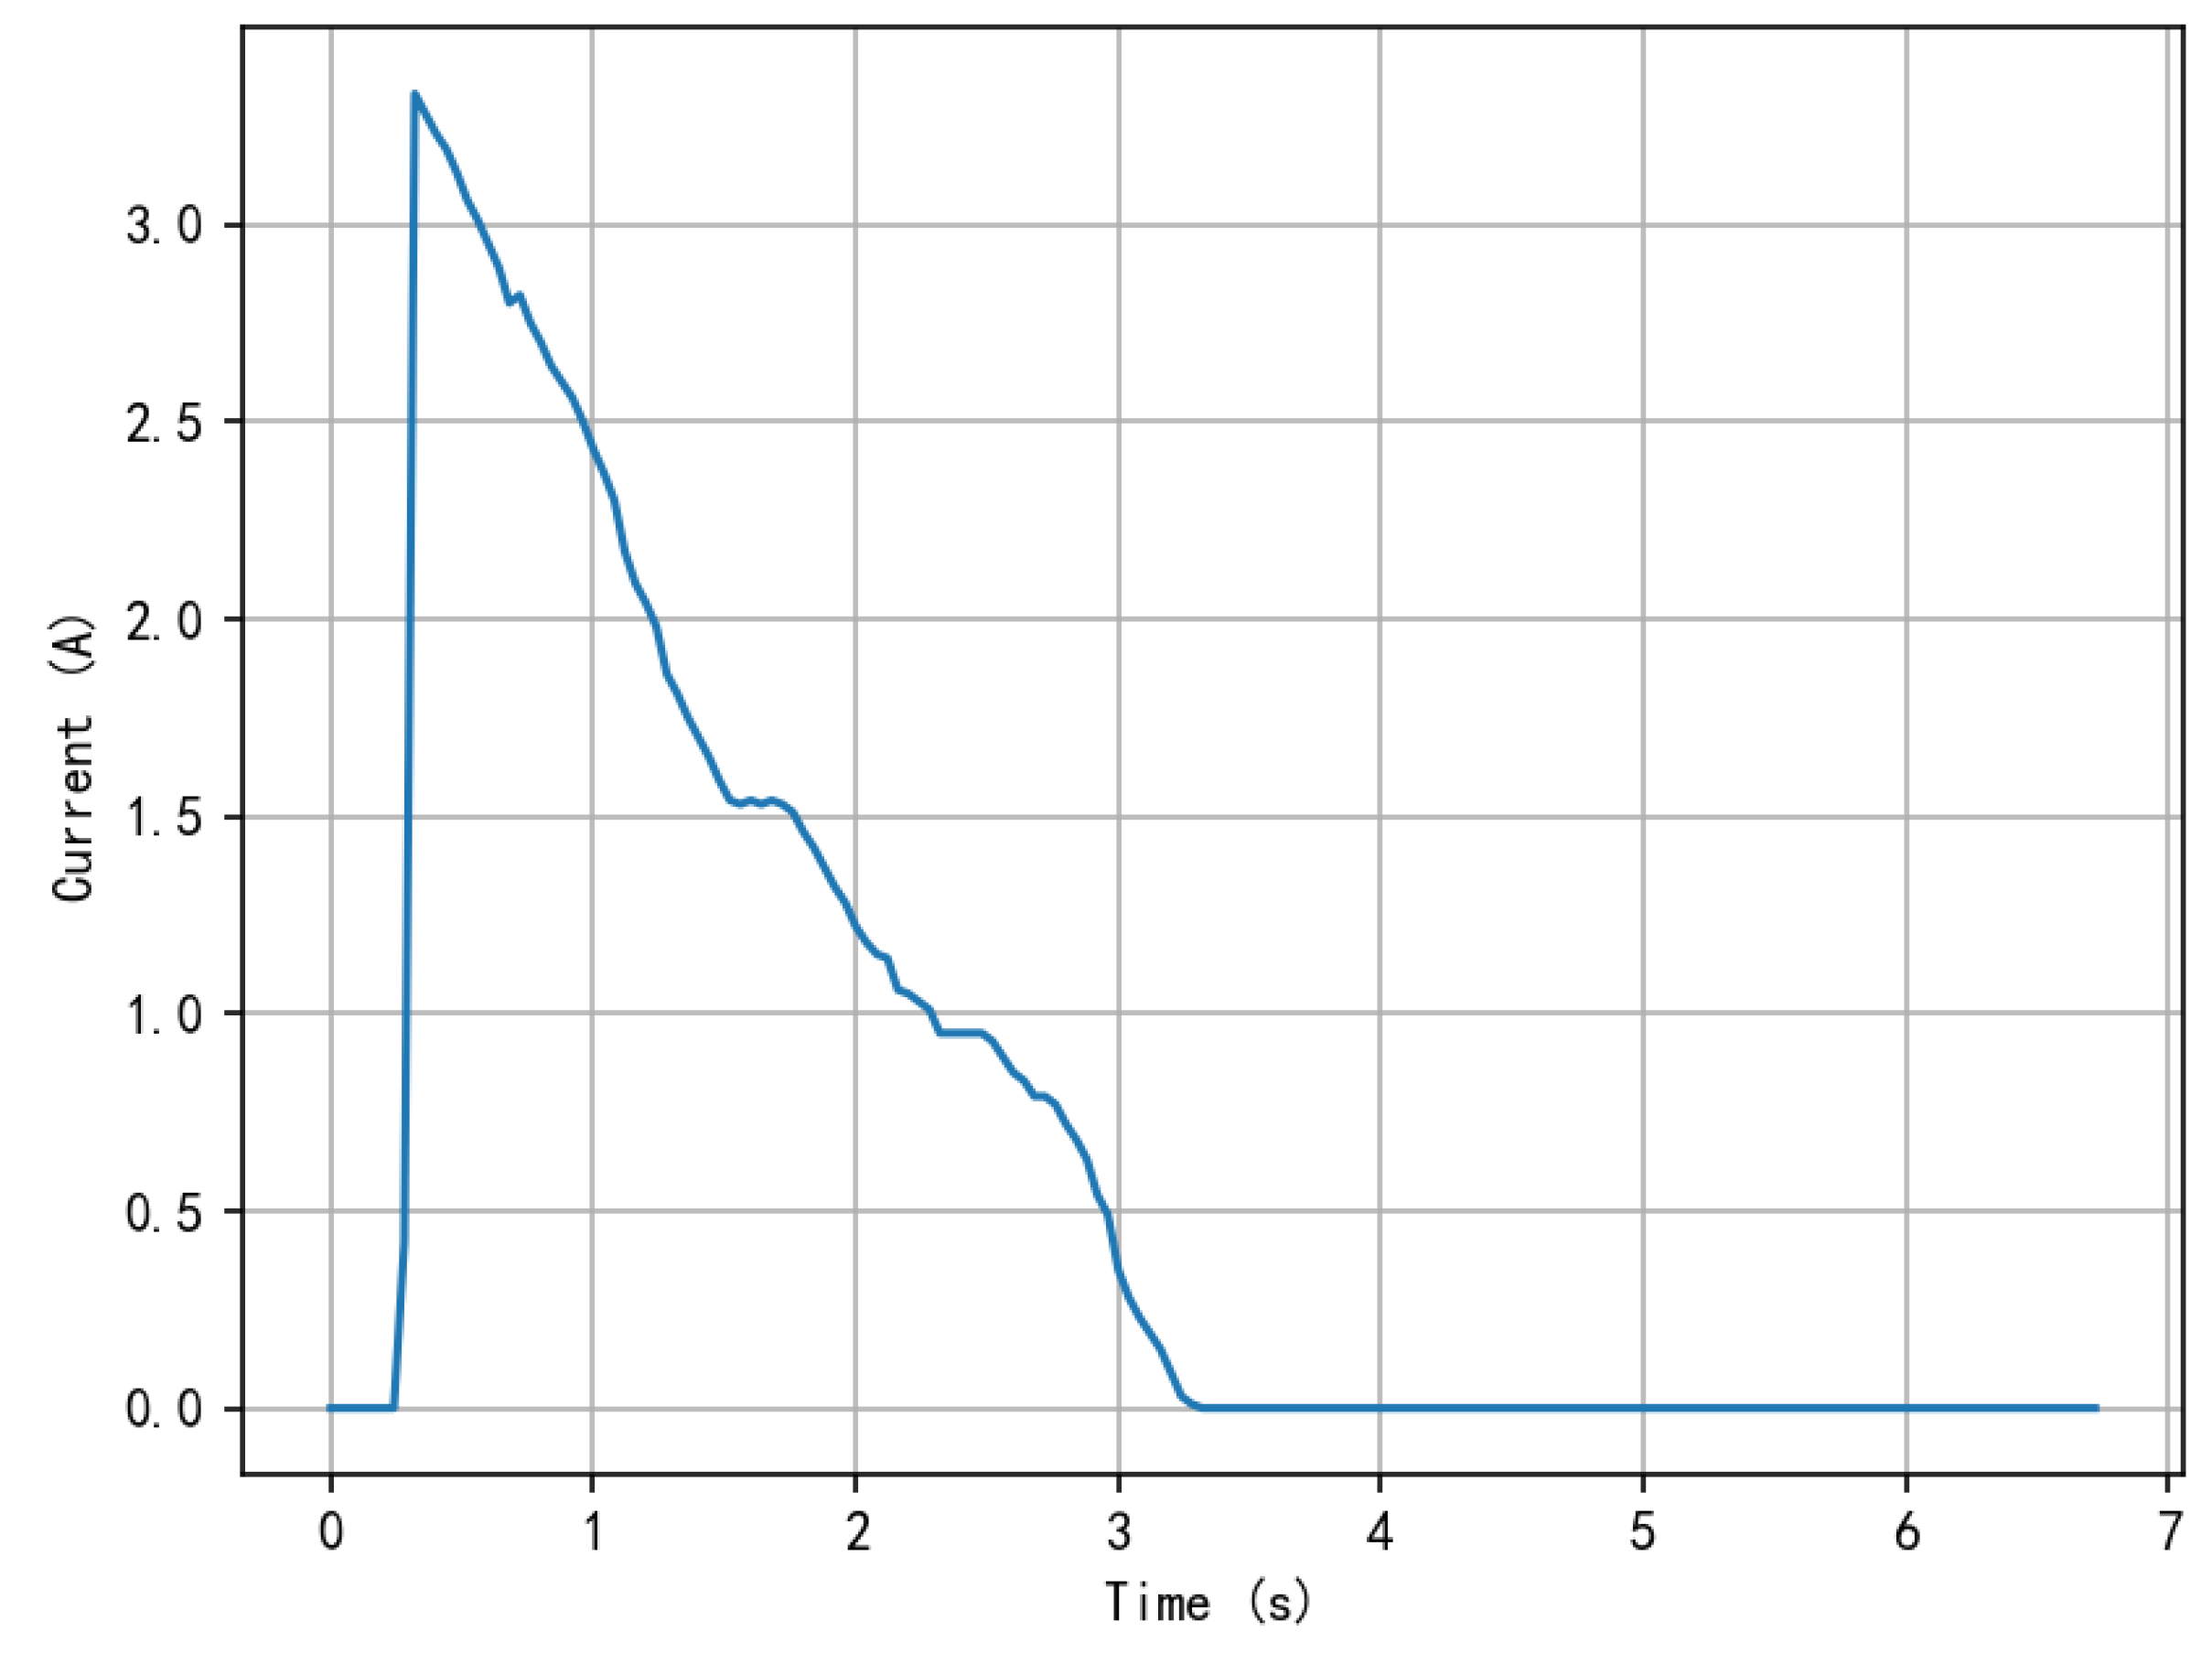
Figure 11.
Unstable action current.
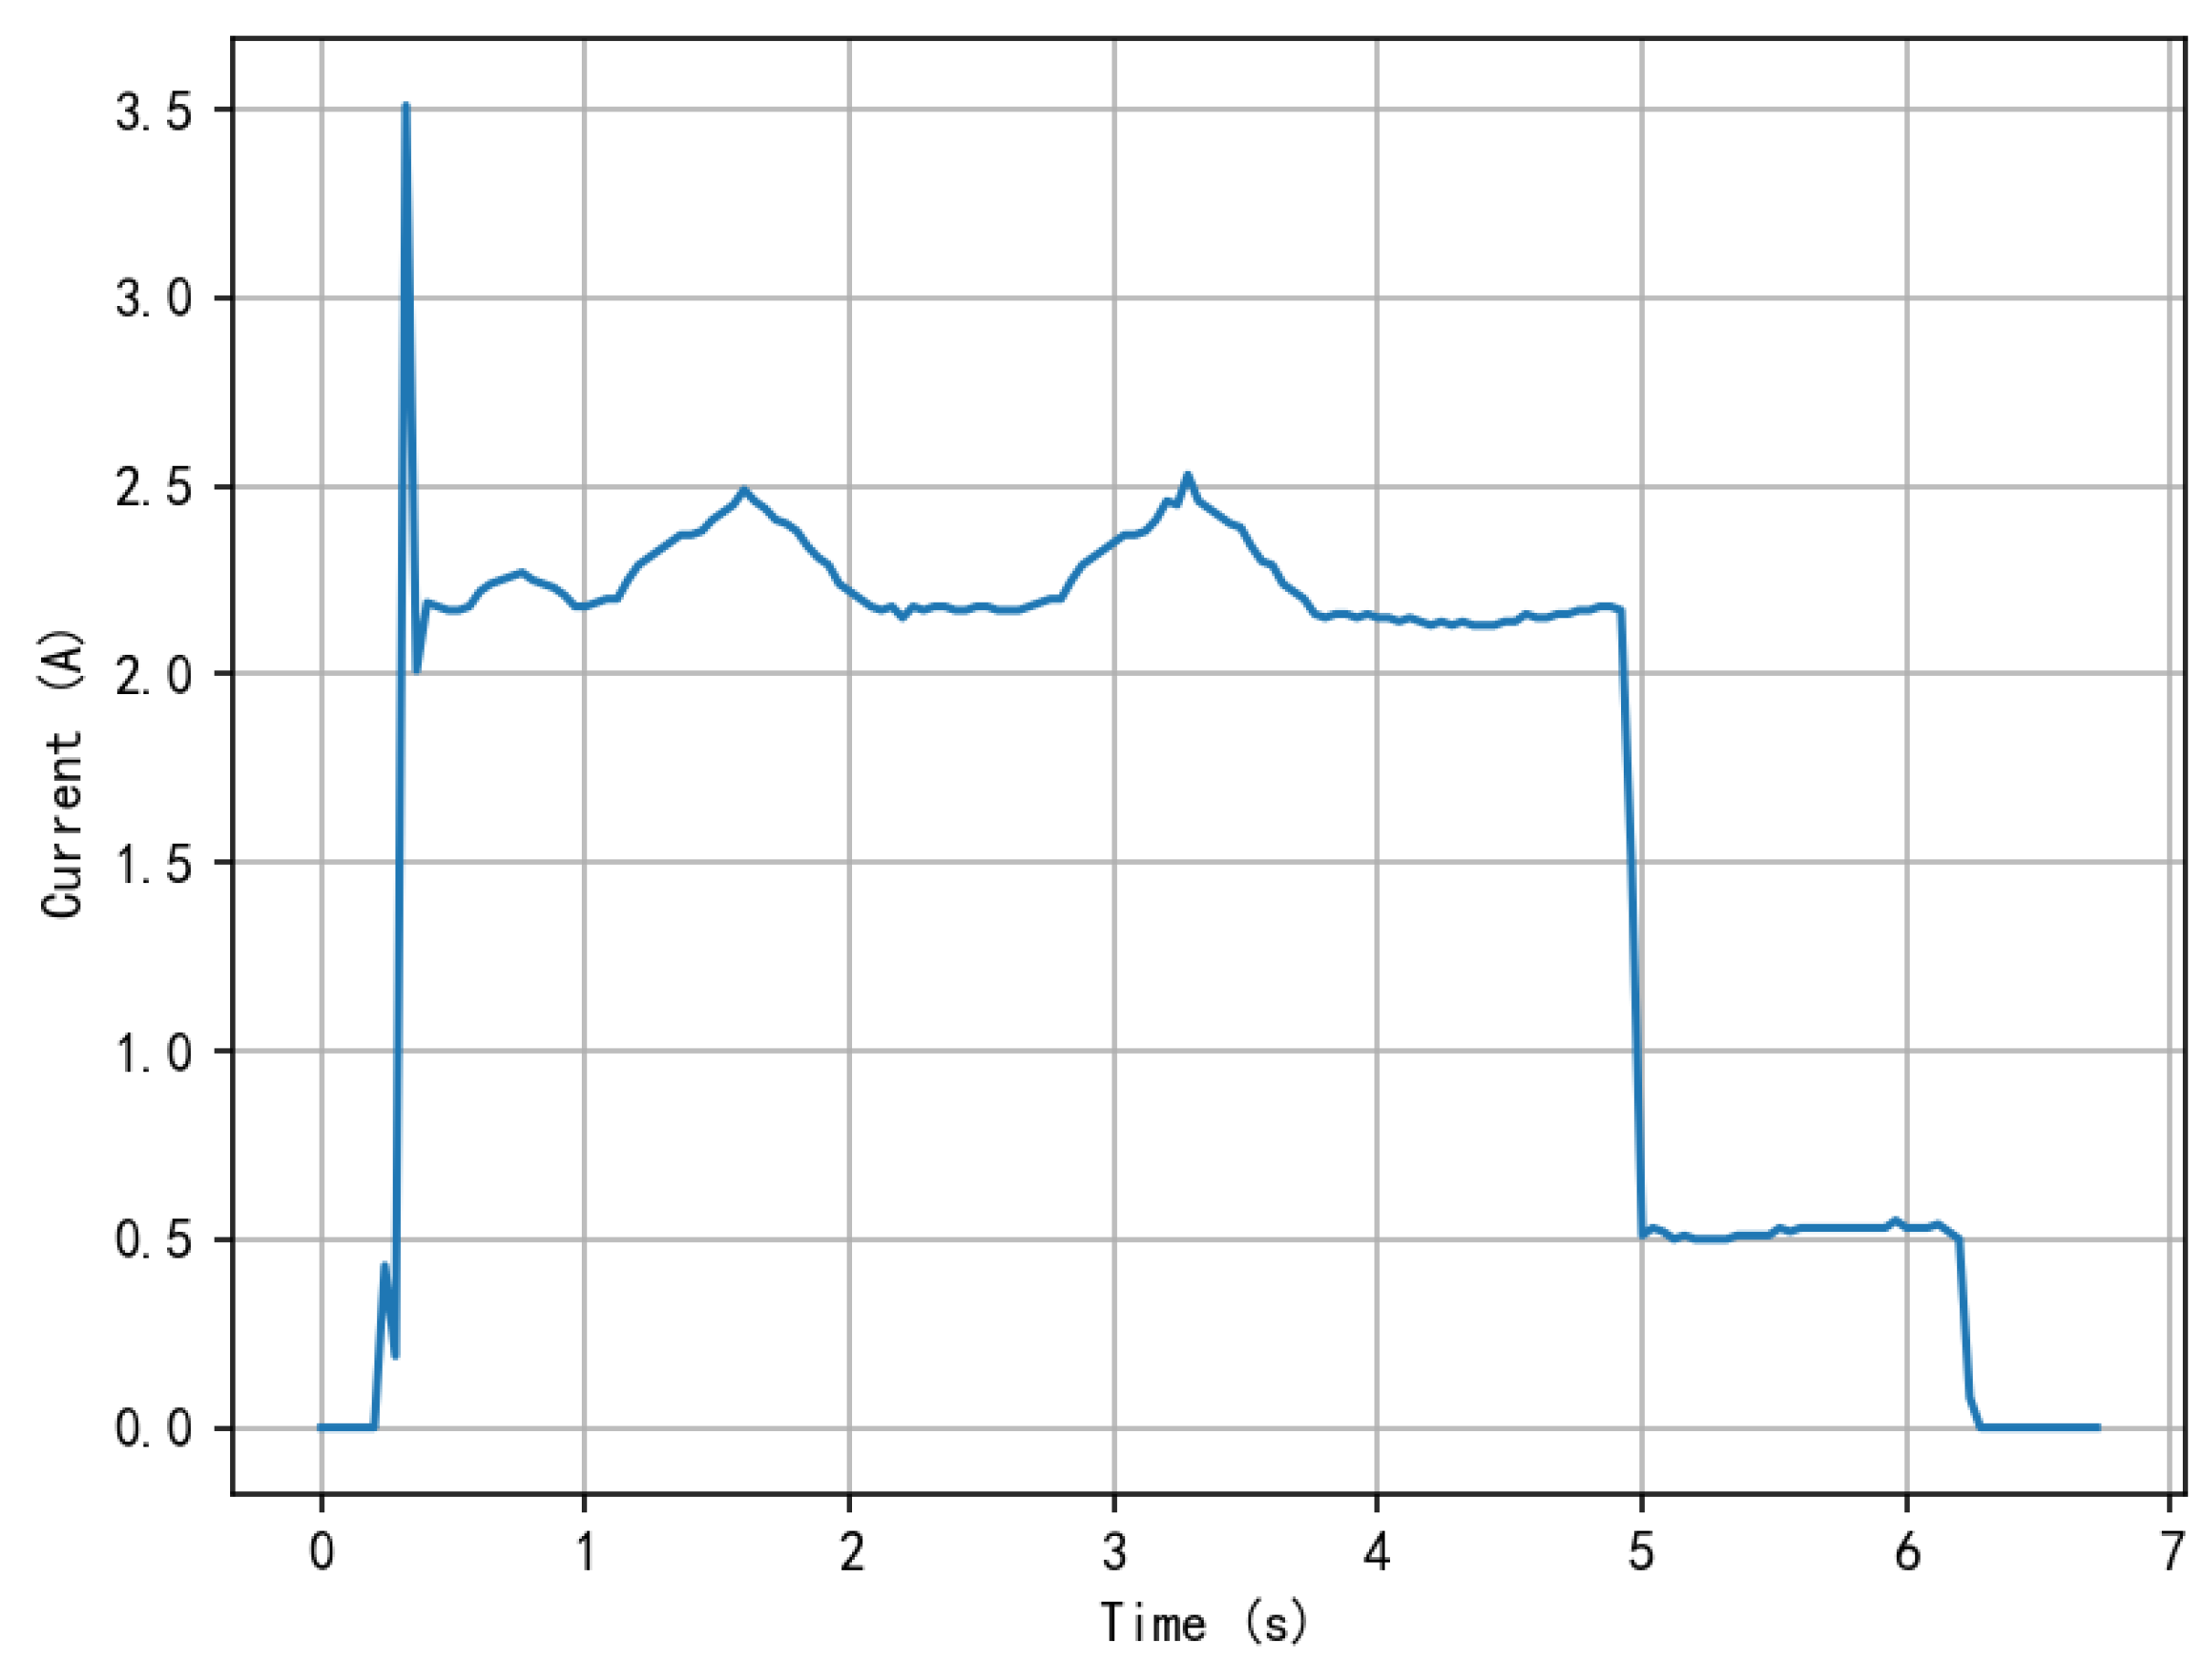
Figure 12.
Abnormal Type 1 to Abnormal Type 4. Indicates the operation current curve.

Figure 13.
Abnormal Type 5 to Abnormal Type 8. Indicates the operation current curve.

Figure 14.
MLP-DQN model flow chart.

Figure 15.
Model accuracy.

Figure 16.
Model loss rate.

Table 1.
Abnormal mode and causes of turnout.
| Types of Exceptions | Abnormal Phenomenon | Cause of Exception |
|---|---|---|
| Figure 1 | normal | none |
| Figure 4 | Delay in the start of the turnout | A relay contact in the switch-on circuit |
| Figure 5 | Switch machine encounters a gap obstruction | Fault or wear in the switch mechanism of the turnout |
| Figure 6 | No coasting phase action current | Open circuit in the outdoor rectifier stack |
| Figure 7 | Surge in coasting phase action current | Diode breakdown short circuit |
| Figure 8 | Switch not interlocked | Inflexible operation of automatic circuit breaker |
| Figure 9 | Switch obstruction | Internal obstruction in the gearbox, foreign object on the pointed rail, etc. |
| Figure 10 | Switch sudden stop after activation | 1DQJ malfunction or open circuit in the starting circuit |
| Figure 11 | Unstable action current | Poor cleaning of the converter or sliding bed |
Table 2.
MLP model parameters.
| Layer | Type | Input Shape | Output Shape | Parameters |
|---|---|---|---|---|
| Input | - | None,169 | None,169 | 0 |
| Hidden1 | Dense | None,169 | None,24 | 4080 |
| Dropout1 | Dropout | - | None,24 | 0 |
| Hidden2 | Dense | - | None,24 | 600 |
| Dropout2 | Dropout | - | None,24 | 0 |
| Output | Dense | None,24 | None,8 | 200 |
Table 3.
Number of action current curves.
| Exception Types | Number of Curves C | (C/T) × 100% | Repair Complexity R |
|---|---|---|---|
| 1 | 581 | 19.40547762 | 6.2 |
| 2 | 90 | 3.006012024 | 6.0 |
| 3 | 1968 | 65.73146293 | 9.1 |
| 4 | 355 | 11.85704743 | 8.5 |
| Total | 2994 | 100% | - |
Table 4.
Hardware environment.
| Equipment | Model and Parameters |
|---|---|
| Processor | Intel Core i7-13700H |
| Memory | 16 GB |
| Hard disk | 1 T SSD |
| GPU model | NVIDIA GeForce RTX 4060 |
| GPU memory | 8 G |
Table 5.
Software environment.
| Environment Construction | |
|---|---|
| Compiled language | Python3.8 |
| Learning framework | TensorFlow2.10.0 |
| Operating system | Windows11 |
Table 6.
Experimental setup.
| Parameters | Numerical (set) |
|---|---|
| Loss function | Categorical cross entropy |
| Optimizer | Adam |
| Learning rate | 0.001 |
| Discount rate | 0.95 |
| Decay rate | 0.995 |
| Epoch | 100 |
| Batch size | 64 |
| State size | 169 |
| Number of neurons in Hidden Layer 1 | 24 |
| Number of neurons in Hidden Layer 2 | 24 |
| Experience replay batch size | 16 |
Table 7.
Partial raw action current data.
| Type | Number | Curve | Y |
|---|---|---|---|
| 84-A | 169 | 0.00,0.00,… | 1 |
| 84-A | 169 | 0.00,0.00,… | 1 |
| 38-A | 169 | 0.00,0.00,… | 1 |
| 74-A | 169 | 0.00,0.00,… | 1 |
| 74-A | 169 | 0.00,0.00,… | 1 |
| 66-A | 169 | 0.00,0.00,… | 1 |
| 66-A | 169 | 0.00,0.00,… | 1 |
| 76-A | 169 | 0.00,0.00,… | 1 |
| 76-A | 169 | 0.00,0.00,… | 1 |
| 20-A | 169 | 0.00,0.00,… | 1 |
| 20-A | 169 | 0.00,0.00,… | 1 |
Table 8.
Partial action current experimental results data values.
| Type | Number | Curve | Predicted_Y |
|---|---|---|---|
| 84-A | 169 | 0.00,0.00,… | 1 |
| 84-A | 169 | 0.00,0.00,… | 1 |
| 38-A | 169 | 0.00,0.00,… | 1 |
| 74-A | 169 | 0.00,0.00,… | 1 |
| 74-A | 169 | 0.00,0.00,… | 1 |
| 66-A | 169 | 0.00,0.00,… | 1 |
| 66-A | 169 | 0.00,0.00,… | 1 |
| 76-A | 169 | 0.00,0.00,… | 1 |
| 76-A | 169 | 0.00,0.00,… | 1 |
| 20-A | 169 | 0.00,0.00,… | 1 |
| 20-A | 169 | 0.00,0.00,… | 1 |
Table 9.
Health degree of partial switch machine.
| Type | Number | Curve | Y | Health |
|---|---|---|---|---|
| 84-A | 169 | 0.00,0.00,… | 1 | 0.8481 |
| 2-A | 169 | 0.00,0.00,… | 1 | 0.3306 |
| 74-A | 169 | 0.00,0.00,… | 1 | 0.5894 |
| 68-A | 169 | 0.00,0.00,… | 2 | 0.1113 |
| 58-A | 169 | 0.00,0.00,… | 2 | 0.1225 |
| 24-A | 169 | 0.00,0.00,… | 2 | 0.0802 |
| 64-A | 169 | 0.00,0.00,… | 3 | 3.5787 |
| 42-A | 169 | 0.00,0.00,… | 3 | 3.2135 |
| 30-A | 169 | 0.00,0.00,… | 3 | 3.7248 |
| 66-A | 169 | 0.00,0.00,… | 4 | 0.6792 |
| 66-A | 169 | 0.00,0.00,… | 4 | 0.3982 |
| 42-A | 169 | 0.00,0.00,… | 4 | 0.4333 |
Table 10.
Average health of the switch machine for the four anomaly types.
| Exception Types | |
|---|---|
| 1 | 0.5516 |
| 2 | 0.1063 |
| 3 | 3.5671 |
| 4 | 0.4395 |
Table 11.
Notations and acronyms correspond to full names.
| Notations and Acronyms | Full Name |
|---|---|
| 1DQJ | Switch Start Relay 1 |
| 2DQJ | Switch Start Relay 2 |
| MLP | Multi-layer perceptron |
| DQN | Deep Q-network |
| AC | Alternating current |
| S700K | Model S700K switch machine |
| ReLU | Rectified linear unit |
Disclaimer/Publisher’s Note: The statements, opinions and data contained in all publications are solely those of the individual author(s) and contributor(s) and not of MDPI and/or the editor(s). MDPI and/or the editor(s) disclaim responsibility for any injury to people or property resulting from any ideas, methods, instructions or products referred to in the content. |
© 2024 by the authors. Licensee MDPI, Basel, Switzerland. This article is an open access article distributed under the terms and conditions of the Creative Commons Attribution (CC BY) license (https://creativecommons.org/licenses/by/4.0/).
Share and Cite
MDPI and ACS Style
Wang, Z.; Sun, D.; Zhou, J.; Guo, K.; Zhang, J.; Kou, X. Health Monitoring Analysis of an Urban Rail Transit Switch Machine. Sustainability 2024, 16, 3527. https://doi.org/10.3390/su16093527
AMA Style
Wang Z, Sun D, Zhou J, Guo K, Zhang J, Kou X. Health Monitoring Analysis of an Urban Rail Transit Switch Machine. Sustainability. 2024; 16(9):3527. https://doi.org/10.3390/su16093527
Chicago/Turabian StyleWang, Zishuo, Di Sun, Jin Zhou, Kaige Guo, Jiaxin Zhang, and Xiangyu Kou. 2024. "Health Monitoring Analysis of an Urban Rail Transit Switch Machine" Sustainability 16, no. 9: 3527. https://doi.org/10.3390/su16093527
Note that from the first issue of 2016, this journal uses article numbers instead of page numbers. See further details here.