
Waste-to-Energy Generation: Complex World Project Analysis


Institute of Economics and Industrial Production Organization, Siberian Branch of the Russian Academy of Sciences, Krasnoyarsk 660036, Russia
*
Author to whom correspondence should be addressed.
Sustainability 2024, 16(9), 3531; https://doi.org/10.3390/su16093531
Submission received: 27 January 2024
/
Revised: 15 April 2024
/
Accepted: 17 April 2024
/
Published: 23 April 2024
Abstract
:Sustainable development and the circular economy mandate efficacious management of waste. The annually increasing volumes of municipal solid waste pose a formidable global challenge. Waste-to-energy conversion, utilizing thermochemical or biochemical technologies, presents a viable solution for mitigating waste disposal concerns. This study conducts a thorough analysis of extant projects to evaluate the economic viability and environmental benefits across various technologies. Employing a self-compiled, unique database, our examination spans enterprises operational from 1980 to 2022, including 37 of the most representative facilities across Europe, North America, and East and Southeast Asia. Economic efficiency is gauged through the levelized cost of electricity generated by these installations, while environmental impacts are assessed based on the statistics on prevented greenhouse gas emissions. The methodology encompasses correlation and techno–economic analyses and expert evaluation. Contrary to conventional wisdom, our findings challenge the ubiquity of scale effects among technologies and the presumed decline in electricity generation costs with newer technologies. However, they corroborate the enhanced environmental benefits of recent technological advancements. The insights derived from this research are poised to inform strategic municipal solid waste management planning in Russia and beyond, offering a foundation for the design of new facilities. The scientific novelty of this work lies in its holistic approach to analyzing the ecological and economic efficiencies of all extant technologies.
1. Introduction
Sustainable development and the circular economy significantly prioritize the green management of municipal solid waste (MSW). Energy waste generation projects make a significant contribution to the global climate agenda and the reduction of greenhouse gas emissions [1]. This commitment to minimizing urban waste is reflected in the Sustainable Development Goals (SDGs), particularly SDG No. 11 and SDG No. 6, which underscore the importance of sustainable waste management, including the generation of energy from waste. While technologies achieving 100% waste recycling have not yet been found, waste-to-energy generation allows countries to preserve biodiversity and land [2].
Energy generation from MSW not only aligns with societal and economic interests but also addresses the global shift towards renewable energy sources, the advancement of a circular economy, and the reduction of carbon footprints of anthropogenic origin. Waste-to-energy (WtE) enterprises play a crucial role in this context, offering solutions that range from clean energy provision to the conversion of waste into fuel or other valuable products, thereby reducing greenhouse gas emissions from waste [3,4].
Conversely, the annual increase in the MSW volume presents numerous challenges that impact quality of life. Forecasts by the World Bank predict a more than 1.5-fold increase in global waste by 2050. This projection underscores the urgency of expanding waste disposal solutions, particularly in areas where landfill expansion is not feasible [5]. Secondly, the increasing number of sanitary landfills are costly to maintain. The desire to quickly solve this problem leads to the short-term and unsafe solution in the form of unauthorized landfills, exacerbating the situation in the long term. It is extremely unsafe or expensive to send decomposing garbage of indeterminate composition from such landfills for incineration, and uncontrolled pollution by landfill filtrate into the atmosphere, soil, surface, and groundwater is irreversible. Low-power waste-to-energy conversion plants are considered a solution to the problem of energy security in isolated areas while problems such as unstable renewable energy generation during peak hours and the economic unattractiveness of small scale of projects remain [6]. The advantages of generating energy from MSW are also being studied by countries dependent on energy imports. The energy projects under consideration are also a popular tool of state institutions in the struggle against various pollution problems [7].
The relevance of the waste-to-energy industry has five dimensions. Firstly, energy from waste is an innovative non-traditional renewable energy source (RES). The inexhaustibility of this RES will be maintained until humanity learns to recycle 100% of waste, which is not predicted soon. Waste-to-energy conversion is a stabilizing and complementary direction for RES mixed generation. For example, hybrid systems have proven themselves to be perfectly paired with solar thermal generation in Germany or with Korean photovoltaic systems. Such projects are being distributed by developed countries within developing countries: for example, Germany is financing a waste-to-energy hybrid project in Ghana. The energy utilization of MSW makes it possible to simultaneously solve several SDGs (SDG 6, SDG 7, SDG 11, and SDG 13) by generating clean energy and sustainably disposing of waste. The most critical global challenge that waste-to-energy solves is the disposal of growing MSW volumes. This is an urgent and very dangerous problem both for Russia and for the whole world. Functioning MSW landfills, planned on average approximately 50 years ago, cannot cope with modern cities’ waste and fast-growing urbanization [8]. Additionally, the financial model of waste-to-energy projects allows making a profit not only from the energy sale, but also from the MSW disposal services. A recognized successful commercial example is the case of Sweden.
In this regard, the WtE sector is pivotal across all five dimensions: as a novel and sustainable renewable energy source (RES); as a stabilizing force in RES mixed generation; as a means of addressing several SDGs through clean energy production and sustainable waste disposal; as a means of managing the escalating volumes of MSW; and through its financial model, which not only facilitates energy sales but also offers MSW disposal services. Notably, the economic viability of WtE projects often relies on government subsidies due to the high investment risks and operational costs.
The significance of this study lies in its response to the high societal relevance of WtE. Increasingly, developing countries view waste processing plants as essential components of waste management infrastructure and energy strategies. This necessitates an integrated approach to evaluating the economic rationality and environmental impact of MSW energy utilization technologies. Despite the efforts to study the efficiency of existing facilities and the potential of new projects, the absence of a comprehensive database has hindered a statistically significant analysis of WtE technologies.
This study aims to bridge this academic gap by compiling a database of WtE enterprises operating worldwide from 1980 to 2022. Through this endeavor, we seek to assess the environmental and economic efficiency of existing technologies for MSW energy utilization. The research hypotheses guiding this study are as follows:
Hypothesis 1.
Economies of scale characterize all technologies for MSW energy utilization.
Hypothesis 2.
WtE projects contribute to the reduction of electricity production costs.
Hypothesis 3.
Modern technologies in enterprises significantly mitigate greenhouse gas emissions from MSW.
This work draws upon a diverse array of sources, including peer-reviewed journals, monographs, scientific papers, and reports from NGOs, governments, companies, and universities, to provide a critical literature review at each analysis stage.
To fulfill the objectives of this study, we employ a range of scientific, economic, and management science methodologies, including analogy, correlation, technical and economic analysis, levelized cost of electricity (LCOE), economic efficiency assessment, synthesis, comparison, economic interpretation, and expert assessments.
2. Materials and Methods
The existing options for comparing waste-to-energy technologies are based on environmental and economic assessments.
2.1. Establishing the Dataset Frame
Popular environmental tools map actual emissions with those allowed by the regulations of a certain state, comparing the levels of pollution from plants with each other [9]. The costs of a separate CO2 capture system and the costs of high-quality filtration provided by the plant are also compared with the proven benefits of the latter based on a multifactorial analysis [10]. A more interesting and applicable assessment for plants that have not yet been put into operation is the life cycle assessment (LCA). This allows for an objective comparison of such study results, which were implemented by Russian researchers for more than 146 plants in 2022 [11].
The economic feasibility of WtE projects garners significant debate within the academic community, with methodologies varying and sometimes presenting contradictory results. Modern WtE studies focus on calculating different profitability metrics, while others consider capital and/or operating expenses, utilizing net present value (NPV) calculations to determine a project’s break-even point (BEP) and internal rate of return (IRR). In Saudi Arabia, financial indicators for WtE projects based on gasification and anaerobic digestion technologies were explored, albeit with limitations due to the lack of empirical data [12].
The US Department of Energy presented an estimated LCOE for landfill gas production and stressed the need for a detailed calculation [13]. At the same time, the economics of MSW energy generation projects allows two stages: the sale of energy and the collection of waste disposal fees. Therefore, the economic efficiency of projects is higher if we consider more than just the LCOE, which emphasizes the competitiveness of the energy recycling industries in Finland, Sweden, and Japan [14]; however, due to the large difference in the terms of payment for MSW disposal, this paper considers only the first economic component.
The most popular types of analysis were combined by researchers from the USA and Israel [15]. For the state of New York, the authors modeled a bioenergy strategy with a variant of hydrothermal liquefaction and subsequent anaerobic digestion of waste. The spatial analysis was implemented based on data on the geographical location and infrastructure of dairy farms in the state—the type of waste used in the authors’ analysis. The kinetic model made it possible to predict the volumes of potential raw materials (methane CH4) for energy utilization.
Indicative of the current topic is the technical and economic analysis conducted, considering the results sensitivity: calculation of transportation costs, capital costs of reactors, operating costs, salaries, maintenance enterprises costs, reaction product disposal, utilities (operating and maintenance costs, ).
The addition of and made it possible to estimate the project’s in each year of implementation using Equation (1):
Thus, NPV, BEP, and IRR of the project are obtained after discounting the net cash flows, estimating capital expenditures before its launch, accepting a discount rate of 4%, a project duration equal to 40 years, and a tax rate equal to 20%. Finally, the indicator determined the LCOE for the project in the amount of US$ 0.29 per kWh, which is higher than the wholesale price of electricity in the state, and showed the unprofitability of the project in the baseline scenario using Equation (2):
Despite the versatility of evaluating a large-scale project, the results are relevant only for one American state and a single pure raw material type, and the method of forecasting cash flows and the institutional environment can radically change the rationality for launching a project. The environmental effect is not evaluated at all in the work. Attempts to objectively combine economic and environmental analyses have led other American researchers to bring the content of regulatory policy in each unique case to the fore when assessing the energy efficiency of a project [16].
Thus, regarding further analysis of NPV and LCOE indicators, a choice was made in favor of the latter. Firstly, NPV is more appropriate for use with single case studies rather than analyzing a large sample. Secondly, NPV is illustrative for potential projects, but not already launched ones. Thirdly, LCOE is recognized as a qualitative industry marker of the project’s economic efficiency in general and the analysis of RES, in particular, although it considers the marginal, but not the actual generation capacity. Regarding accounting for the environmental impact, we accept a percentage estimate of the effect on greenhouse gas emissions from the company’s activities compared to the scenario of an uncontrolled landfill as a relevant metric for comparing technologies [17].
Thus, the approaches for technology multifactorial comparative analysis for the MSW energy utilization are diverse and are developing in parallel with the improvement of the technologies themselves and the movement of the renewable energy market. The choice of one or another way to evaluate technologies depends on the individual study goals.
2.2. Collecting the Data
To facilitate a comprehensive comparative analysis of existing waste-to-energy (WtE) technologies, a representative sample of enterprises operating worldwide was amassed. The foundational dataset, a registry compiled by Dutch scientist Cor Coenrady in 2020, lists the names and addresses of waste recycling plants, serving as a basis for subsequent information enrichment [18]. We chose the Coenrady international registry because it is the most representative international database, which is currently the most informative and reliable of the possible and accessible open information sources.
Each enterprise selected for analysis is characterized by a series of indicators (Appendix A), guiding the collection of detailed information and the calculation of the levelized cost of electricity (LCOE) for each plant (Appendix B). The dataset spans a broad geographic and technological scope, including average data for 110 French, several Chinese and German, and 7 Canadian facilities, totaling at least 160 enterprises [19]. To ensure the uniqueness of the model’s entries, 37 of the most representative facilities’ distinct observations were identified. Monetary values were standardized to US dollars using the international exchange rate as of 7 April 2023.
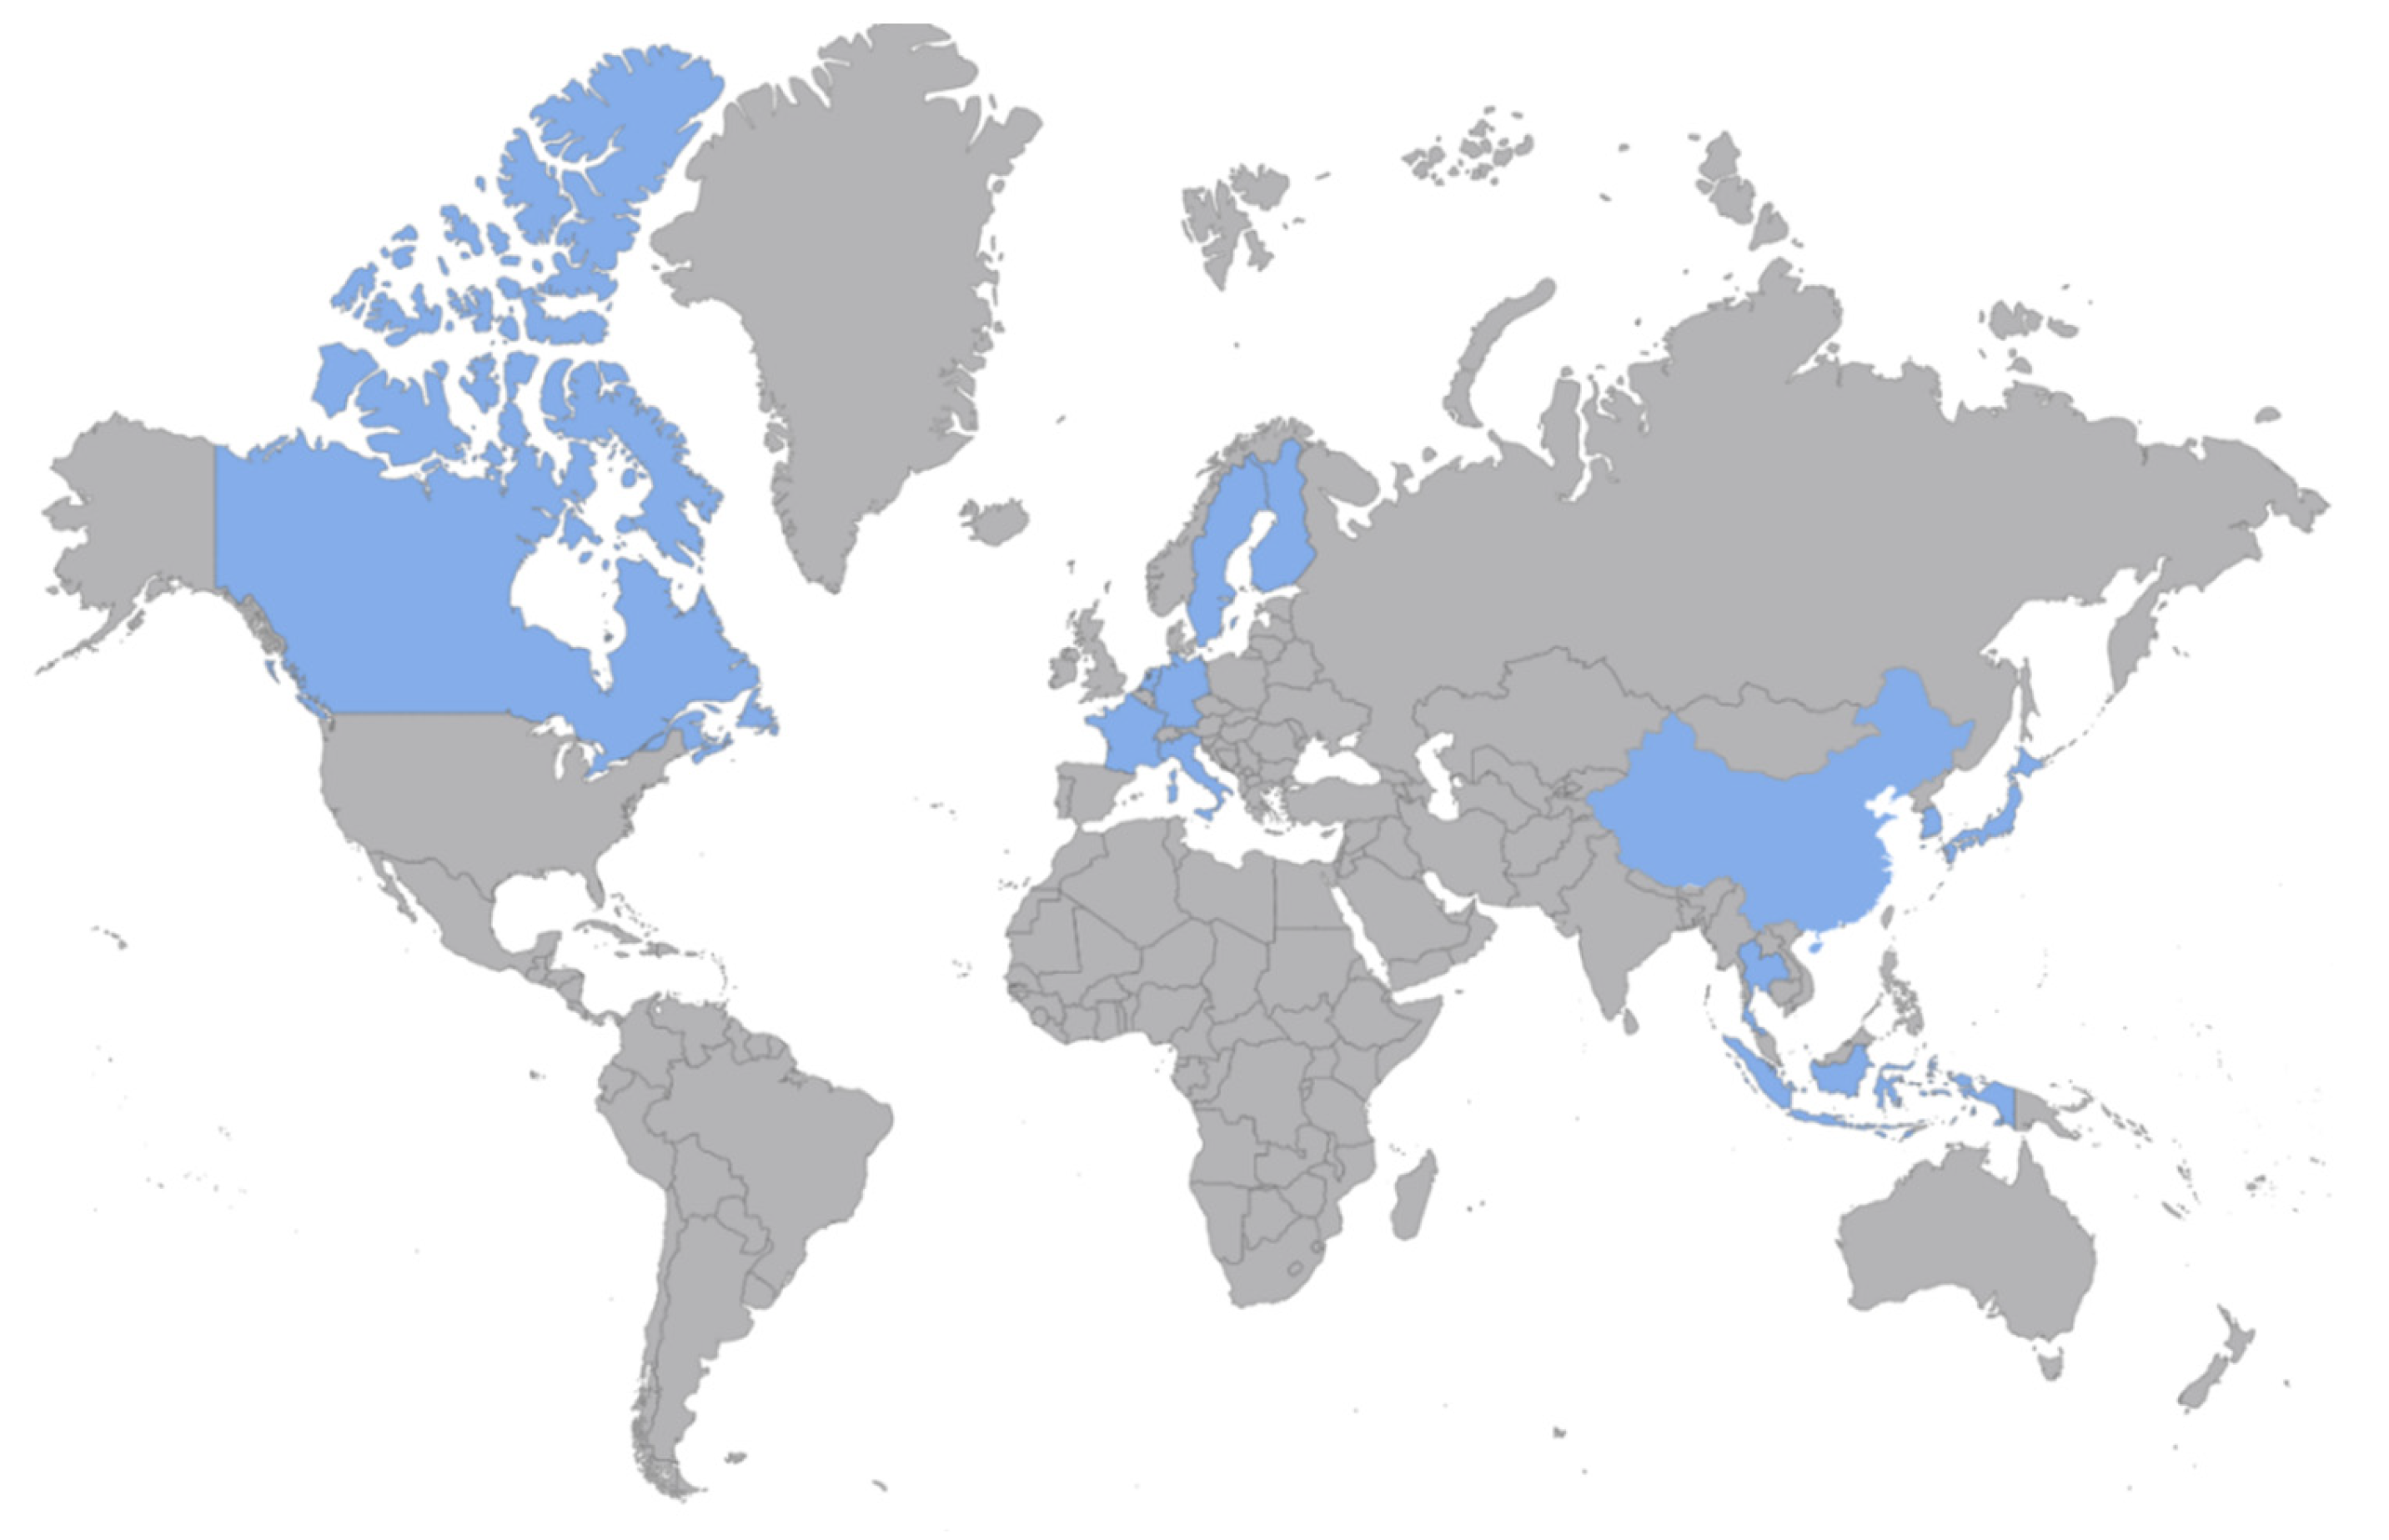
Thus, the sample for the analysis of existing waste energy generation projects includes 37 plants from Canada, China, Finland, France, Germany, Indonesia, Italy, Japan, the Netherlands, Sweden, Republic of Korea, and Thailand (Figure 1). In the final stage of the study, we focused on 37 research objects, as we were guided by the principles of relevance, reliability, and completeness of data. The parameters for the implementation of a technology’s comparative assessment are capacity, electricity output, annual expenses, LCOE, and greenhouse gas emissions reduction.
2.3. Preparing the Data
To continue modeling in the IBM SPSS (2024) software package, we consider descriptive statistics of variables in nominal and relative scales for a set of waste treatment enterprises and identify their features in advance (Appendix C). There are no technology shifts in the sample since the data were originally collected by the authors in accordance with the goals of the current analysis. Japan and South Korea prevail among the countries, as they are the drivers of the modern enterprise’s construction with various technologies. Relatively high kurtosis and asymmetry coefficients are noticeable in modulus—signs of anomalous distributions of capacity, annual electricity output, and annual expenses.
Let us use the “Three Sigma” Rule from Equation (3) to search for critical outliers, that is, we define an acceptable interval for a number (Appendix D):
where is the average value of the series and
is the standard deviation of the series .
In terms of capacity, the Indonesian plant has a noticeably lower throughput relative to other observations (only 21.9 tons), seven plants have critically high capacities, but the technology types in these outliers are different, which will not affect the comparative analysis of the technologies.
With the annual electricity output variable, the only plant from Sweden with a value exceeding the permissible upper bound is identified; however, the plant’s technology is mass rotary kiln combustion, 5 lines operate, the throughput is high, and so this outlier is also not removed from the sample.
The only potential outlier for annual expenses is an Italian plant with high costs. However, its LCOE level falls within the acceptable range, so the observation is saved for subsequent analysis. The Japanese plant with plasma gasification technology is the only candidate for a critically high LCOE; however, the number of MSW recycling enterprises operating with this technology in the world is extremely small, and the costs of their construction and maintenance are high, which allows for this LCOE value.
2.4. Conducting Regression Analysis
Due to the presence of non-zero asymmetry and kurtosis coefficients in quantitative variables, we construct distribution histograms and confirm the above features of the sample by graphical analysis (Appendix E). Sturges’ Equation (4) indicates the optimal column number:
where is the observation number in group [20].
Let us consider the impact, strength, and significance of the variables’ influence in the sample by calculating the Pearson correlation coefficients, since the distributions tend to be normal with the above restrictions (Appendix F).
We note a significant moderate correlation between capacity and annual electricity output, which confirms for all technologies the intuitively assumed increase in electricity generation with an increase in the incoming MSW volume. A noticeable correlation exists between annual expenses and annual electricity output. That is, regardless of the technology, with the cost increase of a waste treatment plant, electricity generation increases. However, there is no significant connection between annual expenses and capacity, like many others, which confirms the rationality of continuing the research in terms of technology.
Let us create 7 dummy variables (TechCode_1…TechCode_7) based on technology codes to consider regression analysis (Appendix G). Significant correlations with GHG reduction were found for plasma gasification and pyrolysis. The conclusions of theoretical reviews on the plasma gasification leadership in the possibilities of reducing greenhouse gases were proved [21]. Pyrolysis is losing out to other technologies in reducing the carbon footprint. At the same time, the other significant correlations’ absence, the lack of evidence of the regression model’s practical applicability, as well as the 37 observations’ insufficiency to construct a regression with dummy variables (should be at least 7 times higher than the potential number of regressors in the amount of 11 units) provides justification for the sample integral analysis of each technology separately.
3. Results and Discussion: Conducting LCOE Analysis
Upon categorizing the observations into one of the seven technology codes, we proceeded to test the hypotheses posited in the introduction. To evaluate Hypothesis No. 1, simple pairwise scattering diagrams of capacity versus LCOE, labeled according to the technology codes, were constructed (Appendix H). Contrary to expectations, an inverse relationship between LCOE and increased capacity was not universally observed across all waste-to-energy (WtE) technologies.
For grate and fluidized bed incineration technologies, an increase in the enterprise’s capacity demonstrated a scale effect opposite to the anticipated effect. This phenomenon may be attributed to the optimization challenges of facilities established in the 20th century, which were only recognized as environmentally permissible in Germany as of 2005 [22].
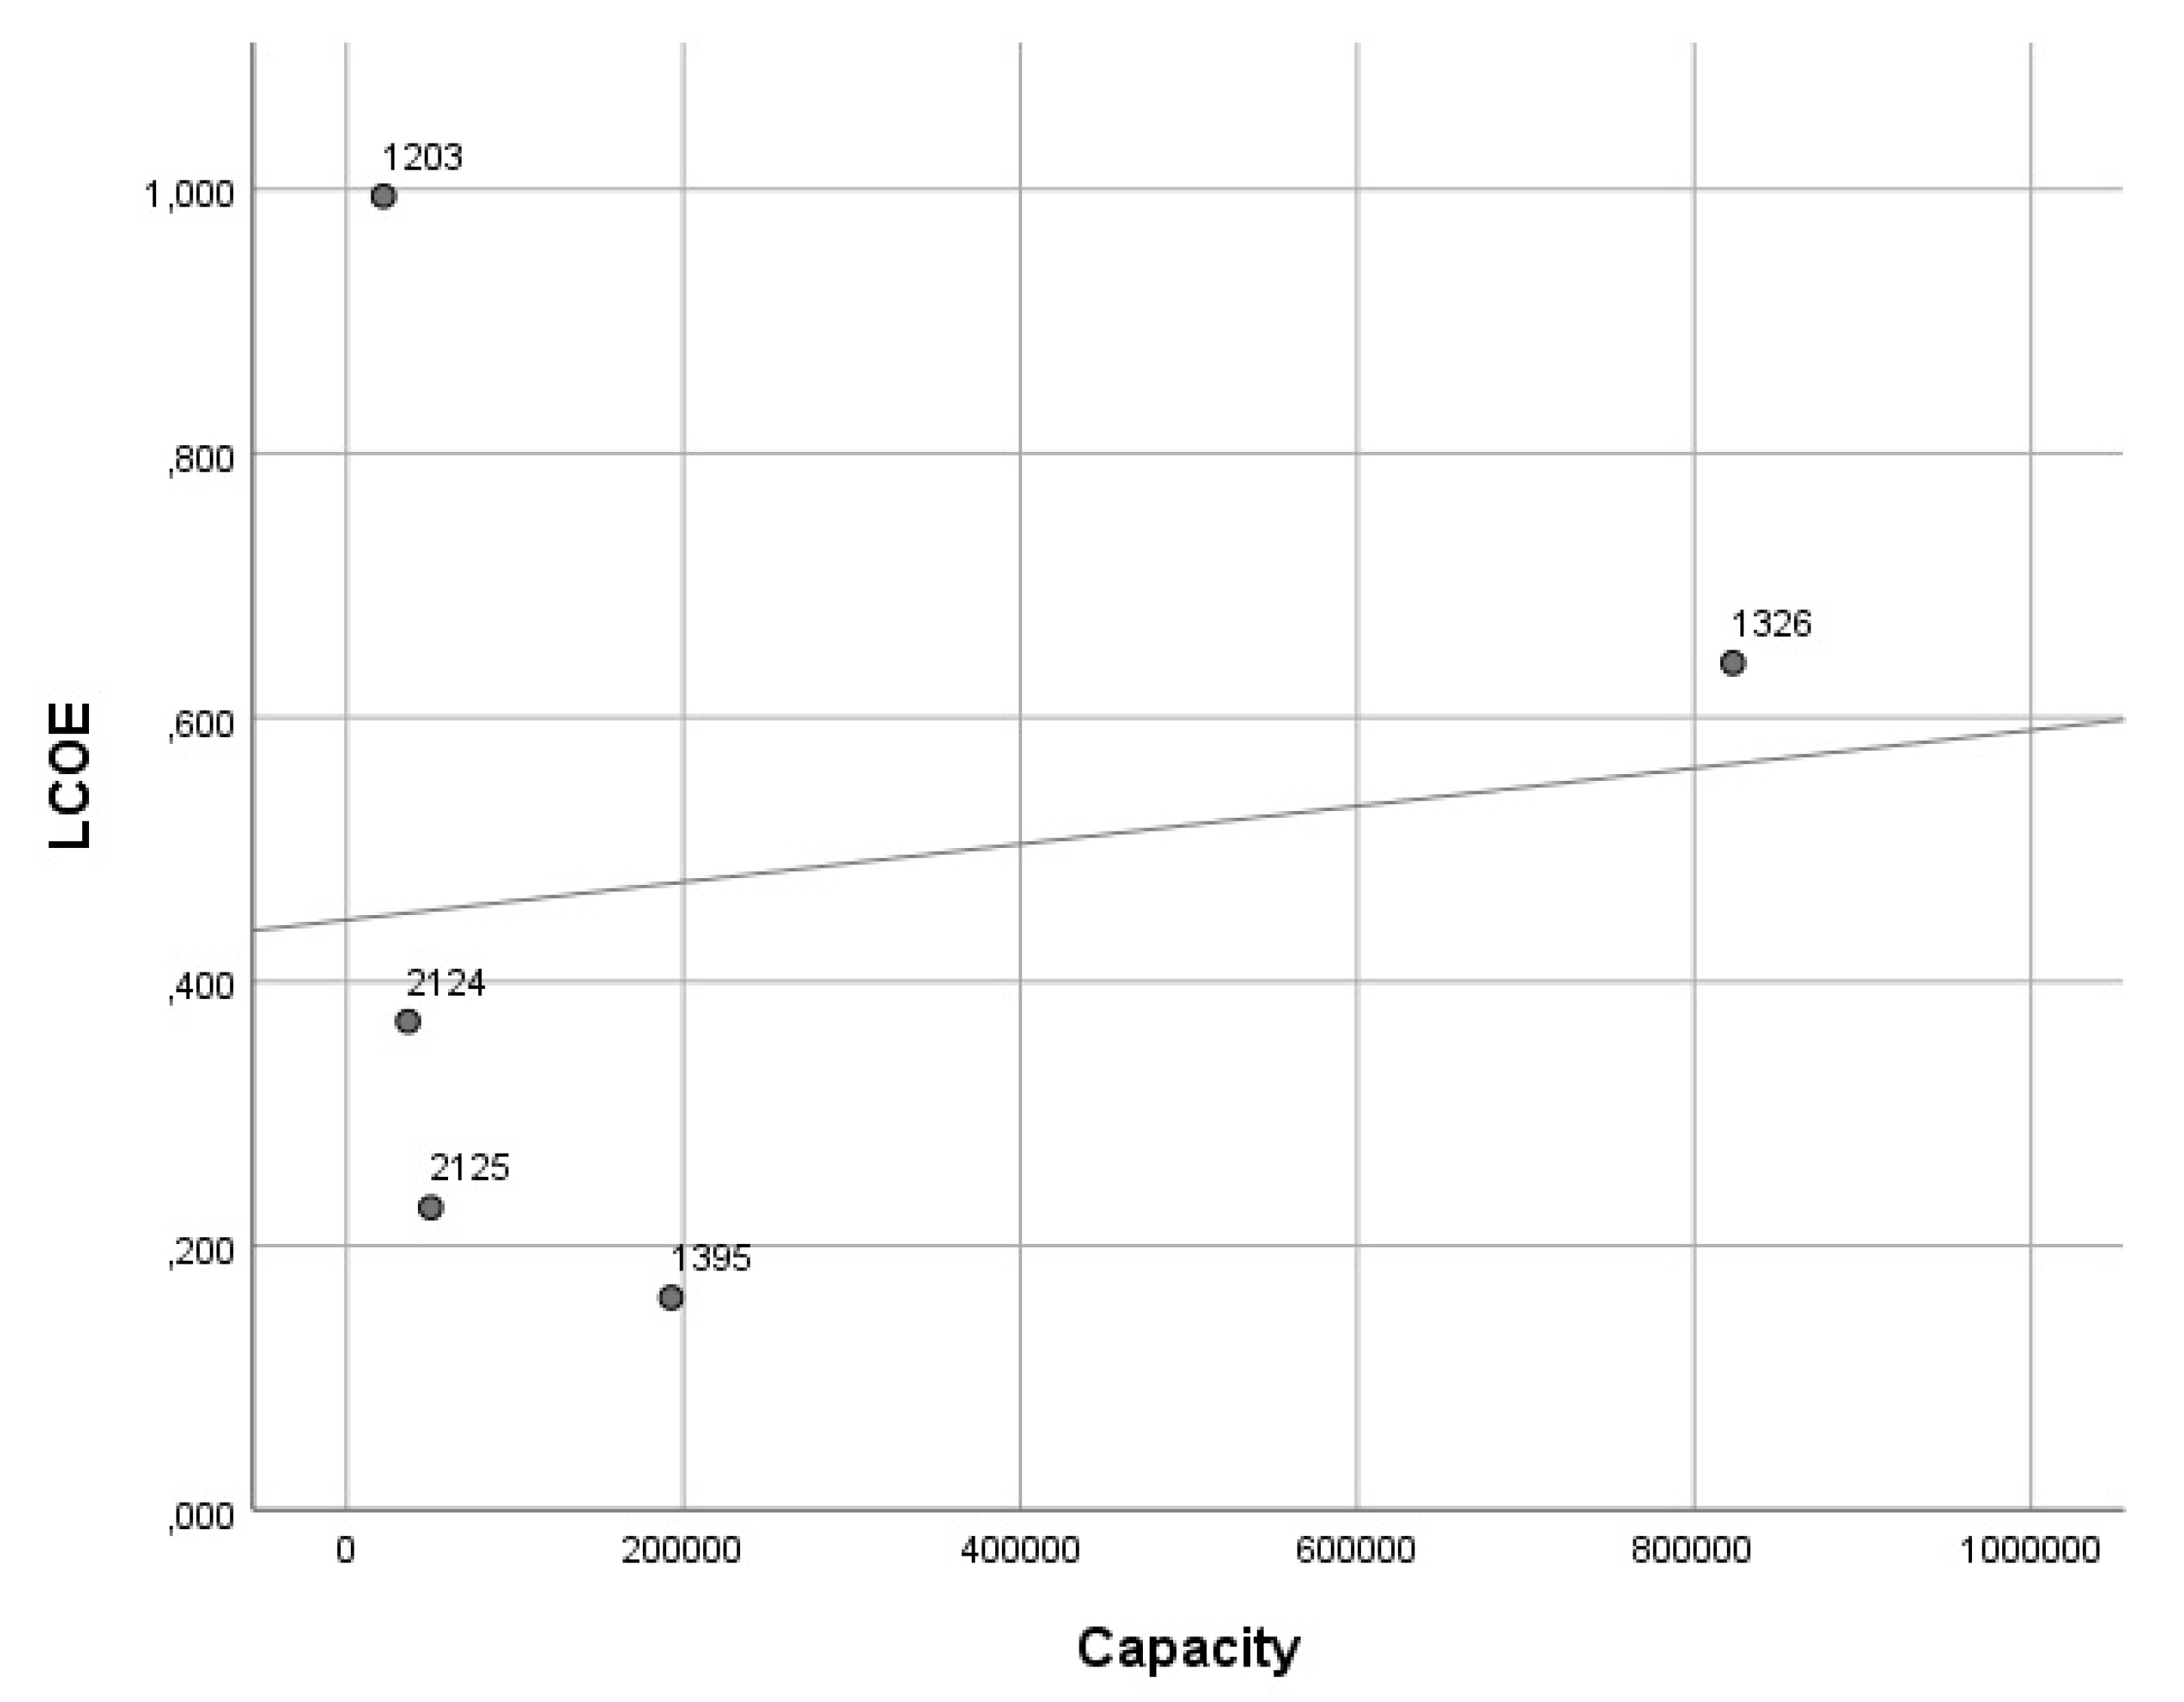
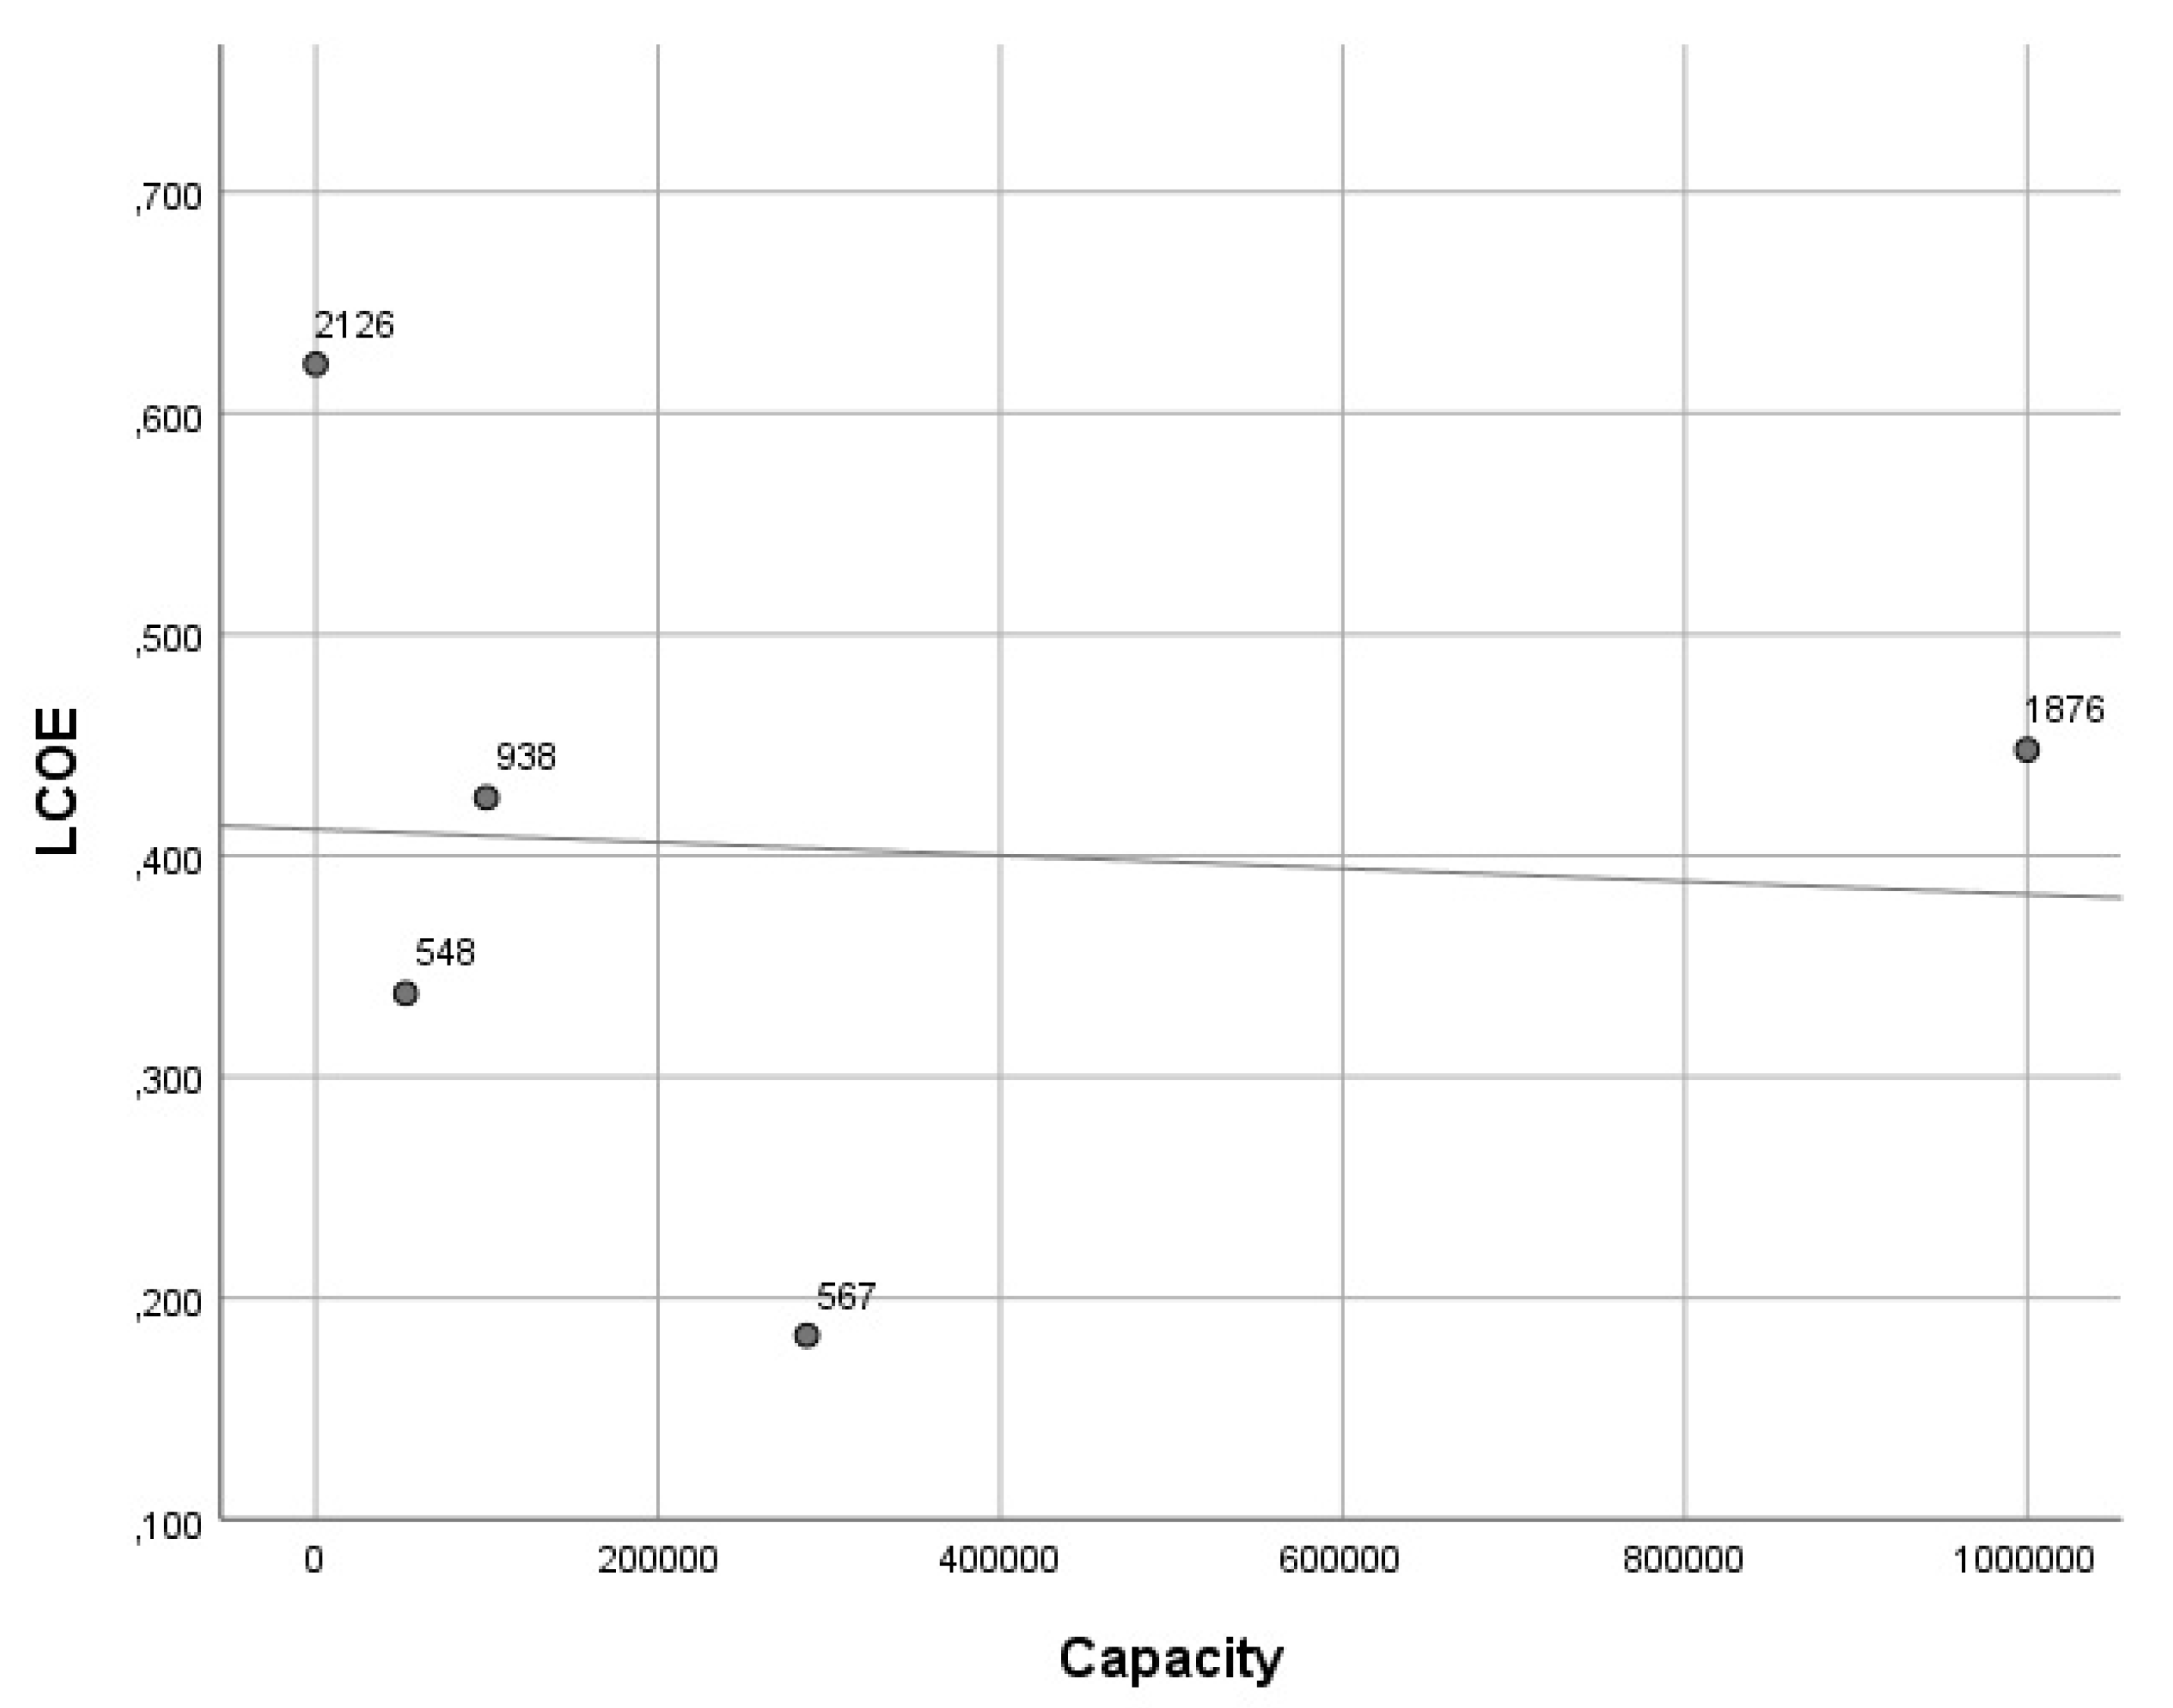
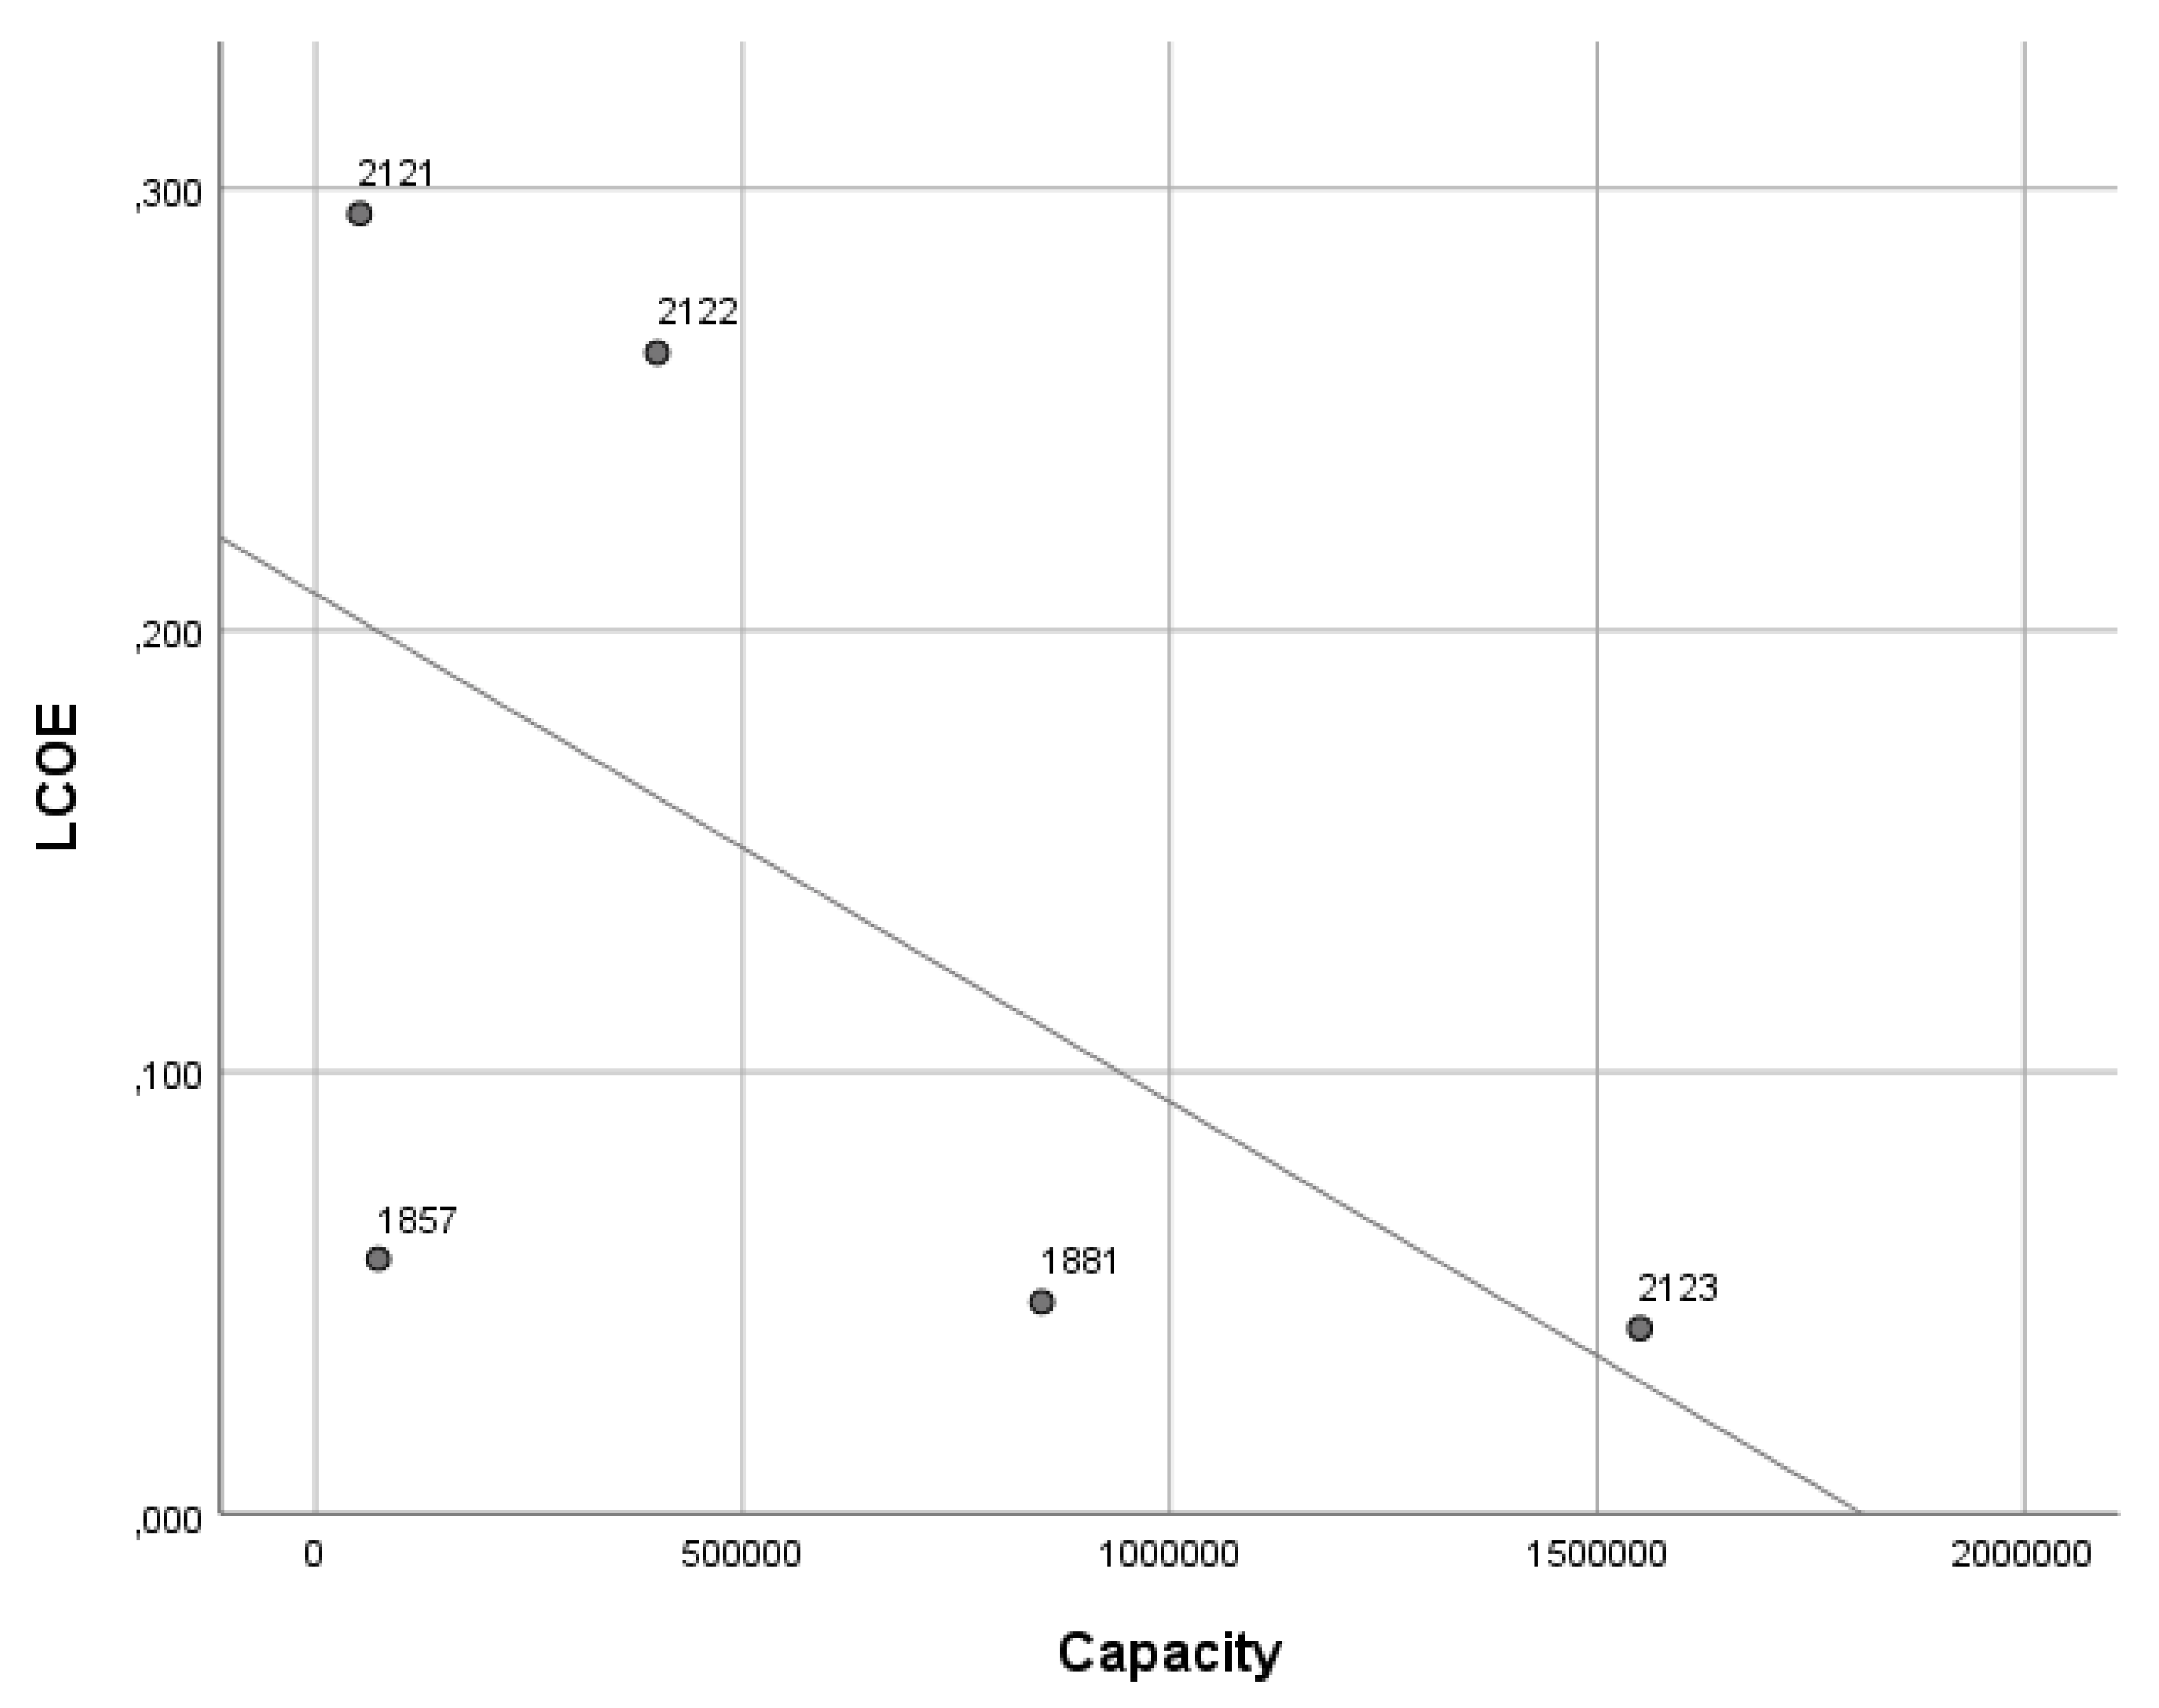
However, for rotary kiln incineration and anaerobic digestion, there is a predictable reduction in costs per unit of generated electricity with production consolidation. Every additional 100,000 tons of MSW reduces the LCOE by approximately 0.0275 and 0.0113 USD per kWh, respectively. Conversely, for rotary kiln incineration and anaerobic digestion, a cost reduction per unit of generated electricity was observed with increased production consolidation, indicating that every additional 100,000 tons of MSW processed could reduce the LCOE by approximately 0.0275 and 0.0113 USD per kWh. The data for gasification, plasma gasification, and pyrolysis did not yield conclusive evidence regarding the effect of scale, suggesting that the potential for production scaling is technologically constrained from the outset. Therefore, Hypothesis No. 1 is not supported by the data analysis.
To assess Hypotheses No. 2 and No. 3, we analyzed descriptive statistics within groups and illustrated the findings graphically for clarity (Appendix I). The anticipated decrease in LCOE for more modern technologies was not validated; traditional grate incineration emerged as more cost effective at 0.253 USD per kWh compared to newer technologies, despite the aging infrastructures at such facilities [23].
Rotary kiln incineration and anaerobic digestion were identified as the most cost-effective methods for MSW electricity production, at 0.135 and 0.141 USD per kWh, respectively. This observation aligns with expectations, as anaerobic digestion has evolved alongside other technologies. The cost advantage of anaerobic digestion, potentially ten times more profitable than MSW combustion, was previously highlighted in literature reviews [24]. Furthermore, ongoing research in Germany into biochemical technology (Dendro liquid energy) suggests the possibility of achieving costs four times lower than those of anaerobic digestion.
The remaining technologies exhibited LCOE values just below 0.4 USD per kWh, with plasma gasification slightly less profitable at 0.479 USD per kWh, corroborating the profitability norms within technology groups reported by the Asian Development Bank in 2020 [25]. Consequently, Hypothesis No. 2 is decisively refuted.
Considering the practical implications of the calculated LCOE, it is crucial to compare these figures against the average annual wholesale electricity prices in the relevant countries [26,27,28]. The analysis revealed that the LCOE values for fluidized bed incineration, conventional and plasma gasification, and pyrolysis technologies are not competitive, as they surpass the wholesale prices in the studied countries (Appendix J). Grate incineration offers economic advantages are exclusive to Italy, whereas rotary kiln incineration and anaerobic digestion present cost benefits in the Netherlands, Germany, and Japan. This underscores the necessity of expanding LCOE analysis beyond the scale effect to include learning effects, overall electric power system costs, and fluctuations in electricity demand, which were not addressed in this study. Government subsidies and additional revenue streams (e.g., thermal energy generation, ash and slag waste sales, and waste disposal fees) also play crucial roles in the economic viability of WtE projects, suggesting the exploration of alternative economic efficiency metrics beyond LCOE work [29]. It is assumed that additional sources of income can have high impacts on the project’s profitability for different consumer types: thermal energy generation, ash and slag waste sales, waste disposal fees [30].
Lastly, the correlation between modern technology and increased GHG reduction was largely confirmed, with each subsequent technology code indicating an approximate 2% improvement in environmental performance. Plasma gasification stood out as the most capital-intensive yet environmentally beneficial method, reducing the waste greenhouse effect by nearly 80% [31]. Pyrolysis, however, lagged significantly, aligning with earlier correlation analysis findings and case studies highlighting its competitiveness [32]. Thus, Hypothesis No. 3 is confirmed by the results of the implemented analysis. Plasma gasification remains the most economically demanding yet environmentally friendly option, whereas rotary kiln incineration and anaerobic digestion offer a balance between greenhouse gas reduction and cost-effective electricity production from MSW.
4. Conclusions
This study set out to assess the environmental and economic efficiency of existing technologies for the energy utilization of municipal solid waste (MSW), analyzing data from enterprises operational between 1980 and 2022. Our findings led to several conclusions:
- Hypothesis No. 1, suggesting a universal scale effect across all technologies, is refuted. Scale economies were observed solely in rotary kiln incineration and anaerobic digestion, and did not extend to other studied technologies.
- Hypothesis No. 2 is strictly rejected; more modern technologies often incur higher levelized costs of electricity (LCOE), contrary to initial expectations.
- Hypothesis No. 3 is confirmed, indicating an increase in greenhouse gas reduction efficiency with the adoption of more advanced technological solutions.
Future research directions include expanding the dataset of operating enterprises and incorporating new economic criteria to evaluate plant effectiveness beyond electricity sales given the prevalence of alternative income streams. Additionally, the pivotal role of government support measures in the viability of WtE projects warrants further examination, considering the widespread nature of industry subsidies.
The applicability of our findings spans five key areas:
- Waste-to-energy industry development: highlighting the potential for growth until technologies capable of 100% waste recycling are realized.
- Integration with renewable energy: enhancing energy production stability from sustainable sources through the integration of MSW energy utilization.
- Contribution to sustainable development goals (SDGs): addressing multiple SDGs, thus advancing the global agenda for a prosperous society.
- Addressing MSW volume growth: offering solutions to the escalating problem of MSW management and disposal.
- Financial model innovation: evolving the financial models of WtE projects to generate revenue not only from energy sales but also from waste disposal services.
The practical significance of this research is deemed high, providing valuable insights for developing municipal strategies worldwide in terms of MSW management. Furthermore, the findings have implications for the construction of new facilities, underlining the study’s contribution to both the scientific novelty and the integrated approach to analyzing ecological and economic efficiency across all existing WtE technologies.
The authors plan to continue studying the issues of efficiency and environmental friendliness of energy waste disposal in their future research, especially in the context of smart and sustainable cities.
Author Contributions
Conceptualization, N.V. and E.M.; methodology, N.V. and E.M.; data curation, N.V. and E.M.; writing—original draft preparation, N.V. and E.M.; writing—review and editing, N.V. and E.M.; visualization, N.V. and E.M. All authors have read and agreed to the published version of the manuscript.
Funding
The article was prepared according to the plan of research works of IEIE SB RAS, project “Driving forces and mechanisms of development of cooperation and integration processes in the Siberian economy”, No. 121040100279-5.
Institutional Review Board Statement
Not applicable.
Informed Consent Statement
Not applicable.
Data Availability Statement
Data is contained within the article.
Conflicts of Interest
The authors declare no conflicts of interest. The funders had no role in the design of the study; in the collection, analyses, or interpretation of data; in the writing of the manuscript; or in the decision to publish the results.
Appendix A. Analyzed Parameters of the Waste Treatment Plants
| The Essence and Description of the Indicator | Variable Name | Measurement Scale |
| The identification number of the waste treatment factory: matches the number of the Coenrady register or is added under the following ordinal value | Code | Nominal scale; qualitative variable |
| The waste treatment plant country of location in the two-letter country code format in accordance with the international standard ISO 3166-1 | Country | Nominal scale; qualitative variable |
| The technology type of the waste treatment plant. Incineration moving grate, or incineration fluidized bed, or incineration rotary kiln, or gasification, or plasma gasification, or pyrolisys, or anaerobic digestion | Technology | Nominal scale; qualitative variable |
| Coded type of waste treatment plant technology. Code 1—Incineration moving grate. 2—Incineration fluidized bed. 3—Incineration rotary kiln. 4—Gasification. 5—Plasma Gasification. 6—Pyrolisys. 7—Anaerobic digestion | Technology Code | Nominal scale; qualitative variable |
| The annual capacity of the waste treatment plant in tons of MSW | Capacity | Relative scale; quantitative variable |
| Annual electricity output by a waste treatment plant in GWh | Annual electricity output | Relative scale; quantitative variable |
| Annual expenses as the sum of operating expenses, maintenance costs, other running expenses, employee salaries, depreciation charges in millions of US dollars | Annual expenses | Relative scale; quantitative variable |
| The levelized cost of electricity as a result of dividing annual expenses by annual electricity output in US dollars per 1 kWh | LCOE | Relative scale; quantitative variable |
| Reduction of greenhouse gas emissions in % as a result of the waste treatment plant operation in comparison with the spontaneous MSW disposal option | GHG Reduction | Relative scale; quantitative variable |
Source: Compiled by the authors.
Appendix B. Functioning Waste Treatment Plants Sample
| Code | Country | Technology Code | Capacity | Annual Electricity Output | Annual Expenses | LCOE | GHG Reduction |
| - | - | - | tons per year | GWh | million $ | $/kWh | % |
| 548 | DE | 6 | 52,560 | 6.66 | 2.25 | 0.338 | 20.00 |
| 562 | DE | 3 | 320,000 | 658.13 | 56.68 | 0.086 | 50.00 |
| 567 | DE | 6 | 287,000 | 80.00 | 14.65 | 0.183 | 21.37 |
| 670 | FI | 4 | 200,236 | 91.00 | 16.29 | 0.179 | 55.00 |
| 678 | FI | 4 | 370,000 | 1210.00 | 292.69 | 0.242 | 20.00 |
| 916 | IT | 1 | 540,000 | 351.96 | 90.85 | 0.258 | 25.98 |
| 938 | IT | 6 | 99,730 | 941.00 | 401.00 | 0.426 | 10.45 |
| 1203 | JP | 5 | 21,900 | 21.90 | 21.78 | 0.995 | 80.00 |
| 1265 | JP | 4 | 262,800 | 122.64 | 73.52 | 0.599 | 30.00 |
| 1326 | JP | 5 | 823,000 | 479.23 | 307.33 | 0.641 | 80.00 |
| 1395 | JP | 5 | 192,720 | 1079.32 | 173.39 | 0.161 | 50.00 |
| 1548 | JP | 4 | 164,250 | 118.26 | 45.95 | 0.389 | 30.00 |
| 1780 | JP | 4 | 122,640 | 78.84 | 37.12 | 0.471 | 71.54 |
| 1813 | KR | 2 | 175,200 | 131.40 | 67.00 | 0.51 | 66.75 |
| 1823 | KR | 2 | 192,720 | 144.54 | 67.00 | 0.464 | 65.21 |
| 1844 | KR | 1 | 328,500 | 0.04 | 0.01 | 0.23 | 44.26 |
| 1845 | KR | 3 | 273,750 | 35.43 | 7.55 | 0.213 | 44.26 |
| 1846 | KR | 1 | 292,000 | 0.03 | 0.01 | 0.232 | 44.26 |
| 1847 | KR | 1 | 146,000 | 13.00 | 1.44 | 0.111 | 44.26 |
| 1857 | KR | 7 | 73,584 | 24.00 | 1.38 | 0.058 | 20.00 |
| 1876 | NL | 6 | 1,000,000 | 43.80 | 19.61 | 0.448 | 47.86 |
| 1881 | NL | 7 | 850,000 | 348.00 | 16.67 | 0.048 | 47.86 |
| 1931 | SE | 2 | 55,000 | 219.00 | 132.00 | 0.603 | 25.00 |
| 1938 | SE | 1 | 550,000 | 280.00 | 49.00 | 0.175 | 23.36 |
| 1960 | SE | 2 | 55,000 | 140.00 | 9.81 | 0.070 | 16.40 |
| 1961 | SE | 3 | 700,000 | 2138.00 | 149.86 | 0.070 | 16.40 |
| 1981 | TH | 3 | 182,500 | 112.13 | 25.00 | 0.223 | 0.00 |
| 2117 | FR | 1 | 711,000 | 256.67 | 43.48 | 0.169 | 30.00 |
| 2118 | CN | 2 | 75,000 | 23.78 | 7.72 | 0.325 | 15.00 |
| 2119 | DE | 1 | 711,000 | 0.600 | 40.00 | ||
| 2120 | CA | 3 | 365,000 | 220.00 | 17.72 | 0.081 | 90.00 |
| 2121 | NL | 7 | 52,000 | 0.294 | 50.00 | ||
| 2122 | CA | 7 | 400,000 | 50.00 | 13.14 | 0.263 | 30.00 |
| 2123 | NL | 7 | 1,550,000 | 724.20 | 30.40 | 0.042 | 47.86 |
| 2124 | KR | 5 | 36,500 | 0.15 | 0.05 | 0.370 | 90.00 |
| 2125 | FR | 5 | 50,000 | 4.02 | 0.92 | 0.229 | 90.00 |
| 2126 | ID | 6 | 21.9 | 3.50 | 2.18 | 0.622 | 1.37 |
Source: Compiled by the authors.
Appendix C. Descriptive Statistics of Variables
Appendix C.1. Variables in Nominal Scale
| Indicator | Possible Indicator Values | Observation Number | % of the Observation Number |
| Country | CA | 2 | 5.4 |
| CN | 1 | 2. | |
| DE | 4 | 1.8 | |
| FI | 2 | 5.4 | |
| FR | 2 | 5.4 | |
| ID | 1 | 2.7 | |
| IT | 2 | 5.4 | |
| JP | 6 | 1.2 | |
| KR | 8 | 21.6 | |
| NL | 4 | 10.8 | |
| SE | 4 | 10.8 | |
| TH | 1 | 2.7 | |
| Technology Code | Incineration moving grate (1) | 7 | 19% |
| Incineration fluidized bed (2) | 5 | 13.5% | |
| Incineration rotary kiln (3) | 5 | 13.5% | |
| Gasification (4) | 5 | 13.5% | |
| Plasma Gasification (5) | 5 | 13.5% | |
| Pyrolysis (6) | 5 | 13.5% | |
| Anaerobic digestion (7) | 5 | 13.5% |
Appendix C.2. Variables in Relative Scale
| Minimum | Maximum | Average | Standard Deviation | Asymmetry | Kurtosis | |
| Capacity | 21.90 | 1,550,000 | 331,935,046 | 92,233.72 | 1.76 | 3.66 |
| Annual electricity output | 0.03 | 2138 | 290.02 | 451.87 | 2.60 | 7.73 |
| Annual expenses | 0.01 | 401 | 62.73 | 95.59 | 2.31 | 5.07 |
| LCOE | 0.04 | 0.99 | 0.31 | 0.21 | 1.07 | 1.31 |
| GHG reduction | 0 | 90 | 41.47 | 24.78 | 0.47 | −0.52 |
Source: Compiled by the authors.
Appendix D. Outliers among Relative Variables Based on the “Three Sigma” Rule
| Capacity | Annual Electricity Output | Annual Expenses | LCOE | GHG Reduction | |
| Average | 331,935 | 290.02 | 62.73 | 0.31 | 41.47 |
| Standard deviation | 92,233.7 | 451.87 | 95.59 | 0.21 | 24.78 |
| Lower bound | 55,234.3 | −1065.59 | −224.04 | −0.32 | −32.87 |
| Upper bound | 608,636.6 | 1645.63 | 349.5 | 0.94 | 115.81 |
| Outliers number | 8 | 1 | 1 | 1 | 0 |
Source: Compiled by the authors.
Appendix E. Histograms of Quantitative Variables
Appendix E.1. Capacity
Figure A1.
Capacity.

Appendix E.2. Annual Electricity Output
Figure A2.
Annual Electricity Output.

Appendix E.3. Annual Expenses
Figure A3.
Annual Expenses.

Appendix E.4. LCOE
Figure A4.
LCOE. Source: Compiled by the authors.

Appendix F. Pearson Pair Correlations and Their Two-Way Significance
| Technology Code | Capacity | Annual Electricity Output | Annual Expenses | LCOE | GHG Reduction | ||
| Technology Code | C | 1 | 0.079 | 0.056 | 0.086 | 0.028 | 0.051 |
| S | 0.643 | 0.751 | 0.623 | 0.868 | 0.766 | ||
| Capacity | C | 1 | 0.351 * | 0.105 | −0.232 | 0.045 | |
| S | 0.039 | 0.549 | 0.168 | 0.793 | |||
| Annual electricity output | C | 1 | 0.647 ** | −0.259 | −0.194 | ||
| S | 0.000 | 0.134 | 0.265 | ||||
| Annual expenses | C | 1 | 0.202 | −0.119 | |||
| S | 0.243 | 0.495 | |||||
| LCOE | C | 1 | 0.185 | ||||
| S | 0.272 | ||||||
| GHG reduction | C | 1 | |||||
| S | |||||||
Designations: C—correlation; S—significance (two-way); *—correlation is significant at the 0.05 level; **—correlation is significant at the 0.01 level (two-way). Source: Compiled by the authors.
Appendix G. Pearson Paired Correlations with Dummy Variables and Their Two-Way Significance
| Capacity | Annual Electricity Output | Annual Expenses | LCOE | GHG Reduction | Technology Code = 1.0 | Technology Code = 2.0 | Technology Code = 3.0 | Technology Code = 4.0 | Technology Code = 5.0 | Technology Code = 6.0 | Technology Code = 7.0 | ||
| Capacity | C | 1 | 0.351 * | 0.105 | −0.232 | 0.045 | 0.199 | −0.264 | 0.043 | −0.129 | −0.128 | −0.053 | 0.302 |
| S | 0.039 | 0.549 | 0.168 | 0.793 | 0.237 | 0.114 | 0.799 | 0.447 | 0.450 | 0.757 | 0.069 | ||
| Annual electricity output | C | 1 | 0.647 ** | −0.259 | −0.194 | −0.143 | −0.145 | 0.314 | 0.031 | 0.025 | −0.069 | −0.003 | |
| S | 0.000 | 0.134 | 0.265 | 0.413 | 0.406 | 0.066 | 0.858 | 0.888 | 0.695 | 0.987 | |||
| Annual expenses | C | 1 | 0.202 | −0.119 | −0.154 | −0.026 | −0.049 | 0.132 | 0.165 | 0.109 | −0.180 | ||
| S | 0.243 | 0.495 | 0.377 | 0.882 | 0.779 | 0.451 | 0.345 | 0.532 | 0.300 | ||||
| LCOE | C | 1 | 0.185 | −0.126 | 0.160 | −0.324 | 0.126 | 0.318 | 0.177 | −0.312 | |||
| S | 0.272 | 0.459 | 0.345 | 0.050 | 0.458 | 0.055 | 0.295 | 0.060 | |||||
| GHG reduction | C | 1 | −0.108 | −0.061 | −0.022 | −0.003 | 0.591 ** | −0.44 * | −0.038 | ||||
| S | 0.525 | 0.718 | 0.899 | 0.988 | 0.000 | 0.037 | 0.825 | ||||||
| Technology code = 1.0 | C | 1 | −0.191 | −0.191 | −0.191 | −0.191 | −0.191 | −0.191 | |||||
| S | 0.258 | 0.258 | 0.258 | 0.258 | 0.258 | 0.258 | |||||||
| Technology code = 2.0 | C | 1 | −0.156 | −0.156 | −0.156 | −0.156 | −0.156 | ||||||
| S | 0.356 | 0.356 | 0.356 | 0.356 | 0.356 | ||||||||
| Technology code = 3.0 | C | 1 | −0.156 | −0.156 | −0.156 | −0.156 | |||||||
| S | 0.356 | 0.356 | 0.356 | 0.356 | |||||||||
| Technology code = 4.0 | C | 1 | −0.156 | −0.156 | −0.156 | ||||||||
| S | 0.356 | 0.356 | 0.356 | ||||||||||
| Technology code = 5.0 | C | 1 | −0.156 | −0.156 | |||||||||
| S | 0.356 | 0.356 | |||||||||||
| Technology code = 6.0 | C | 1 | −0.156 | ||||||||||
| S | 0.356 | ||||||||||||
Designations: C—correlation; S—significance (two-way); *—correlation is significant at the 0.05 level; **—correlation is significant at the 0.01 level (two-way). Source: Compiled by the authors.
Appendix H. Pairwise Simple Scatter Plots of Capacity and LCOE with a Fitting Line and Code Labels
Appendix H.1. Technology Code 1 (Incineration Moving Grate)
Figure A5.
Technology Code 1 (Incineration Moving Grate).

Appendix H.2. Technology Code 2 (Incineration Fluidized Bed)
Figure A6.
Technology Code 2 (Incineration Fluidized Bed).

Appendix H.3. Technology Code 3 (Incineration Rotary Kiln)
Figure A7.
Technology Code 3 (Incineration Rotary Kiln).

Appendix H.4. Technology Code 4 (Gasification)
Figure A8.
Technology Code 4 (Gasification).

Appendix H.5. Technology Code 5 (Plasma Gasification)
Figure A9.
Technology Code 5 (Plasma Gasification).

Appendix H.6. Technology Code 6 (Pyrolisys)
Figure A10.
Technology Code 6 (Pyrolisys).

Appendix H.7. Technology Code 7 (Anaerobic Digestion)
Figure A11.
Technology Code 7 (Anaerobic Digestion). Source: Compiled by the authors.

Appendix I. The Average Values of Indicators in Technological Groups
| Average For Technology Code | LCOE | GHG Reduction |
| Incineration moving grate (1) | 0.253 | 36 |
| Incineration fluidized bed (2) | 0.394 | 38 |
| Incineration rotary kiln (3) | 0.135 | 40 |
| Gasification (4) | 0.376 | 41 |
| Plasma Gasification (5) | 0.479 | 78 |
| Pyrolisys (6) | 0.403 | 20 |
| Anaerobic digestion (7) | 0.141 | 39 |
Appendix J. The Wholesale Electricity Prices in Selected Countries in US Dollars per kWh in 2021–2022
| Code | Country | Wholesale Price |
| 548 | DE | 0.189 |
| 562 | DE | 0.189 |
| 567 | DE | 0.189 |
| 670 | FI | 0.126 |
| 678 | FI | 0.126 |
| 916 | IT | 0.321 |
| 938 | IT | 0.321 |
| 1203 | JP | 0.211 |
| 1265 | JP | 0.211 |
| 1326 | JP | 0.211 |
| 1395 | JP | 0.211 |
| 1548 | JP | 0.211 |
| 1780 | JP | 0.211 |
| 1813 | KR | 0.133 |
| 1823 | KR | 0.133 |
| 1844 | KR | 0.133 |
| 1845 | KR | 0.133 |
| 1846 | KR | 0.133 |
| 1847 | KR | 0.133 |
| 1857 | KR | 0.133 |
| 1876 | NL | 0.183 |
| 1881 | NL | 0.183 |
| 1931 | SE | 0.100 |
| 1938 | SE | 0.100 |
| 1960 | SE | 0.100 |
| 1961 | SE | 0.100 |
| 1981 | TH | 0.107 |
| 2117 | FR | 0.098 |
| 2118 | CN | 0.084 |
| 2119 | DE | 0.189 |
| 2120 | CA | 0.124 |
| 2121 | NL | 0.183 |
| 2122 | CA | 0.124 |
| 2123 | NL | 0.183 |
| 2124 | KR | 0.133 |
| 2125 | FR | 0.098 |
| 2126 | ID | 0.101 |
Source: Compiled by the authors.
References
- Bhowmik, D.; Chetri, S.; Enerijiofi, K.E.; Naha, A.; Kanungo, T.D.; Shah, M.P.; Nath, S. Multitudinous approaches, challenges and opportunities of bioelectrochemical systems in conversion of waste to energy from wastewater treatment plants. Clean. Circ. Bioeconomy 2023, 4, 100040. [Google Scholar] [CrossRef]
- Peng, X.; Jiang, Y.; Chen, Z.; Osman, A.I.; Farghali, M.; Rooney, D.W.; Yap, P.S. Recycling municipal, agricultural and industrial waste into energy, fertilizers, food and construction materials, and economic feasibility: A review. Environ. Chem. Lett. 2023, 21, 765–801. [Google Scholar] [CrossRef]
- Tsai, F.M.; Bui, T.D.; Tseng, M.L.; Wu, K.J. A Causal Municipal Solid Waste Management Model for Sustainable Cities in Vietnam under Uncertainty: A Comparison. Resour. Conserv. Recycl. 2020, 154, 104599. [Google Scholar] [CrossRef]
- Sustainable Development Goals. Available online: https://www.un.org/sustainabledevelopment/ (accessed on 29 September 2022).
- Ternald, D. International Environmental Technology Centre. In Annual Report 2020; United Nations Environment Programme: Osaka, Japan, 2020. [Google Scholar]
- What a Waste 2.0: A Global Snapshot of Solid Waste Management to 2050; World Bank: Washington, DC, USA, 2018; p. 25. Available online: https://www.worldbank.org/en/news/infographic/2018/09/20/what-a-waste-20-a-global-snapshot-of-solid-waste-management-to-2050 (accessed on 19 January 2024).
- European Commission. Waste and Recycling. 2023. Available online: https://environment.ec.europa.eu/topics/waste-and-recycling_en (accessed on 19 January 2024).
- Uche-Soria, M.; Rodríguez-Monroy, C. An efficient waste-to-energy model in isolated environments. Case study: La Gomera (Canary Islands). Sustainability 2019, 11, 3198. [Google Scholar] [CrossRef]
- Environmental, Health, and Safety Guidelines; World Bank Group: Washington, DC, USA, 2007; p. 1. Available online: https://www.ifc.org/wps/wcm/connect/topics_ext_content/ifc_external_corporate_site/sustainability-at-ifc/policies-standards/ehs-guidelines (accessed on 10 April 2024).
- Chandel, M.K.; Kwok, G.; Jackson, R.B.; Pratson, L.F. The potential of waste-to-energy in reducing GHG emissions. Carbon Manag. 2012, 3, 133–144. [Google Scholar] [CrossRef]
- Vukovic, N.; Makogon, E. Waste-to-Energy generation: Complex efficiency analysis of modern technologies. Sustainability 2022, 14, 13814. [Google Scholar] [CrossRef]
- Hadidi, L.A.; Omer, M.M. A financial feasibility model of gasification and anaerobic digestion waste-to-energy (WTE) plants in Saudi Arabia. Waste Manag. 2017, 59, 90–101. [Google Scholar] [CrossRef] [PubMed]
- Waste-to-Energy from Municipal Solid Wastes Report; US Department of Energy: Washington, DC, USA, 2019; p. 22. Available online: https://www.energy.gov/eere/bioenergy/articles/waste-energy-municipal-solid-wastes-report (accessed on 19 January 2024).
- Averfalk, H.; Ingvarsson, P.; Persson, U.; Gong, M.; Werner, S. Large heat pumps in Swedish district heating systems. Renew. Sustain. Energy Rev. 2017, 79, 1275–1284. [Google Scholar] [CrossRef]
- Kassem, N.; Sills, D.; Posmanik, R.; Blair, C.; Tester, J.W. Combining anaerobic digestion and hydrothermal liquefaction in the conversion of dairy waste into energy: A techno economic model for New York state. Waste Manag. 2020, 103, 228–239. [Google Scholar] [CrossRef] [PubMed]
- Townsend, A.K.; Webber, M.E. An integrated analytical framework for quantifying the LCOE of waste-to-energy facilities for a range of greenhouse gas emissions policy and technical factors. Waste Manag. 2012, 32, 1366–1377. [Google Scholar] [CrossRef] [PubMed]
- Yi, S.; Jang, Y.C.; An, A.K. Potential for energy recovery and greenhouse gas reduction through waste-to-energy technologies. J. Clean. Prod. 2018, 176, 503–511. [Google Scholar] [CrossRef]
- Coenrady, C. Waste to Energy Facilities Worldwide. Cor Coenrady’s Website. 2020. Available online: http://www.coenrady.com/ (accessed on 19 January 2024).
- Select Countries You Visited. 2023. Available online: https://www.amcharts.com/visited_countries/#FI,FR,DE,IT,NL,SE,CA,CN,ID,JP,KR,TH (accessed on 19 January 2024).
- Sturges, H.A. The choice of a class interval. J. Am. Stat. Assoc. 1926, 21, 65–66. [Google Scholar] [CrossRef]
- Brankova, S.; Todorova, E. Eco-Efficiency of Plasma-Gasification Methods for Solid Waste Treatment. J. Int. Sci. Publ. Ecol. Saf. 2018, 12, 303–309. [Google Scholar]
- Rand, T.; Haukohl, J.; Marxen, U. Municipal Solid Waste Incineration: A Decision Maker’s Guide (No. 21091, p. 1); The World Bank: Washington, DC, USA, 2000. [Google Scholar]
- Escamilla-García, P.E.; Camarillo-López, R.H.; Carrasco-Hernández, R.; Fernández-Rodríguez, E.; Legal-Hernández, J.M. Technical and economic analysis of energy generation from waste incineration in Mexico. Energy Strategy Rev. 2020, 31, 100542. [Google Scholar] [CrossRef]
- Mulya, K.S.; Zhou, J.; Phuang, Z.X.; Laner, D.; Woon, K.S. A systematic review of life cycle assessment of solid waste management: Methodological trends and prospects. Sci. Total Environ. 2022, 831, 154903. [Google Scholar] [CrossRef] [PubMed]
- Asian Development Bank. Waste to Energy in the Age of the Circular Economy. 2020, p. 54. Available online: https://www.adb.org/publications/waste-to-energy-age-circular-economy-handbook (accessed on 19 January 2024).
- Electricity Prices for Non-Household Consumers—Bi-Annual Data (from 2007 Onwards) (nrg_pc_205). Eurostat. 2023. Available online: https://fgeerolf.com/data/eurostat/nrg_pc_205.html (accessed on 19 January 2024).
- The Price of Electricity per KWh in 230 Countries. Existent Ltd. 2023. Available online: https://www.cable.co.uk/energy/worldwide-pricing/ (accessed on 19 January 2024).
- Electricity Market Report 2023; International Energy Agency: Paris, France, 2023; p. 36.
- Jamil, S.R.; Wang, L.; Tang, C.; Khan, H.M.S.; Che, D. The role and impact of costing method in the decision-making of energy project: A comparative assessment between levelized cost of energy and benefit-to-cost ratio analysis. Int. J. Energy Res. 2022, 46, 4754–4769. [Google Scholar] [CrossRef]
- Brückner, S.; Liu, S.; Miró, L.; Radspieler, M.; Cabeza, L.F.; Lävemann, E. Industrial waste heat recovery technologies: An economic analysis of heat transformation technologies. Appl. Energy 2015, 151, 157–167. [Google Scholar] [CrossRef]
- Global Waste Management Outlook. UNEP. 2015, p. 120. Available online: https://www.uncclearn.org/resources/library/global-waste-management-outlook-2015/ (accessed on 19 January 2024).
- Porshnov, D. Evolution of pyrolysis and gasification as waste to energy tools for low carbon economy. Wiley Interdiscip. Rev. Energy Environ. 2022, 11, e421. [Google Scholar] [CrossRef]
Figure 1.
Waste-to-Energy generations analyzed by the research project. Source: Compiled by the authors accessed on 15 January 2024 amcharts.com [19].
Figure 1.
Waste-to-Energy generations analyzed by the research project. Source: Compiled by the authors accessed on 15 January 2024 amcharts.com [19].

Disclaimer/Publisher’s Note: The statements, opinions and data contained in all publications are solely those of the individual author(s) and contributor(s) and not of MDPI and/or the editor(s). MDPI and/or the editor(s) disclaim responsibility for any injury to people or property resulting from any ideas, methods, instructions or products referred to in the content. |
© 2024 by the authors. Licensee MDPI, Basel, Switzerland. This article is an open access article distributed under the terms and conditions of the Creative Commons Attribution (CC BY) license (https://creativecommons.org/licenses/by/4.0/).
Share and Cite
MDPI and ACS Style
Vukovic, N.; Makogon, E. Waste-to-Energy Generation: Complex World Project Analysis. Sustainability 2024, 16, 3531. https://doi.org/10.3390/su16093531
AMA Style
Vukovic N, Makogon E. Waste-to-Energy Generation: Complex World Project Analysis. Sustainability. 2024; 16(9):3531. https://doi.org/10.3390/su16093531
Chicago/Turabian StyleVukovic, Natalia, and Evgenia Makogon. 2024. "Waste-to-Energy Generation: Complex World Project Analysis" Sustainability 16, no. 9: 3531. https://doi.org/10.3390/su16093531
Note that from the first issue of 2016, this journal uses article numbers instead of page numbers. See further details here.