
Agglomeration Externalities vs. Network Externalities: Impact on Green Technology Innovation in 283 Chinese Cities


1
College of Geography and Environment, Shandong Normal University, Jinan 250358, China
2
Collaborative Innovation Center of Human–Nature and Green Development in Universities of Shandong, Shandong Normal University, Jinan 250358, China
*
Author to whom correspondence should be addressed.
Sustainability 2024, 16(9), 3540; https://doi.org/10.3390/su16093540
Submission received: 13 March 2024
/
Revised: 16 April 2024
/
Accepted: 17 April 2024
/
Published: 24 April 2024
(This article belongs to the Special Issue Technology Innovation and Policy for Sustainability: Challenges and Opportunities)
Abstract
:The prominence of agglomeration externalities (AEs) and network externalities (NEs) in urban sustainable development has intensified in recent times, with advances in transportation infrastructure and information technology acting as key accelerators. Despite the scholarly attention they receive, the specific spillover effects that these externalities exert on green technology innovation (GTI) remain under-explored. In an effort to bridge this knowledge gap, the present study employs a spatial Durbin model to scrutinize, spanning a decade from 2011 to 2021, the impact and spatial spillover of AEs and NEs on GTI across 283 Chinese cities of prefecture level and above. The findings reveal the following: (1) AEs exert a U-shaped influence on GTI, initially inhibiting it, before ultimately fostering its growth. (2) NEs are found to consistently promote GTI. (3) The spatial spillover effects of AEs on GTI are significantly positive, while those from NEs are not statistically significant. (4) The influences of AEs and NEs on GTI exhibit marked regional variations. This study extends the research scope on the factors influencing GTI by examining the role of AEs and NEs, thereby aiming to offer valuable insights for enhancing the level of GTI.
1. Introduction
Economic agglomeration, representing the concentration of economic activities within a defined geographic space, fundamentally arises from the existence of agglomeration externalities (AEs) [1,2]. As characterized by Rosenthal and Strange [3], AEs refer to the incremental benefits economic agents can derive by their co-location in a shared area. Extensive discussions and contributions concerning AEs have resulted in two divergent perspectives: Marshallian and Jacobian externalities. Marshallian externalities propose that knowledge spillovers are exclusive to a specific industry, implying that regions with high degrees of specialization foster agglomeration economies [4]. Contrarily, Jacobian externalities account for diversification, positing that knowledge spillovers transpire between varied industries [5]. The existing literature often frames industrial agglomeration as the subject of investigation, with cities serving as the operational units, thereby probing the effects of AEs on economic growth, innovation, and environmental pollution. Concerning economic growth, Tang et al. [6], Jiang et al. [7], and Peng et al. [8] have independently scrutinized the influence of AEs on urban economies within various Chinese provinces, the Yangtze River Delta region, and in diverse city clusters. Their research collectively affirmed that AEs considerably advance economic growth. Contrarily, Liu et al. [9] found that AEs’ impact on high-quality development unfolds as a U-shaped relationship, thereby implying that such externalities initially impede, but subsequently enhance, high-quality development. Regarding innovation, studies conducted by Yang et al. [10], Yao and Wu [11], and Li and Song [12], using spatial econometric models, underscored that AEs can notably foster innovation development in Chinese cities. In the context of environmental pollution, scholarly opinions diverge. Liu et al. [13] discovered that the urban spatial structure exerts a pivotal influence on augmenting the mitigating impact of technological innovation on haze, while AEs notably diminish the haze-reducing effect of regional technological innovation. Conversely, Shen and Peng [14] suggested a U-shaped relationship between AEs and environmental efficiency, emphasizing that different regions exist at various points along this curve. Wang et al. [15] contend that the association between AEs and environmental pollution is not simply linear- or U-shaped but exhibits an N-shaped relationship.
In the context of modern transportation and information technology advancements, cross-regional interactions between enterprises and cities have been invigorated to an unprecedented degree. This has triggered a shift from AEs to network externalities (NEs), which transcend geographical confines. Traditional theories on AEs, which are bound by the law of distance decay and restricting externalities within cities or administrative borders, falter in elucidating the external economy generated by spatially discontinuous elements. Katz and Shapiro [16], Camagni and Salone [17], and Capello [18] progressively refined the theory of urban NEs, whereby they highlighted the benefits accruing from inter-city connections. Predominantly, the existing literature, employing inter-city transportation or population migration data [2,19], embodies the urban network from a “flow” perspective. Compared with AEs, the research that has delved into the spillover effects of NEs remains scarce, and a comprehensive theoretical framework is yet to materialize. Tang et al. [6] and Huang et al. [2] investigated the relationship between NEs and urban development, discovering that such externalities significantly advance urban development with varying effects across different cities. Zhou et al. [19] studied the interplay between NEs and urban population, uncovering not only a positive local spillover effect of NEs, but also a negative cross-regional spillover effect. Yao and Wu [11] evaluated the impact of NEs on the innovative development of Chinese cities, determining that these externalities considerably foster urban innovation.
Green technology innovation (GTI), which is a fusion of technological innovation activities imbued with green principles, simultaneously fuels economic growth and environmental protection [20,21]. In reference to the “Green Technology Patent Classification System” issued by the State Intellectual Property Office, green patents encompass a wide range of technologies that contribute to sustainable development. These patents cover areas such as the clean utilization of traditional energy, utilization of new energy sources, energy conservation and efficiency, greenhouse gas reduction, capture and storage, recycling, environmental protection materials, pollution control, green transportation, green agriculture and forestry, green buildings, and other technologies that promote sustainable development. Since 2011, China’s green patents, which are represented by GTI activities, have been highly active; moreover, they have demonstrated continuous improvement in GTI capabilities, and we have witnessed a gradual increase in the number of green patents granted. Globally, from 2016 to 2021, a total of 471,000 green technology patents were granted, with 160,000 patents granted by the State Intellectual Property Office of China, accounting for 33.97% of the total. China has emerged as a significant driving force behind GTI. The innovative aspects of these green technology patents contribute to the promotion of sustainable development, reduction in reliance on traditional energy sources, improvement of environmental quality, and fostering the coordinated development of the economy and the environment. The determinants of GTI have been a recurring theme in academic discourse, and investigating this issue possesses significant value for enhancing GTI levels and achieving sustainable development goals [22]. Qiu et al. [23] found that upgrading industrial structures substantially propels GTI [23]. Lin and Ma [24] revealed that digital finance augments the quantity and quality of GTI. Various other scholars have studied the impacts of environmental regulation, economic scale, social culture, and other factors on GTI [25]. However, the impact of AEs and NEs on GTI remains to be studied. Undertaking such research holds not only scientific value and pioneering importance for investigating the determinants of GTI from the perspectives of spatial relations and element flow, but it also bears crucial theoretical significance for enriching the empirical cases and research scope of the spillover effects of AEs and NEs. What impacts do AEs and NEs exert on GTI? Will the influence of NEs on GTI amplify or diminish compared to that of AEs? Do the two externalities have spatial spillover effects on GTI? These are pressing questions that warrant further exploration.
To summarize, this study focuses on 283 Chinese cities of prefecture level and above during the period of 2011 to 2021. It utilizes economic density as a proxy for AEs, the degree centrality of the asset flow of sizable enterprises within the social association network to represent NEs, and the number of green patents as an indicator of GTI. A spatial Durbin model (SDM) is employed to examine the impact of AEs and NEs on GTI. The incremental contributions of this paper relative to the existing literature are as follows: Firstly, by examining the influence of AEs and NEs on GTI, this study contributes innovative perspectives and content to the understanding of the determinants of GTI. Secondly, by concurrently investigating the spillover effects of AEs and NEs on GTI, this study not only allows for a comparative analysis of the results, but it also broadens the research content on the spillover effects of these externalities. Thirdly, through modeling and computing NEs based on the current assets of enterprise above a designated size (CA of EADS), this study complements previous research that has utilized transportation or population flow data to depict NEs.
The rest of this paper is structured as follows: Section 2 outlines the theoretical hypotheses, introducing the AEs and GTI, the NEs and GTI, and the spatial spillover effects of both types of externalities on GTI. Section 3 describes the data and research methods, including the sources and calculation methods for the data used and the SDM employed in this study. Section 4 presents the results and discussion, wherein the findings regarding the influence of AEs and NEs on GTI, as well as the results of robustness tests and heterogeneity tests, are displayed and discussed. In Section 5, the discussion is centered around the effects of AEs and NEs on GTI and the spillover effects of both. The final section concludes the study and provides policy implications, thereby proffering research conclusions based on the results and formulating corresponding policy suggestions in line with the study’s conclusions.
2. Hypotheses
2.1. AEs and GTI
The Marshallian externality theory posits that geographical proximity, which is facilitated by agglomeration, enhances the dissemination of knowledge, skills, and information, and that such knowledge spillover can bolster the level of innovation within an agglomeration area. Concurrently, agglomeration can effectively increase the speed of information exchange, decrease uncertainty for businesses in the innovation process, and thereby diminish the risk of innovation [26,27]. Magrini and Galliano [28] established that AEs can positively influence urban innovation based on an investigation of French industrial enterprises. Hervas-Oliver et al. [29] found that AEs can enhance the innovative performance of enterprises, albeit to varying degrees across different businesses. It is apparent that AEs can stimulate innovation. Further investigating the impact of AEs on GTI reveals that, in an imperfect system, the broad geographical agglomeration of economic activities could inadvertently cause environmental pollution and a decline in the quality of development due to economic scale expansions [30], and unfair competition among enterprises might lead to improper resource allocation, thereby inhibiting GTI [31,32]. However, as sharing, matching, and learning mechanisms continually improve [33], the positive externalities of agglomeration have emerged gradually, thus fostering green technology exchange and cooperation through knowledge and technology spillover. And the agglomeration process itself attracts innovative talent, technology, and enterprises [34], thereby promoting the advancement of GTI. Thus, AEs can both impede and foster GTI. Given this, this study proposes the following hypothesis:
H1.
AEs have a nonlinear U-shaped impact on GTI.
2.2. NEs and GTI
The formation of an urban network enhances inter-city connections and the flow of elements, thereby fostering the diffusion of knowledge and innovation, as well as improving the level and capability of urban innovation [35,36]. Alonso [37] introduced the concept of “borrowed size”, by which NEs can facilitate positive spillovers to GTI. Urban networks offer advantages in industrial collaboration, specialized divisions of labor, and market integration, which will further stimulate the spillover of GTI and eliminate obsolete technologies [11]. Moreover, compared to AEs, NEs can achieve innovation effects over a larger spatial range [38], thus promoting a more expansive development range for GTI. Additionally, NEs are a significant supplement and extension to AEs. Once AEs reach a certain threshold, NEs gradually come into effect, meaning that NEs emerge after the impact of AEs on GTI crosses the inflection point, thereby facilitating an improved level of GTI. Based on these insights, this study proposes the following second hypothesis:
H2.
NEs can enhance the level of GTI.
2.3. Spatial Spillover of AEs and NEs on GTI
AEs underscore the benefits accrued from geographical proximity, which leads to nearby cities influencing one another. On the basis of Tobler’s first law of geography [39], the spatial spillover of AEs on GTI in other cities diminishes as distance increases. With the acceleration of element flow and the growing significance of “flow” space, traditional AEs gradually break free from the constraints of geographical space and distance decay, and urban NEs with cross-border, mobile, multi-scale, and shared characteristics begin to surface [40,41]. Cities that exhibit network characteristics will generate spillover effects that transcend geographical boundaries, thereby broadening the spatial spillover of traditional AEs. The impact on GTI can achieve leapfrog spatial network spillover through network associations, and it can also help cities break free from the innovation lock in that may be caused by their inherent knowledge system, thereby enabling technological breakthroughs across levels. In light of these observations, this study proposes the third hypothesis:
H3.
Both AEs and NEs exert spatial spillover effects on GTI, and the spatial spillover effect of NEs is more pronounced.
3. Data and Methods
3.1. Selection and Description of Variables
3.1.1. Dependent Variable
The dependent variable in this study is GTI. Guided by the extant literature [42,43,44], this study utilizes the number of green patents as a proxy variable for GTI. Green patents offer a focused and accurate reflection of the level of GTI. By incorporating this variable, we eliminate the potential interference of indicators with minimal correlation to GTI in the index system. Moreover, taking such an approach overcomes the limitations of establishing an indicator system to capture GTI, which would impede the utilization of spatial econometric models in studying the factors influencing and spillover effects of GTI.
3.1.2. Core Explanatory Variables
The core explanatory variables of this study are AEs and NEs. AEs are expressed by economic density [45]. Economic density is a crucial indicator reflecting the density of economic output and the state of economic development. It denotes the level of economic concentration and the scale effect within a region, and it can foster knowledge sharing, technological exchange, talent mobility, and supply chain effects, thus enabling the association and subsequent release of AEs with other cities. A higher economic density implies a greater level of AEs in the city [46]. The specific equation for its calculation is as follows:
In Equation (1), denotes the economic density of the city; is the city’s gross domestic product (GDP); and signifies the built-up area of the city.
NEs are computed using degree centrality in social network analysis. By adjusting the gravity model to accommodate the flow of assets of enterprise above a designated size, the inter-city association gravity is determined. Relying on the 0–1 relationship matrix, the degree centrality of different cities is computed using UCINET 6.0 software, which is a software specifically designed for social network analysis, and it provides various features such as visual analysis, network analysis, and subgroup analysis. A higher degree of centrality indicates more frequent economic activity associations between enterprises in various cities, which enhance the city’s NEs [47,48]. The specific equations for this are as follows:
In Equation (2), denotes the spatial association strength of the CA of EADS between cities; C represents the CA of EADS in each city; and is the inter-city distance calculated using ArcGIS 10.8. In Equation (3), if exceeds the average value for each row of data, then is set to 1, thus signifying an association between City i and City j; otherwise, equals 0, which indicates a lack of association between the cities. This forms a spatial binary matrix of Chinese cities and serves as data for spatial network structure analysis. In Equation (4), represents the degree centrality of the city’s spatial association network and N stands for the number of city nodes under research. If there is a spatial association between City i and j, then equals 1; otherwise, it is set to 0.
3.1.3. Control Variables
Given that GTI is subject to various influences, this study incorporates a set of control variables that are guided by the pertinent literature [23,24,49]. These include the following: (1) The economic base. This is represented by per capita GDP (Pgdp) and the proportion of the tertiary industry (Tertiary). The enhancement of economic development levels and the upgrading of industrial structure will encourage the effective amalgamation of production factors such as labor and capital, thus providing foundational conditions for the advancement of urban green transformation and GTI [50]. (2) Technological input. This is represented by the full-time equivalent of R&D personnel (RD) and the expenditure on science and technology (Tech). As GTI is a novel form of technological innovation activity, it necessitates significant human and financial investments. Incremental technological input can significantly foster the advancement of GTI levels [51]. (3) Ecological and environmental policy. This is represented by environmental regulation (Environ) and the green coverage rate of built-up areas (Green). According to Porter and Linde (1995), escalating the level of environmental regulation can compel enterprises to augment R&D investments, thereby promoting GTI [52]. The green coverage rate of built-up areas not only indicates the governmental prioritization of environmental governance, but it also reflects the attractiveness of the city’s environment. A high index implies a greater capacity to attract green technology talents [53].
In the aforementioned dataset, the data pertaining to green patents were sourced, utilizing web crawler technology, from the China National Intellectual Property Administration. Environmental regulation data, which are indicated by the frequency proportion of terms such as “environmental protection” and “ecological civilization” within city government work reports, were also obtained via web crawler technology [54]. All other data were retrieved from the “China City Statistical Yearbook” (http://www.stats.gov.cn/, accessed on 5 June 2023). Table 1 presents the descriptive statistics for the data employed in this study.
3.2. Methods
Following spatial autocorrelation, Lagrange multiplier, Wald, and likelihood ratio tests (the results of which are presented in the Supplementary Material), this study employed SDM to examine the influence, as well as their respective spatial spillover effects, of both AEs and NEs on GTI [55]. The model is expressed as follows:
In Equation (5), signifies the dependent variable, GTI, with , represents its spatial lag term; is the core explanatory variable, and it encompasses AEs and NEs; is the spatial lag term of the core explanatory variable, signifying the GTI in neighboring regions influenced by AEs and NEs; is a vector consisting of the control variables in this study, with standing as its spatial lag term; and is the spatial weight matrix. Additionally, represents a constant term; and denote spatial and temporal fixed effects, respectively; while is a normally distributed random disturbance term.
4. Results
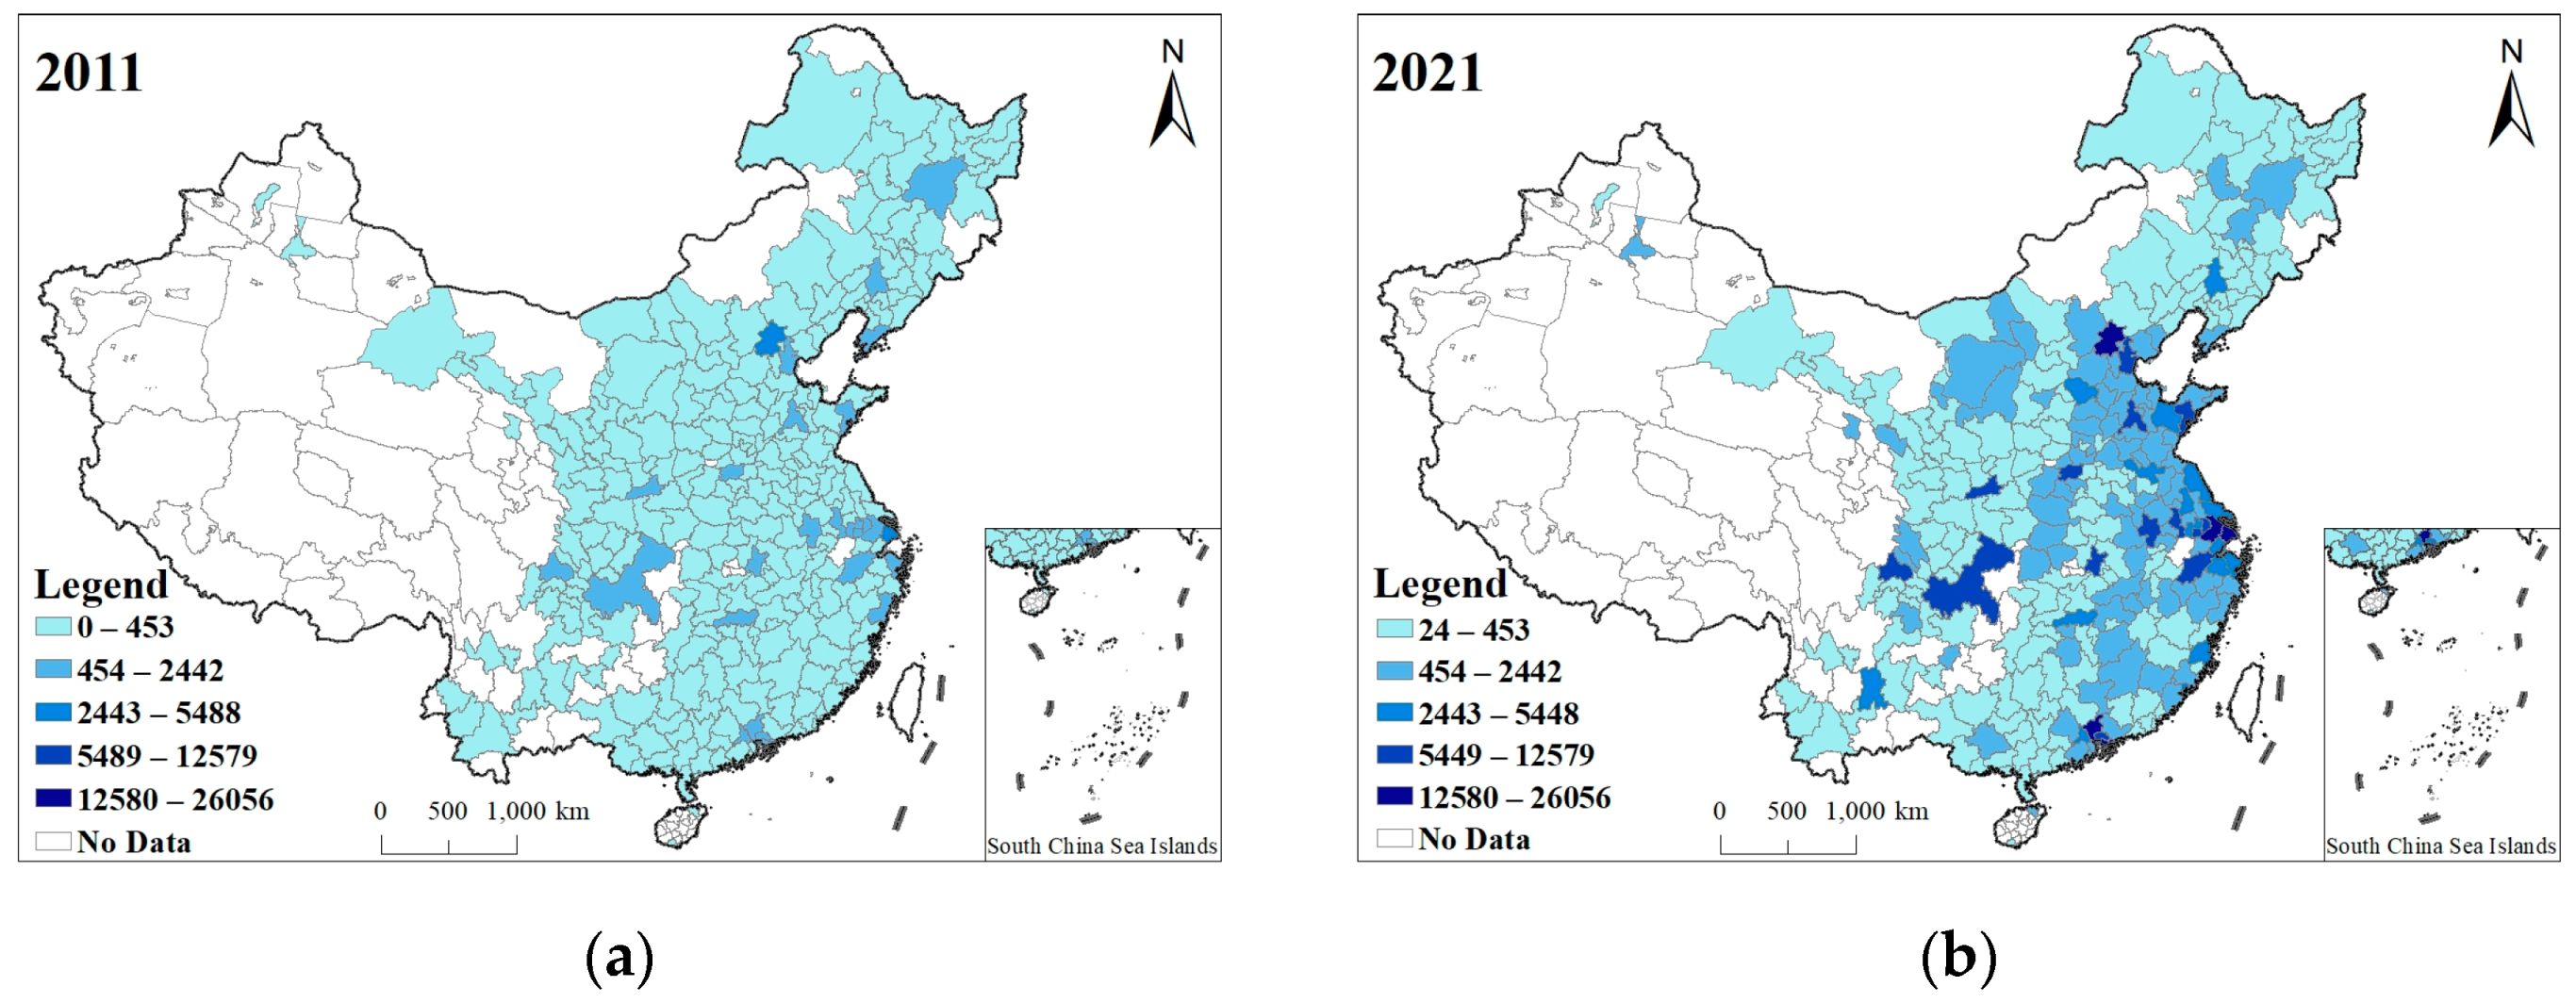
Figure 1, Figure 2 and Figure 3 depict the spatial expressions of AEs, NEs, and GTI in Chinese cities in 2011 and 2021, respectively. Building upon these findings, an in-depth analysis is conducted to examine the impact of AEs and NEs on the advancement of GTI.
4.1. Regression Results
Through utilizing the aforementioned variables and models, we conducted an analysis using Stata16.0 to examine the impact of both agglomeration and network externalities on GTI. The results of the regression are presented in Table 2.
Focusing on the results related to AEs, it was observed that the coefficient for the first rank was negative while the coefficient for the second rank was positive, and both coefficients passed the significance test. This implied that the influence of AEs on GTI had transitioned from a negative to a positive effect, thereby suggesting that it initially inhibits then promotes GTI. This lends credence to Hypothesis 1.
Turning our attention to the results pertaining to NEs, we observed that both the first-order and second-order coefficients associated with an impact on the GTI were statistically significant. This suggests that NEs exert a positive influence on GTI, and they can foster the advancement of GTI, thereby confirming Hypothesis 2.
Considering the findings pertaining to spatial spillover effects, we observed that the coefficient representing the AEs’ spillover effect on the GTI of neighboring cities was positive and statistically significant. However, the spatial spillover of NEs did not meet the significance threshold. This indicates that AEs foster GTI in neighboring cities, whereas no such spatial spillover effect was observed for NEs.
4.2. Robustness Test
Taking into account the potential endogeneity concerns in the model, this study executed a robustness test for the findings. Adhering to the method of variable substitution as suggested by Qiao and Huang [56], the ratio of a city’s GDP to the area of its built-up land was employed as an indicator of AEs, while the closeness centrality of the interconnection network of movable assets among enterprises above a designated size was utilized to denote Nes. Table 3 delineates the results of the robustness test. As discernible from Table 3, the effect of AEs on GTI persisted in its original pattern—first positive, then negative. The coefficient for the impact of NEs on GTI retained its positive value, and the spatial spillover effect of AEs remained positive. All of these findings are statistically significant. These test results are in harmony with the initial results, which attests to the robustness of the research findings.
4.3. Heterogeneity Test
Considering the disparities in the geographical location, resource endowment, and economic foundations among Chinese cities, this study, informed by the related literature [53,57], segmented China into the following four regions to specifically scrutinize the heterogeneity of the influences of AEs and NEs on GTI: eastern, central, western, and northeastern. The results of the heterogeneity test are displayed in Table 4, and the numbers in brackets correspond to the standard errors of the coefficients.
For the eastern region, the first- and second-order coefficients of AEs were −0.704 and 0.103, respectively, where both achieved statistical significance at the 5% and 10% levels. This illustrated a U-shaped relationship between the AEs and GTI in the eastern region, which is consistent with the results acquired for cities nationwide. The first- and second-order coefficients of NEs were 2.234 and −0.200, respectively, both passing the 1% significance test. This indicated an inverted U-shaped relationship between the NEs and GTI in the eastern region—an initial promotion followed by inhibition.
In the central region, the first- and second-order coefficients of AEs were −1.458 and 0.190, respectively, while the first- and second-order coefficients of NEs were 0.312 and 0.086, respectively. All of these results passed the 1% or 5% significance tests. The influence of AEs and NEs on the GTI in the central region aligned with the results from the nationwide sample.
In the western region, the first-order coefficient of AEs was −1.006, which is significant at the 5% level, while the second-order coefficient failed the significance test. This suggests a need for western cities to further enhance the quality and efficiency of agglomeration, thereby facilitating the positive influence of AEs on GTI. The first- and second-order coefficients of NEs were 1.042 and 0.190, respectively, with both passing the 1% significance test, thereby echoing the results from the cities nationwide.
In northeast China, both the first- and second-order coefficients of AEs failed the significance test, thus indicating that AEs in this region have not been effectively harnessed. Conversely, the first- and second-order coefficients of NEs passed the significance test at 0.695 and 0.138, respectively, thus mirroring the national results and indicating that NEs in northeast China have fostered the enhancement of GTI.
Examining the spatial spillover effects within each region revealed that AEs and NEs in the eastern region have spatial spillover effects on GTI, with coefficients of 1.653 and 1.400, respectively. The western region’s AEs and the northeastern region’s NEs exhibited spatial spillover effects on GTI, with coefficients of 15.988 and 3.829, respectively. However, the central region’s AEs and NEs displayed no spatial spillover effect on GTI.
5. Discussion
5.1. The Impact of AEs on GTI
This study revealed that the AEs in the study area in China exhibited a U-shaped impact on GTI, i.e., they initially impede it and then subsequently foster it. Furthermore, this pattern was observed in both the eastern and central regions of China. This result may be attributable to the aftermath of China’s reform and opening up policy, which engendered a phase of extensive development characterized by high speed and a large scale. This led to a variety of issues such as diminished development quality, irrational competition, and environmental pollution, which was primarily due to an excessive focus on scale over quality during the process of factor agglomeration in urban environments [58,59]. However, with the recent rollout of a range of strategies such as the high-quality development and ecological civilization construction proposed by China [60], cities have gradually begun to prioritize development quality, guide rational factor agglomeration, and foster the dissemination and spillover of technological knowledge and achievements, thus bolstering the advancement of GTI. The relationship between urban spatial structures and GTI has garnered significant attention in academic circles. Some scholars argue that a monocentric structure is more favorable for the development of GTI [61], while others propose an inverted U-shaped relationship between the compactness of spatial structure and GTI [62,63]. This study expanded from a single city to a large sample of Chinese cities to study the impact of AEs on GTI, thus forming a beneficial extension and supplement to the impact of urban spatial structures on GTI.
5.2. The Impact of NEs on GTI
In this article, it was found that NEs exert a sustained promotion effect on GTI, and the same impact was observed in the central, western, and northeastern regions of China. A plausible explanation for this result may lie in the context of the ongoing improvement in transportation routes and information and communication technology, which have significantly augmented the NEs in Chinese cities. Cities have enhanced the robustness of their GTI networks through strategies such as scale borrowing, industrial collaboration, and technological cooperation, thereby enhancing the level of GTI. Notably, compared to the positive influence on GTI that was observed once AEs crossed the inflection point, the promotional effect of NEs on GTI was found to be markedly stronger. This demonstrates that urban NEs not only exert a significant impact on economic development [7,64], but also emerge as a vital pathway to bolster GTI. The existing research on the impacts of urban networks on GTI has primarily concentrated on the structural characteristics of urban networks. By developing an associated network model and analyzing factors such as network size, network density, and structural holes in the network, the effects on GTI can be investigated [25,65]. This study investigates the impact of NEs on GTI based on the dynamic perspective of inter-city scale enterprise liquid asset data. It provides innovative and supplementary insights to relevant studies by establishing a correlation network model.
5.3. Spatial Spillover Effects of AEs and NEs on GTI
This study reveals that AEs exert a significantly positive spatial spillover effect on GTI, while the spatial spillover effect of NEs was not found to be significant. Possible explanations for these results warrant further discussion. The spatial spillover effect of AEs is a pervasive phenomenon in contemporary Chinese cities. The Beijing–Tianjin–Hebei and Pearl River Delta regions provide illustrative examples as these two areas have attracted a considerable number of listed companies (386 in the Beijing–Tianjin–Hebei region and 415 in the Pearl River Delta area). The innovative prowess of these leading firms has not only been advantageous in its own right, but, due to the spatial proximity of these companies, the innovation performance of other firms in the vicinity has also witnessed substantial improvement [66]. As such, at the current stage, there is a positive spatial spillover effect from AEs on GTI in China. However, impacted by factors such as policy, location, and infrastructure, there exists a significant digital divide between cities in China [67]. A considerable disparity in the digital economy could be discerned between the provincial capital cities and their surrounding counterparts, and likewise between the eastern and central–western regions. This digital divide reinforces the connections between cities of similar stature, yet it weakens the ties between cities of different levels due to the effect of asymmetric factors, thereby curtailing the potential for further spatial spillover effects of urban NEs on GTI.
5.4. Strengths and Limitations
This research contributes to the scholarly discourse on the spillover effects of AEs and NEs, as well as to the factors impacting GTI. It provides a theoretical foundation for crafting policies geared toward GTI, thereby offering valuable insights for the high-quality development of China’s economy and society. Theoretically, this paper contributes to the existing literature on the spillover effects of AEs and NEs, as well as to the determinants of GTI. It expands our understanding and provides valuable insights into these research areas. Moreover, it serves as a reference for other researchers interested in investigating the impact of urban spatial structures on GTI. From a practical perspective, the findings of this study offer valuable guidance for governmental decision-making processes. They assist in the precise identification of GTI clusters and facilitate their development through financial support and the establishment of collaborative platforms. Ultimately, these efforts contribute to the enhancement of urban GTI levels.
GTI encompasses different types, including product innovation, technology innovation, and process innovation. However, due to constraints in data acquisition, this study has not further explored the influence of AEs and NEs on these different types of GTI, which marks a limitation of the research. Future research should aim to resolve this gap by examining the effects of AEs and NEs on different forms of GTI. Simultaneously, further exploration is needed to address the variations in externalities across different regional contexts and to maximize the potential of AEs and NEs.
6. Conclusions and Policy Implications
6.1. Conclusions
This study focused on 283 prefecture-level and above cities in China; it utilized economic density as a proxy for AEs, the degree centrality of the CA of EADS to represent NEs, and the number of green patents as an indicator for GTI. Through SDM, we analyzed the impact of AEs and NEs on GTI, and we arrived at the following conclusions: Firstly, the impact of AEs on GTI follows a nonlinear U-shaped trajectory, initially inhibiting but later promoting GTI. Secondly, NEs consistently encourage GTI, with the positive promotional effect surpassing that of AEs. Thirdly, AEs exhibit significant positive spatial spillover effects, meaning they substantially boost GTI in neighboring cities; meanwhile, the spatial spillover effects of NEs do not meet the significance test. Lastly, the influence of AEs and NEs on GTI have exhibited pronounced heterogeneity across the eastern, central, western, and northeastern regions of China.
6.2. Policy Implications
Firstly, a U-shaped relationship was found to characterize the influence of AEs on GTI. It is incumbent upon all governmental departments to maximize and enhance the positive spillover effects of AEs to counteract their initial inhibitory effect. This can be achieved in two ways: Firstly, by promoting integrated city development based on improved infrastructure by reinforcing the interconnections and collaboration among enterprises, thus refining the scale and quality of agglomeration economies. Secondly, by introducing appropriate measures to guide rational enterprise clustering according to urban development positioning, thereby preventing the inhibition of GTI due to factors such as unfair competition.
Secondly, considering that the spatial spillover effect of NEs on GTI did not pass the significance test, it is essential for all governmental departments to actively implement measures to foster the spatial spillover effect of NEs. Initial steps would involve enhancing information connectivity and technical exchanges between cities and enterprises under the banner of informatization and digitalization, thereby expanding the extent of urban networks and transforming more cities into network nodes. Additionally, efforts should be made to bridge the digital divide between cities, as well as enhance the digital economy and industrial digitalization levels, thereby avoiding issues such as weakened intercity connections and cooperation due to asymmetry.
Lastly, given the regional heterogeneity of the effects of AEs and NEs on GTI, several strategies should be considered. Firstly, the negative impact of NEs on GTI in the eastern region should be mitigated through technological upgrading, international cooperation, and regional integration. Secondly, the spatial spillover effects of the central region’s AEs and NEs on GTI should be enhanced by leveraging scale effects and technological advancements. Lastly, rational factor clustering in the northeastern region should be guided to harness the positive impact of AEs on its GTI.
Supplementary Materials
The following supporting information can be downloaded at: https://www.mdpi.com/article/10.3390/su16093540/s1, Figure S1. The global Moran’s I; Figure S2. The local Moran’s I of green technology innovation; Figure S3. The local Moran’s I of agglomeration externalities; Figure S4. The local Moran’s I of network externalities; Table S1. The LM test results; Table S2. The Wald and LR test results.
Author Contributions
Conceptualization, K.L.; methodology, S.D.; software, S.D.; validation, K.L.; formal analysis, K.L.; investigation, S.D.; resources, K.L.; data curation, S.D.; writing—original draft preparation, S.D.; writing—review and editing, K.L.; visualization, S.D.; supervision, S.D.; project administration, K.L.; funding acquisition, K.L. All authors have read and agreed to the published version of the manuscript.
Funding
This research was funded by the “National Natural Science Foundation of China, grant numbers 72373084 and 72004124” and the “Shandong Provincial Education Department, China, grant number 2022RW064”.
Institutional Review Board Statement
Not applicable.
Informed Consent Statement
Not applicable.
Data Availability Statement
Data will be made available on request.
Conflicts of Interest
The authors declare no conflicts of interest.
References
- Porter, M.E. Cluster and the new economics of competition. Harv. Bus. Rev. 1998, 76, 11–12. [Google Scholar]
- Huang, Y.; Hong, T.; Ma, T. Urban network externalities, agglomeration economies and urban economic growth. Cities 2020, 107, 102882. [Google Scholar] [CrossRef]
- Rosenthal, S.S.; Strange, W.C. Chapter 49-Evidence on the nature and sources of agglomeration economies. Handb. Reg. Urban Econ. 2004, 4, 2119–2171. [Google Scholar]
- Marshall, A. Principles of Economics, 8th ed.; Macmillan: London, UK, 1920; pp. 12–23. [Google Scholar]
- Jacobs, J.M. The Economy of Cities, 1st ed.; Random House: New York, NY, USA, 1969; pp. 119–141. [Google Scholar]
- Tang, C.A.; Qiu, J.W.; Zhang, L.J.; Li, H.Y. Spatial econometric analysis on the influence of elements flow and industrial collaborative agglomeration on regional economic growth: Based on manufacturing and producer services. Econ. Geogr. 2021, 41, 146–154. [Google Scholar]
- Jiang, J.L.; Xu, Z.S.; Lu, J.Y.; Sun, D.Q. Does network externality of urban agglomeration benefit urban economic growth-A case study of the Yangtze River Delta. Land 2022, 11, 586. [Google Scholar] [CrossRef]
- Peng, D.; Li, R.R.; Shen, C.R.; Wong, Z.Y. Industrial agglomeration, urban characteristics, and economic growth quality: The case of knowledge-intensive business services. Int. Rev. Econ. Financ. 2022, 81, 18–28. [Google Scholar] [CrossRef]
- Liu, H.; Li, X.M.; Li, S.B.; Tian, S.Z.; Gong, Y.L.; Guan, Y.Y.; Sun, H. Agglomeration externalities, network externalities and urban high-quality development: A case study of urban agglomeration in the middle reaches of the Yangtze River. ISPRS Int. J. Geoinf. 2023, 11, 555. [Google Scholar] [CrossRef]
- Yang, N.N.; Liu, Q.M.; Chen, Y.E. Does industrial agglomeration promote regional innovation convergence in China? Evidence from high-tech industries. IEEE Trans. Eng. Manag. 2021, 70, 1416–1429. [Google Scholar] [CrossRef]
- Yao, C.C.; Wu, K. Agglomeration externalities, network externalities and urban innovation development. Geogr. Res. 2022, 41, 2330–2349. [Google Scholar]
- Li, N.; Song, S.H. A quasi-natural experimental study on enterprise innovation driven by urban agglomeration policies in China. Sci. Rep. 2023, 13, 10297. [Google Scholar] [CrossRef]
- Liu, K.W.; Deng, H.B.; Wu, T.; Yi, Y.; Zhang, Y.; Ren, Y.L. Technological innovation, urban spatial structure, and haze pollution: Empirical evidence from the middle reaches of the Yangtze River urban agglomeration. Energies 2023, 16, 6553. [Google Scholar] [CrossRef]
- Shen, N.; Peng, H. Can industrial agglomeration achieve the emission-reduction effect. Socio-Econ. Plan. Sci. 2021, 75, 100867. [Google Scholar] [CrossRef]
- Wang, L.P.; Long, Y.; Li, C. Research on the impact mechanism of heterogeneous environmental regulation on enterprise green technology innovation. J. Environ. Manag. 2022, 322, 116127. [Google Scholar] [CrossRef]
- Katz, M.L.; Shapiro, C. Network externalities, competition, and compatibility. Am. Econ. Rev. 1985, 75, 424–440. [Google Scholar]
- Camagni, R.P.; Salone, C. Network urban structures in northern Italy: Elements for a theoretical framework. Urban Stud. 1993, 30, 1053–1064. [Google Scholar] [CrossRef]
- Capello, R. The city network paradigm: Measuring urban network externalities. Urban Stud. 2000, 37, 1925–1945. [Google Scholar] [CrossRef]
- Zhou, Y.; Zheng, W.S.; Wang, X.F.; Xiong, Y.J.; Wang, X.Z. The mechanism behind urban population growth and shrinkage from the perspective of urban network externalities. Chin. Geogr. Sci. 2023, 33, 189–204. [Google Scholar] [CrossRef]
- Li, X.W.; Long, H.Y. Research focus, frontier and knowledge base of green technology in China: Metrological research based on mapping knowledge domains. Pol. J. Environ. Stud. 2020, 29, 3003–3011. [Google Scholar] [CrossRef]
- Liu, K.; Dong, S.M.; Wang, Y.L.; Chen, Z.F. The green innovation efficiency of Chinese cities: Regional differences, distribution dynamics, and convergences. J. Environ. Plan. Manag. 2023, 1–26. [Google Scholar] [CrossRef]
- Lin, B.Q.; Ma, R.Y. Green technology innovations, urban innovation environment and CO2 emission reduction in China: Fresh evidence from a partially linear functional-coefficient panel model. Technol. Forecast. Soc. Change 2022, 176, 121434. [Google Scholar] [CrossRef]
- Qiu, Y.; Wang, H.N.; Wu, J.J. Impact of industrial structure upgrading on green innovation: Evidence from Chinese cities. Environ. Sci. Pollut. Res. 2022, 30, 3887–3900. [Google Scholar] [CrossRef] [PubMed]
- Lin, B.Q.; Ma, R.Y. How does digital finance influence green technology innovation in China? Evidence from the financing constraints perspective. J. Environ. Manag. 2022, 320, 115833. [Google Scholar] [CrossRef] [PubMed]
- Dong, S.M.; Ren, G.X.; Xue, Y.T.; Liu, K. Urban green innovation’s spatial association networks in China and their mechanisms. Sust. Cities Soc. 2023, 93, 104536. [Google Scholar] [CrossRef]
- Feldman, M.P. The Geography of Innovation, 1st ed.; Kluwer Academic: Boston, MA, USA, 1994; pp. 29–49. [Google Scholar]
- Capello, R. Spatial transfer of knowledge in high technology milieux: Learning versus collective learning processes. Reg. Stud. 1999, 33, 353–365. [Google Scholar] [CrossRef]
- Magrini, M.B.; Galliano, D. Agglomeration economies, firms’ spatial organization and innovation performance: Some evidence from the French industry. Ind. Innov. 2012, 19, 607–630. [Google Scholar] [CrossRef]
- Hervas-Oliver, J.L.; Sempere-Ripoll, F.; Alvarado, R.R.; Estelles-Miguel, S. Agglomerations and firm performance: Who benefits and how much? Reg. Stud. 2018, 52, 338–349. [Google Scholar] [CrossRef]
- Bryan, G.; Glaeser, E.; Tsivanidis, N. Cities in the developing world. Annu. Rev. Econ. 2020, 12, 273–297. [Google Scholar] [CrossRef]
- Scherer, F.M. Firm size, market structure, opportunity, and the output of patented inventions. Am. Econ. Rev. 1965, 55, 1097–1125. [Google Scholar]
- Pindado, E.; Sanchez, M.; Martinez, M.G. Entrepreneurial innovativeness: When too little or too much agglomeration hurts. Res. Policy 2022, 52, 104625. [Google Scholar] [CrossRef]
- Duranton, G.; Puga, D. Micro-foundations of urban agglomeration economies. Handb. Reg. Urban Econ. 2004, 4, 2063–2117. [Google Scholar]
- Meijers, E.J.; Burger, M.J. Spatial structure and productivity in US metropolitan areas. Environ. Plan. A 2010, 42, 1383–1402. [Google Scholar] [CrossRef]
- Huang, X.D.; Ma, H.T.; Miao, C.H. Connectivity characteristics for city networks in China based on innovative enterprises. Acta Geol. Sin. 2021, 76, 835–852. [Google Scholar]
- Feng, Z.J.; Cai, H.C.; Chen, Z.N.; Zhou, W. Influence of an interurban innovation network on the innovation capacity of China: A multiplex network perspective. Technol. Forecast. Soc. Change 2022, 180, 121651. [Google Scholar] [CrossRef]
- Alonso, W. Urban zero population growth. Dædalus J. Am. Acad. Arts Sci. 1973, 102, 191–206. [Google Scholar]
- Fu, W.F.; Luo, C.J.; Yan, M.D. Does urban agglomeration promote the development of Cities? Evidence from the urban network externalities. Sustainability 2023, 15, 9850. [Google Scholar] [CrossRef]
- Tobler, W. A computer movie simulating urban growth in the Detroit region. Econ. Geogr. 1970, 46, 234–240. [Google Scholar] [CrossRef]
- Burger, M.J.; Meijers, E.J. Agglomerations and the rise of urban network externalities. Pap. Reg. Sci. 2016, 95, 5–16. [Google Scholar] [CrossRef]
- Liu, K.; Xue, Y.T.; Chen, Z.F.; Miao, Y.; Shi, J.L. Economic spatial structure of China’s urban agglomerations: Regional differences, distribution dynamics, and convergence. Sustain. Cities Soc. 2022, 87, 104253. [Google Scholar] [CrossRef]
- Li, X.W.; Liu, X.; Huang, Y.C.; Li, J.R.; He, J.R. Theoretical framework for assessing construction enterprise green innovation efficiency and influencing factors: Evidence from China. Environ. Technol. Innov. 2023, 32, 103293. [Google Scholar] [CrossRef]
- Song, Z.G.; Tang, J.J.; Zeng, H.J.; Pang, F.Y. How urban-level credit expansion affects the quality of green innovation: Evidence from China. Sustainability 2024, 16, 1725. [Google Scholar] [CrossRef]
- Song, A.F.; Rasool, Z.; Nazar, R.; Anser, M.K. Towards a greener future: How green technology innovation and energy efficiency are transforming sustainability. Energy 2024, 290, 129891. [Google Scholar] [CrossRef]
- Zhang, G.S.; Ding, Z.W.; Zhao, M.; Wang, F.Z.; Ma, Q. Spatial variation and its influencing factors of economic density in CPER at county level. Econ. Geogr. 2014, 34, 19–26+39. [Google Scholar]
- Liang, C.Y.; Liu, X.Y.; Tavera, C. Environmental externalities of urban agglomeration in China: New evidence from the perspective of economic density. Singap. Econ. Rev. 2023, 1–25. [Google Scholar] [CrossRef]
- Arentze, T.; van den Berg, P.; Timmermans, H. Modeling social networks in geographic space: Approach and empirical application. Environ. Plan. A 2012, 44, 1101–1120. [Google Scholar] [CrossRef]
- Bai, C.Q.; Zhou, L.; Xia, M.L.; Feng, C. Analysis of the spatial association network structure of China’s transportation carbon emissions and its driving factors. J. Environ. Manag. 2020, 253, 109765. [Google Scholar] [CrossRef] [PubMed]
- Li, F.B.; Zhang, H.F.; Zhang, D.; Yan, H.Q. Structural diffusion model and urban green innovation efficiency-A hybrid study based on DEA-SBM, NCA, and fsQCA. Sustainability 2023, 15, 12705. [Google Scholar] [CrossRef]
- Chou, T.L.; Ching, C.H.; Fan, S.M.; Chang, J.Y. Global linkages, the Chinese high-tech community and industrial cluster development: The semiconductor industry in Wuxi, Jingsu. Urban Stud. 2011, 48, 3019–3042. [Google Scholar] [CrossRef]
- Li, H.Y.; Liu, Q.; Ye, H.Z. Digital development influencing mechanism on green innovation performance: A perspective of green innovation network. IEEE Access 2023, 11, 22490–22504. [Google Scholar] [CrossRef]
- Porter, M.E.; Linde, C. Toward a new conception of the environment: Competitiveness relationship. J. Econ. Perspect. 1995, 9, 97–118. [Google Scholar] [CrossRef]
- Dong, S.M.; Xue, Y.T.; Ren, G.X.; Liu, K. Urban green innovation efficiency in China: Spatiotemporal evolution and influencing factors. Land 2023, 12, 75. [Google Scholar] [CrossRef]
- Deng, H.H.; Yang, L.X. Haze governance, local competition and industrial green transformation. China Ind. Econ. 2019, 10, 118–136. [Google Scholar]
- Deng, Y.M.; Li, X.M.; Zhu, J.M. Effect of planning and construction of intercity railways on the economic development of the pearl river delta urban agglomeration: An analysis based on the spatial Durbin model. Sustainability 2024, 16, 738. [Google Scholar] [CrossRef]
- Qiao, W.Y.; Huang, X.J. The impact of land urbanization on ecosystem health in the Yangtze River Delta urban agglomerations, China. Cities 2022, 130, 103981. [Google Scholar] [CrossRef]
- Liu, K.; Xue, Y.T.; Chen, Z.F.; Miao, Y. The spatiotemporal evolution and influencing factors of urban green innovation in China. Sci. Total Environ. 2023, 857, 159426. [Google Scholar] [CrossRef] [PubMed]
- Duranton, G. Economics of agglomeration: Cities, industrial location and regional growth. Urban Stud. 2003, 40, 854–856. [Google Scholar]
- Niu, F.Q.; Jiang, Y.P. Economic sustainability of China’s growth from the perspective of its resource and environmental supply system: National scale modeling and policy analysis. J. Geogr. Sci. 2021, 31, 1171–1186. [Google Scholar] [CrossRef]
- Wang, X.H.; Yang, Y.Q.; Luo, X.Y.; Wen, T. The spatial correlation network and formation mechanism of China’s high-quality economic development. Acta Geol. Sin. 2022, 77, 1920–1936. [Google Scholar]
- Feldman, M.P.; Audretsch, D.B. Innovation in cities: Science-based diversity, specialization and localized competition. Eur. Econ. Rev. 1999, 42, 409–429. [Google Scholar] [CrossRef]
- Díez-Vial, I.; Belso-Martínez, J.A.; Gregorio, M.D.C. Extending green innovations across clusters: How can firms benefit most? Int. Reg. Sci. Rev. 2023, 46, 149–178. [Google Scholar] [CrossRef]
- Liu, S.C.; Wu, P.J. The impact of high-tech industrial agglomeration on China’s green innovation efficiency: A spatial econometric analysis. Front. Environ. Sci. 2023, 11, 1167918. [Google Scholar] [CrossRef]
- Yang, Y.Q.; Lu, X.Y.; Chen, J.; Li, N. Factor mobility, transportation network and green economic growth of the urban agglomeration. Environ. Sci. Pollut. Res. 2022, 12, 20094. [Google Scholar] [CrossRef] [PubMed]
- Wang, L.; Ye, W.Z.; Chen, L.M. Research on green innovation of the great Changsha-Zhuzhou-Xiangtan city group based on network. Land 2021, 10, 1198. [Google Scholar] [CrossRef]
- Nathan, M. Ethnic diversity and business performance: Which firms? Which cities? Environ. Plan. A 2016, 48, 2462–2483. [Google Scholar] [CrossRef]
- Qi, M.; Zhang, B.; Li, J.J.; Liu, B.F. The Three-dimensional analytical and governance logic of China’s digital divide bridging policy. Sustainability 2023, 15, 7220. [Google Scholar] [CrossRef]
Figure 1.
The spatial expression of AEs in Chinese cities in 2011 and 2021.
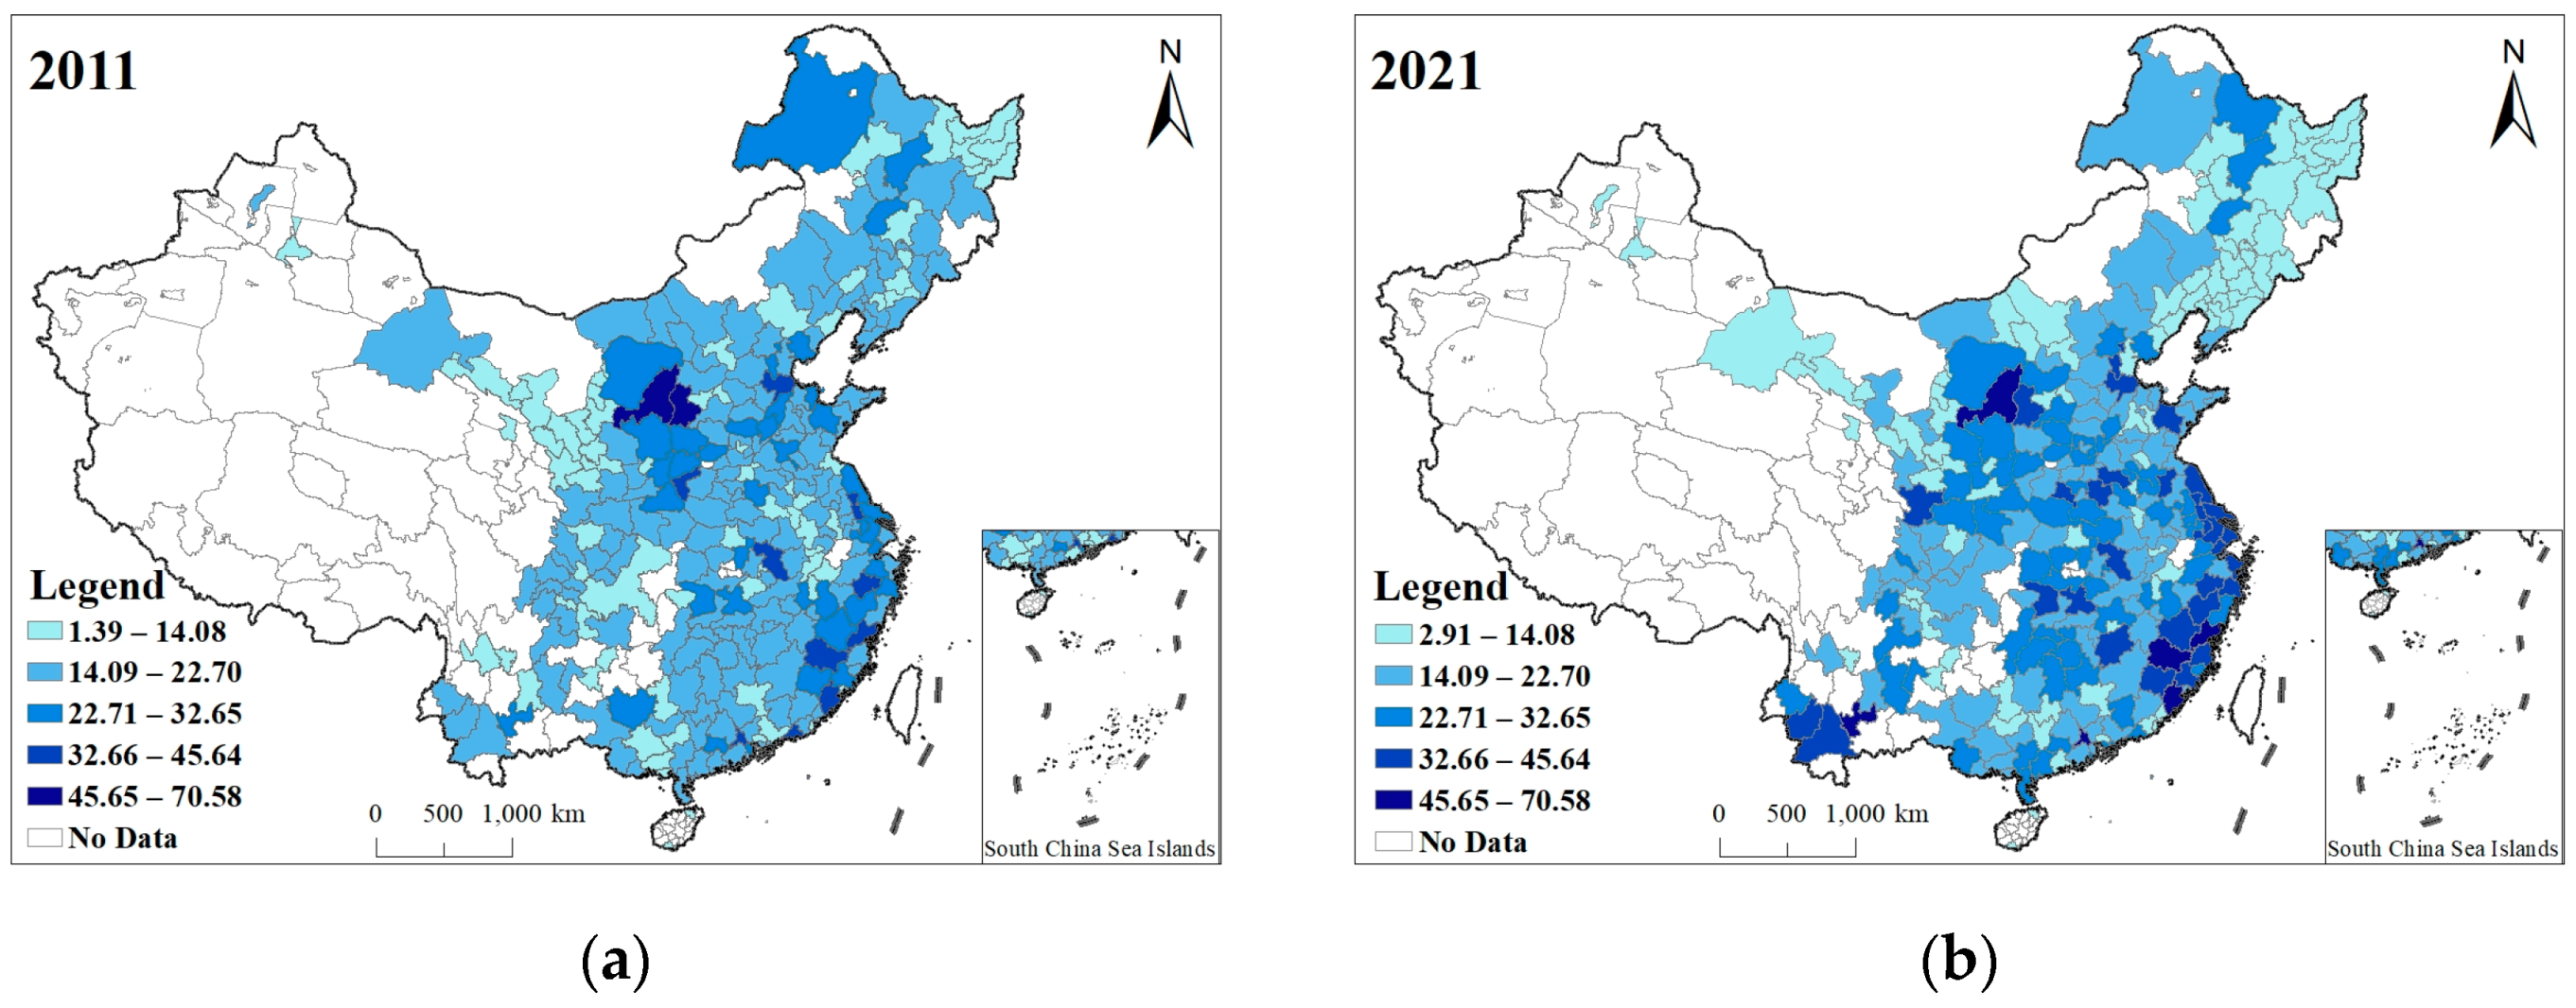
Figure 2.
The spatial expression of NEs in Chinese cities in 2011 and 2021.

Figure 3.
The spatial expression of GTI in Chinese cities in 2011 and 2021.


Table 1.
Descriptive statistics of the data.
| Name | Units | Size | Mean | Std. Dev. | Max. | Min. |
|---|---|---|---|---|---|---|
| Green patent (X) | PCS | 3113 | 596.09 | 1703.47 | 26,056.00 | 0 |
| AEs (Y1) | 100 million CNY/square kilometer | 3113 | 19.16 | 9.47 | 70.58 | 1.39 |
| Nes (Y2) | — | 3113 | 73.71 | 45.59 | 275.00 | 17.00 |
| Pgdp (Z1) | CNY 10,000 | 3113 | 54,641.85 | 33,492.33 | 256,877.00 | 6457.00 |
| Tertiary (Z2) | % | 3113 | 42.86 | 10.42 | 84.64 | 10.15 |
| RD (Z3) | Person/year | 3113 | 14,333.58 | 27,472.02 | 345,858.93 | 496.52 |
| Tech (Z4) | CNY 10,000 | 3113 | 124,423.29 | 404,010.16 | 6,118,019.15 | 771.00 |
| Environ (Z5) | % | 3113 | 0.27 | 1.33 | 35.10 | 0.000001 |
| Green (Z6) | % | 3113 | 40.13 | 5.80 | 82.32 | 6.75 |
Table 2.
The results of the regression.
| Variable | Coef. | Std. Err. | z | p > |z| | [95% Conf. Interval] | |
|---|---|---|---|---|---|---|
| Ln Y1 | −0.6141272 *** | 0.1898513 | −3.23 | 0.01 | −0.9862289 | −0.2420255 |
| sq Ln Y1 | 0.060033 * | 0.0338073 | 1.78 | 0.076 | −0.0062281 | 0.126294 |
| Ln Y2 | 0.2217026 *** | 0.0657502 | 3.37 | 0.01 | 0.0928346 | 0.3505707 |
| sq Ln Y2 | 0.077561 *** | 0.0099858 | 7.77 | 0.000 | 0.0579892 | 0.0971329 |
| Ln Z1 | 0.2019515 *** | 0.0554718 | 3.64 | 0.000 | 0.0932288 | 0.3106741 |
| Ln Z2 | 0.8195157 *** | 0.0711606 | 11.52 | 0.000 | 0.6800436 | 0.9589879 |
| Ln Z3 | 0.9905141 *** | 0.0468609 | 21.14 | 0.000 | 0.8986685 | 1.08236 |
| Ln Z4 | 0.0765685 *** | 0.0188129 | 4.07 | 0.000 | 0.0396958 | 0.1134412 |
| Z5 | 0.0108684 * | 0.0058804 | 1.85 | 0.065 | −0.000657 | 0.0223938 |
| Ln Z6 | 0.1656033 *** | 0.0560202 | 2.96 | 0.003 | 0.0558057 | 0.2754009 |
| W* Ln Y1 | 1.540577 *** | 0.2923329 | 5.27 | 0.000 | 0.9676154 | 2.113539 |
| W* Ln Y2 | 0.0383755 | 0.0993834 | 0.39 | 0.699 | −0.1564144 | 0.2331613 |
| _cons | −11.38657 | 0.8140973 | −13.99 | 0.000 | −12.98217 | −9.790967 |
Note: *, **, and *** represent p < 0.1, p < 0.05, and p < 0.01, respectively. The same also applies below.
Table 3.
The results of the robustness test.
| Variable | Coef. | Std. Err. | Z | p > |Z| | [95% Conf. Interval] | |
|---|---|---|---|---|---|---|
| Ln Y1 | −0.5526026 *** | 0.1386982 | −3.98 | 0.000 | −0.8244461 | −0.280759 |
| sq Ln Y1 | 0.0652718 *** | 0.0244637 | 2.67 | 0.008 | 0.0173239 | 0.1132198 |
| Ln Y2 | 0.4701083 * | 0.2694453 | 1.74 | 0.081 | −0.0579947 | 0.9982113 |
| sq Ln Y2 | 0.321144 *** | 0.0435038 | 7.38 | 0.000 | 0.2358718 | 0.4064099 |
| Ln Z1 | 0.216237 *** | 0.0558513 | 3.87 | 0.000 | 0.1067706 | 0.3257035 |
| Ln Z2 | 0.859301 *** | 0.0715998 | 12.00 | 0.000 | 0.718968 | 0.999634 |
| Ln Z3 | 0.9960589 *** | 0.0463767 | 21.48 | 0.000 | 0.9051623 | 1.086956 |
| Ln Z4 | 0.0805032 *** | 0.0188731 | 4.27 | 0.000 | 0.0435127 | 0.1174938 |
| Z5 | 0.0095607 | 0.0059127 | 1.62 | 0.106 | −0.002028 | 0.0211494 |
| Ln Z6 | 0.1426199 ** | 0.0561135 | 2.54 | 0.011 | 0.0326395 | 0.2526002 |
| W* Ln Y1 | 1.023703 *** | 0.2220545 | 4.61 | 0.000 | 0.5884837 | 1.458921 |
| W* Ln Y2 | 0.2834411 | 0.4238008 | 0.67 | 0.504 | −0.5471932 | 1.114075 |
| _cons | −12.55287 | 1.754625 | −7.15 | 0.000 | −15.99188 | −9.11387 |
Table 4.
The results of the heterogeneity test.
| Variable | Eastern Region | Central Region | Western Region | Northeastern Region |
|---|---|---|---|---|
| Ln Y1 | −0.704 (0.345) ** | −1.458 (0.504) *** | −1.006 (0.458) ** | 0.155 (0.354) |
| sq Ln Y1 | 0.103 (0.056) * | 0.190 (0.085) ** | 0.133 (0.084) | 0.104 (0.076) |
| Ln Y2 | 2.234 (0.356) *** | 0.312 (0.107) *** | 1.042 (0.246) *** | 0.695 (0.300) * |
| sq Ln Y2 | −0.200 (0.039) *** | 0.086 (0.015) *** | 0.190 (0.031) *** | 0.138 (0.041) *** |
| Ln Z1 | 0.090 (0.058) | 0.289 (0.081) *** | 0.167 (0.121) | −0.396 (0.173) ** |
| Ln Z2 | 1.051 (0.137) *** | −0.010 (0.070) | 0.118 (0.074) | 0.113 (0.112) |
| Ln Z3 | 0.706 (0.039) *** | 0.834 (0.084) *** | 0.665 (0.138) *** | 1.101 (0.144) *** |
| Ln Z4 | 0.185 (0.031) *** | 0.102 (0.035) ** | 0.035 (0.044) | 0.131 (0.038) *** |
| Z5 | 0.050 (0.025) ** | 0.003 (0.007) | 0.008 (0.012) | 0.016 (0.027) |
| Ln Z6 | 0.453 (0.108) *** | 0.085 (0.099) | −0.051 (0.108) | 0.405 (0.171) ** |
| W* Ln Y1 | 1.653 (0.585) *** | 5.077 (3.176) | 15.988 (3.44) *** | 3.032 (2.271) |
| W* Ln Y2 | 1.400 (0.629) ** | 0.164 (0.763) | −0.763 (1.109) | 3.829 (1.868) ** |
| _cons | −16.420 | −11.113 | −25.456 | −30.352 |
Disclaimer/Publisher’s Note: The statements, opinions and data contained in all publications are solely those of the individual author(s) and contributor(s) and not of MDPI and/or the editor(s). MDPI and/or the editor(s) disclaim responsibility for any injury to people or property resulting from any ideas, methods, instructions or products referred to in the content. |
© 2024 by the authors. Licensee MDPI, Basel, Switzerland. This article is an open access article distributed under the terms and conditions of the Creative Commons Attribution (CC BY) license (https://creativecommons.org/licenses/by/4.0/).
Share and Cite
MDPI and ACS Style
Dong, S.; Liu, K. Agglomeration Externalities vs. Network Externalities: Impact on Green Technology Innovation in 283 Chinese Cities. Sustainability 2024, 16, 3540. https://doi.org/10.3390/su16093540
AMA Style
Dong S, Liu K. Agglomeration Externalities vs. Network Externalities: Impact on Green Technology Innovation in 283 Chinese Cities. Sustainability. 2024; 16(9):3540. https://doi.org/10.3390/su16093540
Chicago/Turabian StyleDong, Shumin, and Kai Liu. 2024. "Agglomeration Externalities vs. Network Externalities: Impact on Green Technology Innovation in 283 Chinese Cities" Sustainability 16, no. 9: 3540. https://doi.org/10.3390/su16093540
Note that from the first issue of 2016, this journal uses article numbers instead of page numbers. See further details here.